1. Introduction
Multispectral platforms for remote sensing measurements make it possible to monitor crop health in real-time without affecting the crop and the environmental conditions. The concept of the speaking plant approach and plant response based on sensing could be a valuable source of information for better understanding, monitoring, and controlling the interaction between a microclimate and the physical conditions of plants, specifically in indoor farms with limited interaction with outdoor climate conditions. To minimize both acute and chronic productivity losses, early detection of plant stress is critical, especially in intensive production systems. Using non-contact and non-destructive techniques becomes more accessible and more advanced the provision of continuous monitoring of crop production and, at the same time, enables autonomous crop sensing and controlling practices on the farm.
This research project combined scientific knowledge from Aarhus University (Aarhus, Denmark) of remote sensing techniques with data analysis. It was made in collaboration with two Danish companies: Seasony, in Copenhagen Denmark, which specializes in autonomous robot technologies for indoor vertical farms, and CpHFarmHouse, a promising vertical farm in the Copenhagen region.
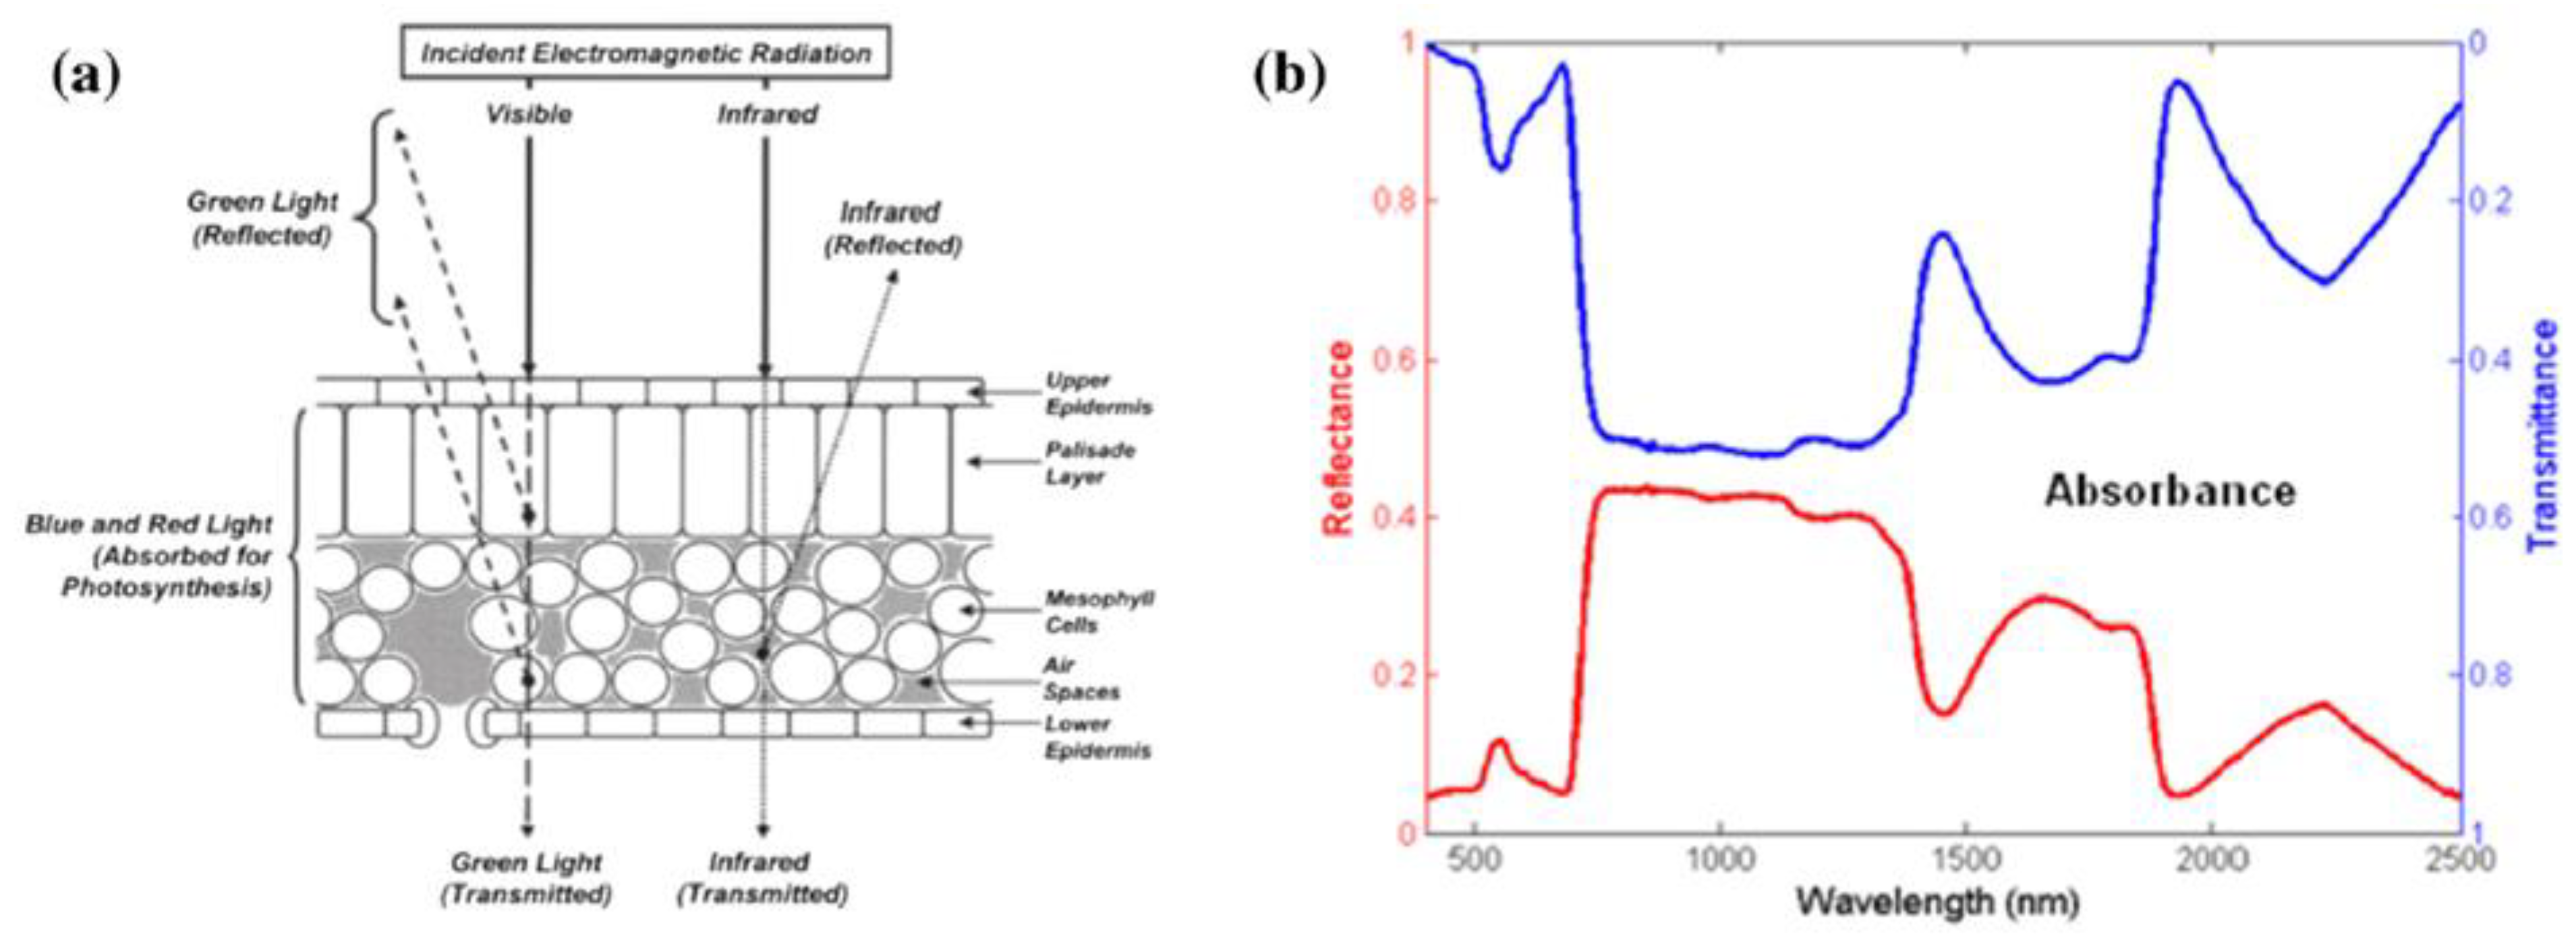
Despite the fact that plant leaves often look similar, they vary greatly in both shape and chemical composition in terms of the concentration of water and nutrients (e.g., nitrogen) in the leaf intercellular spaces. This results in a continuously varied plant reflectance outcome. Plant leaves absorb the majority of radiance in the visible part of the spectrum by means of leaf pigments in the mesophyll, such as chlorophyll and xanthophylls, and reflect mostly in the near-infrared (NIR) part of the spectrum (
Figure 1a). In addition, leaf spectra properties can be highly influenced by the water content inside the sponge cavities, by the available carbon content in different forms (such as sugar, starch, cellulose, and lignin) in the mesophyll as well as nutrient compounds (Nitrogen, Calcium, Potassium) in the cells of mesophyll. There is a plethora of authors [
1,
2,
3] who have reported that the different chemical and physical characteristics affect the optical properties of plant leaves (
Figure 1b).
When a plant is under water stress, which occurs when the water demand exceeds the water supply in the root zone or the plant cannot transport the absorbed water from the roots to the atmosphere, the photosynthetic rate is reduced due to the xanthophyll oxidation [
2]. As a result, the stomata close, causing a decreased CO
2 assimilation rate. Therefore, the light energy absorbed by the leaf cannot be used to fuel the photosynthetic electron transport; thus, part of the solar radiation returns to the atmosphere as reflectance radiation, while the rest part of the light energy dissipates in the form of heat or re-discharged as chlorophyll fluorescence. Apart from water stress, the photosynthetic rate and, consequently, the electromagnetic energy are also influenced by nutrient stress due to leaf absorbance. More specifically, nutrient compounds are drastically involved in photosynthesis as they affect the photosynthetic enzymes and chlorophylls.
Meanwhile, the high leaf absorption percentage of solar radiation in the visible range of the spectrum causes a rapid saturation of the reflected signal on a very small part of the canopy leaf area. These results decrease the reflectance light signal [
6], which is why numerous reflectance indices, or regions in the visible light spectrum, are highly dependent on ambient light.
The leaf liquid usually absorbs the radiation with wavelengths longer than 950 nm, while the leaf dry matter (carbon and nutrient compounds) absorbs the radiation at approximately 1000 nm. Furthermore, water and nutrient concentration affects plants’ reflectance in the spectrum range between 680–750 nm, while leaf water content significantly affects plants’ reflectance in the wavelengths between 750–800 nm.
Much research in the field of reflectance [
7,
8,
9,
10] has shown that when plants are under water or nutrient stress, their reflectance in the green and red parts of the spectrum is increased due to observed reduction in the leaf chlorophyll concentration (less absorbance radiation). Other studies [
11,
12] have reported that the reflectance of stressed plants is enhanced in the NIR part of the spectrum due to the scattering effect of the radiation by the raised air content in the sponge cavities indicating the plants’ reduced water content. Furthermore, Penuelas et al. [
13] observed that when the plant was close to wilting, there was a major reduction in the scale of the whole reflectance in the NIR region of stressed plants. During measurements, leaf spectral responses can be significantly influenced by other parameters such as leaf thickness, leaf age, leaf angle, leaf area index (LAI), and plant species, more than water stress.
According to Köksal et al. [
14], based on an initial derivative analysis, certain sections of the light spectrum can be selected for additional research. Thus, in order to enhance the detected differences in the spectral analysis and provide further insights for the detection of stress conditions, numerous authors have examined and proposed a combination of the selected data from spectral bands with indices. More than 130 vegetation indices (VIs) have been studied and analyzed. However, only a small part of these has a considerable biophysical base or have been methodically examined under water and nitrogen stress. Additionally, more than 20 VIs are based on the visible part of the spectrum and NIR region. According to Aparicio et al. [
15] and Zakaluk & Ranjan [
16], the most widely used formulas of reflectance indices are the following:
Reflectance ratios, which are developed as the ratio of two spectral bands and are referred to as simple ratio (SR) vegetation indices.
Normalized difference vegetation index (NDVI), is defined as ratios of the difference in reflectance between two spectral bands and the sum of the reflectance at the same bands.
Reflectance evolution recorded in the visible and near-Infrared (NIR) parts of the spectrum can, among other things, correlate with chlorophyll degradation performed in the leaf due to nitrogen stress deficiency. In addition, spectral analysis can provide significant detection signals from water-stressed plants via analysis of reflectance indices that combine data from two or more spectral bands and are not simultaneously affected by climatic conditions and light radiation, providing meaningful and detailed information on plant water status.
Based on the available reflectance measurements, the indices presented in
Table 1 (according to the relevant list compiled by Katsoulas [
2]) were calculated and evaluated to explore their relationship with plant water and nitrogen deficiency. In addition, the reflectance data were smoothed and derived using a three-point weighted mean based on derivative analysis following Köksal [
17].
The key VIs for assessing water and nitrogen deficiency in this research project are presented in the following table.
Where NIR is the near-infrared radiation, RED is the radiation in the red part of the spectrum, R531 is the radiation in the 531 nm, and R570 is the radiation in the 570 nm.
This work studies commonly used reflectance indices and spectral regions in multispectral reflectance system techniques that can be applied for early water and nitrogen stress detection under indoor environmental conditions with artificial light sources. The efficiency of spectral indices in detecting water and nitrogen is benchmarked with direct and indirect plant physiological measurements, such as leaf chlorophyll content, photosynthetic efficiency, stomatal conductance, substrate water content, and electrical conductivity. This research aims to develop a methodology that can be used extensively by vertical farms characterized by increased labor costs for monitoring, crop maintenance, and processing. Additionally, the examined method combines robotic means and image vision data, providing higher autonomy in data collection processes of irrigation and fertilization inside vertical farms and targets to maximize decision-making processes based on real-time crop reflectance data and simplified reflectance indices. To expand it further, data collection of this research by precise methods can lead to prediction methodologies based on vision and advanced sensing equipment based on the physiological development of crops. Under this scope, it becomes possible to develop and optimize predictive models from plant production measurements only based on automated generated data. Furthermore, this study discovers and presents the relationships between vision and image data and more in-depth parameters in plants’ physiology, such as chlorophyll, photosynthetic efficiency, stomatal conductance, as well as nutrient and water deficiencies. Modeling and remote sensing data inputs inside vertical farms with predictive models could optimize the environmental footprint of indoor horticulture, contributing significantly to important improvements in the environmental impact of indoor food production.
2. Materials and Methods
2.1. Experimental Design
The experiment was carried out in September 2021 in the vertical farming setup of CpHFarmHouse, Copenhagen, Denmark (a partner in the Food & Bio Cluster research project) with a growth area of 4 m
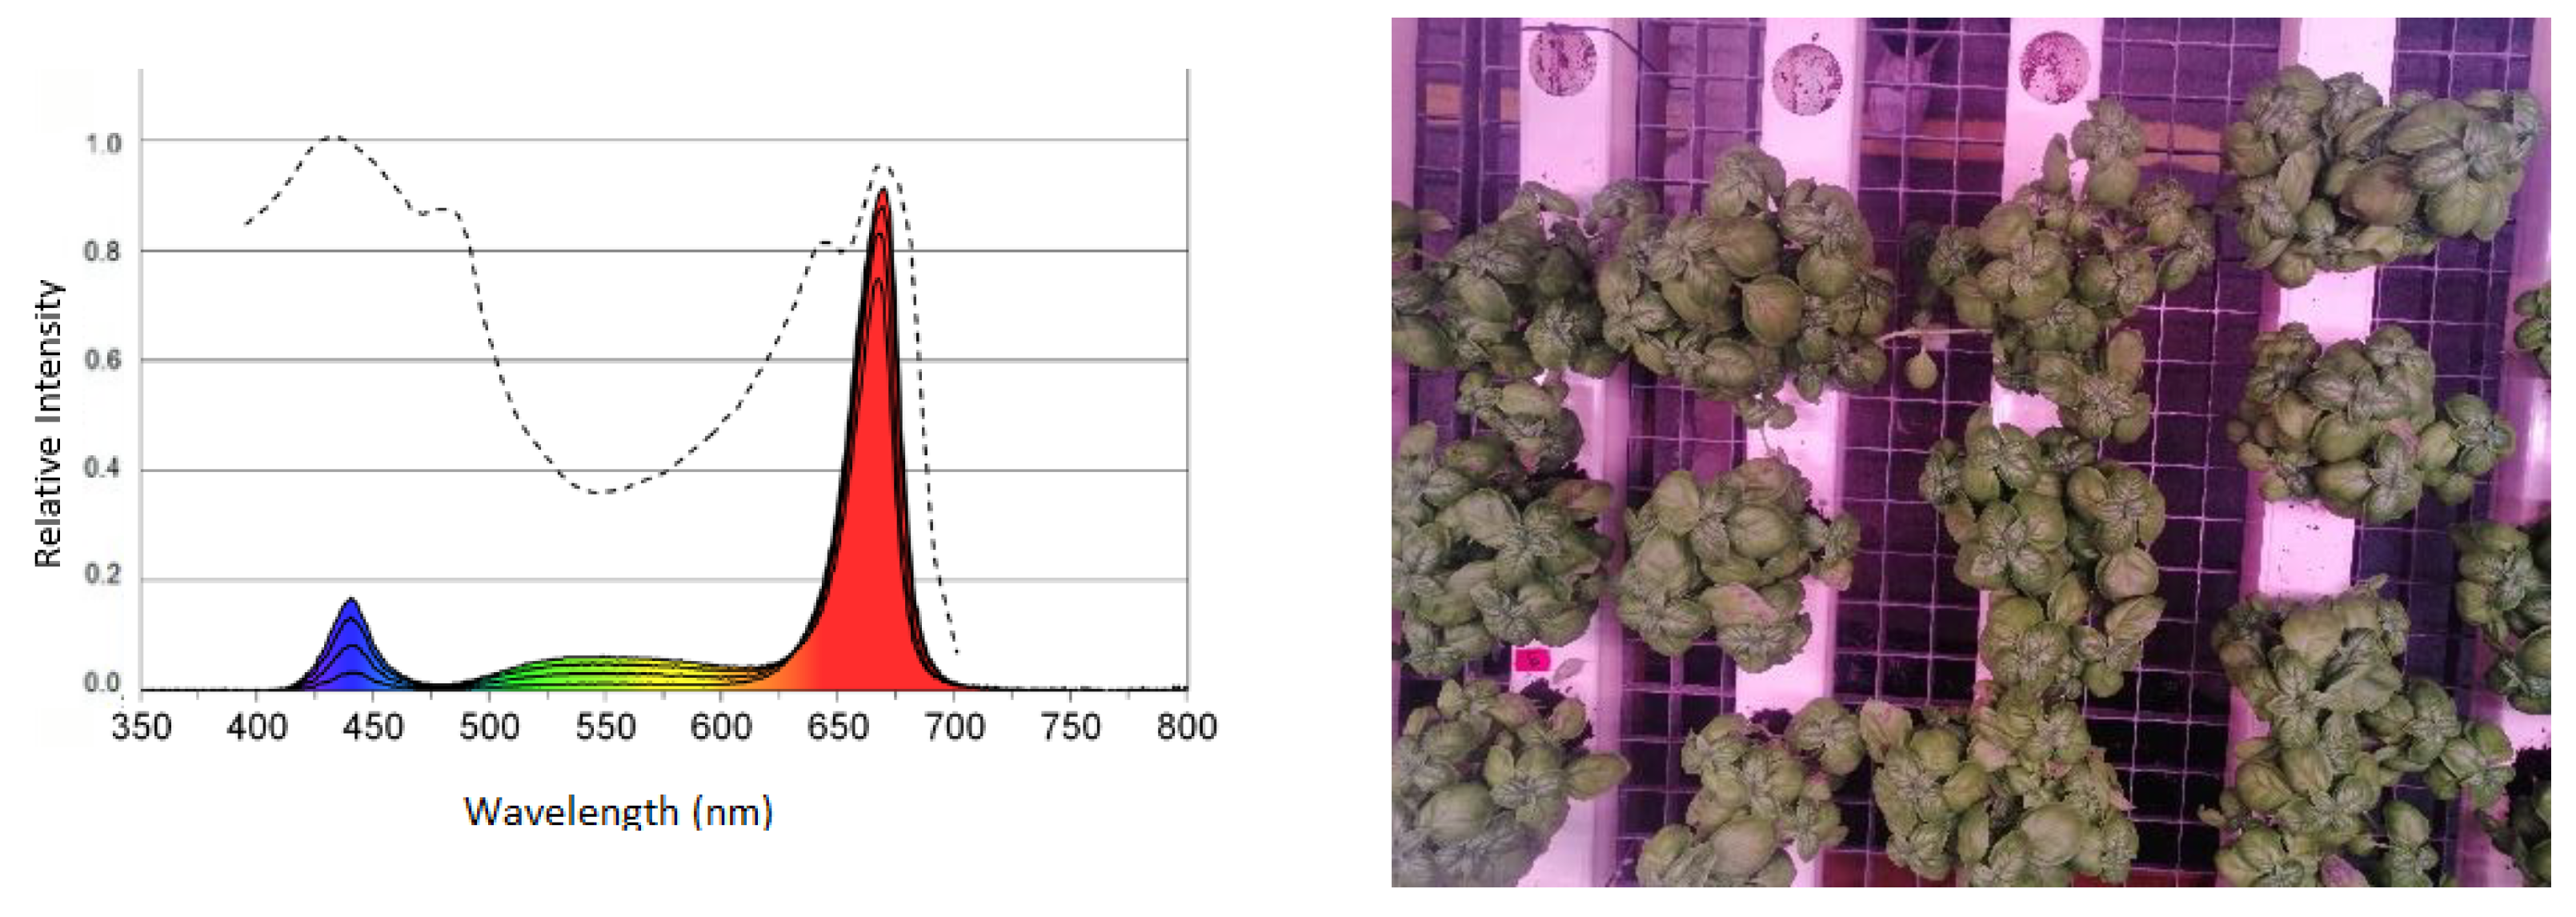
2 (1.5 m × 2.5 m). The air temperature and the relative humidity were set at 25 °C and 75–80%, respectively. Lighting conditions remained stable throughout the experiment for the three treatment groups (see a description of the groups below). The light intensity was set at 130 PPFD (μmol/m
2 s) for all the different examination treatments using an LED unit (Senmatic model: FL100 Grow White Fixture, v1.2, Søndersø, Denmark). The spectral distribution (i.e., light quality) of light emitted from the LED was 6% blue (450 nm), 9% white, and 85% red (600–700 nm) (see
Figure 2, left). The optimal photoperiod for basil was selected according to previously published work, namely at 16 h of light and 8 h of darkness per day [
20,
21].
The species chosen was Genovese basil (
Ocimum basilicum), grown in the soil inside a white plastic tube (see
Figure 2, right). Three groups of plants (8 plants in each group) were formed; each group was treated differently. All plants were three weeks old at the beginning of the experiment. CphFarmHouse provided a nutrient solution (with a net weight of 1.25 kg) composed by 4% nitrogen, 4.15% potassium and 0.3% sulphur. The samples for data collection of manual and automatic measurements were the young and fully developed plant leaves.
Three treatments were applied over an experimental period of seven days to study the effects of irrigation and water deficiencies on crop reflectance characteristics, mimicking previously published methodologies in international scientific journals [
1,
2,
3,
23]. Specifically, the first treatment with constant and stable irrigation and nutrient supply (control), one treatment with limited irrigation, and one treatment with limited nitrogen. More analytically, the three treatment groups are explained below.
In the first treatment group, the plants were not exposed to water or nitrogen stress. Plants grew with 100% coverage of the optimal water and nutrient demand. A nutrient dilution of 1 to 100 with 0.5 L per gutter was provided daily throughout the experiment.
In the second treatment group, the daily irrigation was reduced by 50% compared to the control treatment a week after the transplant of the plants into the cultivation area of the experiment, and the stress was applied for all the experimental days. The number of nutrients remained stable at all control levels during the experiment. A nutrient dilution of 1 to 100 with 0.5 L per gutter was provided on each experimental day.
In the third treatment group, the nitrogen solution was reduced by 50% compared to the control treatment a week after the transplant of the plants into the cultivation area of the experiment, and the stress was applied for all the experimental days. The irrigation water was stable throughout the entire experiment. A nutrient dilution of 1 to 200 with 0.5 L per gutter per day was provided for five days.
2.2. Measurements
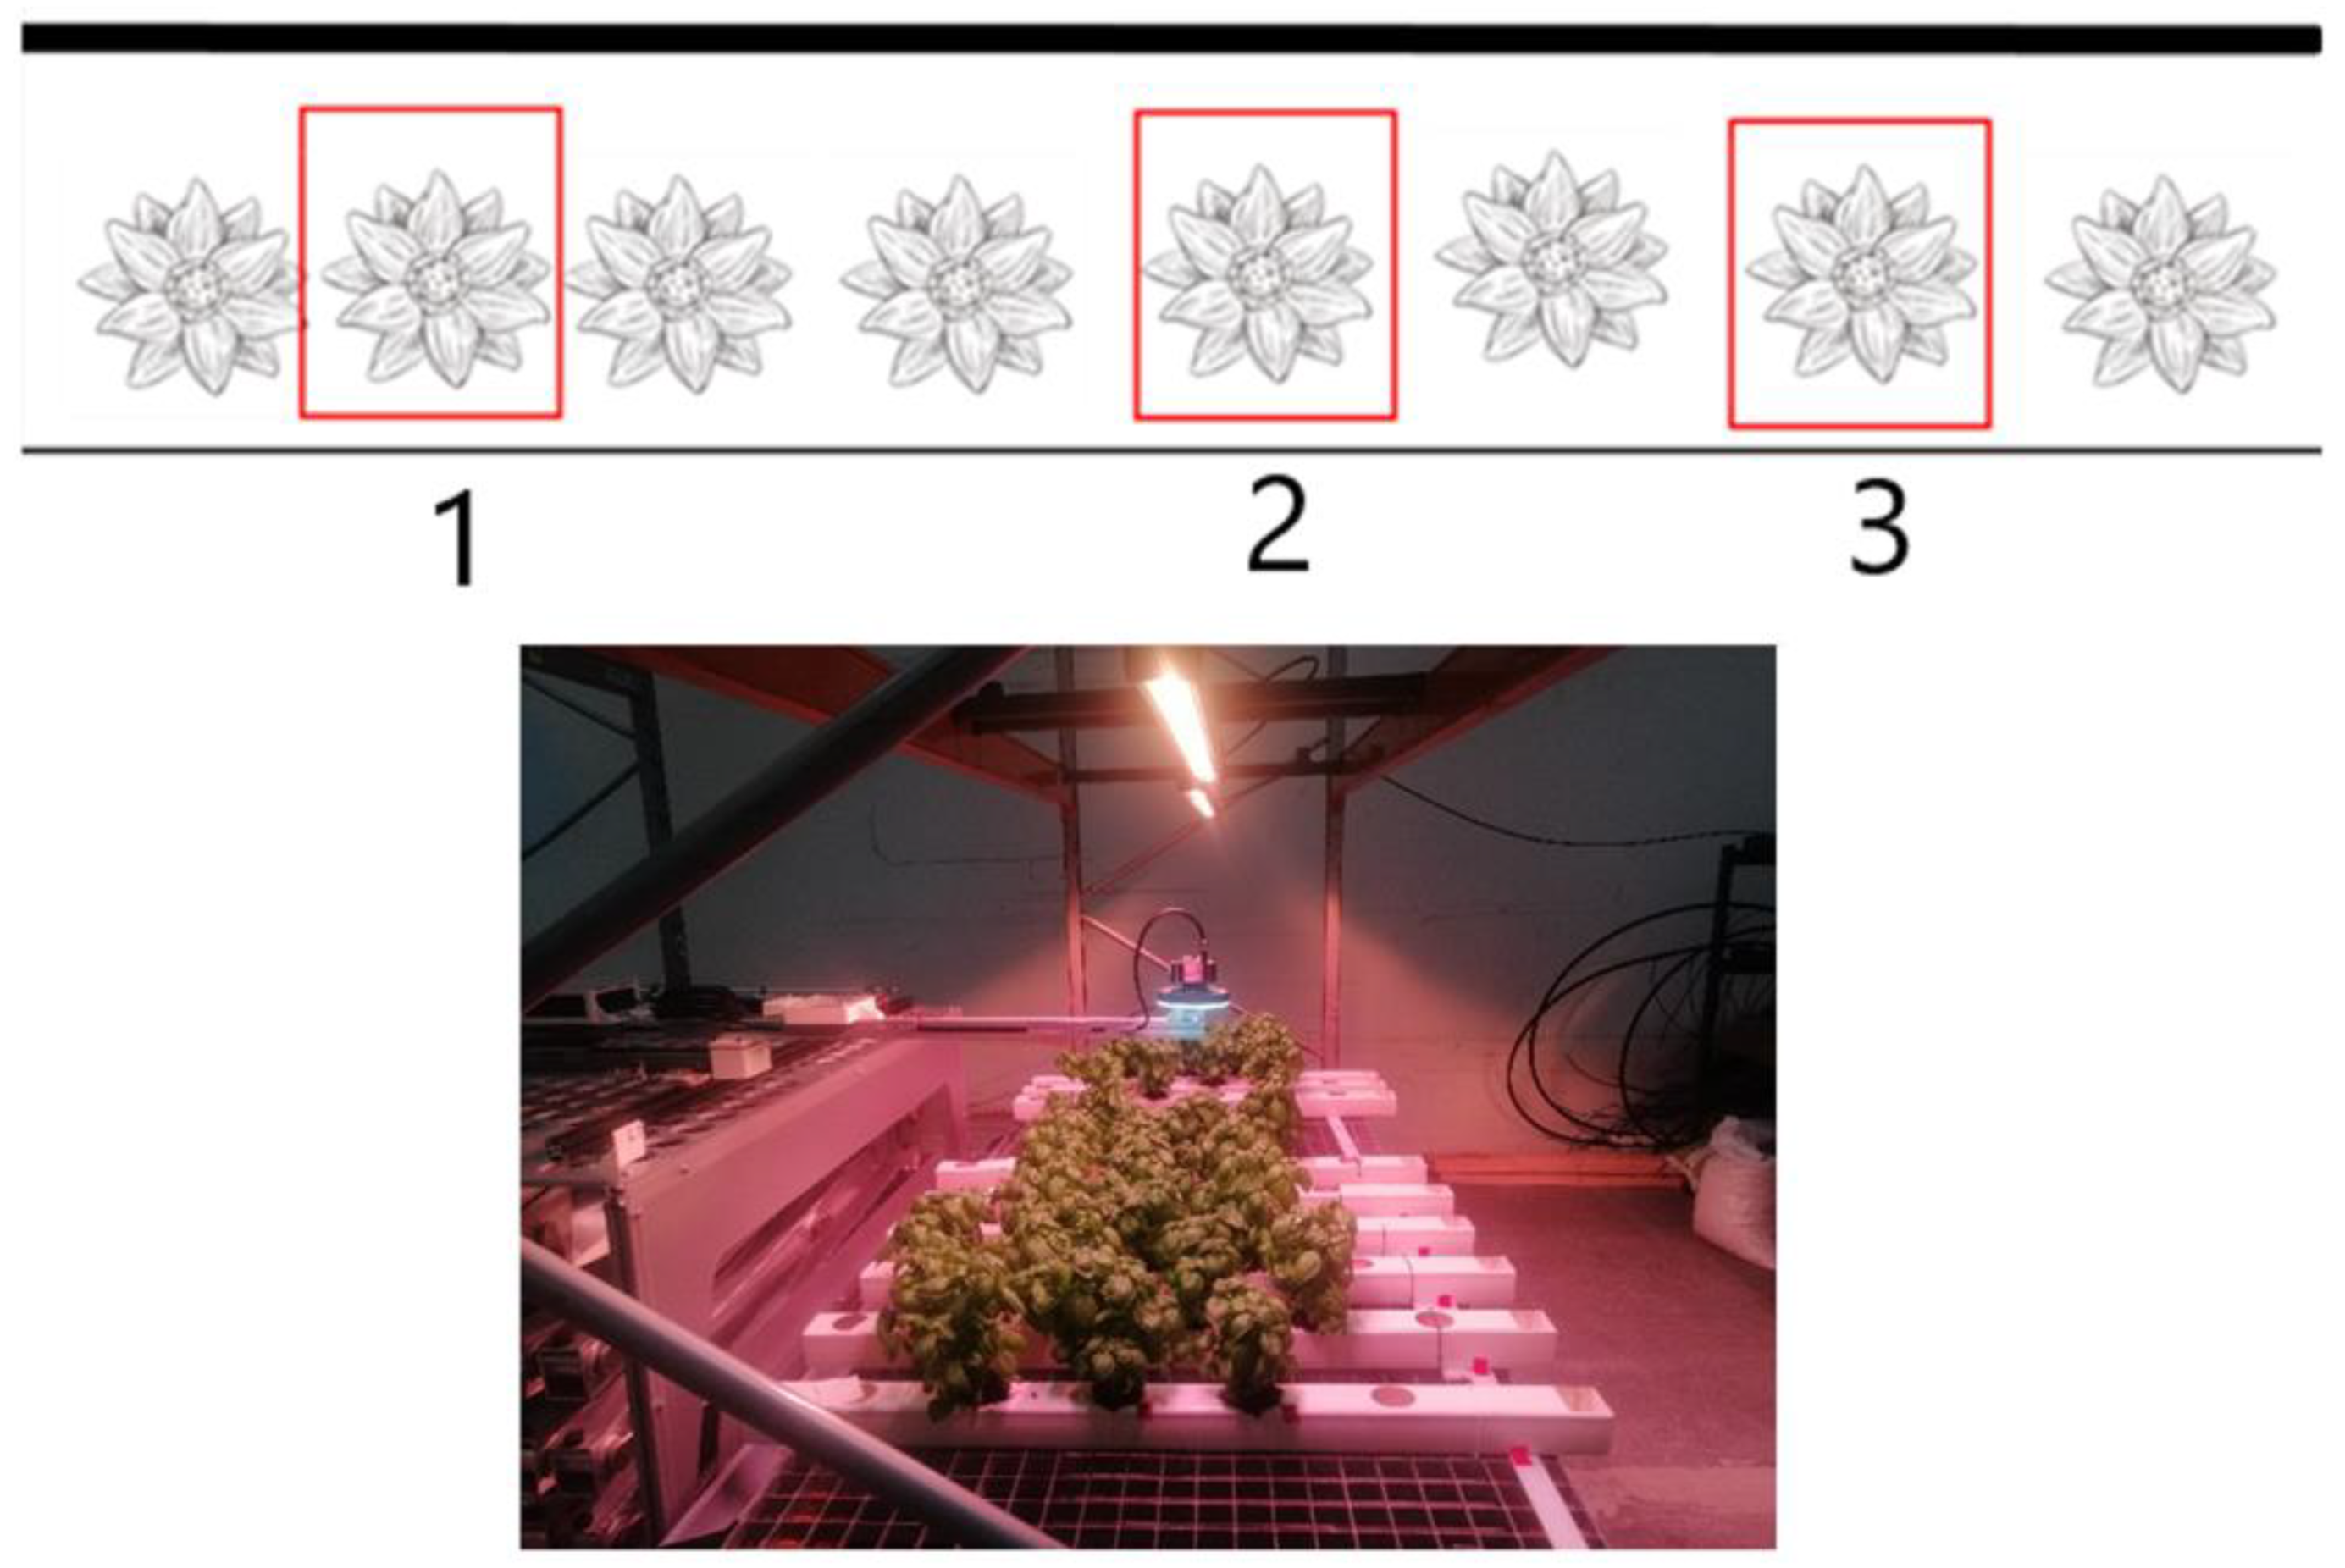
A CMS-V multispectral camera (Silios, Peynier, France) with a fixed focal length lens adapted to the CMS series camera was used to collect multispectral images. The camera was attached to a robotic hand on the autonomous robot “Watney,” developed by Seasony (Copenhagen, Denmark). With high-position precision, “Watney” scanned and took images from the three positions of each treatment, in a few seconds. Before each image collection session, a camera calibration was conducted, followed by recording three images per treatment in the following order: control (treatment A), water (treatment B), and nitrogen (treatment C). The camera was calibrated using a dark and a white reference image. For the dark image, the lens was covered by the lens shutter, while for the white image, a white reflective-diffusive surface was placed in front of the lens. The lens was 50 cm from the growth tubes and approximately 30 cm from the top of the canopy. Imaging sessions were conducted at 10:00, 12:00, and 14:00 every day, and sets of three images per treatment group were captured (in total, nine images per treatment per day).
Manual measurements were performed on all treatments for six continuous days, while images were automatically recorded in the three examination positions (1–3) of each group, as they are illustrated in
Figure 3 (top).
To measure the temperature of the substrate, water cotent (VW%) and the electric conductivity (EC), the WET-2 Sensor (Delta-T Devices, Burwell, UK) with sensor error ± 10 m S × m−1 was used. Measurements of photosynthesis and chlorophyll were made manually every day at 10.00, 12.00, and 14.00. For chlorophyll content measurements of the plants, the portable chlorophyll sensor CCM-200 plus (OPTI-Sciences, Inc., Hudson, NH, USA) was used to provide chlorophyll content data based on the absorbance of the plants at 653 nm and 931 nm (sensor error ± 0.1 SPAD unit). The sensor LCpro-SD gas exchange sensor (ADC Bioscientific Ltd., Hoddesdon, UK) (sensor error 0.1 °C) was used to collect data on photosynthetic efficiency, stomatal conductance data, and transpiration rate. The sensor was calibrated directly before the experiment.
2.3. Data Analysis of Multispectral Images
Multispectral imaging provides visual information on the spectral and spatial domains, respectively. The multispectral camera with selected optical band filters provided several spectral characteristics of the basil plants studied in this research. The response of the reflectance intensity of the plants was sensitive to the wavelength of the filter. The characteristics of the plants were analyzed at eight different wavelengths (542, 582, 619, 661, 700, 742, 780, and 822 nm) with 10 nm bandwidth according to the selected spectral indices.
Image processing and data analysis were performed using OpenCV and Python Software Foundation (Van Rossum, G., & Drake, F. L., Python Language Reference, version 3.6. CA, USA). Each acquired image of the plant was 426 × 339 pixels in resolution, and all images were initially calibrated using black-and-white images collected at the beginning of each measurement session with the following equation:
where R is the converted relative reflectance image, I is the raw spectral image, D is the current dark image, and W is the white reflectance image [
24].
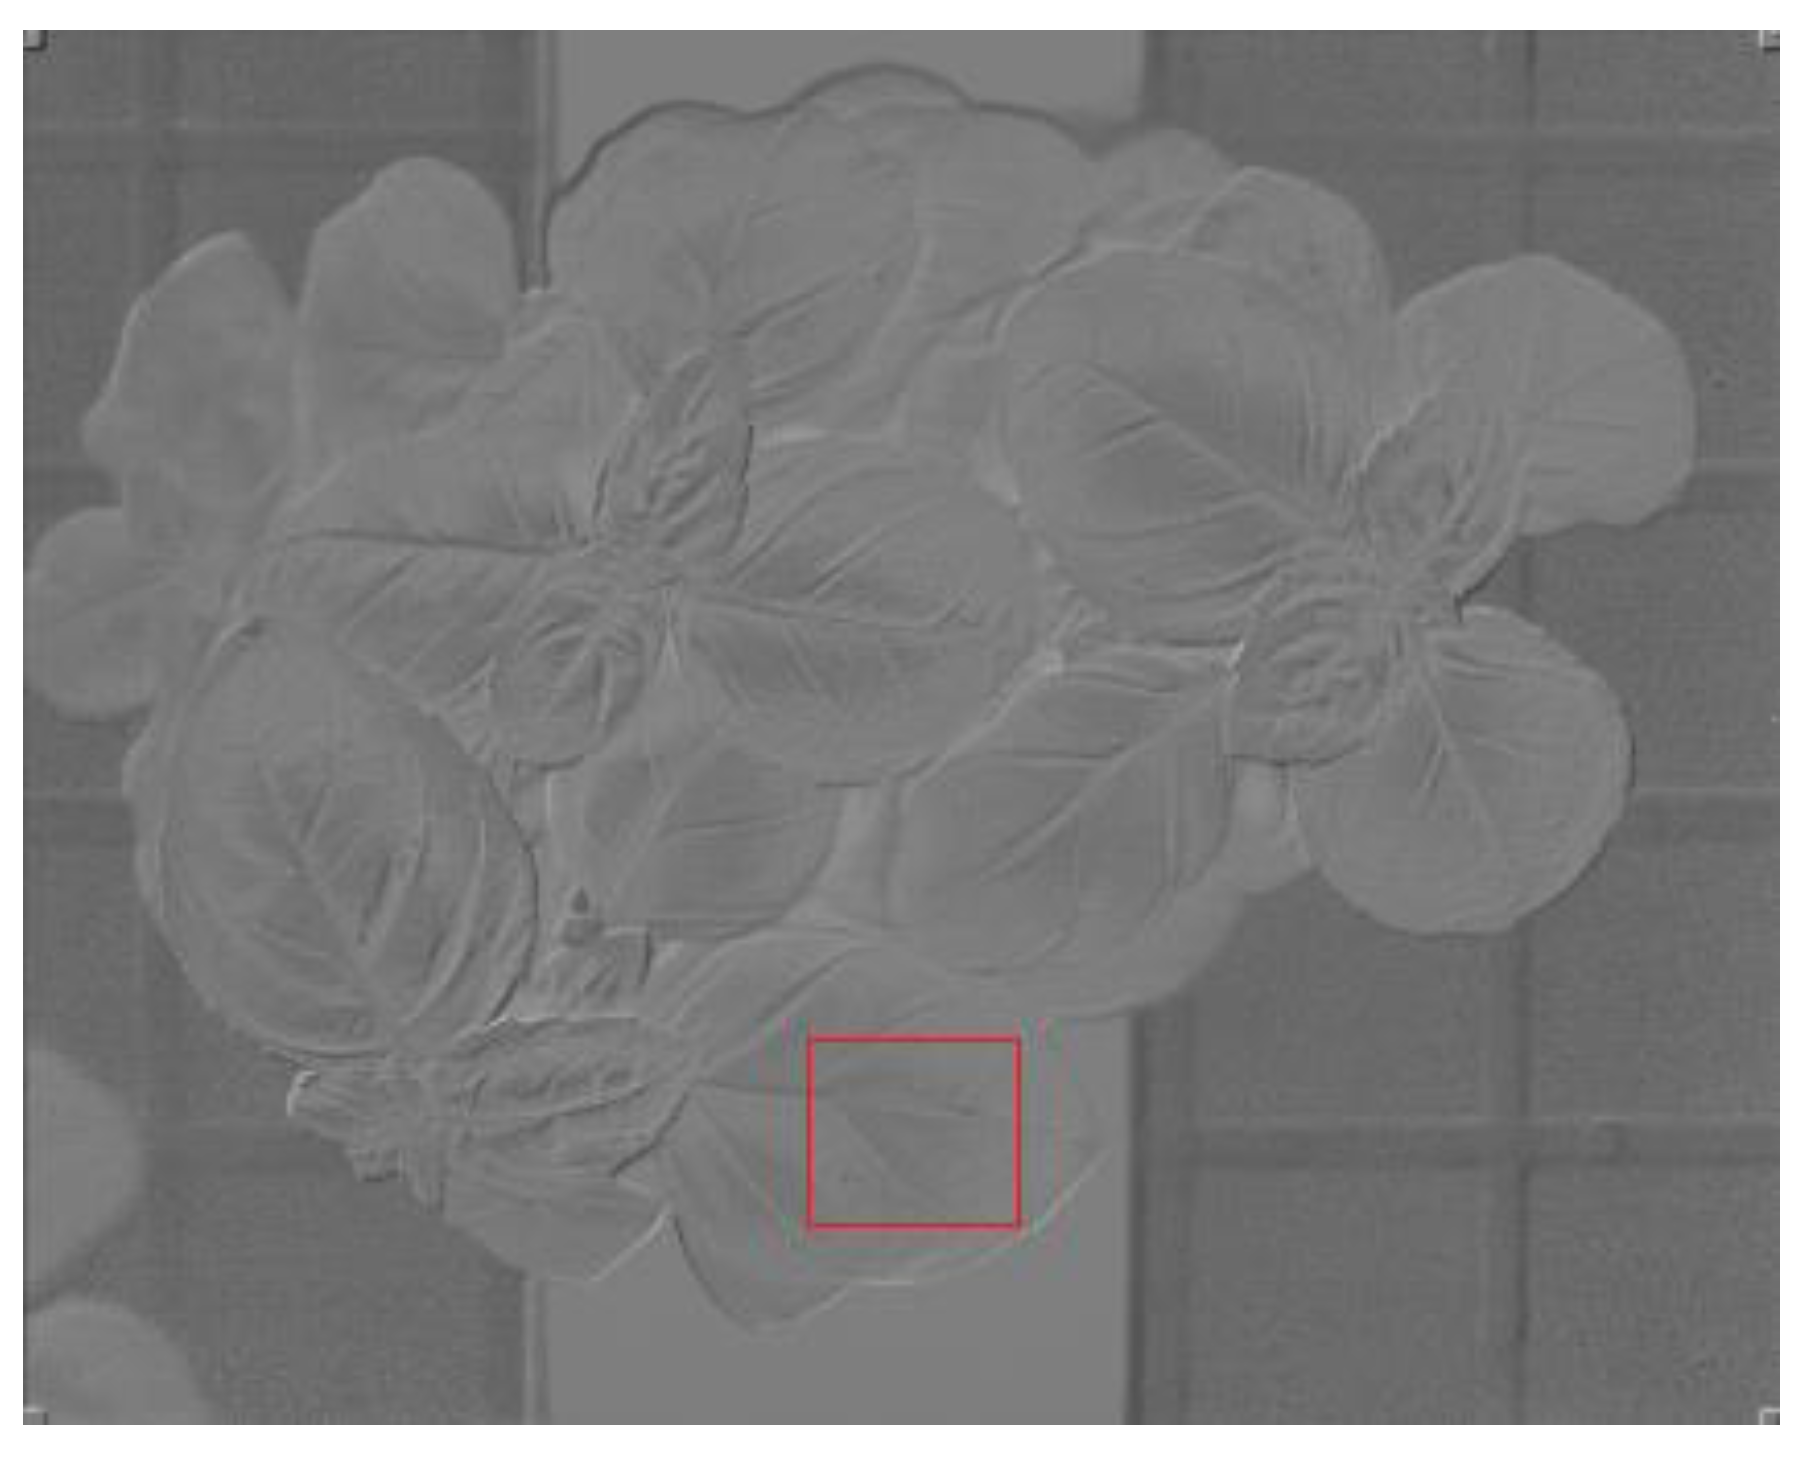
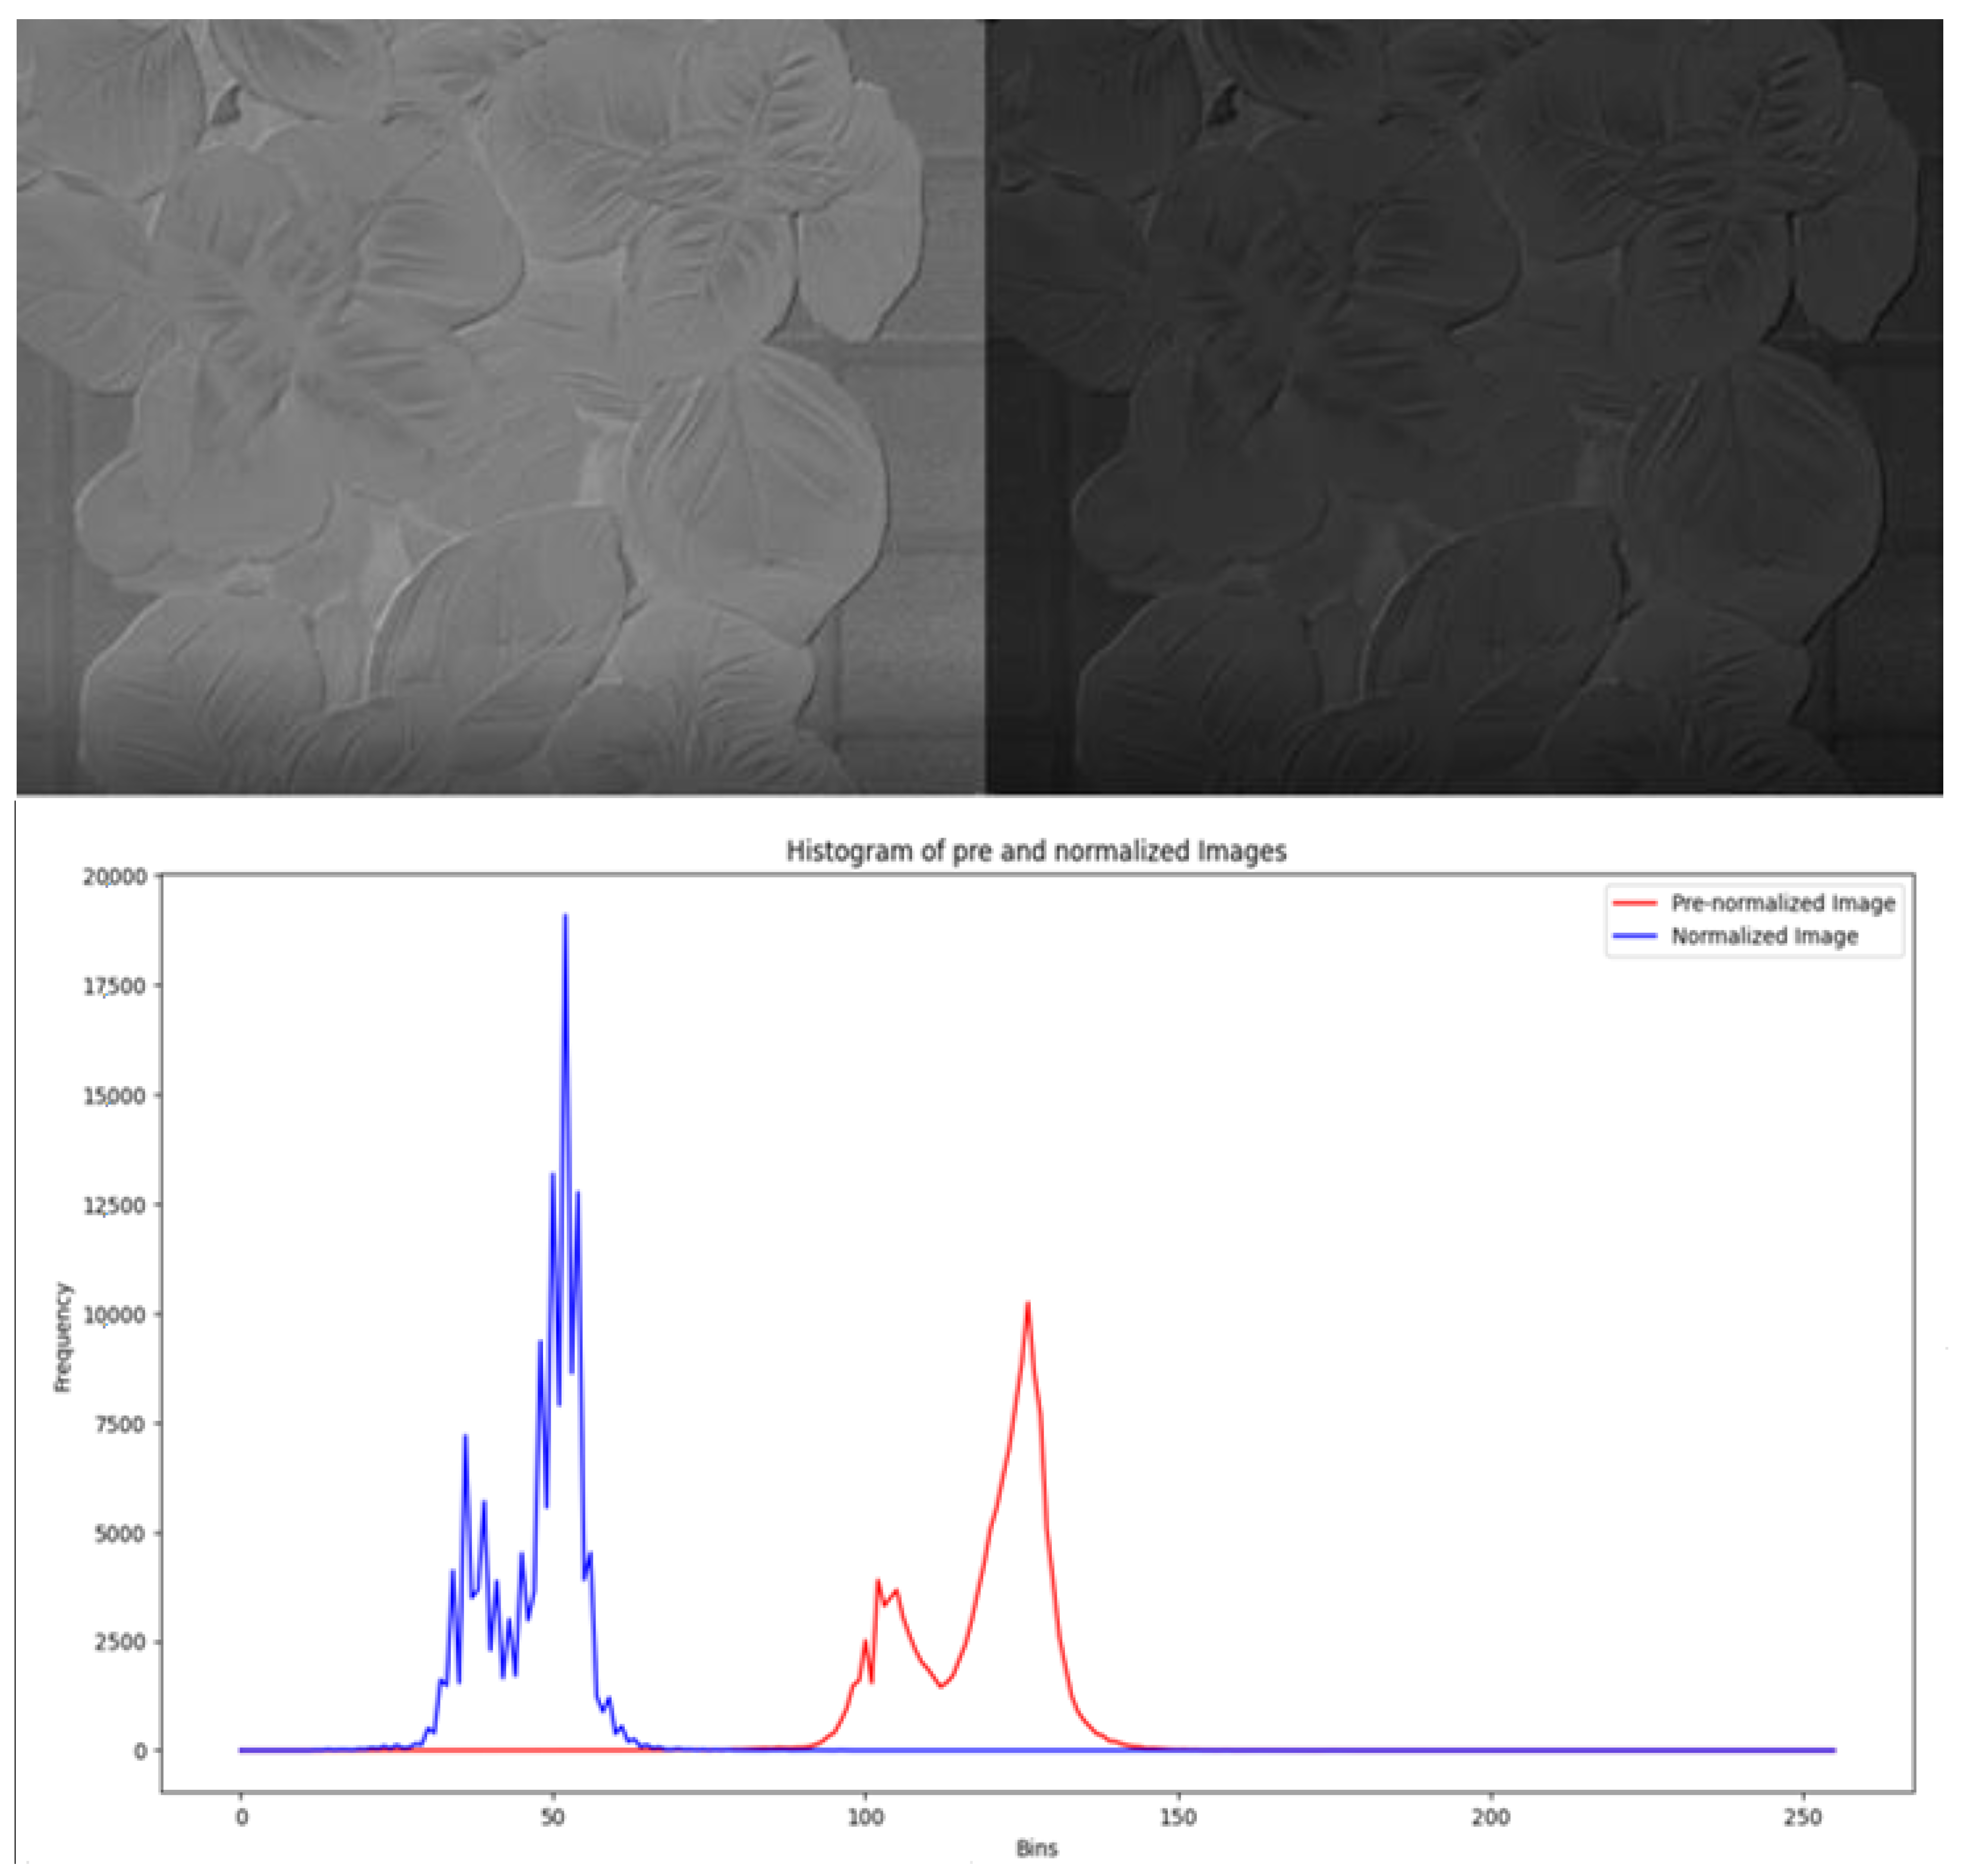
Since all images were prone to noise due to light variation, a normalization method was used in order to create a consistent and comparable grayscale image dataset. For every image in the dataset, a manually selected image patch was selected that targeted the leaf area (
Figure 4).
For every image patch, the least white pixel area was calculated, which was further used as the upper white value, and zero was used as the black limit in the normalization method.
Consequently, all images were processed for normalization in order to change the range of pixel intensity values, create a consistent and comparable dynamic range of light exposure for the set of grayscale images and avoid visual noise (
Figure 5). On the set of grayscale images, linear normalization was performed according to the following formula:
where,
IN is the new image: {X
Rn} → {
newMin, …,
newMax} with intensity values in the range (0, maxWhite) [
25].
For each position of image collection, two image patches were selected from the leaf samples for further analysis according to the reflectance indices.
Table 2 presents the data matrix and measurement times for each experiment day.
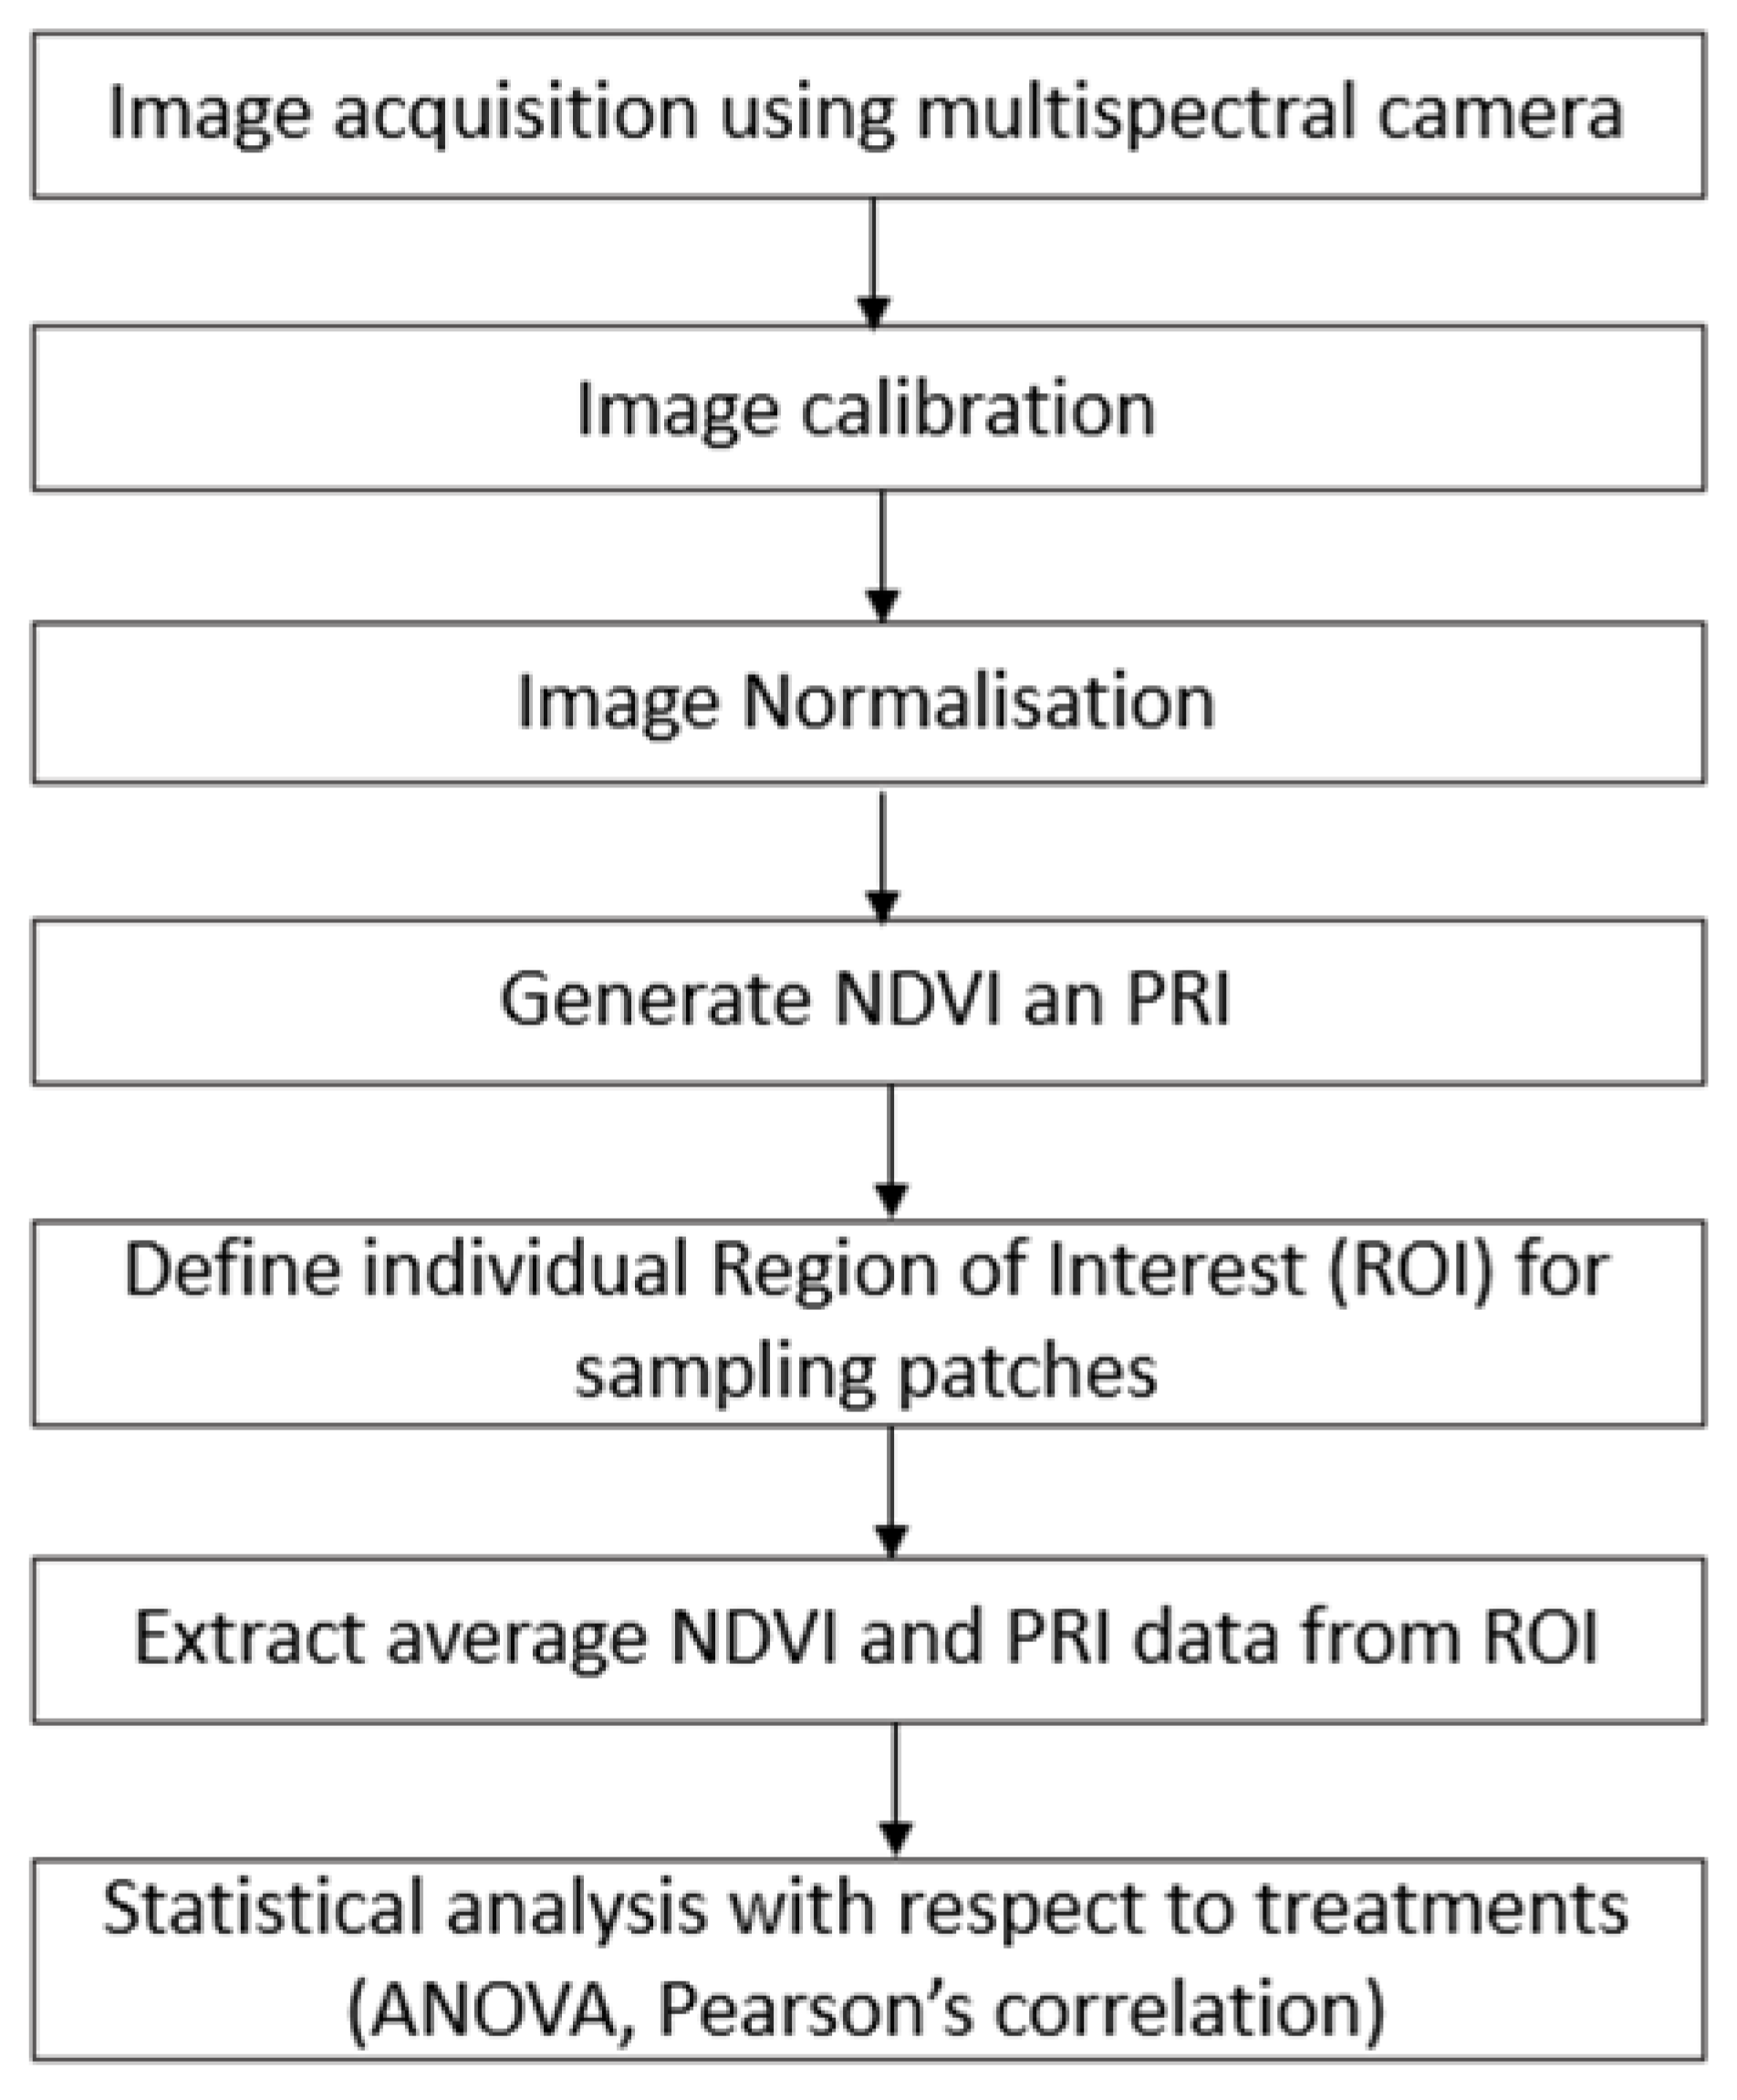
2.4. Statistical Analysis
Statistical analysis was performed for a comparison of the mean values by applying one-way ANOVA with a confidence level of 95% (p < 0.05) using the SPSS (Statistical Package for the Social Sciences, IBM, Armonk, NY, USA). To compare the reflectance values between the treatments, reflectance data were divided into eight groups (eight different band spectrums derived from the multispectral camera). One-way ANOVA and post-hoc analysis were used to compare the daily mean values of the reflectance indices between the treatments.
Additionally, linear regression was performed between the examined reflectance indices and some abiotic parameters. N is used to designate the sample size of each parameter, i.e., the number of samples. Pearson’s correlation was also performed between the reflectance indices and the physiological measurements of the plants to identify potential correlations.
Figure 6 summarizes the data handling actions as well as the processes for data handling and mining to find patterns and correlations within this large data set.
3. Results
This section presents the data collection results of various physiological parameters and the multispectral grayscale images of the basil crops during the experiment. The data were tested using a one-way ANOVA to compare the mean values of the stressed plant samples with the control plants and study the differences in the means between the samples at a = 0.05. In the one-way ANOVA test, F expresses the distribution of data at N-k degrees of freedom (df) at the significance of the test (p-value) a = 0.05, where df1 describes the degrees of freedom between the groups and df2 the degrees of freedom within the groups. In the text, it is described by the following format: F (df1, df2) = Fstat, p = 0.05 significance value. Subsequently, a post hoc analysis was performed to reveal statistically significant differences between the groups. Additionally, M expresses the mean values and SD the standard deviation.
3.1. Data from Multispectral Camera
A one-way ANOVA was conducted to compare the effect of deficiencies on the reflectance of basil (i.e., NDVI and PRI) between the control group and the two stress treatments (i.e., Control, Nitrogen, Water).
Table 3 shows a one-way ANOVA performed on the mean values of the three groups for two investigated patches and their reflectance indices (i.e., NDVI and PRI). The results of PATCH1 reveal that the mean value of the control group for NDVI (M = 43.5, SD = 4.3, N = 51) and PRI (M = 47.6, SD = 3, N = 51) is higher than the mean values of the nitrogen (NDVI = 38.4 ± 3.2 and PRI = 45.1 ± 3.3) and water treatments (NDVI = 39.6 ± 3.6 and PRI = 46.3 ± 3.4). Moreover, a one-way ANOVA showed statistically significant differences between the three treatments for NDVI and PRI. Simultaneously, PATCH2 showed higher mean values of the control group (NDVI = 42.6 ± 4.3 and PRI = 46.6 ± 3) compared to the nitrogen (NDVI = 39.4 ± 3.8 and PRI = 44.7 ± 3) and water treatments (NDVI = 38.9 ± 4.1 and PRI = 45.4 ± 3.7). A one-way ANOVA again showed statistically significant differences between the control group as well as the two stress treatments in both reflectance indices. Thus, PATCH1 and PATCH2 showed a significant effect of water and nitrogen deficiencies with the use of NDVI and PRI at the
p < 0.05 between the control and the two stress treatments. The results of the statistical analysis (one-way ANOVA) are presented in
Table 3.
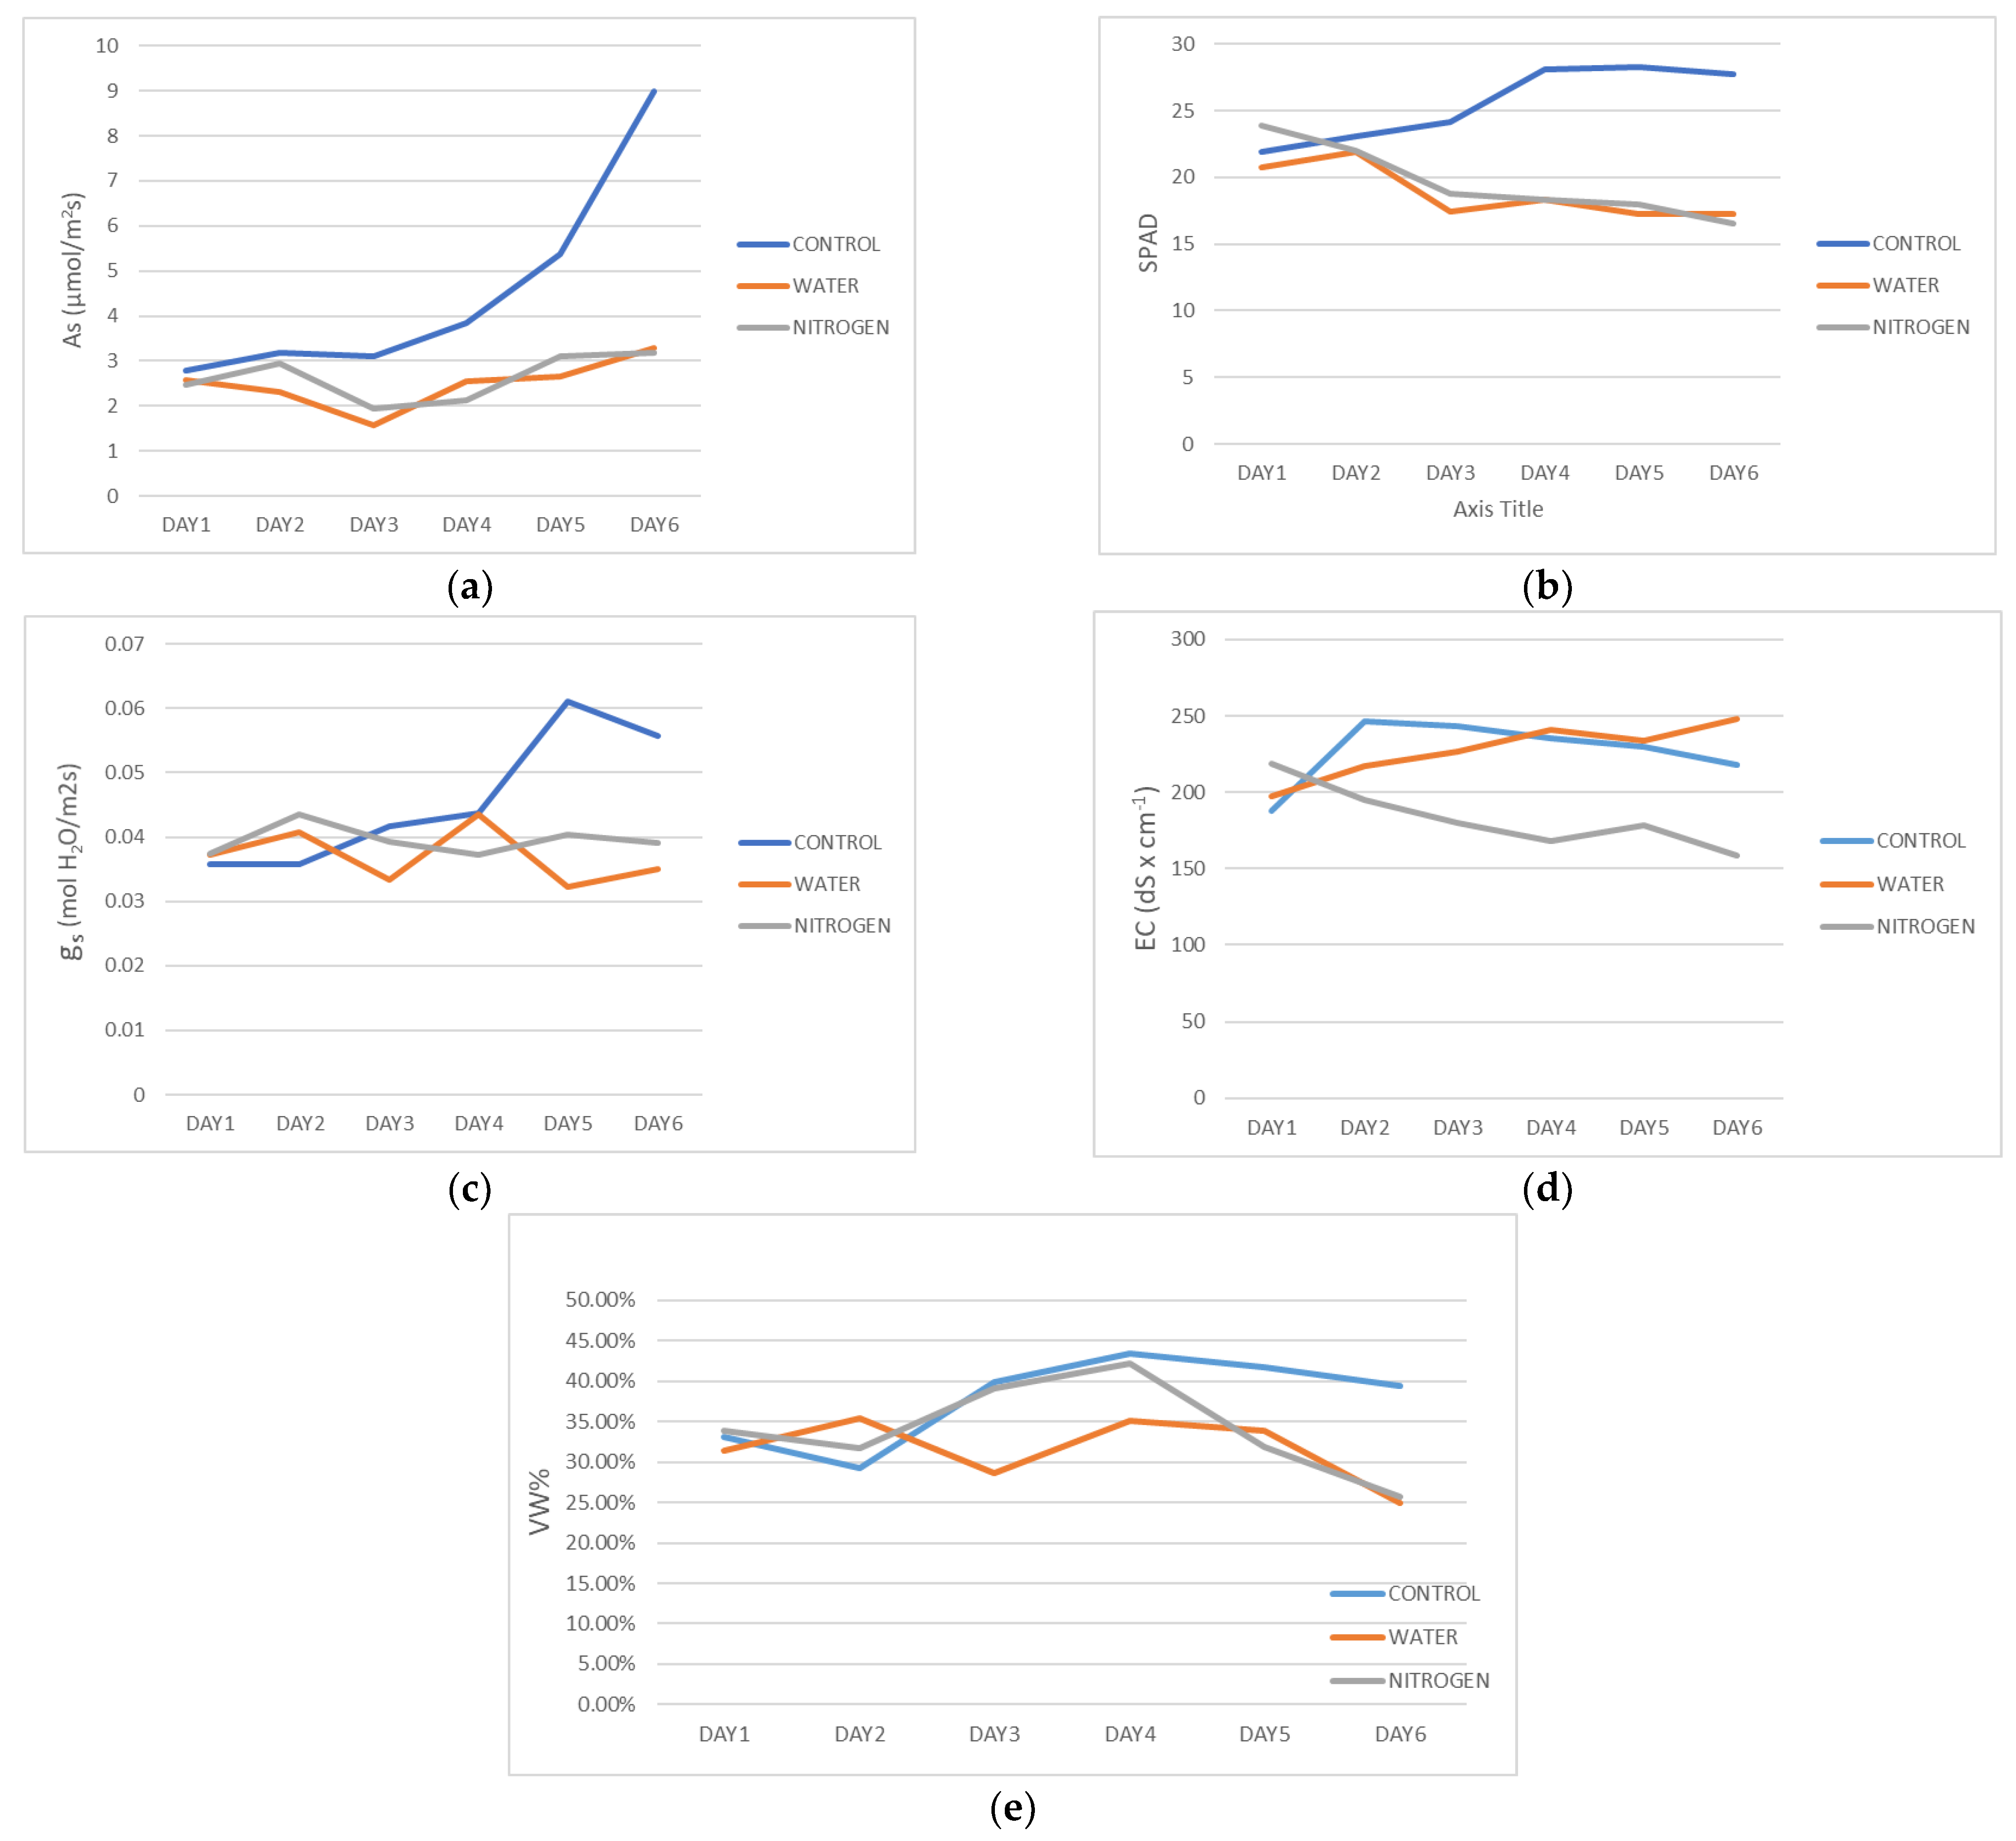
3.2. Data from Physiological Parameters of the Crops
The plants were measured daily with manual sensors for various physiological parameters during their development. As can be observed from
Figure 7a, the photosynthetic efficiency of the plants started to show statistically significant lower performance for the two stressed treatments on the third day compared to the control treatment. In addition, and also on the third day, the chlorophyll content was significantly reduced in the two stress treatments compared to the control treatment (
Figure 7b). The stomatal conductance (and thus stomatal opening) of the two stress treatments remained stable during the entire experiment. On the last two days of the experiment, the stomatal conductance of the control treatment showed higher activity (
Figure 7c). In terms of Electrical Conductivity (EC), the reduced nitrogen treatment showed a significantly lower concentration than the control treatment due to the limited nutrient solution in the substrate. All the measured parameters of the experiment are presented in
Figure 6 below.
In
Table 4 below, the plants’ physiological parameters are listed to compare and analyze the three treatment groups and identify statistical differences. Each sample set (i.e., Control, Water, and Nitrogen) consists of six mean values (one for each experimental day), where the mean of each data set represents the daily average value of the examined plant physiological parameter. One-way ANOVA was used to examine and compare the difference in photosynthetic rate (As in μmol/m
2 s) between the three treatment groups. The test revealed statistically significant differences between the control treatment (M = 4.54 μmol/m
2 s, SD = 2.3) and the water (M = 2.49 μmol/m
2 s, SD = 0.5) as well as nitrogen treatments (M = 2.62 μmol/m
2 s, SD = 0.5). Moreover, the CCI mean of the control treatment was around 30–36% higher than the water and nitrogen treatments, and thus, the subsequent one-way ANOVA showed statistically significant differences.
An analysis of stomatal conductance (gs in mol H2O/m2 s) was conducted between the three treatment groups, and a one-way ANOVA test showed no statistically significant differences between the groups. However, a lower level of stomatal conductance in the water (M = 0.037 mol H2O/m2 s, SD = 0.004) and nitrogen treatments (M = 0.039 mol H2O/m2 s, SD = 0.002) was observed compared to the control treatment (M = 0.045 mol H2O/m2 s, SD = 0.001).
In all three groups, a mean soil temperature of around 18 °C was observed, and thus, no statistically significant differences were identified between the control group and the two stress treatments following a one-way ANOVA. A one-way ANOVA was performed to compare the EC (EC in dS × cm−1) of the substrate environment in the three treatments. The results of the test showed statistically significant differences between the three groups. The EC mean value of the nitrogen treatment (M = 183.2 dS × cm−1, SD = 21.3) was significantly lower than the control (M = 226.6 dS × cm−1, SD = 21.5) and water treatments (M = 227.3 dS × cm−1, SD = 18). The water volume (%) showed no statistically significant differences between the three treatments; however, a lower mean water volume for the water treatment (M = 31.6%) was observed compared to the control and nitrogen groups (6.2% and 2.5% in difference, to be precise).
Stomatal conductance is considered an indicator of water stress, as it represents the carbon dioxide flow rate based on the degree of the opening of the leaf pores [
26]. In this study, the stomatal conductance obtained by the water- and nitrogen-stressed plants was significantly correlated with the irrigation and fertilization levels. At this stage, the low levels of irrigation and fertilization (a 50% reduction) showed similar stomatal conductance results compared to the control treatment. Stomatal conductance in the control treatment was not statistically significantly different from the low irrigation and fertilization levels, indicating no abnormalities in carbon dioxide absorbance in the plants regardless of fertilization and irrigation levels.
In summary, statistically significantly differences were observed between the control group and the two stress treatments for the chlorophyll content and photosynthetic efficiency indices. In addition, it was observed that the nitrogen-stressed plants presented statistically significant lower EC due to the lower amount of added nitrogen. The water-stressed plants were insignificantly different, yet there was a lower water content in their substrate compared to the control treatment.
3.3. Relationship between Vegetation Indices and Response Variables
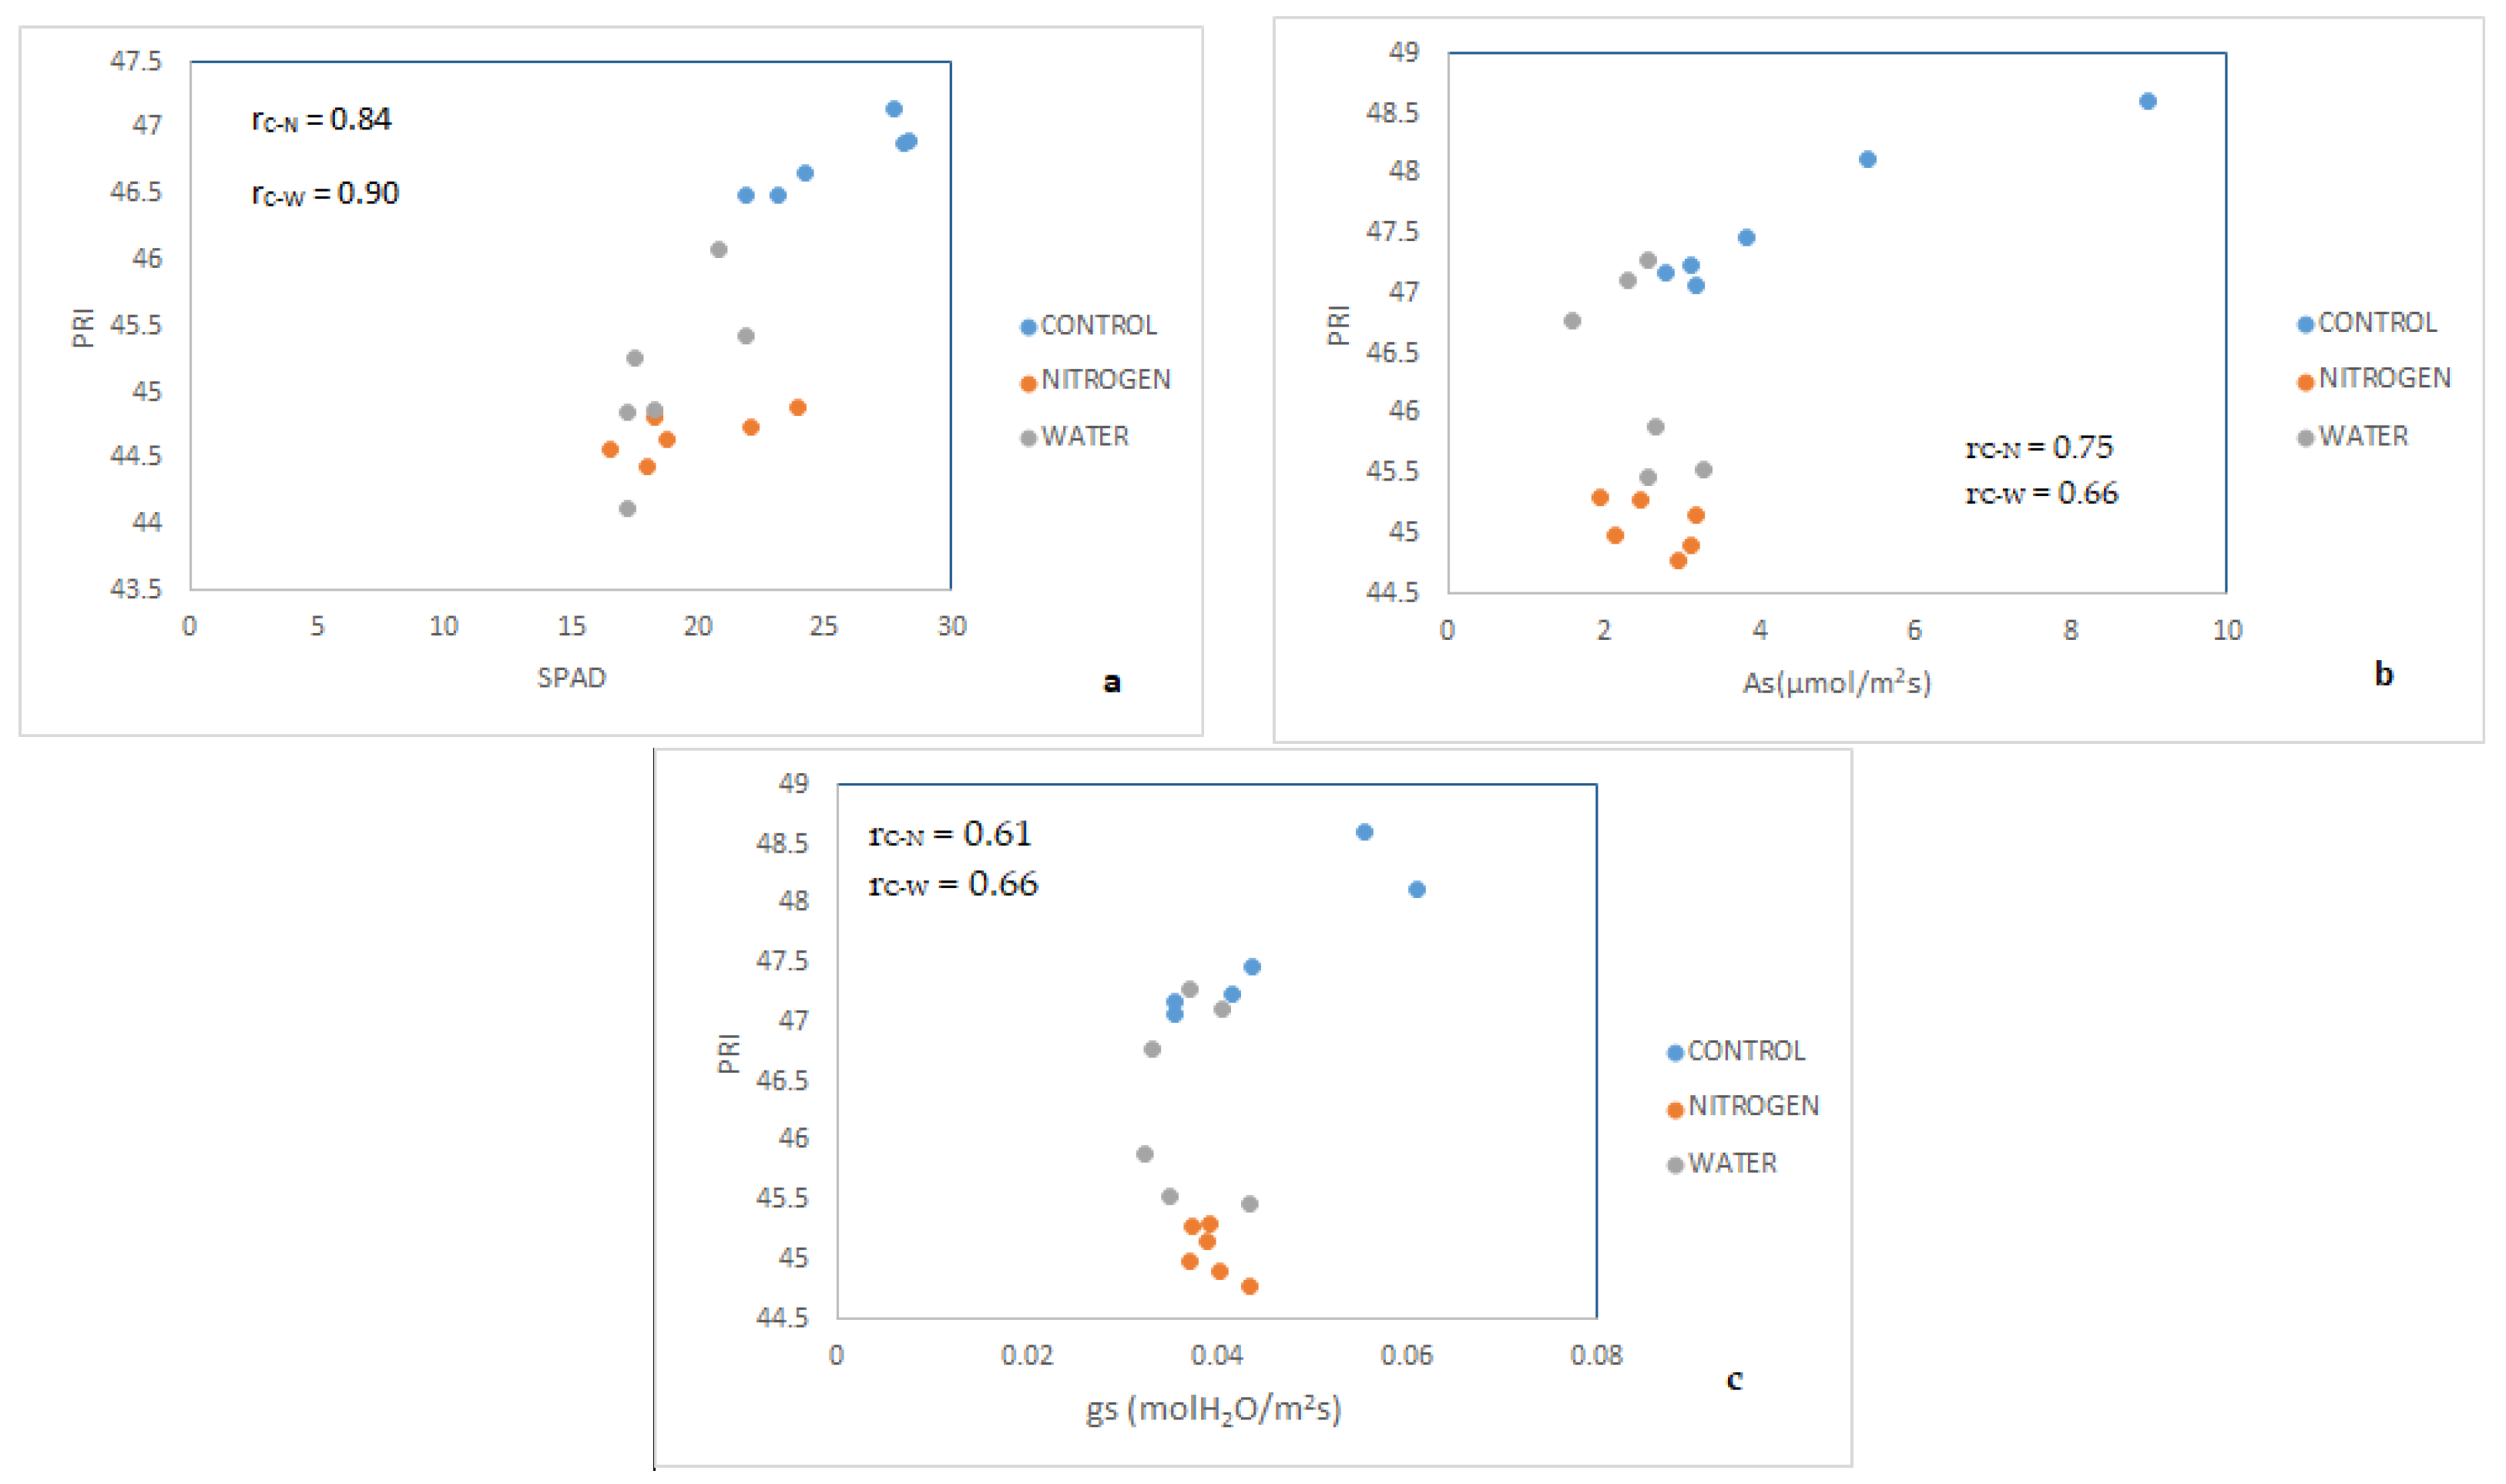
The relationship between the measured vegetation indices (NDVI and PRI) and response variables (chlorophyll content, photosynthetic efficiency, stomatal conductance, electrical conductivity, and water content) was evaluated in this study. With respect to PRI, a perfect correlation was found between PRI and SPAD (SPAD is the Soil Plant Analysis Development and consists of a unit of chlorophyll content measurements) under both the water and nitrogen stress treatments, with correlation coefficients of r = 0.90 and r = 0.84, respectively (
Figure 8a). A high correlation was also found between PRI and photosynthetic efficiency under both stress treatments with correlation coefficients of 0.66 and 0.73, respectively (
Figure 8b). Finally, Pearson’s correlation showed a high relationship between PRI and stomatal conductance (
p < 0.05), as well as correlation coefficients of 0.61 and 0.66, respectively, for the plants under nitrogen and water stress (
Figure 8c).
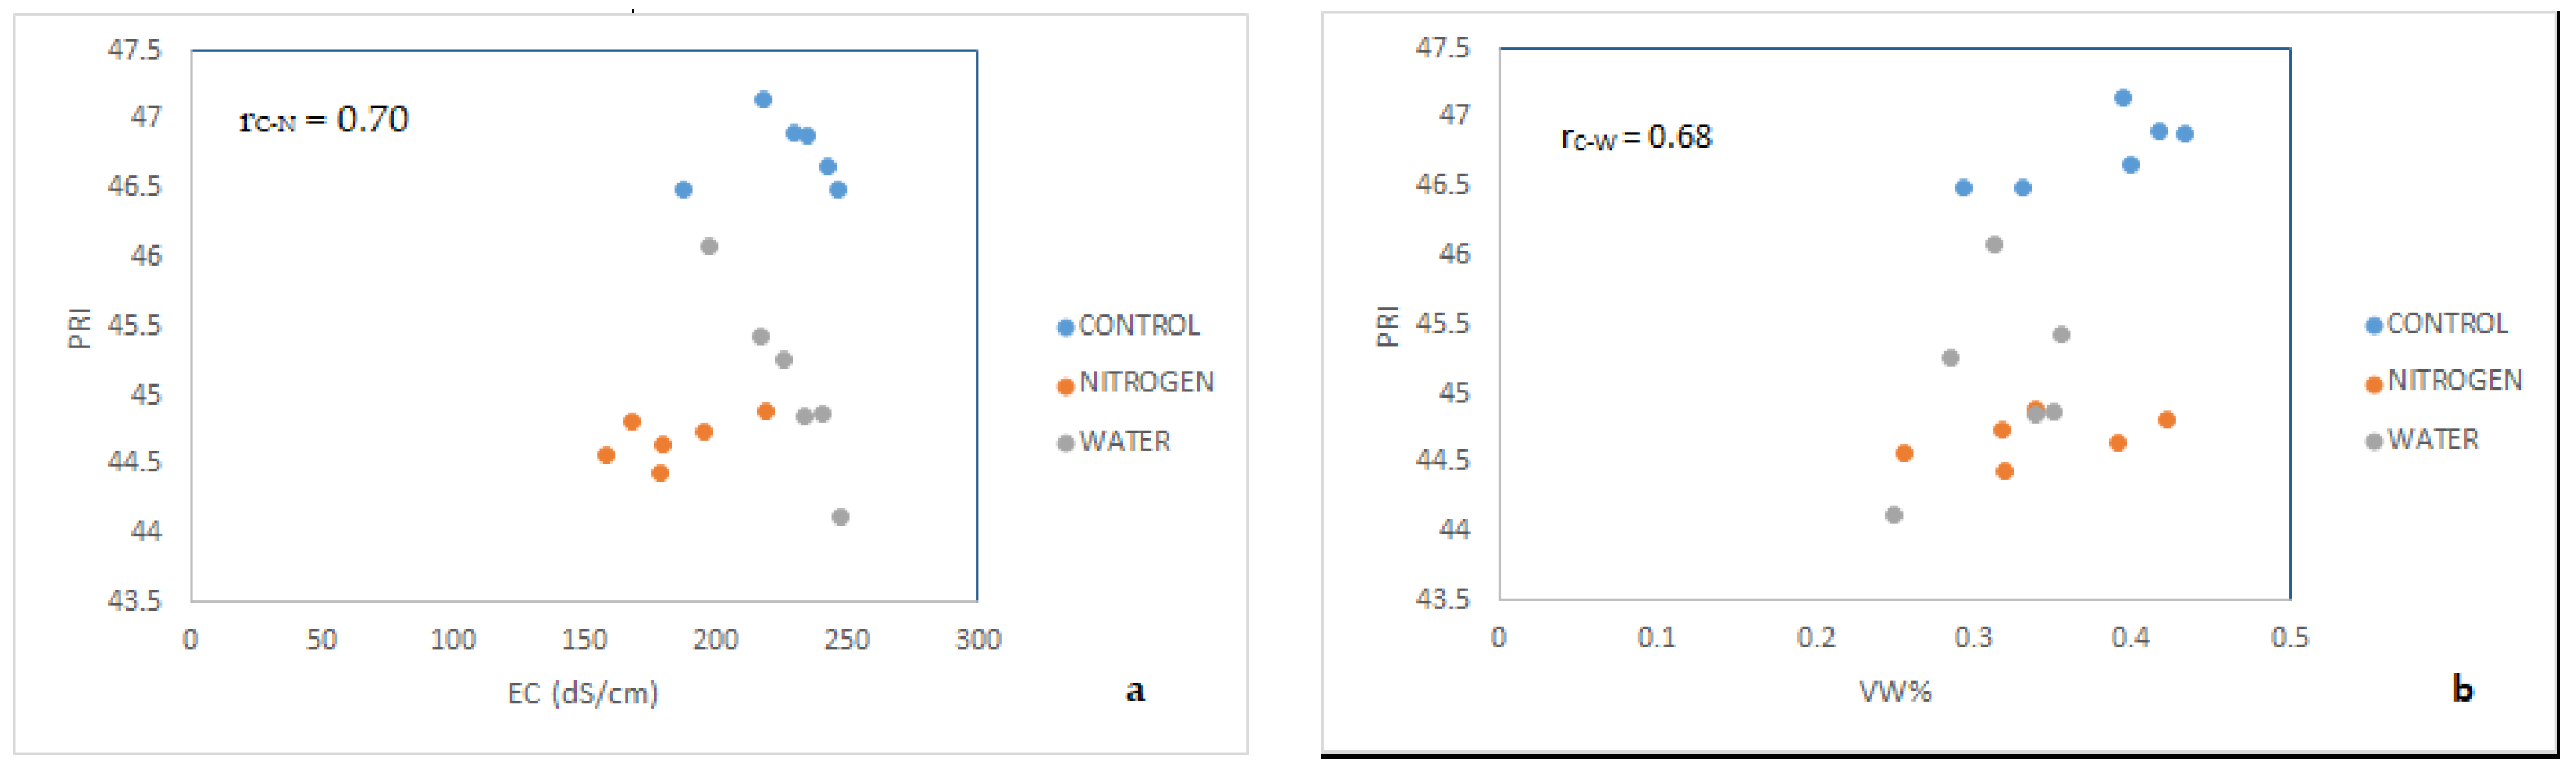
For the plants under nitrogen stress, the analysis between PRI and EC showed a strong correlation (
p < 0.05) with a correlation coefficient of 0.70 (
Figure 9a). Additionally, the plants under water stress showed a significant correlation (
p < 0.05) between PRI and the water content of the substrate, with a correlation coefficient of 0.68 (
Figure 9b).
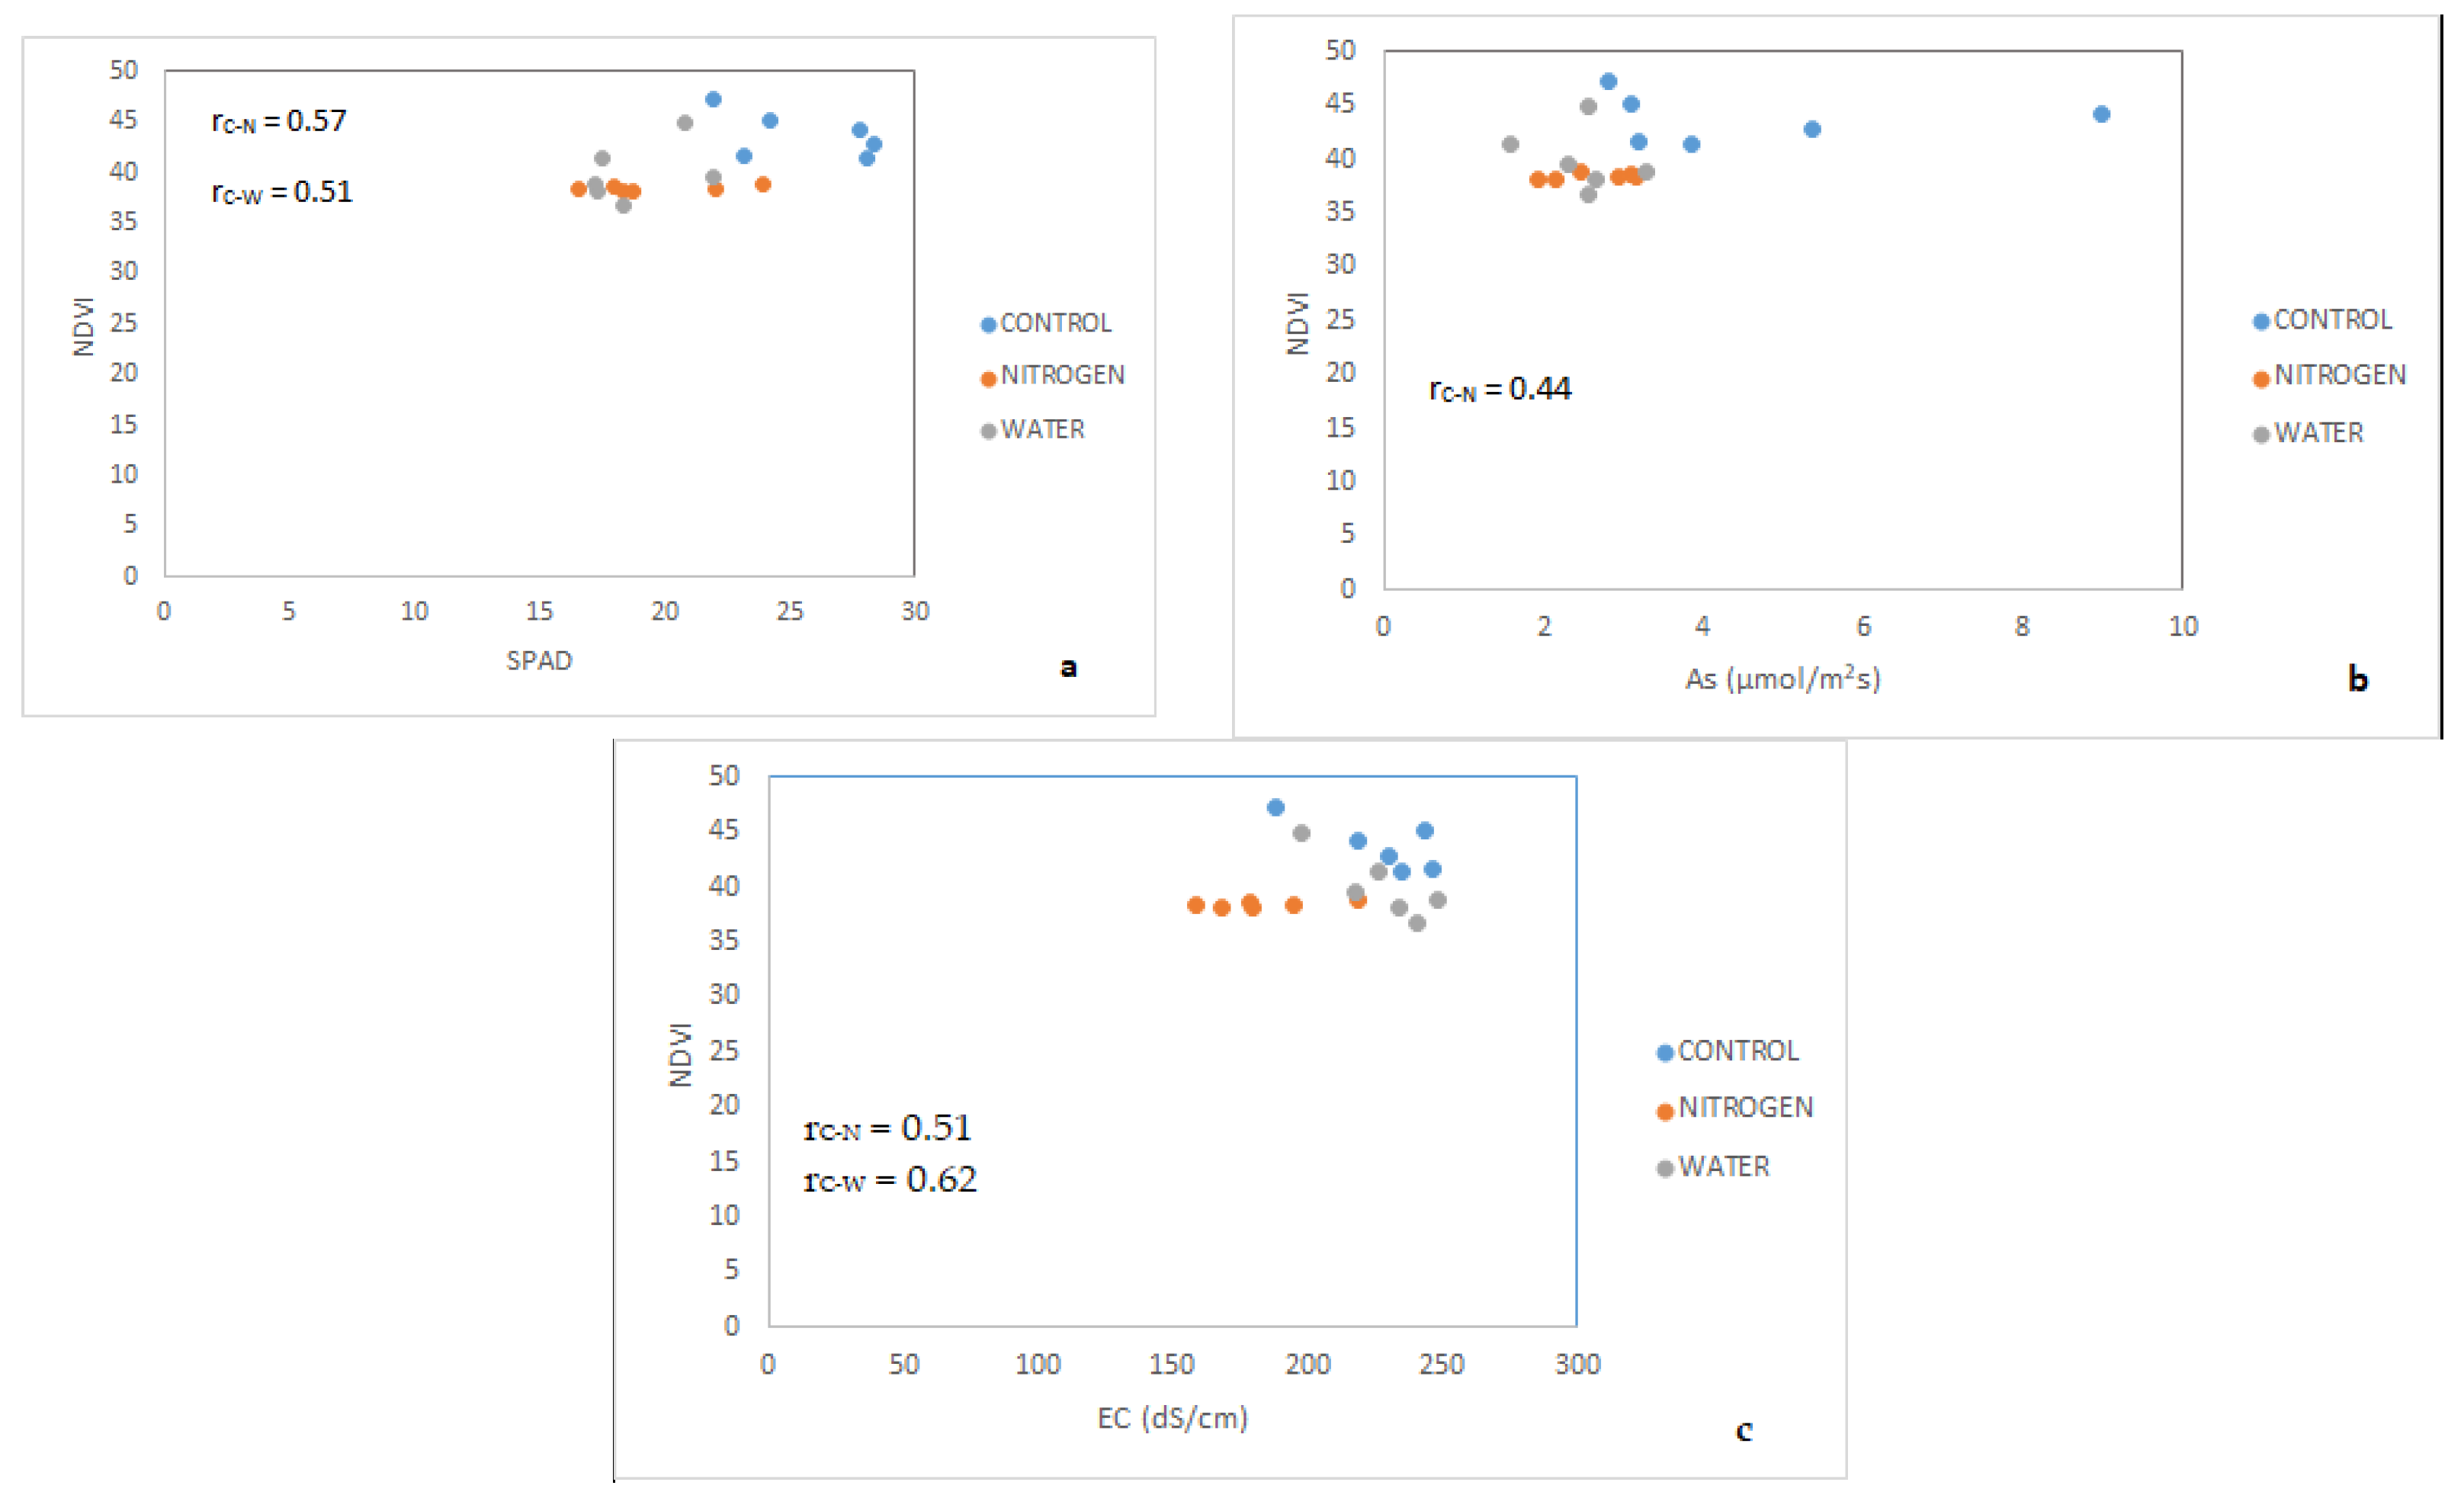
Contrary to PRI, NDVI presented less strong correlations with the physiological indices of the basil plants. More specifically, a high correlation (
p < 0.05) was observed between NDVI and chlorophyll content (SPAD) under the water and nitrogen stress treatments with correlation coefficients of 0.51 and 0.57, respectively (
Figure 10a). In addition, a high correlation with a positive correlation coefficient of 0.51 and a negative correlation coefficient of −0.62 was found between NDVI and EC for both stress treatments with a
p-value of < 0.05 (
Figure 10c). Finally, NDVI showed a moderate correlation with the nitrogen stress treatment with a positive correlation coefficient of 0.44 (
Figure 10b).
4. Discussion
The results of this work indicate that crop reflectance was directly linked to the water and nitrogen availabilities in the three treatments of the experiment. As to the nitrogen treatment, the reflectance data obtained by the cultivated plants in the hydroponic Ebb and Flow system developed a nitrogen deficiency that was only detectable with the multispectral camera and the physiological indices of the plants, i.e., invisible to the naked eye. Even at the end of the experiment, there were no visible signs or indicators of nitrogen deficiency in the basil plants (e.g., yellow leaves). However, it should be mentioned that the nitrogen stress treatment only lasted for six days. According to Prsa et al. [
27], plants develop small pools of nitrogen storage in the leaves, leading to a saturated CO
2 photosynthetic rate and a slightly lower photosynthetic capacity of the plants. Additionally, Magana et al. [
28] noted that very low nitrate concentrations in nutrient solutions (around 0.02 mmol/L) could affect the photosynthetic efficiency of tomato plants that grow in hydroponic systems only two days after the initiation of the stress treatment.
Nitrogen deficiency was detected with the use of both NDVI and PRI indices. Both indices focus on the spectrum bands between 512–550 nm and 570–700 nm, respectively, as long as the nitrogen stress treatment continues for multiple days. This is consistent with previously conducted research [
3,
29,
30], which indicates a similar variation of crop reflectance values in the spectra subjected to nitrogen stress.
The reflectance in the NIR and the red-edge region of the spectrum was highly correlated with the nitrogen and water deficiencies of plants. In contrast, reflectance values in the visible part showed great variation over time, confirming that several environmental factors could play a significant role in this spectrum region.
PRI was mainly correlated to the photosynthetic efficiency (As) of the plants. This result that has also been mentioned previously by Strachan et al. [
31], who found a general decline in the PRI index while As increases. Prolonged and severe water stress may affect the pigment development of leaves, which could be observed in the PRI data. Previous authors [
32] have found an association between vegetation indices and chlorophyll as well as stomatal conductance. However, the relationship between vegetation indices and photosynthetic efficiency is not well documented for basil plants. In our study, a significant correlation between PRI and physiological parameters was found. The major benefit of remote sensing data is that canopy level measurements can be compared with the proximal data of the leaf level. Remote sensing data present a high capturing level of spatial inconsistency. It is important to emphasize that the correlation between PRI and the physiological indices increases over time. This index is considered to show the long-term effect on plants. Therefore, a cumulative effect of the water and nitrogen stress levels in plants can be observed via remote sensing.
Previous studies [
33,
34] have supported that NDVI is a good indicator of nitrogen content and biomass in a canopy. As Jones et al. [
35] stated, nitrogen in the substrate and chlorophyll in plants are directly related. Thus, chlorophyll can be used as an indirect indicator of the nitrogen level in a canopy during fertilization management. According to Kim et al. [
8], NDVI also correlates well with water pattern treatments only when water’s capacity is less than 60%. However, in this experimental research, the six days of limited irrigation and increased indoor humidity (due to poor insulation of the growth environment) showed that the duration of the stress treatments was not enough to negatively influence the resulting leaf area and/or cause yield reduction.
NDVI can also be related to plant robustness and a lower leaf area in water-stressed plants [
36]. Our study confirmed that NDVI was representative of water limitations due to water stress (half dose level of irrigation). The index could accurately provide insights into the differentiations between water status and stress conditions. However, NDVI in our study did not present high correlations between the studied physiological parameters in the plants. Further research is required to study the performance of NDVI under more severe water stress conditions.
Reduced stomatal conductance induced by water stress has been documented several times [
37,
38]. Water stress increases abscisic acid (ABA) in plants’ roots, resulting in the closure of stomatal pores [
26]. Reduced stomatal conductance can lead to a reduction in the total leaf area of plants, signifying that water stress can affect a wide range of plant behavior [
39]. Consequently, to characterize plant behavior under water and nitrogen stress, it is vital to consider both physiological responses and spatial variability, which are obtained from data.
5. Conclusions
In general, this study demonstrates the feasibility of multispectral images for indoor irrigation and nutrition scheduling in basil plants. Reflectance data appear promising for the estimation of both water and nitrogen content. This technique, combined with the physiological study of plants analyzed in the research for both water and nitrogen stress, can allow indoor growers to improve real-time decisions regarding the application of irrigation and fertilization in this commercial crop, specifically for indoor vertical farms. Specifically, manually obtained data of physiological plants’ responses made possible the evaluation of the multispectral vision method’s accuracy. The data showed a relationship between remote sensing (PRI and NDVI) and response variables (chlorophyll, photosynthetic efficiency, and stomatal conductance). Multispectral data could differentiate treatments that received 50% of normal irrigation and fertilization rates. Specifically, the results of the present study show that NDVI and PRI could be used as an indicator of plant water and nitrogen stress in vertical farms up to a certain limit. Reflectance and physiological measurements in greenhouses and indoor farms could be integrated over time to trigger irrigation and N fertilization events. Nevertheless, it should be noted that the results presented correspond to a period of six days, and the observed correlations are relevant to the conditions of the measurements and the specific crop studied. These results demonstrate the potential of using multispectral sensors to understand water and nitrogen stress for real-time production control and better decision-making. Additionally, this study examines the opportunity for potential estimation of plant physiological processes and their development using canopy reflectance from multispectral imaging, integrated with radiometric and exposure calibration at the leaf level, allowing farmers to control their crops via data mining. These results are especially relevant for indoor vertical farming conditions, where plants are stacked vertically, and it becomes difficult to maintain stable conditions and, at the same time, monitor and control the production line automatically.
The correlation results between PRI and the physiological parameters appear to be useful for a better assessment of the short-term water and nitrogen conditions in indoor basil production and, therefore, can be used to estimate stomatal conductance, chlorophyll content, and photosynthetic efficiency from obtained multispectral images. The method allows for high-throughput screening and is a high representative of the special variability for assessing the water and nitrogen status of leafy greenery plants grown in indoor spaces.
Vertical farms and greenhouses could use suitable reflectance indices in their facilities for real-time detection of water and nitrogen stress of their crops, with the use of non-contact and non-destructive methods. Under this scope, the process of automation for the cultivation of herbs and vegetables in indoor vertical farms could be highly facilitated and consequently significantly reduce the production costs that are related to labor. Additionally, gathering large data sets of image vision information on plant growth, phenotype and physiology could lead to better-trained algorithms that provide accurate information that can further optimize plant growth and the whole production line. In that way, higher resource use efficiency can be achieved inside vertical farms by avoiding wasting resources such as energy, water, and nutrients.
Further analysis is required for a wider variety of cultivated species and cultivars, lighting, and airflow conditions in the growing area. It should be mentioned that reflectance indices present high sensitivity from the background signal and the light intensity in the view angle of the remote sensor used. For this reason, the processing and optimal calibration and normalization of the reflectance measurements is one of the most crucial steps for the right acquisition of representative data.
This study shows how visual monitoring methods, which are already significantly established in open-field agriculture, could also be adapted and successfully used in vertical farms in combination with advanced robotic means that enhance the flexibility and automation of the method. In this study, the model plant is basil; however, future research on more cultivation plants that are frequently selected for indoor vertical farming could be applied after the described methodology is repeated for data collection, validation, and correlation to enhance the agronomic interest. The development of smart technologies and systems with respect to automation and robotic applications could significantly improve resource use efficiency, productivity, and sustainability in controlled environment agriculture techniques. Autonomous robotic platforms that support multi-sensing equipment and can move freely inside indoor vertical farms in order to sense the crops could significantly aid this effort. Finally, advanced plant monitoring demands intense efforts in platform development in order to integrate multidimensional data since plants are characterized by complex processes that cannot be clarified only by a simple algorithm or a precise formula.
This study signifies the way for future elaboration of obtained quantitative data from plant physiology and phenotype and eventually concludes qualitative data such as nutrition and irrigation status of the canopy. In a large-scale application, such information could help farmers understand and optimize the effect of LED light (quality, quantity, and duration), environmental conditions (temperature, CO2, and humidity), and cultivation conditions (nutrition, irrigation, etc.) on plants’ growth behavior. The two main objectives of this research were first to detect remote growth and plant quality while reducing resource use (nutrients and water) and second, to use visual-based methods that are less time-consuming and non-destructive by adding another value in the robotic means that can be applied inside vertical farms. Multispectral spectroscopy could significantly contribute to the operation of vertical farms, minimization of risk related to yield losses and reduction of operating expenses, traceability, deep learning, and quality assurance.


 ,
, 


