Article

Preliminary Research on the Effects of Different Substrates on the Metabolome of Potted Peonies

1
College of Jiyang, Zhejiang A&F University, Zhuji 311800, China
2
Bashan Management Area of the Management Committee for Taishan Historic and Scenic Area, Tai’an 271000, China
3
College of Horticulture Science, Zhejiang A&F University, Hangzhou 311302, China
*
Author to whom correspondence should be addressed.
These authors have contributed equally to this work.
Agronomy 2022, 12(11), 2628; https://doi.org/10.3390/agronomy12112628
Submission received: 16 September 2022 / Revised: 19 October 2022 / Accepted: 20 October 2022 / Published: 26 October 2022
(This article belongs to the Special Issue Recent Advances in Horticultural Crops-from Omics to Biotechnology)

Abstract

:
Peony (Paeonia suffruticosa Andr.) is a traditional ornamental flower in China. Peony potted culture has become mainstream. The development of agricultural and forestry waste instead of a nonrenewable peat matrix as the substrate is an important direction for the future industry of potted peonies. However, the mechanism of the effects of different substrates on the growth and development of peonies remains unclear. In this experiment, “Luhehong”, a peony variety from Heze, Shandong Province, was selected as the main experimental material. The response mechanism of peony roots to different substrate proportions was analyzed using untargeted metabolomics of potted peonies. Results showed that the potential for pot growth of planted peonies using the mixed-straw mixing matrix (Matrix K) is better than that of the rice husk matrix (Matrix G) and the control matrix. Moreover, the comparative analysis of the metabolic groups indicates that the number of peony root secretions in the three matrices has a remarkable difference, possibly related to the nutrition supply levels of the peony roots, in the different matrices of adaptive response and adjustment. Furthermore, (2r)-3-hydroxyisovaleroylcarnitine, trigonelline, 2-acetylresorcinol, and dehydroascorbic acid (oxidized vitamin C)—four metabolites with the most substantial intergroup differences—are considered key metabolites. The metabolic pathway analysis of propanoate, and ascorbate and aldarate metabolism, and the two pathways related to an environmental response, namely, ABC transporters and phosphatidylinositol signaling system, indicated that these pathways were remarkably enriched. Both may be the key way to affect the growth and development of potted peonies. This study can provide an important reference for the rational allocation of the substrate of agricultural and forestry waste in potted peony cultivation and application.

1. Introduction

The peony is a traditional Chinese flower loved by people worldwide. Potted peonies have become increasingly popular with the increase in people’s spiritual needs and the improvement in the degree of popular urbanization. As a traditional flower, the peony can be used ornamentally and for its high medicinal value. Peonies can even be used as food in many areas. Therefore, the peony is a kind of flower with a high economic value. Potted flowers have a long history in China. From the perspective of the flower industry’s market development, they are part of society’s mainstream demand. In peony cultivation, the peony cultivated in the field can bloom for years after entering the flowering period, even when it is 100 years old. However, the absorption roots of peonies grown in containers are minimal because of the matrix and other factors. However, for peonies grown in containers due to their succulent roots, the permeability and water retention of the cultivation substrate cannot be achieved simultaneously; thus, the flowering rate is low, and the growth is poor, thereby reducing the ornamental and economic value of peonies and greatly limiting the promotion and application scope of peonies [1]. A critical factor of potted peonies should be the substrate.
The traditional matrix formula mainly comprises peat, perlite, and vermiculite. Although it has good performance in the cultivation of most plants, it causes problems, such as high cost and environmental damage, because of the non-renewability of peat. Therefore, finding substitutes has become the focus of matrix research. At present, studies on peony cultivation mainly focus on variety selection, cultivation physiology, flowering physiology, and flowering time regulation. In comparison, the studies on cultivation substrate focus on pot cultivation substrate components and mainly on how to make peonies grow well [2,3,4]. For example, Cheng and Chen selected nine flower colors, seven flower types, and more than 500 new varieties of purple spot peonies from more than 320,000 seedlings, and they established a new classification system for peony varieties [5]. Shi et al. believed that the production of ethylene and the increase in lipid peroxidation are critical physiological reasons for the senescence of peony flowers [6]. Zhang et al. believed that the formula with a volume ratio of 1:1 of vermiculite and peat soil and a volume ratio of 1:1:1 of perlite, vermiculite, and peat soil can increase the flower diameter of peonies [7]. Xing et al. believed that the best formula for peony cultivation substrate had a volume ratio of 3:1:1 of peat, vermiculite, and perlite3 [8]. The above results show that some breakthroughs in replacing the traditional nonrenewable peat and other cultural substrates have been made to find environmentally friendly, light, and simple cultural substrates that are suitable for potted peony plants. However, studies on the relationship between potted peonies and substrates are few. In particular, the roles of different combinations of substrates on peony metabolism during growth and development have not been reported.
In the early stage, our research group used “Luhehong” from Heze in Shandong Province as the experimental material. It is a major cultivar with a long history of cultivation. We also set 12 combinations of light-simplified matrices to reflect the effects of different matrix combinations on the growth and development of potted peonies, examining their morphological and photosynthetic characteristics to select environmentally friendly and low-cost peony cultivation matrix formulas and to determine how the formula affects the metabolome of the peony’s root. The results show that all substrates are kept at the ideal matrix of the required range at bulk density, total porosity, and comprehensive properties, such as pH, nutrient content, and organic matter. However, peonies in the matrix K combination (peat: perlite: vermiculite: mixed straw = 3:1:1:1) show a large crown diameter, many leaves, and strong photosynthesis, indicating that this group of peonies showed improved growth. According to our previous study, the matrix K combination can effectively replace the general matrix combination. This finding indicates that rice husks can replace peat to meet the needs of normal growth and development of peonies to a certain extent. However, different matrix effects on the growth and development of the potted peony response mechanism remain unclear. The present study chooses the best combination (matrix K), worst combination (matrix G), and a control A peony root as the material for metabonomic research to analyze the effects of different substrates on the growth and development of main metabolic pathways in potted peonies and determine further the relationship between the cultivation matrix and peony growing and its impact.
A rapidly emerging research method in recent years, metabolomics, can find the key metabolites and metabolic pathways affecting plant growth and development by examining the differences in plant metabolites. This research method is widely used on various plants. Most studies use metabolomic data to identify key regulatory pathways and screen candidate genes [9,10]. The metabolome is also used to reflect the relationship between a plant’s growth and its metabolites and determine the regulatory mechanism of plant physiological and biochemical phenomena [11,12,13]. For ornamentals, metabolomic studies and analysis of camellia and Chinese herbaceous peonies have also been conducted, enabling in-depth research on ornamentals [12,14]. Therefore, the present study aims to determine the influence of metabolites in different substrates of potted peonies through metabolome analysis, fill the gap in this aspect of peony research, and provide a reference for the subsequent improvement of potted peonies.

2. Materials and Methods

2.1. Plant Materials

Luhehong, introduced from Heze, Shandong Province, was used as the experimental material. Healthy plants with the same growth potential, lack of disease, and insect pests were selected to colonize a plastic basin with an upper and lower diameter of 30 cm and a height of 20 cm. Normal water and fertilizer management were performed. The specific formulas of the three groups of cultivation substrates are shown in Table 1. About 5 months after being planted, three groups of peony roots cultivated in the substrates were selected for metabolome sequencing. The middle parts of the three main roots of each pot were mixed as samples, and six pots of peonies were selected as replicate organisms for each substrate group. Six biological replicates of each sample group were used for metabolomic assays. All samples were stored in liquid nitrogen for future use.

2.2. Sample Preparation

The samples of roots were ground in liquid nitrogen. Approximately 100 mg of one sample was weighed. Then, 1 mL of precooled methanol acetonitrile aqueous solution was added (v/v, 2:2:1) twice using a vortex mixer with the following parameters: low-temperature ultrasound, 30 min/time, standing at −20 °C for 60 min, and centrifugation at 14,000× g for 20 min at 4 °C. The supernatant (equivalent to 50 mg of the sample) was dried in a vacuum, redissolved in 100 μL acetonitrile aqueous solution (acetonitrile: water = 1:1, v/v) during mass spectrometry analysis, vortexed, and centrifuged at 14,000× g at 4 °C for 15 min. The supernatant was injected into the sample for analysis.

2.3. Liquid Chromatography

All the preprocessed samples were separated on an Agilent 1290 Infinity LC ultrahigh performance liquid chromatography HILIC column with a column temperature of 25 °C, a flow rate of 0.5 mL/min, and an injection volume of 2 μL. The mobile phase composition A comprised water + 25 mM ammonium acetate + 25 mM ammonia, whereas B included acetonitrile. The gradient elution procedure is as follows: at 0–0.5 min, B maintained at 95%; at 0.5–7 min, B changed linearly from 95% to 65%; at 7–8 min, B changed linearly from 65% to 40%; at 8–9 min, B was maintained at 40%; at 9–9.1 min, B changed linearly from 40% to 95%; and at 9.1–12 min B was maintained at 95%. The samples were placed in an autosampler at 4 °C during the whole analysis. The samples were analyzed continuously at random to avoid the influence caused by the fluctuation of the instrument detection signal. The QC samples were inserted into the sample cohort to monitor and evaluate the stability of the system and the reliability of the experimental data.

2.4. Mass Spectrometer

After separation, the samples were analyzed by mass spectrometry with a Triple TOF 6600 mass spectrometer (AB SCIEX) and detected by electrospray ionization positive ion mode (POS) and negative ion mode (NEG). The raw data were converted to the. mZML format by ProteoWizard. Then, the XCMS program was used for peak alignment, retention time correction, and peak area extraction. The metabolite structure was identified by an exact mass number matching (<25 PPM). The secondary spectrogram matching was searched in the laboratory’s database. The POS and NEG were both used to detect metabolites, thereby increasing the metabolite coverage and improving the detection effect. In the subsequent data analysis, the positive and negative ion models were analyzed separately [15].

2.5. Data Analysis

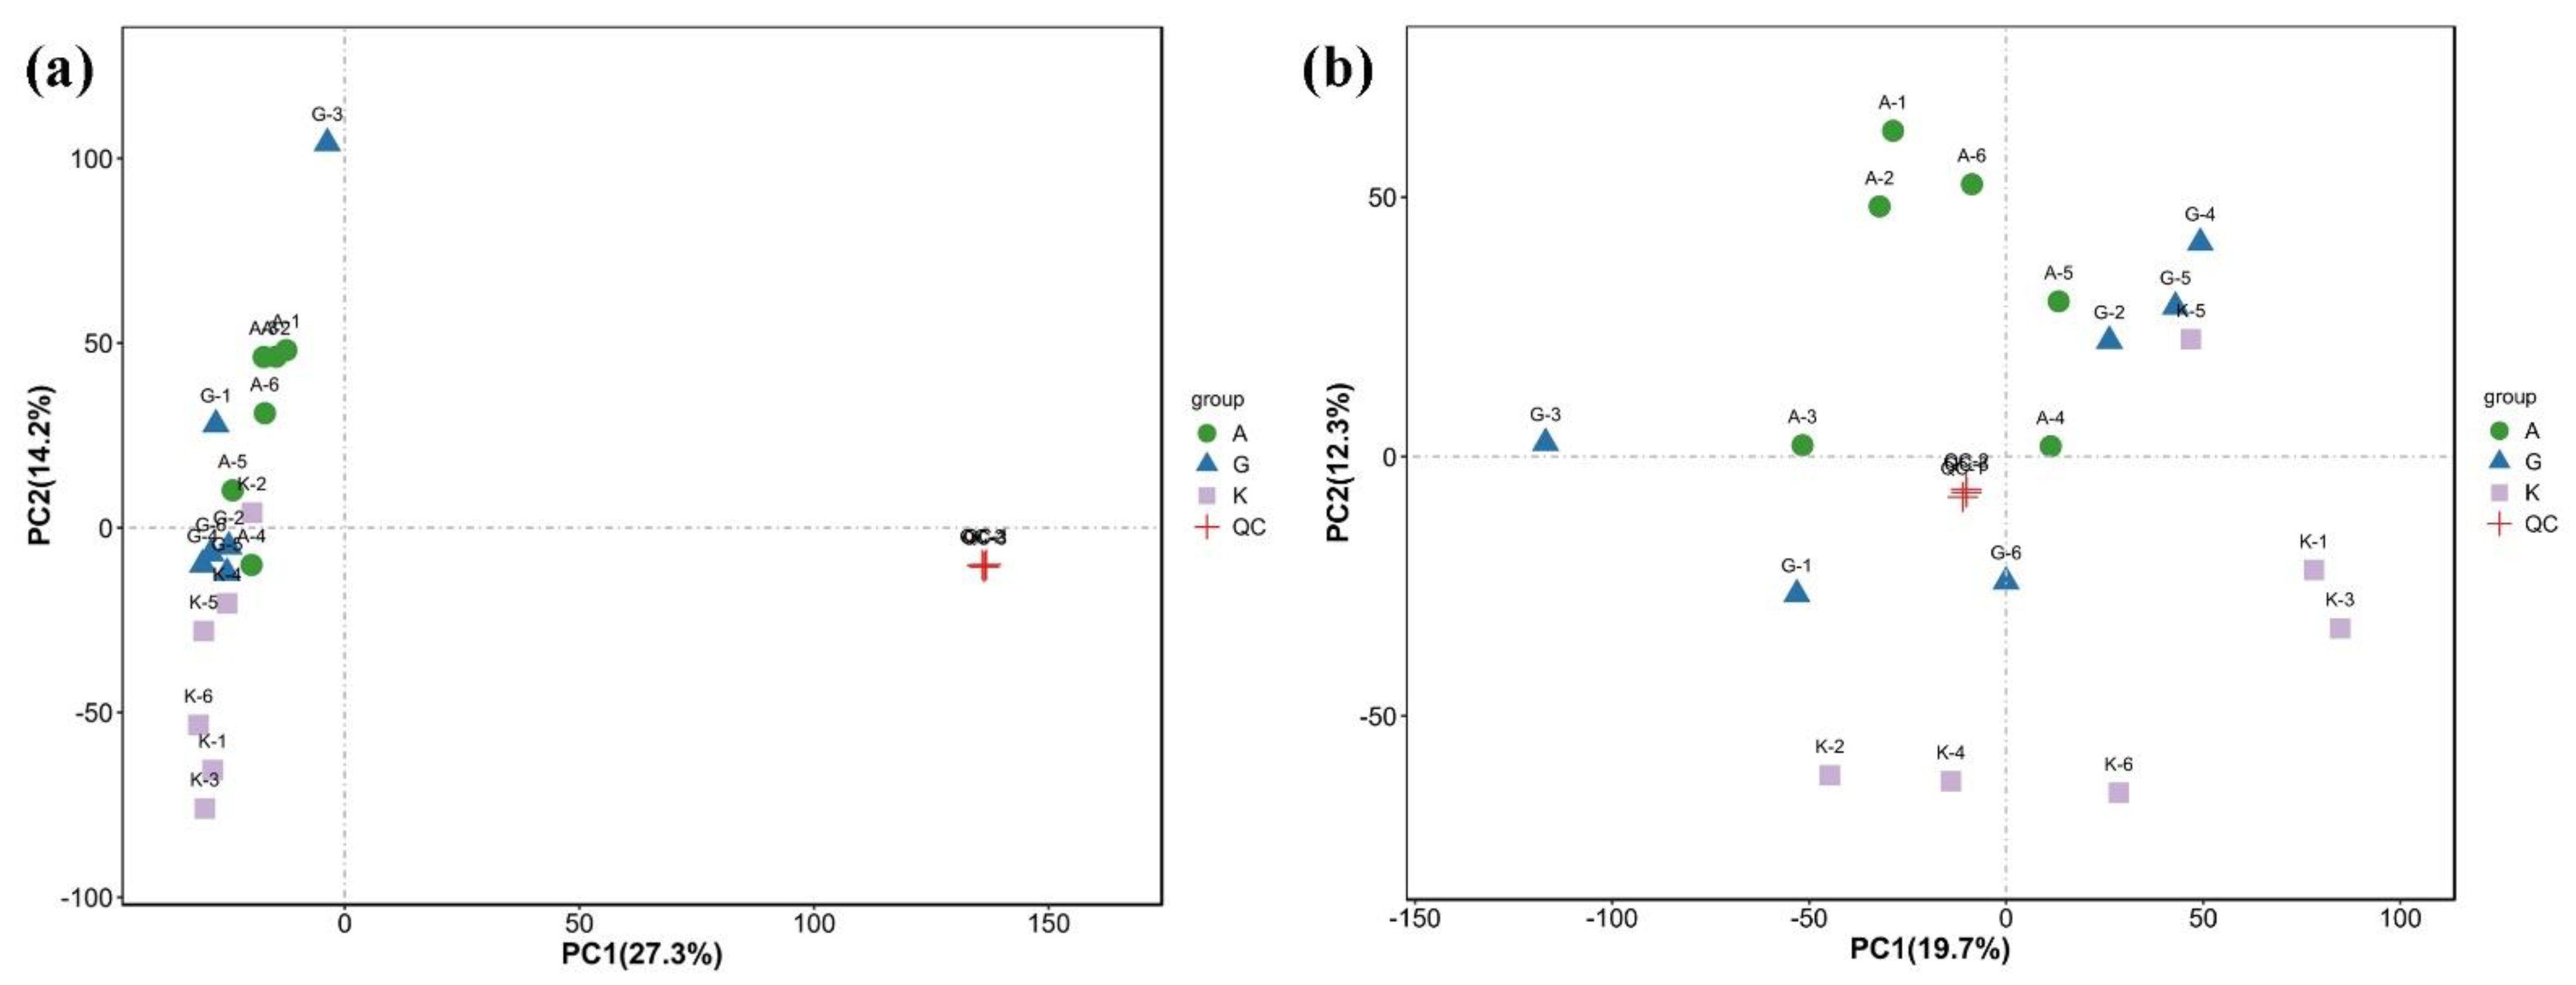
2.5.1. Multivariate Statistical Calculation for Correlation Analysis

Given the complexity of the metabolome, stoichiometric principles and multivariate statistical methods should be used for reducing and classifying the collected multidimensional data to extract the most useful information. We mainly conducted principal component analysis (PCA), partial least squares discriminant analysis (PLS-DA), and orthogonal PLS-DA. The data analysis of this part was performed by using the website tools at http://www.r-project.org/ (accessed on 24 September 2021). This analysis was also used for the subsequent screening of differential metabolites and KEGG enrichment analysis.

2.5.2. Screening of Differential Metabolites

The variable importance in the projection (VIP) score of the (O)PLS model was applied to rank the metabolites that best distinguished between the two groups. The threshold of VIP was set to 1. In addition, the t-test was used as a univariate analysis for screening differential metabolites [16]. Those with a p-value for the t-test of <0.05 and a VIP score of ≥1 were considered differential metabolites between the two groups.

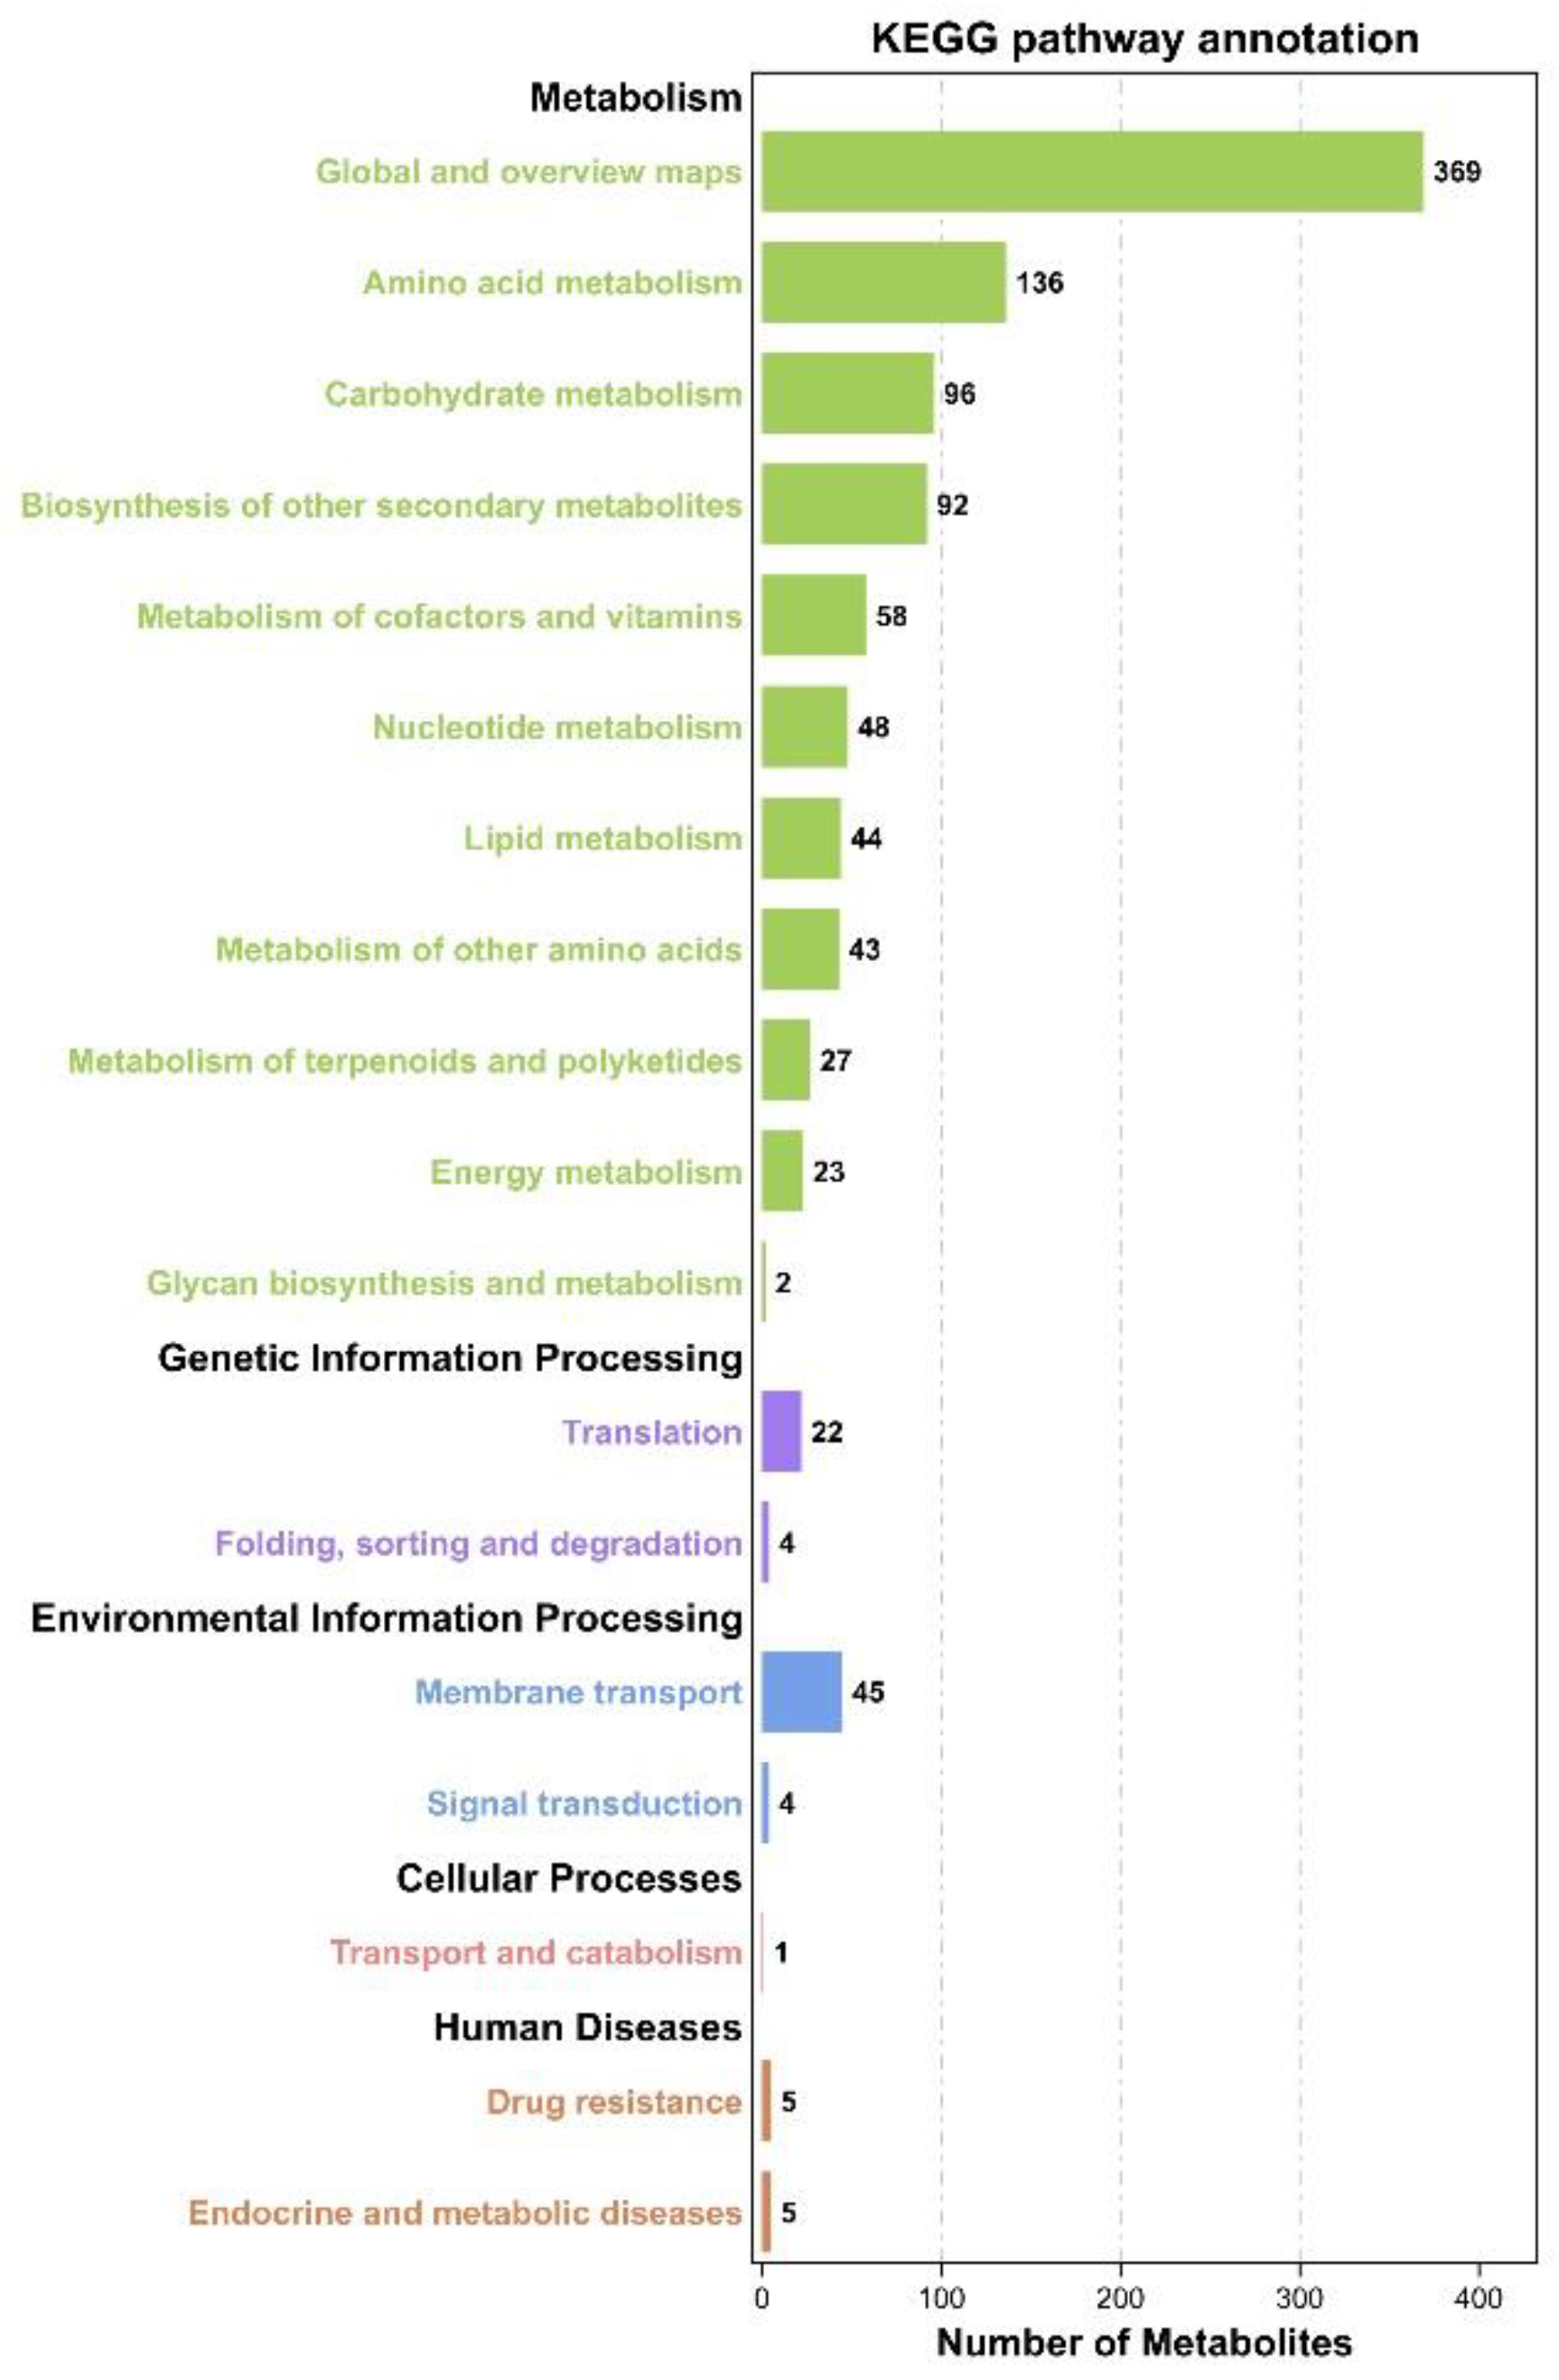
2.5.3. Metabolic Pathway Enrichment Analysis

First, we found the corresponding compound ID of metabolites from the KEGG database according to the qualitative results. After finding the metabolites, we analyzed the metabolite pathway enrichment of the differential metabolites using KEGG. Pathway significance enrichment analysis took the KEGG pathway as a unit. A hypergeometric test was applied to determine the pathways significantly enriched in metabolic pathways compared with the whole genome background.
In the p-value calculation formula of the hypothesis test, N is the number of metabolites with pathway annotation among all background metabolites. n is the number of differentially expressed metabolites in N; M is the number of metabolites annotated as a specific pathway among all background metabolites; m is the number of differential metabolites annotated for a specific pathway. The calculation formula is as follows:
P = 1 i = 0 m 1 M i N M n i N n
After correcting for multiple tests, the pathways with a Q value of ≤0.05 were defined as significantly enriched in differentially expressed metabolites. Here, the Q value is the p-value after the FDR correction [17].

3. Results

3.1. Morphological Differences between the Three Groups of Peonies

As shown in Figure 1, the growth state of the peonies under different ratios of the substrate in different groups was consistent with the previous experimental results. The growth and development of the potted peony in the K group were substantially better than those of the potted peony in the control group A. The potted peonies in the G group had the worst growth. The K group showed that the plants had full growth potential, many leaves, and large leaf shapes, whereas the other two groups had weak growth potential, sparse leaves, and no leaves at the bottom of the branches.

3.2. Quality Control of Metabolomic Data Measurement Methods

The metabolome studies in peony studies are few. Thus, we determined and analyzed the root metabolites of these three groups using the nontargeted metabolome. In the analysis, POS and NEG were simultaneously used in our detection, thereby increasing the metabolite coverage and enhancing the detection effect. In the subsequent data analysis process, the data of POS and NEG would be analyzed separately. First, the QC samples were usually used for quality control when conducting metabolomic studies based on mass spectrometry to obtain reliable and high-quality metabolomic data [15]. In theory, the QC samples are the same. However, the process of sample extraction, detection, and analysis had systematic errors, leading to differences among the QC samples. The smaller the difference was, the higher the method stability was and the better the data quality was. The dense distribution of the QC samples is reflected in the PCA analysis chart, indicating that the data are reliable. The results showed that the metabolome data of this time were reliable (Figure 2). Thus, the final results were further analyzed.

3.3. PCA of Metabolites in Root of Peonies

The PCA analysis showed differences between the samples in each group and the degree of variation among samples within a group (Figure 3). According to the figure, the samples in this experiment met the requirements of metabolome analysis. However, the sample dispersion within each group was not very good, possibly because of the large individual differences among the peonies. Therefore, future experiments on peonies may need a large sample size. However, the materials in this experiment still met the basic requirements of metabolome determination. As raw data, the total number of peaks obtained by POS ions is 12,062, of which 1186 metabolites are known, and 10,876 metabolites are unknown. The total number of peaks obtained by NEG ions is 11,490, of which 595 metabolites are known, and 10,895 metabolites are unknown.

3.4. Identification of Differential Metabolites

The analysis of POS ions indicated that a total of 40 upregulated differential metabolites and 34 upregulated differential metabolites were identified in group A compared with group K and group G, respectively. Moreover, 35 downregulated differential metabolites were identified in both comparisons. Compared with group K, Group G exhibited 44 metabolites that were upregulated and 39 metabolites that were downregulated. The analysis results of NEG ions indicated that 24 and 22 differential metabolites were upregulated in group A compared to group K and group G, respectively. Moreover, 25 differential metabolites were downregulated in both comparisons. Compared with group K, Group G exhibited 16 metabolites that were upregulated and 21 metabolites that were downregulated (Figure 4).
In the data of POS ion, two metabolites showed differences in the three groups of comparisons, namely, (2r)-3-hydroxyisovaleroylcarnitine and trigonelline. In the data of the NEG ion, two different metabolites appeared in the three groups of comparisons, namely, 2-acetylresorcinol and dehydroascorbic acid (DHA; oxidized vitamin C) (Figure 5).
The fold change of the abundance of differential metabolites within the comparison group was calculated to understand further the upregulation of the abundance of differential metabolites. Moreover, the differential metabolite volcano plot was drawn according to the VIP value, p-value, and sieve (Figure 6).

3.5. KEGG Annotation of Metabolites and KEGG Enrichment Analysis

After finding the differential metabolites, we annotated the metabolic pathways and obtained the results shown in Figure 7.
For further analysis, we performed a KEGG enrichment analysis of differential metabolites. The top 20 pathways with the smallest Q value were used to draw the pathway enrichment circle diagram (Figure 8) and obtain the final differential metabolite pathway enrichment results. We found two pathways that were enriched in the three groups of comparisons: propanoate metabolism and ascorbate and aldarate metabolism. We further plotted the bubble plot of KEGG enrichment differences to show the results clearly and intuitively (Figure 9). Two major metabolic pathways that differed in each comparison, namely, propanoate metabolism and ascorbate and aldarate metabolism, were identified. Two metabolic pathways related to an environmental response, namely, ABC transporters and the phosphatidylinositol signaling system, were also found to be important.

4. Discussion

We performed a preliminary metabolomic analysis to explore the differences among the three groups of metabolites and determine the affected metabolic pathways that caused the differences in the growth and development of peonies. We found four key metabolites and four important metabolic pathways. The four metabolites that were different among the three groups were (2r)-3-hydroxyisovaleroylcarnitine, trigonelline, 2-acetylresorcinol, and DHA (oxidized vitamin C). Trigonelline and DHA were studied. The studies on trigonelline mainly focus on its medicinal value. Moreover, the reports on the effects of trigonelline on plants are few. However, some articles determined that fenugreek may be related to plant antistress response [18]. Moreover, DHA is very interesting. In the root, DHA is associated with root tropism in Arabidopsis and the AAO gene, thereby affecting root elongation [19]. Therefore, we believe that homologous genes with the AAO gene exist in peonies, which are affected by the cultivation substrate. Thus, the vitamin C metabolic pathway is regulated, and the geotropism and elongation of the roots are affected. The improvement of potted peonies may be initiated using metabolic pathways related to vitamin C or AAO homologs. In the study of other plants, vitamin C can relieve the drought stress on the root and help plants absorb nutrients well. Therefore, we believe that vitamin C can also serve as the key to relieving further stress on the root of peonies in potted plants.
Two metabolic pathways, propanoate metabolism, and ascorbate and aldarate metabolism, were enriched in pairwise comparisons among the three groups. The metabolic pathway of propionic acid is mainly related to the metabolism of various amino acids. Previous studies found that exogenous propionic acid could improve the resistance of wheat, increase the biomass accumulation of the aboveground part of wheat, and increase the water content of the ground part [20,21]. In peonies, propionic acid metabolism may also be related to the stress resistance of peonies in the pot environment. Moreover, propionic acid metabolism affects the absorption of water and inorganic matter in the root and the accumulation of aboveground biomass. In this experiment, the number of leaves in group K increased remarkably. Ascorbate and aldarate metabolism is also an important metabolic pathway in higher plants; it has very important physiological functions in plant antioxidant and free radical scavenging, photosynthesis and light protection, cell growth and division, and crucial secondary metabolite and ethylene synthesis [22]. This finding suggests that different matrix formulations may lead to the further growth and development of peonies by affecting ascorbate and aldarate metabolism in the root. The poor growth of peonies in the pot environment may be changed with the effect of ascorbate and aldarate metabolism.
Among the other recurrent metabolic pathways that were mined, two metabolic pathways related to an environmental response had substantial enrichment: ABC transporters and phosphatidylinositol signaling system. These two metabolic pathways are more considerable than the two metabolic pathways mentioned above. These two pathways also have many differential metabolites. Therefore, we believe that these two pathways are also key metabolic pathways affecting the growth and development of peonies. In particular, these two pathways have many differential metabolites and high significance. The phosphatidylinositol signaling system, a signaling network closely related to the Ca2+ subsignaling pathway in organisms, affects gene expression and is involved in the cellular response to changes in the external environment [16,23]. The PI pathway in plant research has made some progress in recent years. Studies showed that the PI pathway in plants is associated with many physiological reactions, such as osmotic adjustment and plant defense responses [24,25], plant seed germination, growth, reproduction, and senescence; moreover, the environmental factors play an important role in stress response [26]. This pathway, together with the two pathways mentioned above, belongs to the stress-corresponding pathway and corresponds with the poor growth and development of potted peonies, thereby causing stress to peony plants. The regulation of these metabolic pathways is expected to improve peony varieties suitable for pot cultivation. ATP-binding cassette transport proteins are a large family of membrane proteins. The energy provided by ATP hydrolysis can be used to transport various compounds across the membrane. ABC transporters in plants are widely present in the cytoplasmic membrane, chloroplasts, mitochondria, vacuoles, endoplasmic reticulum, and peroxisomes [27]. It plays a key role in the transport and accumulation of secondary plant metabolites, plant hormone transport, and resistance to stress and disease; moreover, it has been extensively studied in plants [28]. However, studies in flowers are few, but the existing studies showed that this pathway is closely related to flower growth and development [29,30]. This evidence led us to believe that ABC transporters played a vital role in the growth and development of peonies. They also likely affected the growth and development of potted peony flowers. Moreover, they were a key factor affecting the ornamental ability of potted peonies.

5. Conclusions

In this study, agricultural and forestry wastes that can potentially be used as substrates were found using experiments on different substrates. Moreover, four possible metabolic pathways affecting the growth and development of potted peonies were found through metabolome analysis. On the basis of the differential metabolites that we identified, the differential metabolic pathways obtained via KEGG enrichment analysis, and the existing studies, we found that the main metabolic pathways affected by the substrate in potted peonies may be ascorbate and aldarate metabolism. Moreover, exogenous vitamin C was applied to the root. It can alleviate the drought stress of pepper. Therefore, the exogenous application of vitamin C may alleviate the adverse reactions of peonies in the potting process. As mentioned above, propionic acid alleviates the poor growth of wheat under drought conditions. Similar to vitamin C, exogenous propionic acid may also improve the growth of potted peonies during cultivation. In addition, AAO, a gene related to DHA and ascorbate and aldarate metabolism found in Arabidopsis thaliana, may have homologous genes in peonies and produce different expressions in different cultivation substrates. The elongation of peony roots is affected by regulating the ascorbate and aldarate metabolism, thereby changing the growth state of potted peonies. The poor growth of potting peonies at the gene level may be improved by studying the homologous genes of AAO.

Author Contributions

Conceptualization: X.Z., Y.Z. and X.C.; Methodology: Y.Z. and X.C.; Planting and cultivation: Y.H., H.L. and Z.Z.; Collection of metabolomic data: Y.Z., X.C., Y.H. and H.W.; Metabolome data analysis: Y.Z., X.C., H.W. and H.Z.; Writing—original draft preparation: Y.Z. and X.C.; Writing—review and editing: X.Z., Y.Z. and X.C. All authors have read and agreed to the published version of the manuscript.

Funding

This research was funded by the National Key R&D Program of China (Grant Number 2019YFD1001500), the Basic Public Welfare Research Project in Zhejiang Province (Grant Number LGN22C160006), the Talent Project of Jiyang College of Zhejiang A&F University (Grant Number RQ2020B04/RQ1911B05), and the Innovation and Entrepreneurship Training Program for College Students of Zhejiang A&F University and Yang College (Grant Number JYKC2126).

Institutional Review Board Statement

Not applicable.

Informed Consent Statement

Not applicable.

Data Availability Statement

The data presented in this study are available on request from the corresponding author. The data are also uploaded to a public database. OMIX ID of CNCB database is OMIX002080.

Acknowledgments

We are grateful to Gene Denovo Biotechnology Co., Ltd. (Guangzhou, China) for assisting in the metabolite and bioinformatics analyses.

Conflicts of Interest

The authors declare no conflict of interest.

References

  1. Liu, L. Brief introduction of substrate culture of peony. Gansu Agric. Sci. Technol. 2016, 7, 71–73. [Google Scholar]
  2. Zhai, M.; Li, Y.H.; Yang, Q.S. Comparison of photosynthetic characteristics between potted and ground peony. J. Hortic. 2008, 2, 251–256. [Google Scholar]
  3. Feng, X.L.; Zhao, X.H.; Yue, L. Comparison of physicochemical properties of three substrates and their effects on Clivia growth. Mol. Plant Breed. 2021, S682.13, 1–6. Available online: http://kns.cnki.net/kcms/detail/46.1068.s.20210616.1610.022.html (accessed on 17 June 2021).
  4. Yu, C.Z. Studies on Physiological and Biochemical Characteristics of Pot-Grown and Ground-Grown Peony; Huazhong Agricultural University: Wuhan, China, 2008. [Google Scholar]
  5. Cheng, F.Y.; Chen, D.Z. Study on breeding of new peony varieties and classification of peony varieties. J. Beijing For. Univ. 1998, 2, 31–36. [Google Scholar]
  6. Shi, G.A.; Guo, X.F.; Han, J.G.; Sun, X.M.; Yang, Z.S. Ethylene and lipid peroxidation during flowering and senescence of peony. J. Northwest Agric. Univ. 1999, 5, 50–53. [Google Scholar]
  7. Zhang, S.J.; Zhi, L.H.; Xu, W.Y.; Li, Y.J. Effect of different substrates on flower diameter of soilless potted peony. Hubei Agric. Sci. 2009, 48, 2187–2189. [Google Scholar]
  8. Xing, G.P.; Zhang, Z.G.; Jing, Y.D.; Xv, J.G.; Jian, Z.Z.; Li, J.T. Study on the substrate of peony cultivation. J. Shandong Norm. Univ. 2004, 4, 78–81. [Google Scholar]
  9. Zhang, J.; Liang, L.; Xie, Y.D.; Zhao, Z.; Su, L.H.; Tang, Y.; Sun, B.; Lai, Y.S.; Li, H.X. Corrigendum: Transcriptome and Metabolome Analyses Reveal Molecular Responses of Two Pepper (Capsicum annuum L.) Cultivars to Cold Stress. Front. Plant Sci. 2022, 13, 819630. [Google Scholar] [CrossRef]
  10. Su, Z.W.; Jia, H.R.; Sun, M.; Cai, Z.X.; Shen, Z.J.; Zhao, B.T.; Li, J.Y.; Ma, R.J.; Yu, M.L.; Yan, J. Integrative analysis of the metabolome and transcriptome reveals the molecular mechanism of chlorogenic acid synthesis in peach fruit. Front. Nutr. 2022, 9, 961626. [Google Scholar] [CrossRef]
  11. Paupière, M.J.; Tikunov, Y.; Schleiff, E.; Bovy, A.; Fragkostefanakis, S. Reprogramming of Tomato Leaf Metabolome by the Activity of Heat Stress Transcription Factor HsfB1. Front. Plant Sci. 2020, 1, 610599. [Google Scholar] [CrossRef]
  12. Fu, M.Y.; Yang, X.; Zheng, J.R.; Wang, L.; Yang, X.Y.; Tu, Y.; Ye, J.B.; Zhang, W.W.; Liao, Y.L.; Cheng, S.Y.; et al. Unraveling the Regulatory Mechanism of Color Diversity in Camellia japonica Petals by Integrative Transcriptome and Metabolome Analysis. Front. Plant Sci. 2021, 12, 685136. [Google Scholar] [CrossRef] [PubMed]
  13. Parijadi, A.A.R.; Yamamoto, K.; Ikram, M.M.M.; Dwivany, F.M.; Wikantika, K.; Putri, S.P.; Fukusaki, E. Metabolome Analysis of Banana (Musa acuminata) Treated With Chitosan Coating and Low Temperature Reveals Different Mechanisms Modulating Delayed Ripening. Front. Sustain. Food Syst. 2022. [Google Scholar] [CrossRef]
  14. Li, B.; Ge, J.Y.; Liu, W.; Hu, D.J.; Li, P. Unveiling spatial metabolome of Paeonia Suffruticosa and Paeonia Lactiflora roots using MALDI MS imaging. New Phytol. 2021, 2, 231. [Google Scholar] [CrossRef] [PubMed]
  15. Dunn, W.B.; Broadhurst, D.; Begley, P.; Zelena, E.; Francis-McIntyre, S.; Anderson, N.; Brown, M.; Knowles, J.D.; Halsall, A.; Haselden, J.N.; et al. Procedures for large-scale metabolic profiling of serum and plasma using gas chromatography and liquid chromatography coupled to mass spectrometry. Nat. Protoc. 2011, 6, 7. [Google Scholar] [CrossRef]
  16. Jill, M.S.; Imara, Y.P.; Ingo, H.; Staffan, P.; Wendy, F.B. Inositol signaling and plant growth. Trends Plant Sci. 2000, 5, 6. [Google Scholar]
  17. Kanehisa, M.; Goto, S. KEGG: Kyoto encyclopedia of genes and genomes. Nucleic Acids Res. 2000, 28, 27–30. [Google Scholar] [CrossRef]
  18. Fu, D.H. Determination of glycine betaine proline and trigonelline in grape leaves by high performance liquid chromatography. Nat. Prod. Res. Dev. 2007, 2, 313–315. [Google Scholar]
  19. Lee, Y.; Park, C.H.; Kim, A.R.; Chang, S.C.; Kim, S.H.; Lee, W.S.; Kim, S.K. The effect of ascorbic acid and dehydroascorbic acid on the root gravitropic response in Arabidopsis thaliana. Plant Physiol. Biochem. 2011, 49, 8. [Google Scholar] [CrossRef]
  20. McConnell, W.B.; Finlayson, A.J. Studies on wheat plants with carbon-14 compounds: Xx. the metabolism of propionic acid. Can. J. Biochem. 1964, 42, 2. [Google Scholar] [CrossRef]
  21. Li, Y.Z.; Fan, H.Q.; Zhang, Z.L.; Lian, Y.H.; Ren, Y.Z.; Xin, Z.M.; Wang, Z.Q.; Lin, T.B. Effects of root propionic acid application on leaf proline metabolic enzymes and drought resistance of winter wheat seedlings. Acta Bot. Sin. Northwest China 2020, 40, 649–657. [Google Scholar]
  22. An, H.M.; Chen, L.G.; Fan, W.G.; Hu, X.Q. Advances in studies on function, synthesis and metabolism of vitamin C in higher plants. Bull. Bot. 2004, 5, 608–617. [Google Scholar]
  23. Ernesto, C. Calcium signaling: A tale for all seasons. Proc. Natl. Acad. Sci. USA 2002, 99, 3. [Google Scholar]
  24. Dove, S.K.; Cooke, F.T.; Douglas, M.R.; Sayers, L.G.; Parker, P.J.; Michell, R.H. Osmotic stress activates phosphatidylinositol-3,5-bisphosphate synthesis. Nature 1997, 390, 6656. [Google Scholar] [CrossRef] [PubMed]
  25. Bernd, M.R.; Christophe, P. Inositol phospholipid metabolism in Arabidopsis. Characterized and putative isoforms of inositol phospholipid kinase and phosphoinositide-specific phospholipase C. Plant Physiol. 2002, 130, 22–46. [Google Scholar]
  26. Jiang, N.; Tan, X.F.; Zhang, L. Gene analysis of phosphatidylinositol signaling system during oil synthesis from Camellia oleifera seeds based on RNA-Seq. J. Food Biotechnol. 2014, 33, 583–589. [Google Scholar]
  27. Theodoulou, F.L.; Kerr, I.D. ABC transporter research: Going strong 40 years on. Biochem. Soc. Trans. 2015, 43, 1033–1040. [Google Scholar] [CrossRef] [Green Version]
  28. Andolfo, G.; Ruocco, M.; Di, D.A.; Frusciante, L.; Lorito, M.; Scala, F.; Ercolano, M.R. Genetic variability and evolutionary diversification of membrane ABC transporters in plants. BMC Plant Biol. 2015, 15, 1–15. [Google Scholar] [CrossRef] [Green Version]
  29. Cao, Y.H.; Hu, M.J.; Tong, Y.; Zhang, Y.P.; Zhao, K.; Peng, D.H.; Zhou, Y.Z. Identification of ABC gene family of Jianlan and analysis of its expression pattern during flower development. Bull. Biotechnol. 2022, 1–14. [Google Scholar] [CrossRef]
  30. Shen, H.M.; Shi, L.S.; Tian, Q.Y.; Liu, J.W.; Wang, L.G.; Yue, Y.Z. Research progress of ABC transporter in floral organ growth and development. Acta Bot. Sin. Northwest China 2021, 41, 1975–1982. [Google Scholar]
Figure 1. Three groups of peonies used for metabolome determination. (a) Group A; (b) Group K; (c) Group G.
Agronomy 12 02628 g001
Figure 2. Quality control. (a) PCA diagram of POS ions. (b) PCA diagram of NEG ions.
Agronomy 12 02628 g002
Figure 3. PCA analysis of samples. (a) PCA analysis of POS ions between Group A and Group K; (b) PCA analysis of POS ions between Group A and Group G; (c) PCA analysis of POS ions between Group G and Group K; (d) PCA analysis of NEG ions between Group A and Group K; (e) PCA analysis of NEG ions between Group A and Group G; (f) PCA analysis of NEG ions between Group G and Group K.
Agronomy 12 02628 g003
Figure 4. Differential metabolites between groups. (a) DiffExp metabolites statistics of POS ions; (b) DiffExp metabolites statistics of NEG ions.
Agronomy 12 02628 g004
Figure 5. Venn diagram of differential metabolites comparing the three groups. (a) Comparing through POS ions; (b) Comparing through NEG ions.
Agronomy 12 02628 g005
Figure 6. Volcano plot of differential metabolites. (a) The difference of metabolism between groups A and K was analyzed by POS ions; (b) The difference of metabolism between groups A and G was analyzed by POS ions; (c) The difference of metabolism between groups G and K was analyzed by POS ions; (d) The difference of metabolism between groups A and K was analyzed by NEG ions; (e) The difference of metabolism between groups A and G was analyzed by NEG ions; (f) The difference of metabolism between groups G and K was analyzed by NEG ions.
Agronomy 12 02628 g006
Figure 7. The statistical figure in the KEGG for all metabolites.
Agronomy 12 02628 g007
Figure 8. KEGG enrichment circle diagram. (a) Group A vs. Group K; (b) Group A vs. Group G; (c) Group G vs. Group K.
Agronomy 12 02628 g008
Figure 9. Bubble plot of KEGG enrichment differences. (a) Group A vs. Group K; (b) Group A vs. Group G; (c) Group G vs. Group K.
Agronomy 12 02628 g009
Table 1. Matrix formula.
Combination of NumbersCulture Substrate Formula
Combination APeat: perlite: vermiculite = 3:1:1
Combination KPeat: perlite: vermiculite: mixed straw = 3:1:1:1
Combination GPeat: perlite: vermiculite: rice husk = 3:1:1:1
Publisher’s Note: MDPI stays neutral with regard to jurisdictional claims in published maps and institutional affiliations.

