Article

Responses of Cereal Yields and Soil Carbon Sequestration to Four Long-Term Tillage Practices in the North China Plain

1
Key Laboratory of Agricultural Water Resources, Hebei Key Laboratory of Soil Ecology, Center for Agricultural Resources Research, Institute of Genetics and Developmental Biology, Chinese Academy of Sciences, 286 Huaizhong Road, Shijiazhuang 050021, China
2
Department of Soil Quality, Wageningen University, P.O. Box 47, 6700 AA Wageningen, The Netherlands
3
College of Resources and Environmental Sciences, China Agricultural University, Beijing 100193, China
*
Author to whom correspondence should be addressed.
These authors contributed equally to this work.
Agronomy 2022, 12(1), 176; https://doi.org/10.3390/agronomy12010176
Submission received: 19 December 2021 / Revised: 8 January 2022 / Accepted: 10 January 2022 / Published: 12 January 2022

Abstract

:
Current tillage practices in the important winter wheat–summer maize double cropping system of the North China Plain are under debate because of negative effects on soil quality and crop yield. Therefore, a long-term experiment was conducted from 2001 to 2018 to determine the effects of soil conservation practices on crop yield and soil quality. The treatments were imposed following maize harvest and prior wheat seeding, and were defined as follows: (1) moldboard ploughing (0–20 cm) following maize straw removal (CK); (2) moldboard ploughing (0–20 cm) following maize straw return (CT); (3) rotary tillage following maize straw return (RT); and (4) no tillage with maize straw covering the soil surface (NT). Wheat straw was chopped and spread on the soil in all treatments and maize seeded without prior tillage. Wheat yields were higher in CT than RT and NT treatments (p < 0.05); NT had 18% lower wheat yields than CT. No significant differences were found between treatments in summer maize yields. The soil organic carbon (SOC) content in the surface layer (0–5 cm) was higher in NT and RT compared to CT and CK. However, SOC content in the 10–20 cm and 20–30 cm layers was lower in NT and RT compared to CT and CK. Similarly, available phosphorus in the surface soil was higher in NT and RT than in CT and CK. but the opposite was true for the lower soil layers. SOC stocks (0–30 cm) increased in all treatments, and were initially faster in NT and RT than in CT and CK. However, SOC stocks were higher in CT than in other treatments at the end of the experiment. This finding indicates that no tillage and reduced tillage decreased both wheat yields and soil C sequestration over time; it also indicates that CT was the most robust in terms of crop yields and soil C sequestration.

1. Introduction

Soil tillage is conducted for several purposes: to prepare a seedbed for the next crop, to incorporate crop residues and fertilizers into the soil, to suppress weeds and to improve the bio-physical structure of the soil [1]. However, conventional tillage practices are under debate because of the increased soil organic matter decomposition and associated declines in soil organic carbon (SOC) stocks, soil biota and soil biodiversity [2,3]. Tillage practices are also implicated in risks of subsoil compaction (plough pan) and soil erosion [4].
Conservation tillage is defined as a field management approach that minimizes the intensity and frequency of tillage operations so as to achieve agronomic and environmental benefits, including an improvement in soil bulk density, soil aggregate stability, water use efficiency, and nutrient utilization [5]. Indeed, conservation tillage may exert several beneficial effects, including a lower fossil energy use, greater SOC sequestration, and less soil compaction, erosion, and run-off [6,7,8]. Soil conservation includes different variants, including no tillage (NT) and reduced tillage (RT) or minimum tillage (MT), and these tillage practices can be combined, or not combined as the case may be, with crop residue mulching on the soil surface, crop rotation, cover cropping, and integrated pest and weed control practices. As a result, there is often a diversity in outcomes of soil conservation practices. For example, a meta-analysis of more than 600 field studies found that crop yields were significantly lower under no tillage compared to conventional till, when not combined with crop rotations and crop residue mulching [9]. Yet, other studies found higher yields [10,11], economic benefits [12] and improvements in soil physical properties [13] under no till. No tillage appears to be less appropriate for continuous wheat compared to wheat in rotation with, for example, legumes [14]. Further, the effects of conservation tillage on crop yields strongly depend on soil quality and climatic conditions [15]. Conservation tillage had positive effects on crop yields in arid regions under rainfed conditions [16,17]. Conversely, conventional tillage gave higher yields than conservation tillage in humid climates and under irrigation [9,18]. Thus far, there has not been an agreement on crop yield changes under conservation tillage.
Soil organic carbon (SOC) is the largest carbon pool in terrestrial ecosystem, and plays an essential role in supporting soil biodiversity and biological activity, nutrient cycling, as well as regulating climate change [19]. Conservation tillage was also promoted as an effective practice for increasing SOC [20,21]. However, some studies found that there were no significant differences in SOC storage between no tillage and conventional tillage, when differences in the depth distribution of SOC and soil bulk density are accounted for [22,23]. The SOC balance is determined by the inputs of organic C into the soil (through crop residues, straw, stubble, roots and root exudates) and the outputs from the soil (through decomposition of organic matter, erosion and leaching of dissolved organic C) [24]. Soil tillage and crop residue management practices directly affect the balance between organic C inputs and outputs. Inputs of organic C depend on crop type and rotation, crop residue management, and tillage. The leaching of dissolved organic C is also a soil C loss pathway, but is negligible in most common systems and field conditions [25], except for situations with high rainfall or excessive irrigation, peat soils and/or with high inputs of highly soluble C substrates [26].
The North China Plain covers an area of 35 million ha and has a population of 130 million people. It is one of the most intensively cultivated regions in China [27]. Approximately 70% of the cultivated land has a double cropping system of winter wheat and summer maize, with a no tillage and moldboard ploughing combination [28]. Moldboard ploughing is commonly applied to a depth of ~20 cm. Recently, rotary tillage to a depth of ~10 cm has also become common practice. Until the 2000s, straw was either used as animal feed and biofuel, or burned in the field. However, straw burning has been prohibited since 1990s (because of the smog); concentrates replaced straw as animal feed, while the increasingly used mechanization facilitated combine harvesting and straw chopping and return to the soil. As a consequence, the tillage and crop residue management changed. However, these practices increased the soil bulk density below 20 cm and created unfavorable growing conditions for wheat roots [29]. Hence, there is a continued search for improved tillage and straw management practices.
The main objective of this study is to determine the long-term effects of tillage and straw management practices on crop yield and soil C and nutrient accumulation in the winter wheat–summer maize double cropping system. We hypothesized that (1) replacing moldboard ploughing after the maize harvest by no tillage or rotary tillage may affect soil C sequestration, soil fertility, and thereby the crop yield in the long term, and that (2) removing maize straw from the field would not affect soil C sequestration much compared to maize straw return, because of the relatively large return of organic C via wheat straw, and the limited capacity of the soil to sequester C. We assumed that most SOC changes occurred in the 0–30 cm soil layer, because most of the roots of wheat and maize are in this layer and soil tillage and management practices mainly affect this layer [27,30]. Hence, soil sampling was limited to the top 30 cm of soil.

2. Materials and Methods

2.1. Experimental Site

The long-term experiment was conducted from October 2001 to June 2018 at the Luancheng Agroecosystem Experimental Station (37°53′ N, 114°40′ E; elevation 50 m) (Figure S3), which is located on the piedmont of the Taihang Mountains on the North China Plain. The Luancheng experimental station is one of the stations of the China National Ecosystem Observation and Research Network and the Global Terrestrial Observation System. The experiment had a common and continuous double cropping system rotation of winter wheat (Triticum aestivum L.) and summer maize (Zea mays L.). Each year in early June, the winter wheat is harvested and maize is planted; while in early October maize is harvested and winter wheat is planted. There is no fallow period. The soil is a sandy loam and classified as entisol, with a clay content of 14% [31]. The mean initial soil bulk density of the 0–20 cm layer was 1.53 g cm−3, and the SOC content was 0.90 g kg−1.

2.2. Experimental Design and Field Management

In 2001, three tillage and crop residue management treatments were implemented: the conventional practice of moldboard plowing, rotary tillage (RT), and no tillage (NT) following the maize harvests. In 2004, the moldboard plowing plot was split into two subplots with different residue management strategies: half of the plot had chopped maize straw incorporation into the tillage layer (CT) and the other half had the maize straw removed (CK). A summary of the tillage and crop residue management practices of the four treatments is presented in Table 1. There were three replications for each treatment. Plot size was 560 m2 (8 m × 70 m) for RT and NT and 280 m2 for CK and CT treatments.
At winter wheat harvest, wheat straw was mechanically chopped and evenly distributed on the soil surface as mulching material in all four treatments (common practice). At maize harvest, all straw was chopped and incorporated into the soil during tillage (common practice), except for the NT treatment where the straw was chopped and spread on the soil surface, and for the CK treatment where the straw was removed.
The fertilization and irrigation practices were identical in all four treatments and for both crops. Only urea and diammonium hydrogen phosphate (DAP) were applied. Before winter wheat sowing, the fertilizers were disseminated at a rate of 130 kg ha−1 of N and 121 kg ha−1 of P. However, DAP and urea were applied in bands at a depth of 5 cm in the seeding row of the NT treatment. In addition, both wheat and maize received 138 kg ha−1 of N as urea, shortly after jointing through top dressing. All plots received irrigation at sowing. Depending on rainfall and soil moisture condition, an additional three or four irrigations for wheat, and two or three irrigations for maize, were applied using a sprinkler system. Irrigation was applied when the soil moisture in the root zone declined to 60–65% of the field capacity. Generally, 400–500 m3 ha−1 water (40–50 mm) was applied in each irrigation.

2.3. Data Collection and Monitoring

2.3.1. Grain Yield

Wheat grain yields were measured in 3 m2 plots following harvesting and threshing (with a thresher). After harvesting, the straw was chopped and returned to the field. Maize grain yields were measured in 10 m2 plots; Plants were manually cut down 10 cm above the soil surface, dried and weighted at harvest time, while the ears from the plants were manually harvested and threshed. Grains were air-dried to a moisture content of 13%, and their weights were recorded to obtain the final grain yields. The yield of each plot was calculated as the equivalent yield of the whole field, by the unit of t ha−1.

2.3.2. Soil Sampling and Analyses

Soil samples were collected after winter wheat harvest in June every other year. Soil samples were taken by stainless steel rings of 100 cm3, at the depths of 0–5, 5–10, 10–20, and 20–30 cm, using the same auger hole. The rings with soil samples were transported within 5 h to a temperature-conditioned room (4 °C) and stored until further analysis. Content of soil organic carbon (SOC) was measured by dichromate oxidation and subsequent titration with ferrous ammonium sulfate [32].
Available soil P was measured by the hydrochloric acid–ammonium fluoride extraction/molybdenum antimony colorimetry method (P-Olsen); available soil K was measured by ammonium acetate extraction and flame photometry (K-exch); and available N in soil was measured by the alkali hydrolysis diffusion method [33]. Soil bulk density was measured by the core method (ASAE standard, 1984).

2.3.3. Carbon Input via Straw Return

The total carbon (C) input to the soil via straw return was calculated as:
C input = grain yield ∗ HI ∗ C content of straw
where HI is the harvest index; these values were determined for maize and wheat in 2005, 2007, 2008 and 2011. The average HI values for the CK, CT, RT and NT treatments for winter wheat were 0.50, 0.48, 0.47, and 0.47, respectively. The HI values for maize were 0.48, 0.47, 0.46, and 0.47, respectively. The C content of wheat straw was 0.41 g kg−1 and the C content of maize straw was 0.45 g kg−1, as derived from literature [25].

2.3.4. Weather Data

Daily weather data were obtained from a standard weather station, at approximately 50 m from the experimental site, and included the daily mean temperature, minimum temperature, daylight hours, and rainfall.

2.4. Statistical Analysis

All data collected were statistically analyzed using ANOVA to test differences among treatments in crop yield, OM, SOC, AN, AP and AK. The means of the treatments were compared using Fisher’s LSD method at the 0.05 probability level. All analyses were conducted using SPSS statistical software (version 11.0, SPSS, Chicago, IL, USA). All figures were performed with R studio (version 3.2.1) and Office 2010.

3. Results

3.1. Climatic Conditions

The mean temperature was 7.9 °C during the wheat season and 24.5 °C during the maize season (Figure S1). The average annual rainfall was 413 mm, with 60 to 80% during the maize season and 20 to 40% during the wheat season. The highest annual rainfall was 569 mm in 2008 and the lowest was 234 mm in 2016. The period from 2014 to 2018 was relatively dry and warm.

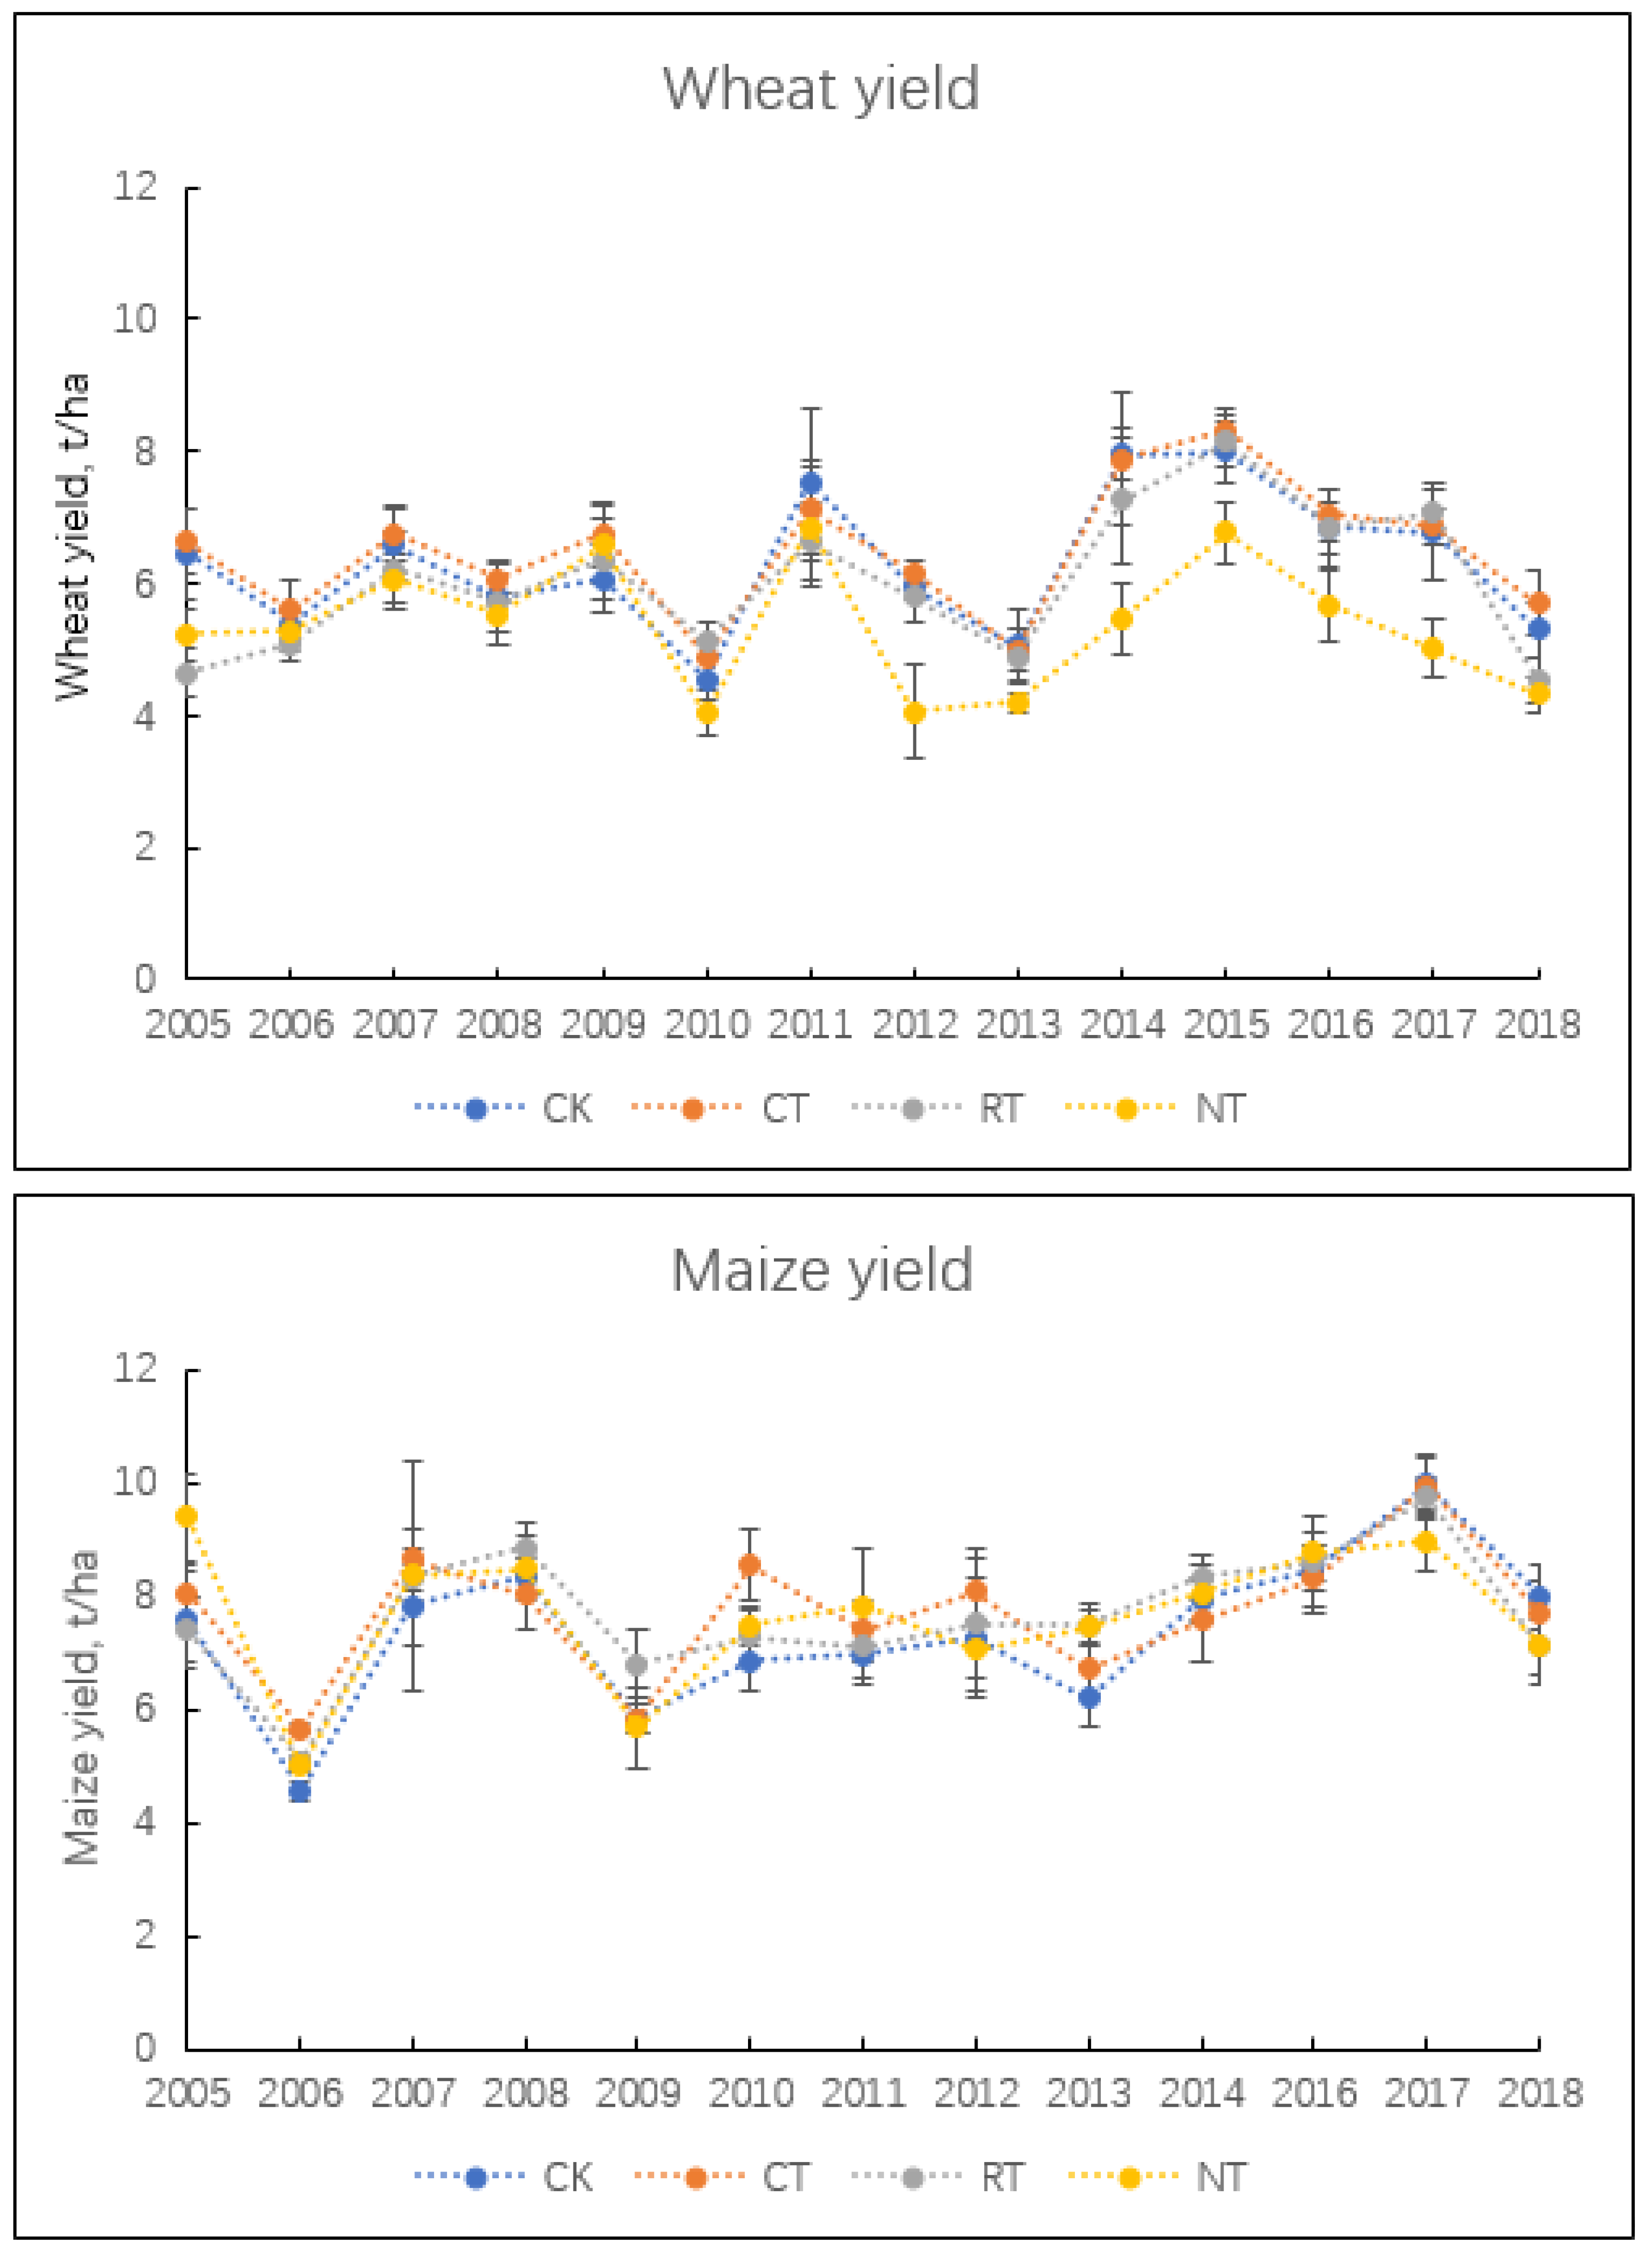
3.2. Wheat and Maize Yields

From 2005 to 2018, grain yields for winter wheat ranged between 4 and 8 Mg ha−1, while grain yields for summer maize ranged between 5 and 10 Mg ha−1 (Figure 1). The yield of winter wheat was significantly affected by tillage treatment and the experimental year. In addition, there was a significant interaction between Tillage and Year (Table 2). There were no significant trends in yield over time.
Mean wheat yields were significantly higher in the CK, CT and RT treatments than in the NT treatment (p < 0.05, Table 2). Furthermore, mean wheat yield was higher in CT than in RT (p < 0.05, Table 2). There were no significant differences between CK and CT, indicating that maize straw removal/return had no effect on wheat yield (Figure 1). Mean maize yields did not differ between treatments (p > 0.05, Table 2). Differences between treatments in mean yields were ≤0.3 Mg ha−1.

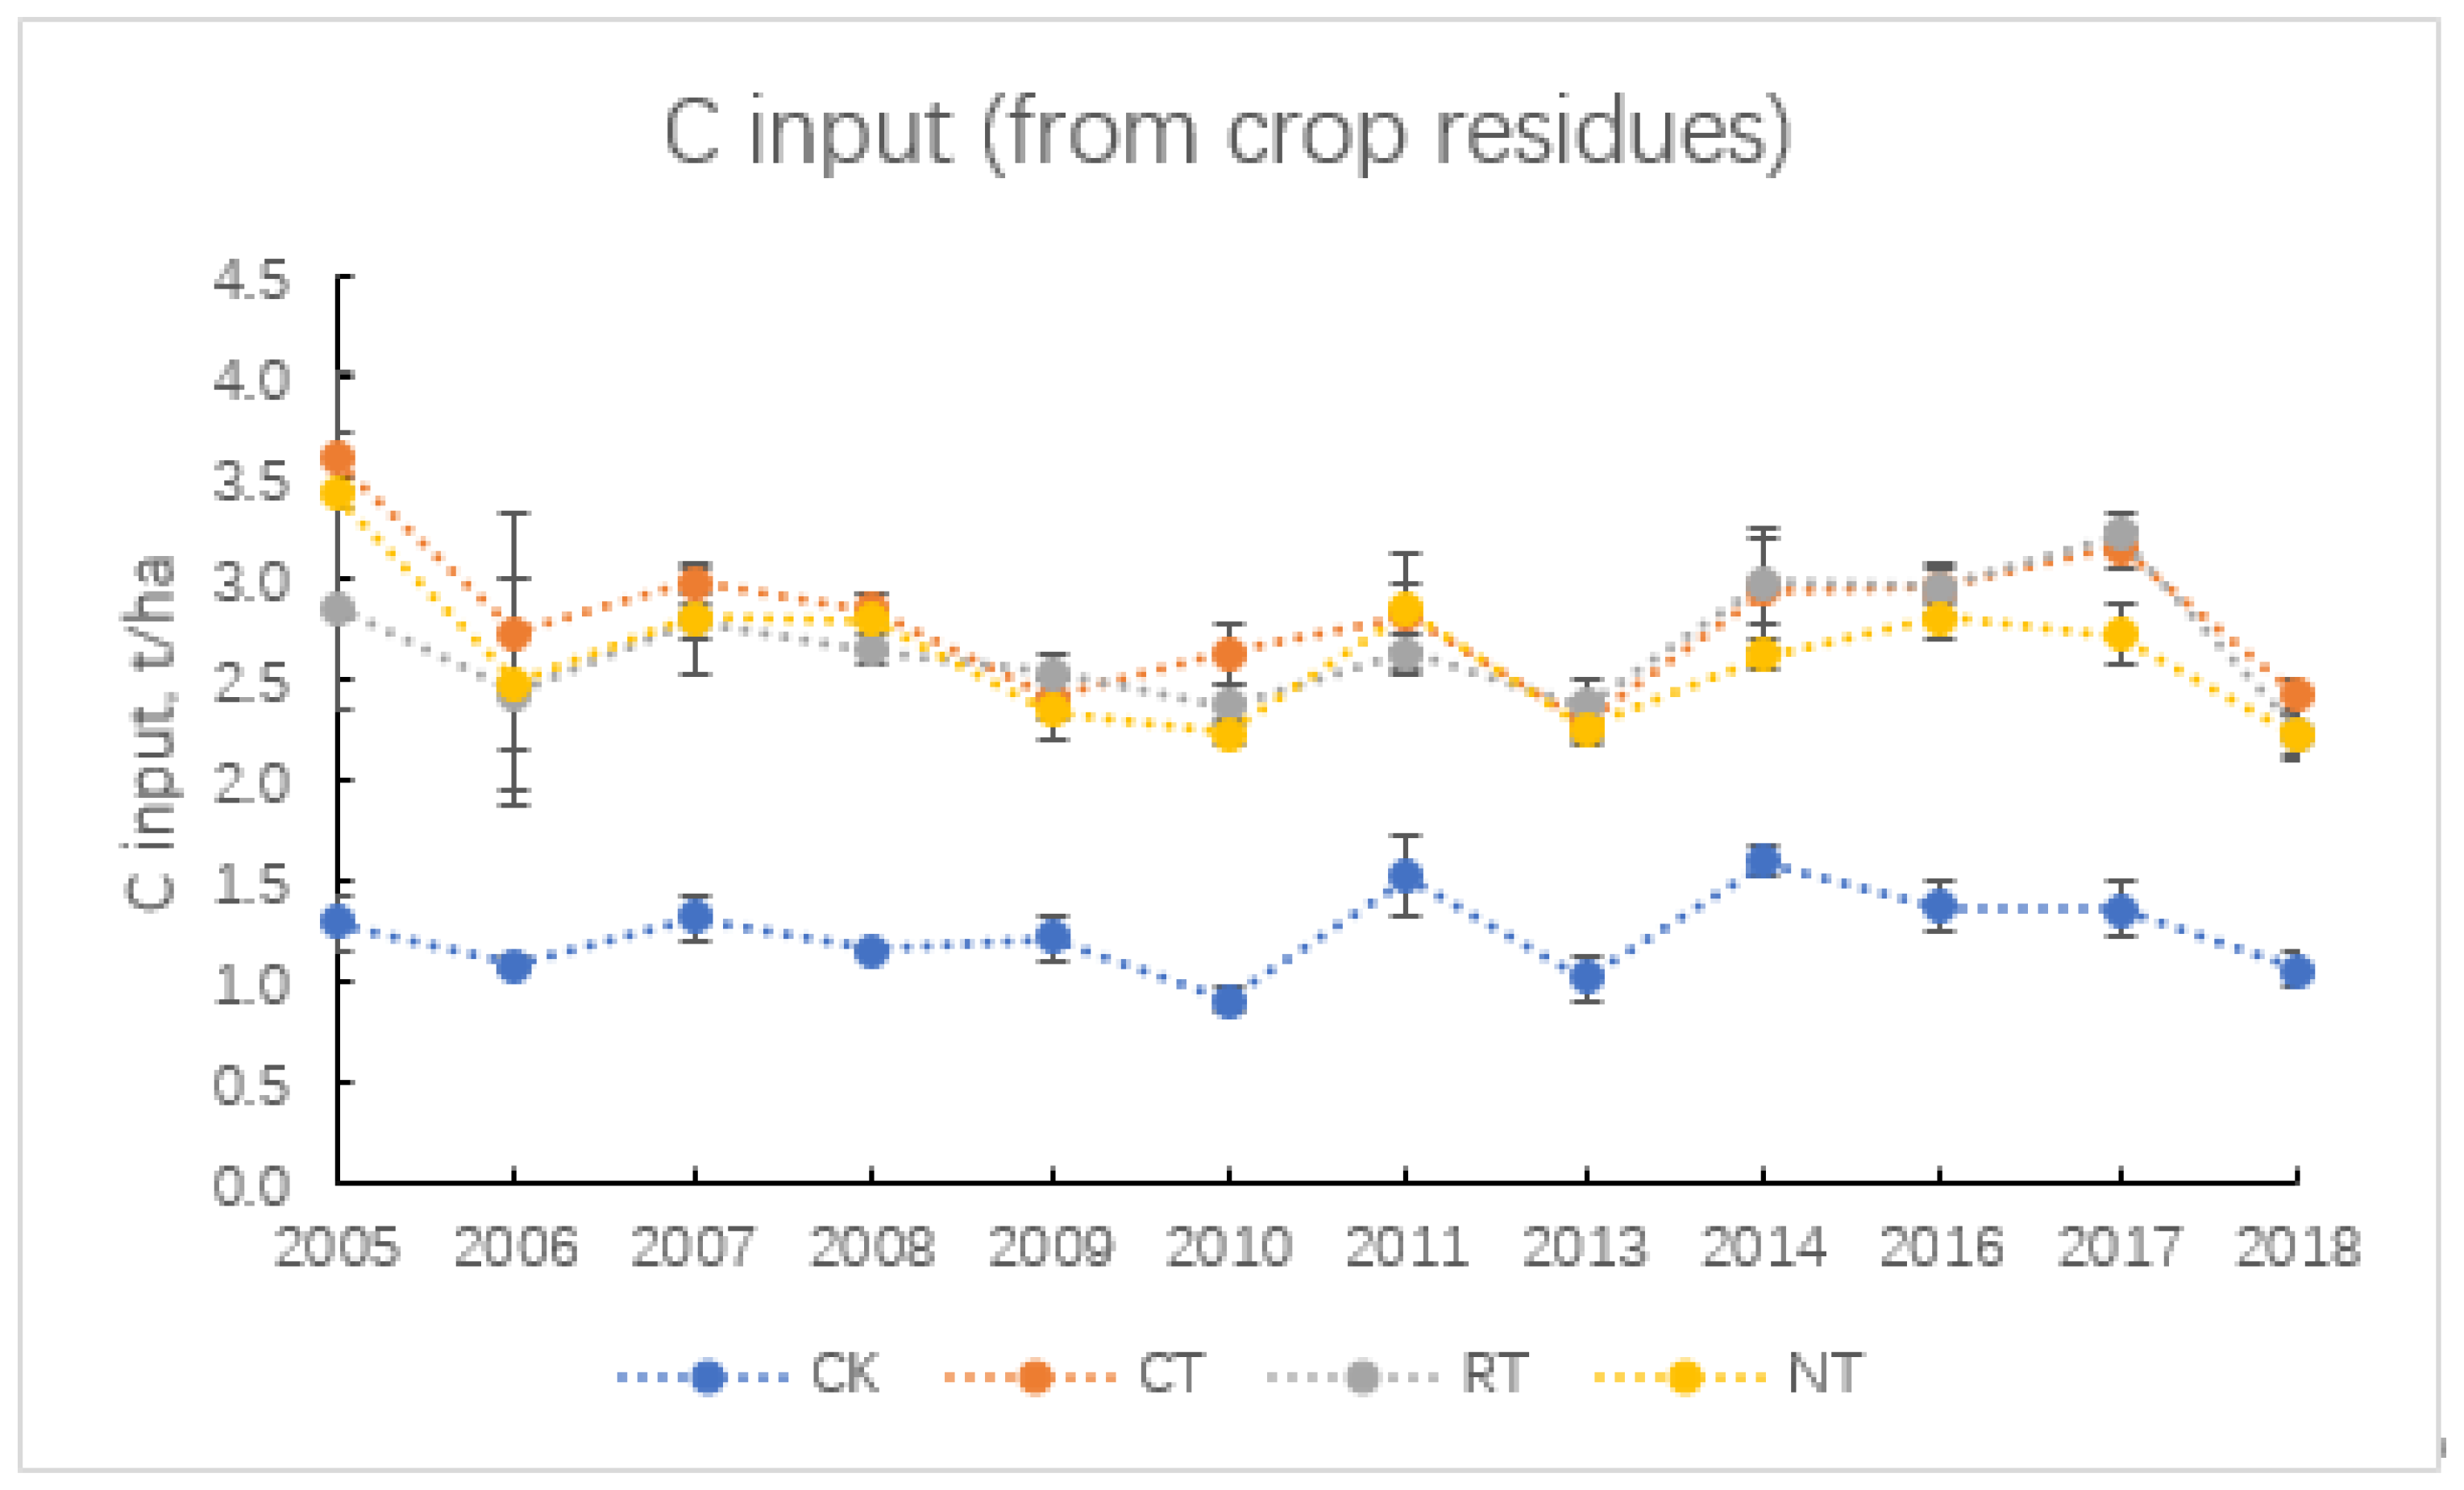
3.3. Total Carbon Input from Straw Return

The annual C input via straw return roughly ranged between 2.5 and 3.0 Mg ha−1 for the CT, RT and NT treatments, and between 1.0 and 1.5 Mg ha−1 for the CK treatment (Figure 2). The mean annual C input at the CK treatment (1.25 Mg ha−1) was significantly lower than at the other three treatments (p < 0.001, Table 2), while the mean annual C input at the CT treatment (2.83 Mg ha−1) was significantly higher than those at the other three treatments (p < 0.05). There were no significant differences between RT and NT treatments.

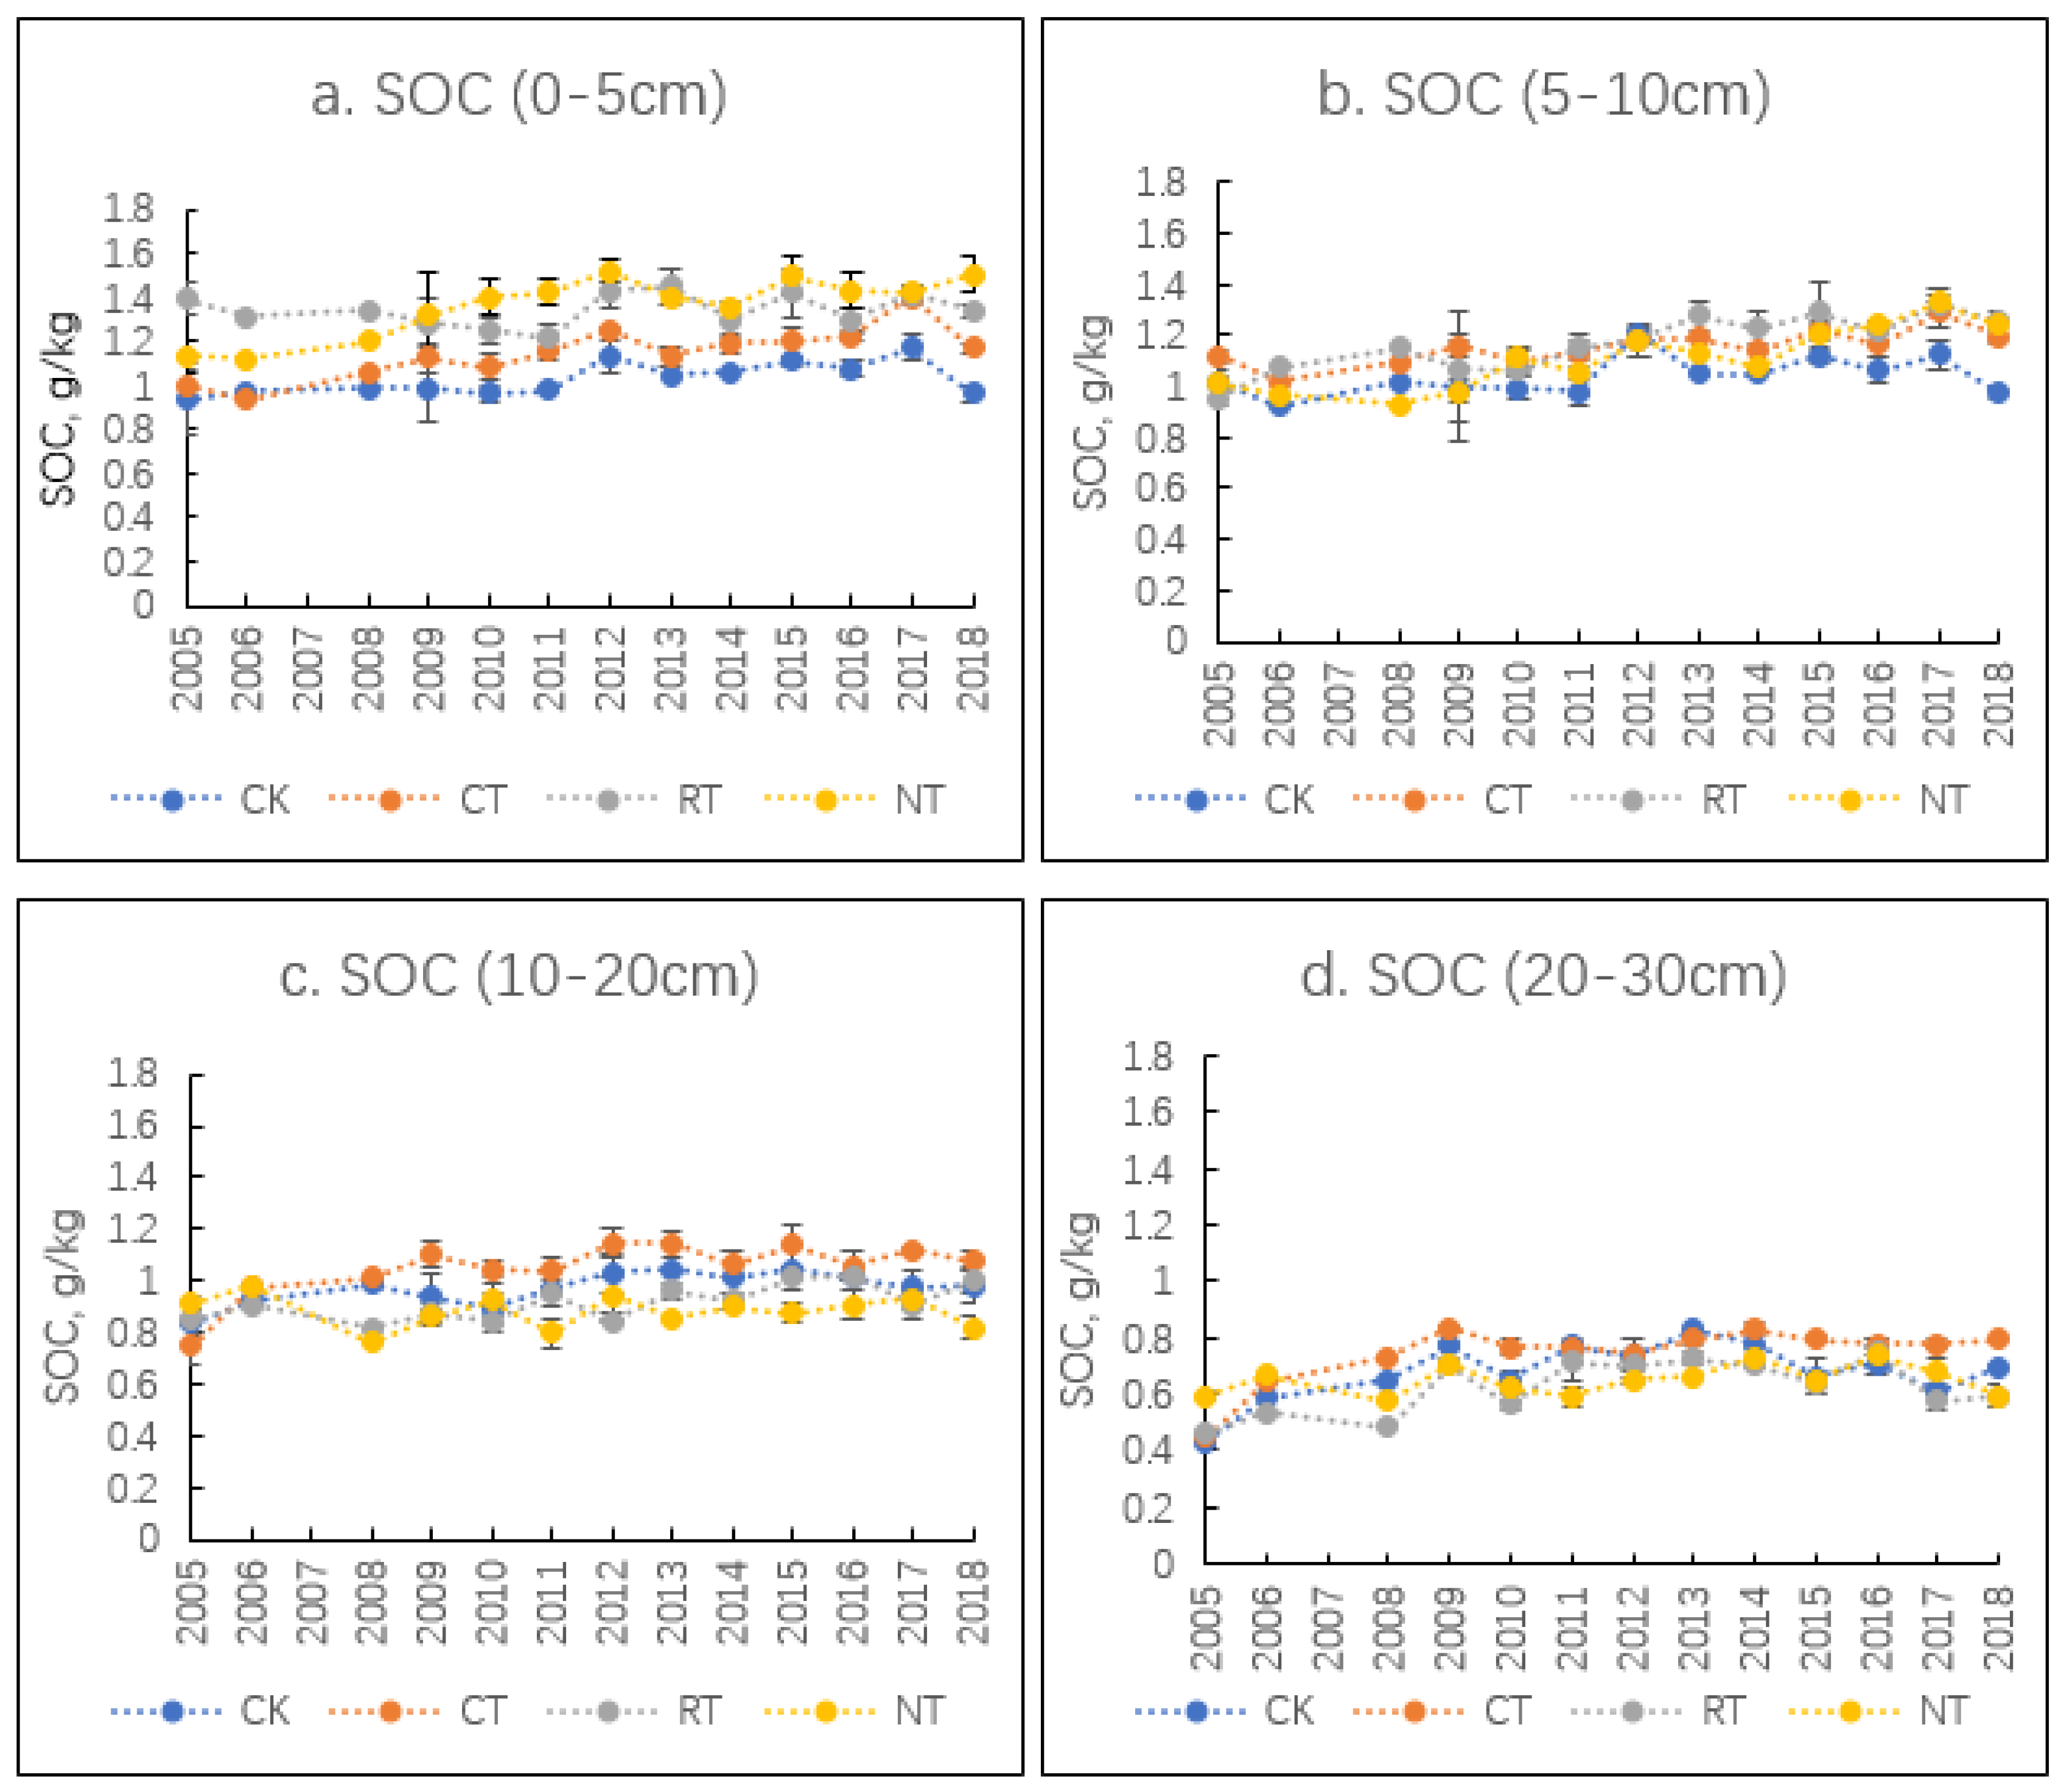
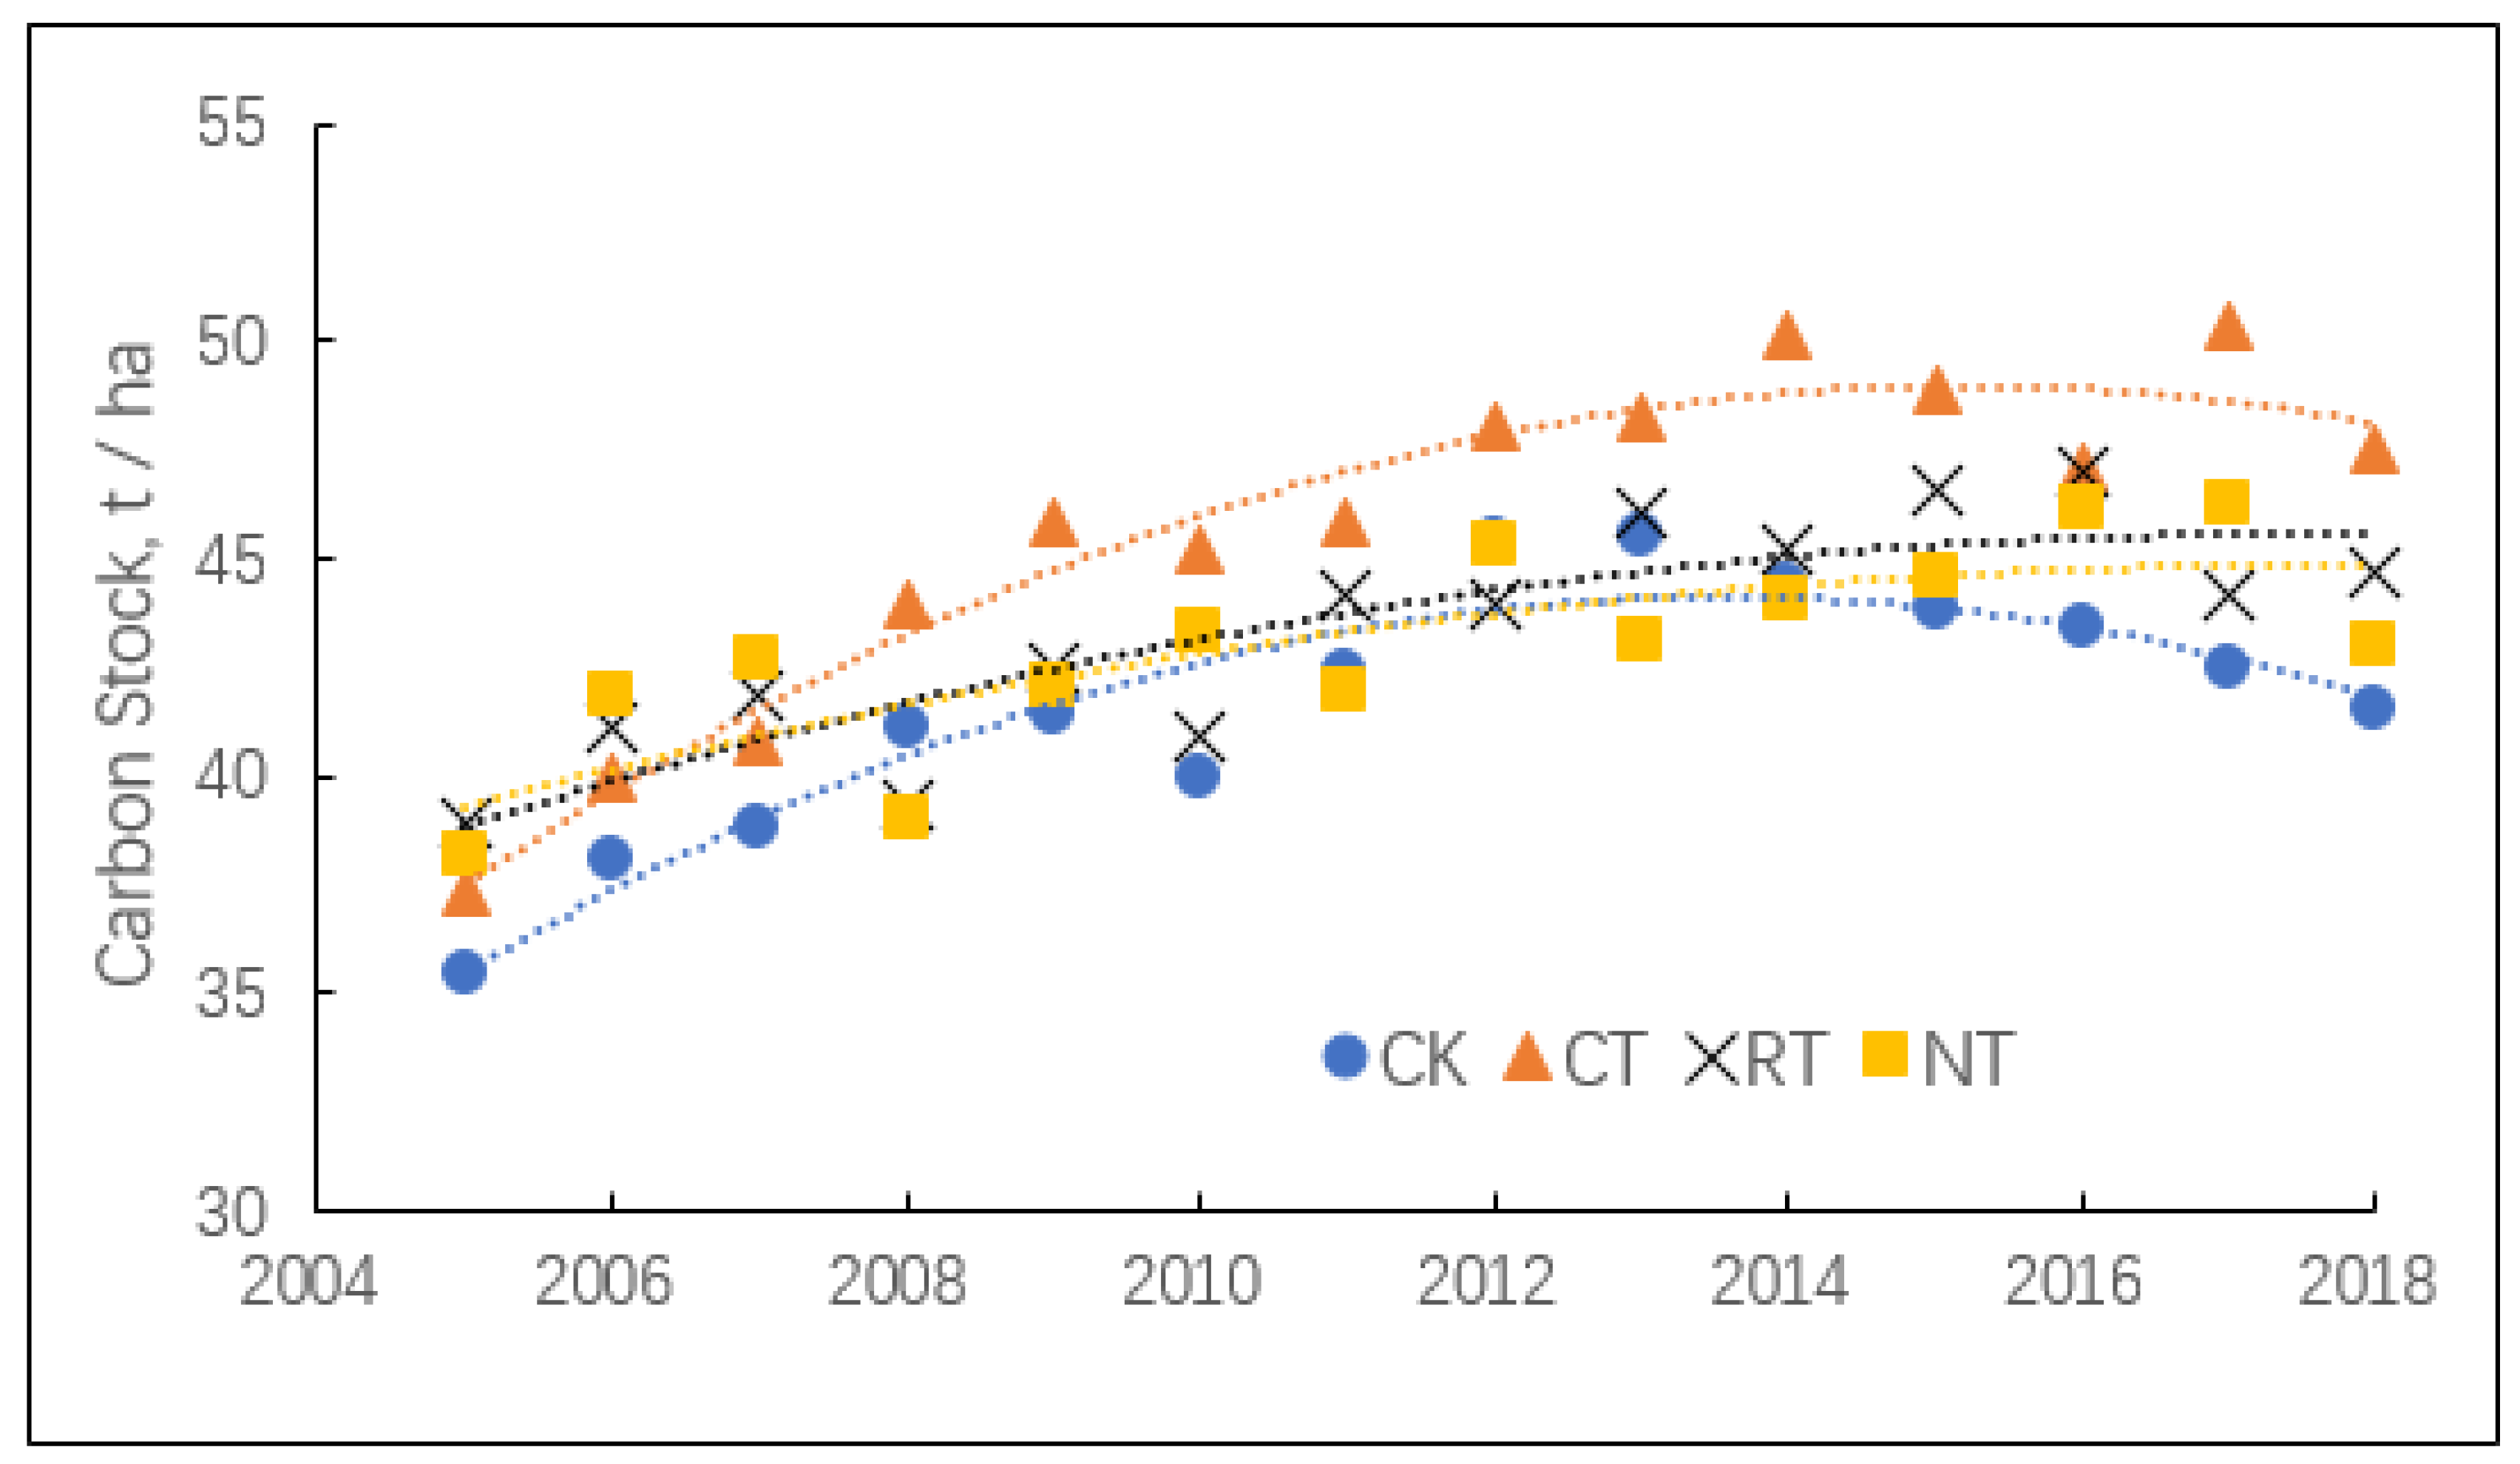
3.4. Soil Carbon Content and Sequestration Rates

Soil organic C (SOC) content increased in all treatments and all soil layers during the experimental period (Figure 3). The mean SOC content decreased with depth and the rate of increase also decreased with depth. In the surface layer (0–5 cm), SOC content of NT treatment increased by 34% between 2005 and 2012, and then remained more or less constant at a level of 1.45 g kg−1 (Figure 3). Note, that some differences in SOC content of the surface soil layer were already induced during the years 2001–2005, especially in the RT and NT treatments.
Stocks of SOC in the 0–30 cm soil layer increased rapidly from 2004 to 2012, Thereafter, the rate of increase slowed down in all treatments (Figure 4). The CT treatment had higher levels of SOC stocks than the other three treatments from 2008 onwards, and reached 50 t/ha in 2018 (Table 3). The NT treatment had the highest C sequestration rate (0.99 kg ha−1 a−1) during the first years (2001–2006), followed by the RT treatment (0.94 kg ha−1 a−1), while CT treatment had the lowest C sequestration rate (0.56 kg ha−1 a−1). However, the C sequestration rate continued to increase in the CT treatment, while the C sequestration in the RT and NT treatment slowed down during the period 2006 and 2018. As a result, the mean C sequestration rate was much higher in CT treatment (0.69 kg ha−1 a−1) than in the RT and NT treatments (0.49 and 0.36 kg ha−1 a−1, respectively) between 2001 and 2018 (Table 3). The CK treatment had the lowest mean C sequestration rate (0.25 kg ha−1 a−1).

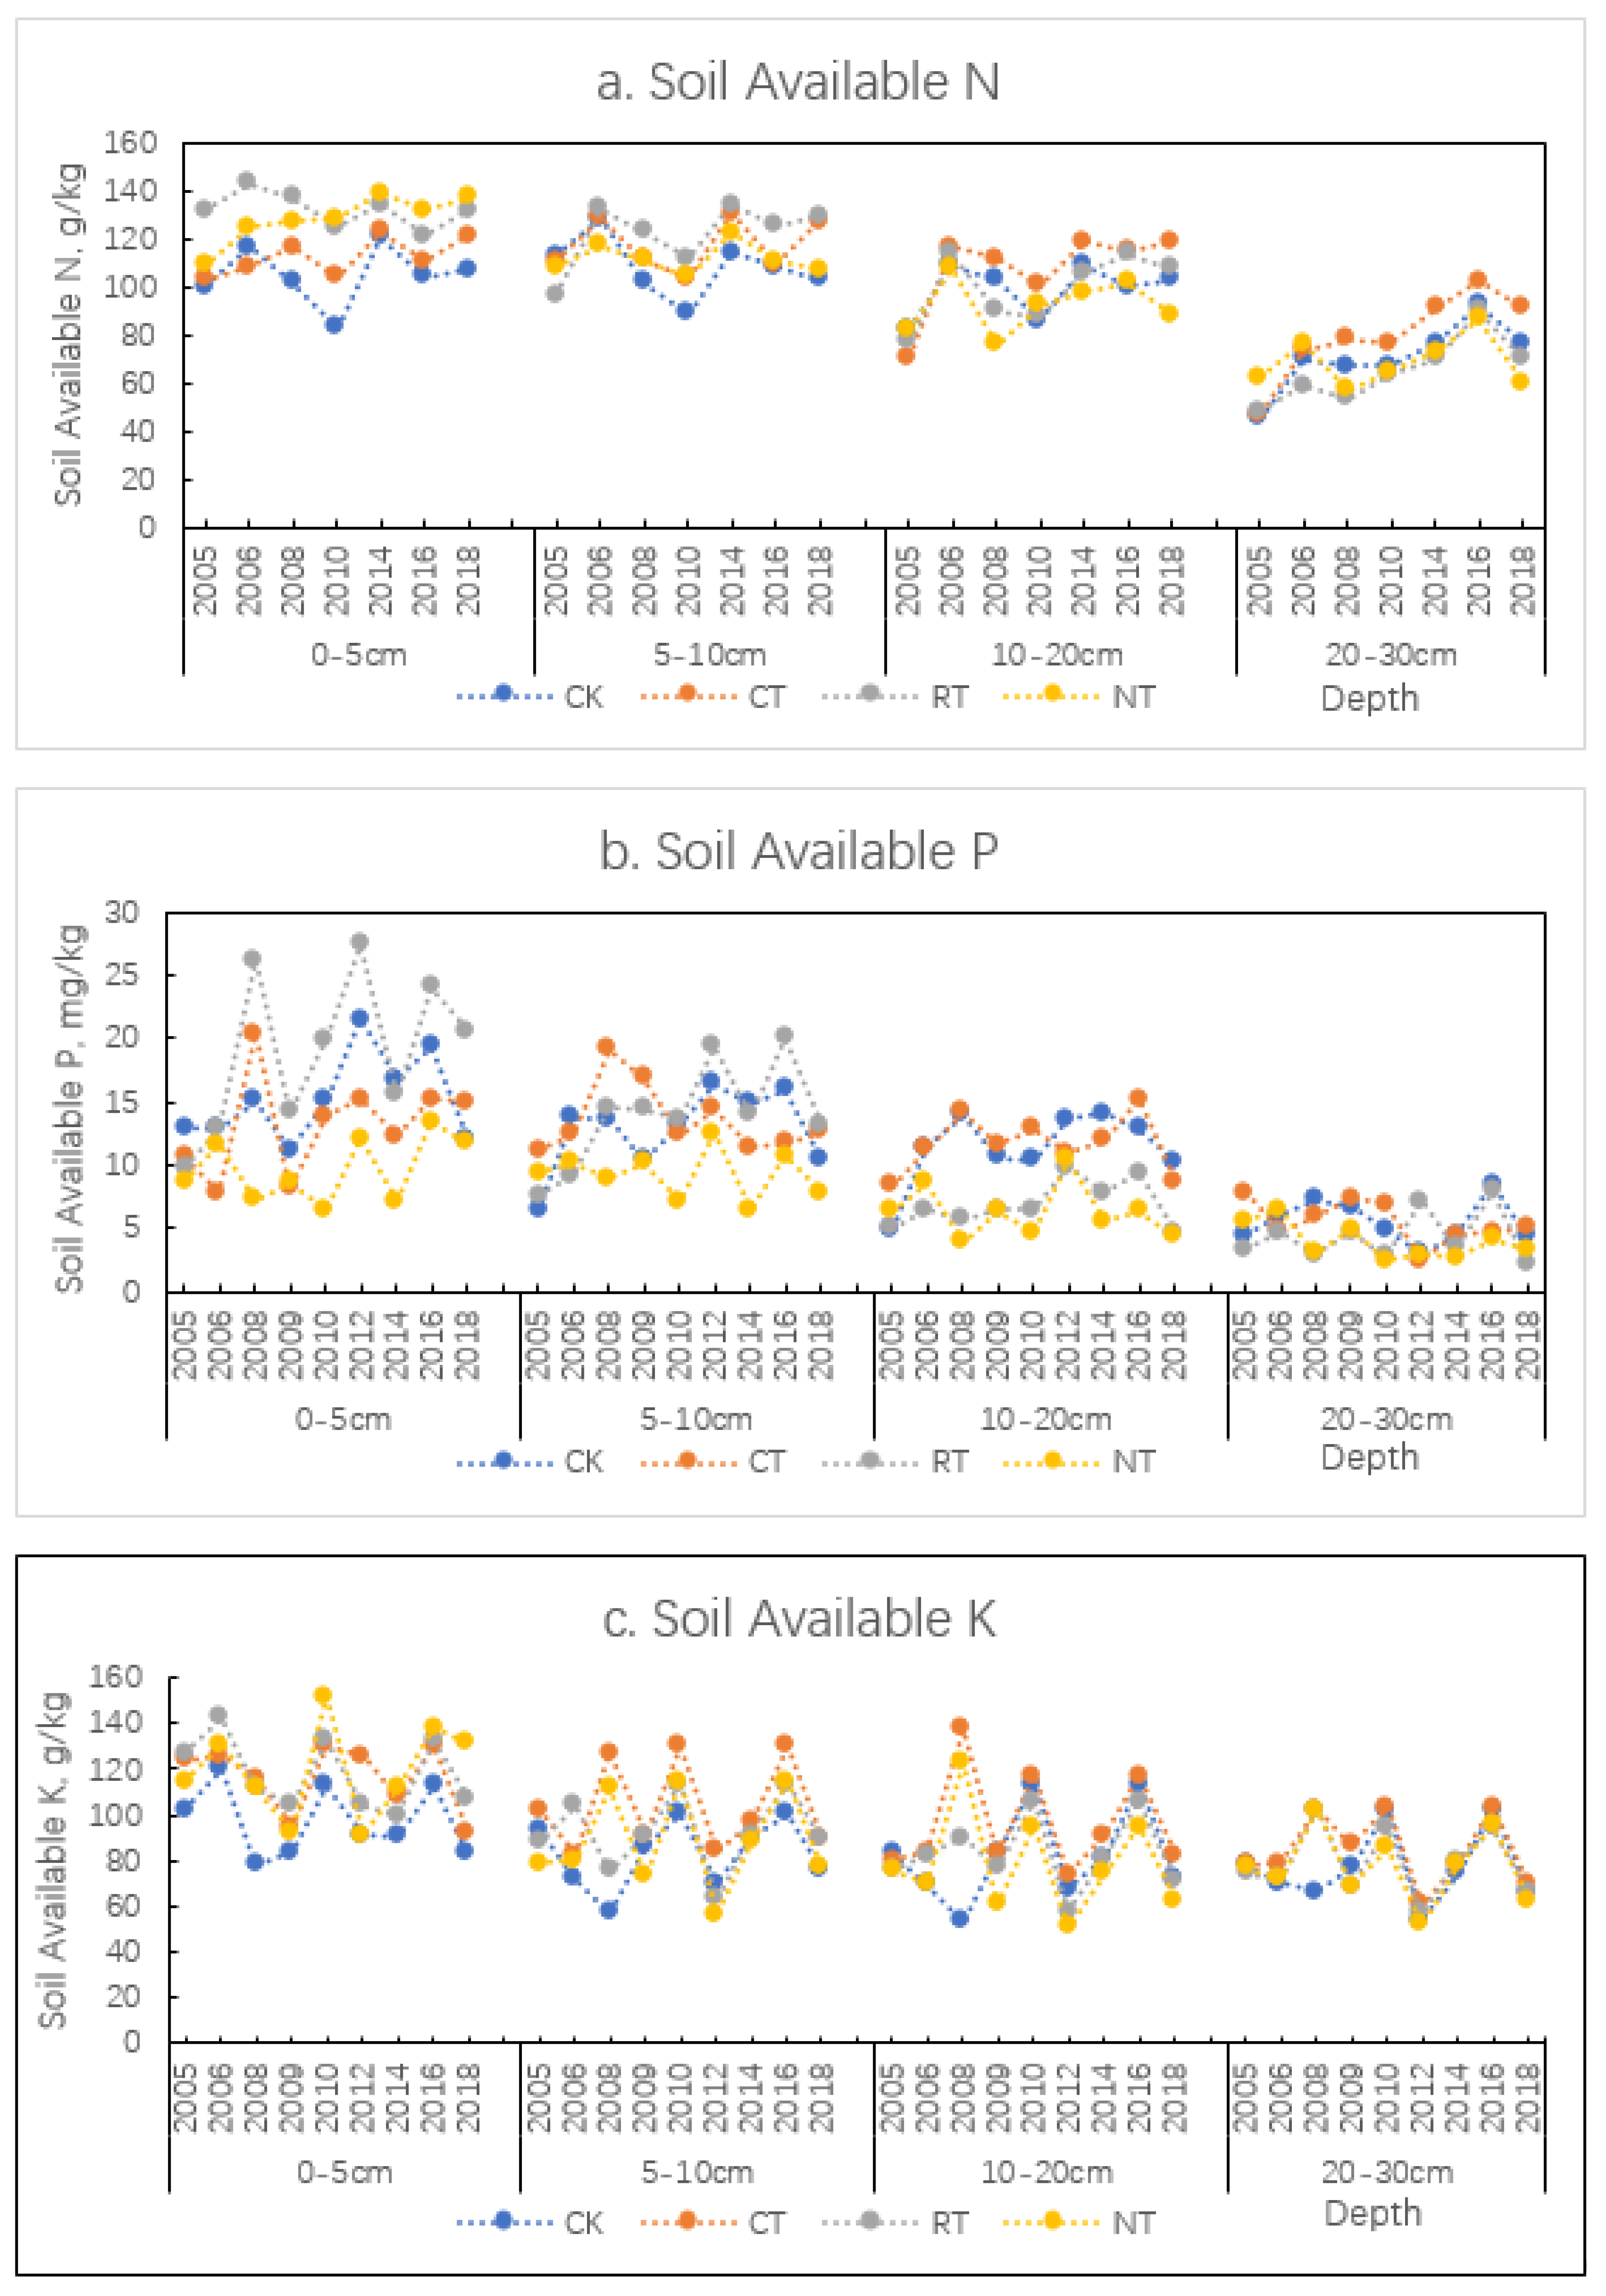
3.5. Available Soil Nutrients

The available soil N (AN) remained more or less constant during the experimental period and did not differ much between treatments (Figure 5a). It decreased slightly with depth. The RT and NT treatments tended to have the highest AN content at a depth of 0–5 cm depth, and the lowest AN content at a depth of 20–30 cm, compared to the CK and CT treatments.
The available soil P (P-Olsen) exhibited large inter-annual fluctuations, especially in the top 5 cm of the soil, but showed no clear trends over time; it decreased with increasing depth. The treatments, RT and CK, tended to have the highest AP content at a depth of 0–5 cm (Figure 5b).
The available soil K (K-exch) also displayed relatively large inter-annual fluctuations, but without clear trends over time. AK decreased with increasing depth. There were no clear differences between treatments in AK (Figure 5c).
The ratios (wt/wt) of AN, AP and AK displayed some clear patterns (Figure S2). The mean ratio of AP/AN strongly decreased with increasing depth, suggesting a relative accumulation of P in the topsoil. The ratio of AK/AN was within a narrow range of 0.8 to 1.0 for all four depths, suggesting a similar availability and mobility of N and K. The ratios of AP/AN were relatively low in NT. Conversely, the ratios of AK/AP were relatively high in NT and low in CK and CT. This is the opposite to our expectations, as it suggests no preferential accumulation of P in the surface soil of NT (no tillage).

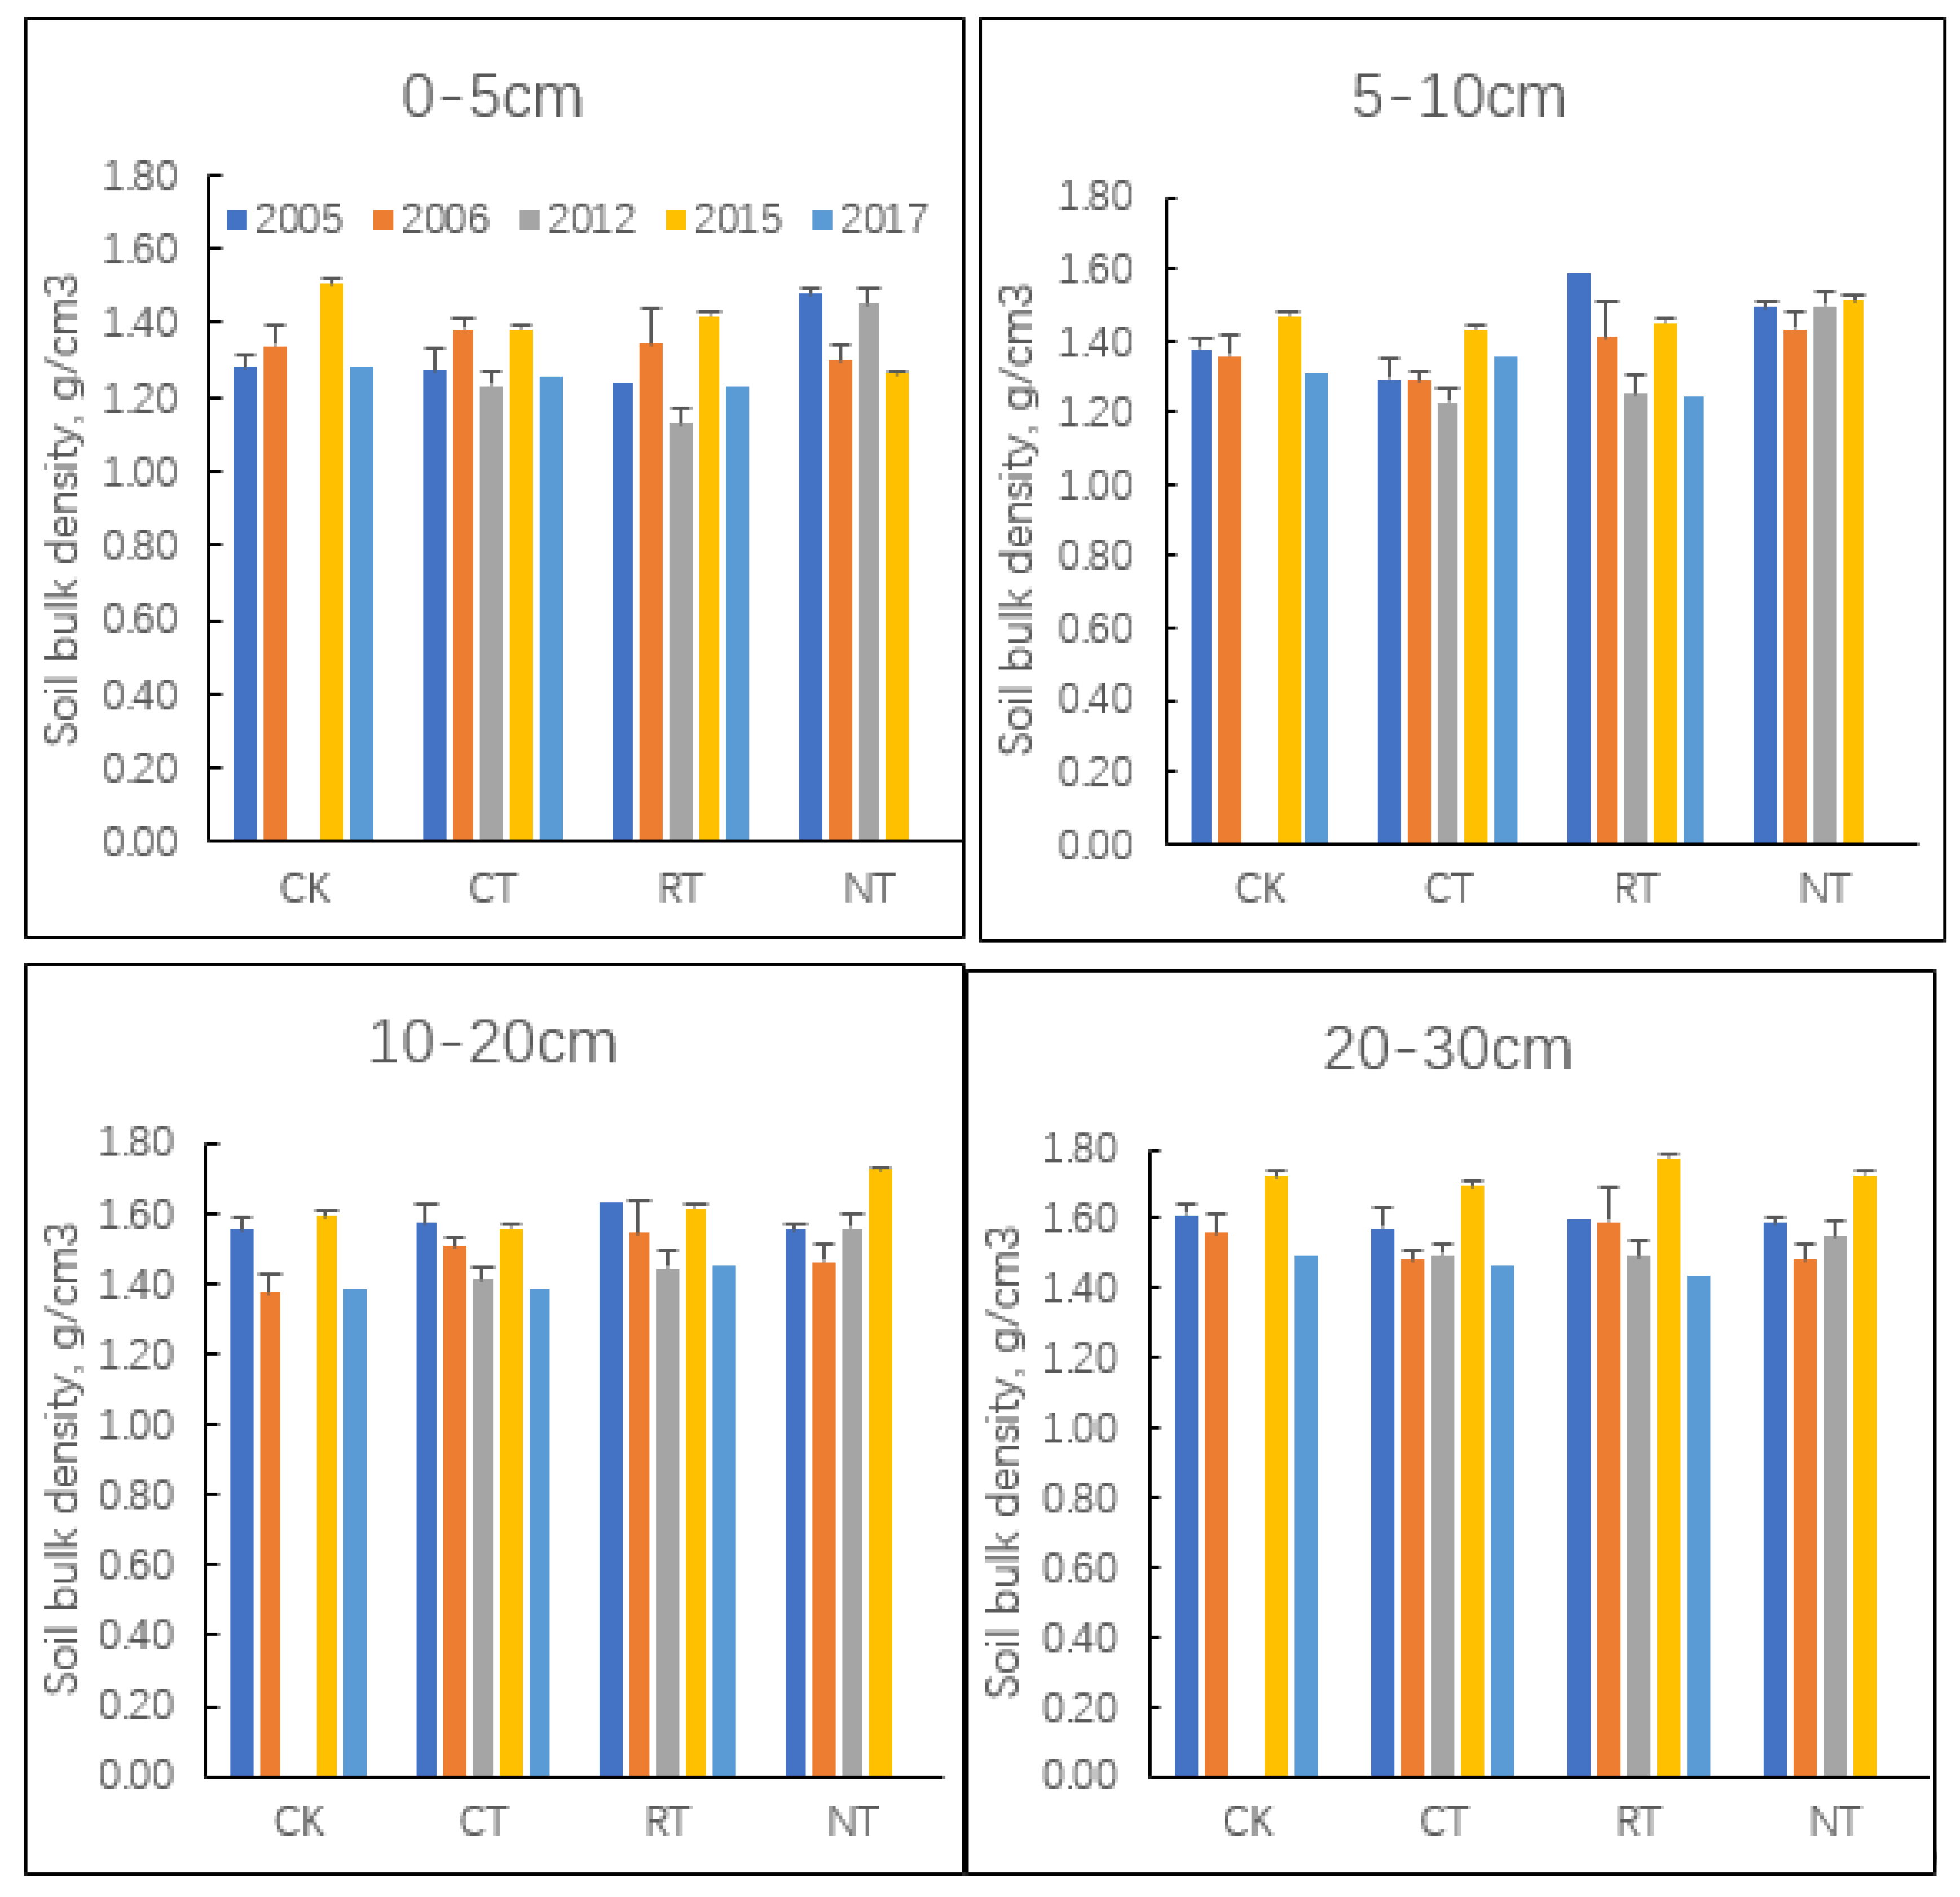
3.6. Soil Bulk Density

Soil bulk density ranged between 1.2 to 1.4 g cm−3 in the 0–5 cm soil layer and between 1.5 to 1.8 g cm−3 in the 20–30 cm soil layer (Figure 6). Hence, bulk density increased with depth. The inter-annual variations were larger than the differences between treatments. There were no clear trends over the time. The relatively high bulk density in the 20–30 cm layer, and to a lesser extent in the 10–20 cm soil layer was observed in all treatments, suggesting that this high bulk density was not related to the tillage treatments.

4. Discussion

4.1. Depth-Distributions of Carbon and Nutrients in Soil

The winter wheat–summer maize double cropping system of the North China Plain is productive, also providing much straw and stubble [34]. Crop yields increased steadily during the last few decades, through the use of improved germplasms, fertilizers and pesticides [35]. Until recently, straw from the double cropping system was used as animal feed and biofuel, or burned in the field [36], indicating that the soil C stock was replenished by input from stubble and roots only. However, the traditional mixed-crop livestock farm has rapidly disappeared during the last few decades (e.g., [37], and is being replaced by specialized livestock farms, which use mainly concentrated feed and little or no straw, and specialized crop production systems that produce for the market. Additionally, the use as biofuel has rapidly decreased, because a ban on crop residue burning, both in the field and in the homestead [38], was introduced from 2000 onwards; many farmers are still struggling to manage maize straw. As a result, increased amounts of crop residues are available to feed the soil and SOC stocks increased in the North China Plain during the last few decades [39,40]. This is also apparent in the results of our experiment; SOC stocks increased in all treatments but with large differences between treatments (Figure 4).
There are two possible main reasons for the relatively high soil C sequestration. First, the soil was ‘carbon deficient’ due to thousands of years of conventional soil cultivation and cropping in the North China Plain [41], concomitant with straw removal (for use as biofuel or animal feed) or straw burning. Secondly, increasing amounts of crop residues have become available due to the increasing crop yields in recent decades, increasing the return of crop residues to the soil. This suggest that SOC sequestration rates were strongly influenced by changes in C inputs over time.
Tillage treatments significantly affected the depth distribution of C in soil, and to a lesser extent, the depth distributions of AN, AP and AK. Our results support the claim that, especially no tillage (NT) and reduced tillage (RT) combined with straw return, lead to the enhanced stratification of SOC compared to the conventional practice (CK treatment) of annual moldboard ploughing and the removal of maize straw.
The SOC content of the 0–5 cm soil layer, and to a lesser extent, of the 5–10 cm soil layer were higher in RT and NT than in CK and CT treatments, while the opposite was true for the 10–20 and 20–30 cm soil layers (Figure 3). This difference in SOC stratification with depth is likely the combined result of (i) a difference between treatments in tillage following the maize harvest; (ii) maize straw removal in the CK treatment; and (iii) lower wheat yields in the NT, to a lesser extent in the RT treatment, compared to the other treatments [42,43]. The SOC content of the 10–20 and 20–30 cm soil layers were significantly higher at the CT treatment than at the RT and NT treatments at the end of the experiment. This suggests that the difference between CT and RT/NT in crop yield and associated root biomass was an important factor for the difference in content SOC between the 10–20 and 20–30 cm soil layers.
The relative enrichment of AP in the 0–5 and 5–10 cm soil layers and the relative depletion of AP in the 10–20 cm of the NT and RT treatments compared to the CK and CT treatments reflect the low mobility of P in soil. Phosphorus is mixed through the soil by soil cultivation and possibly bioturbation, but little by leaching and diffusive transport. These results are consistent with results of previous studies showing that AP was concentrated in surface soil under conservation tillage management due to lower soil disturbance [44,45]. The relative enrichment of P in the soil surface layers was also attributed to the retention of P in the accumulated SOC [46,47]. Though this is probably also true for our experiment, the greatest enrichment of AP in the surface layers of the NT and RT treatments likely resulted from the surface application of the DAP fertilizers, although DAP was applied in bands at a depth of 5 cm in the NT treatment. The annual application of 121 kg P ha−1 exceeded the withdrawal of P with harvested wheat and maize (not shown), indicating that there was a continuous enrichment of P in the soil. However, this was not clearly reflected in the results of the AP analyses.
There were no significant differences between the tillage treatments in the AK content, which confirms that the tillage method has little or no influence on the distribution of extractable K [48,49]. Relative increases in exchangeable K in soil surface layers of the RT and NT treatments may be related to the release of K from K-rich straw and stubble [50,51]. The relative low content of AK in the CK treatments supports this, as the maize straw was removed from the field in this treatment (Figure 5).

4.2. Responses of Maize and Wheat Grain Yields to Tillage Treatments

Earlier reports indicate that no-tillage agriculture decreased wheat yields in the North China Plain [52,53] and elsewhere [54,55], dependent on crop rotation and crop residue management. Our results support this conclusion, indicating that no tillage lowers wheat yields not only in rainfed conditions but also under irrigation. However, wheat yields of the NT treatment were similar to those of the CT and RT treatments during the first years (Figure 1), indicating that the negative effect of NT on wheat yield developed over time. We do not exclude the possibility that a lower soil temperature in the NT treatment, compared to the other treatments, played a role in reducing wheat yields [56,57,58]. A poorer germination and tillering due to soil compaction at a depth of 5–30 cm, and a poorer access of wheat roots for the applied nutrients, may also have played a role. We noticed that the growth and development of the wheat plants were delayed in the NT treatment compared to the other treatments (not shown).
No tillage and the surface mulching of crop residues may reduce soil evaporation, and thereby conserve soil water in dryland agriculture, and as a result may enhance crop yield. However, available soil moisture was not a limiting factor in our study because of the imposed irrigation management. It was observed that the wheat yield decline with no tillage was relatively large at low rates of fertilization [23,59,60]. Though the N and P fertilization rates were relatively high (common practice), Olsen P was relatively low (5 to 12 mg/kg) in the soil of the NT treatment (Figure 5), and this may have contributed to the relatively large wheat yield decline in the NT treatment. Amounts of AN and AK did not differ much between treatments (Figure 5).
Maize yields were not affected by tillage treatments (Figure 1). This was in contrast with results of previous studies, which revealed that no tillage had a relatively large depressive effect on maize yields [9,61,62]. However, our tillage treatments were imposed after the maize harvest and before wheat seeding, while no tillage with surface mulching was applied at all treatments after the wheat harvest and before maize seeding. Evidently, the tillage treatments did not have a direct effect on maize. There are three additional possible reasons why NT (and RT) had greater effects on wheat yields than on maize yields. First, maize is less sensitive to a compacted subsoil than wheat because of its shallow root system (and the ample supply of irrigation water and fertilizer N and P). For example, Zhou et al. [63] found that 75% of maize roots and 45% of wheat roots were in the topsoil. They also found that winter wheat was able to use, on average, more subsoil nitrogen than summer maize. Second, maize was planted during the hot summer season and wheat during the cold winter season; as a consequence, soil temperature was not a limiting growth factor for maize. Third, the mineralization of organically bound nutrients was enhanced during the warm and humid summer season, thus alleviating any shortage of nutrients under NT conditions. Gross N mineralization is strongly related to temperature, and the difference between NT and CT was weakened in the maize season [64]. Hence, there were no shortages of available nutrients in the NT treatment during the maize growing season.

4.3. Carbon Stock and Sequestration Rate

The sequestration of SOC in the 0–30 cm layer was larger in the CT treatment than in the NT and RT treatments at the end of the experiment (Figure 4). This contrasted with the results reported by Powlson et al. [65] and Corbeels [66], indicating that NT leads to a higher SOC stock than CT. Indeed, SOC stocks were larger in NT initially, but the sequestration of SOC slowed down in the NT treatment compared to the CT treatment. Corbeels [66] observed that SOC stocks were higher in NT than in CT treatments in the Cerrado of Brazil for the first 11 to 14 years, but that the differences between NT and CT in SOC stocks were negligible thereafter. A meta-analysis by West and Post [67] revealed that soil C sequestration lasted for approximately 20 years following the adoption of NT. In the current study, enhanced SOC sequestration under NT lasted only for a relatively short period. We speculate that the short duration of the enhanced SOC sequestration in the NT treatments may be related to the relatively large amounts of biomass returned to the soil in our double cropping system. There was essentially no increase in SOC content in the 0–5 cm soil after 2010 (following 8 years of NT adoption), indicating that a new steady state was attained, thus limiting the soil’s capacity to accumulate more SOC in the soil surface layers.
The differences among tillage treatments in SOC sequestration likely resulted from the differences between treatments in C input, decomposition rates, and physical protection of C in soil. Ogle [68] suggested that when C inputs declined by more than 15% following NT, C stocks would also decline. The average annual C input from aboveground crop residues was slightly higher in the CT treatment than in the RT and NT treatments, but the differences were not statistically significant (Table 2). Interestingly, the total C stock also increased in the 0–30 cm soil layer of the CK treatment; the total SOC stock in the CK treatment was only slightly lower than those in the RT and NT treatments, despite the removal of the maize straw in the CK treatment (Figure 4). These results indicate that the removal of the maize straw had only a relatively small effect on the SOC stock in the end.
Tillage may destroy soil aggregates, thereby enhancing the decomposition of organic material by microorganisms. Tillage also incorporates crop residues in the soil and partially in the subsoil, and may facilitate the downward growth of crop roots into the subsoil. This may enhance SOC sequestration in the subsoil because the rate of decomposition of organic matter is lower in the subsoil than in the topsoil due to a lower aeration and temperature.

5. Conclusions

This study evaluated the changes in crop yields, and in soil carbon and nutrients stocks in a winter wheat–summer maize double cropping system, with four different tillage practices imposed after maize harvests over a 17-year period. The average winter wheat yields were 18% lower under no tillage (NT) and 6% lower under reduced tillage (RT) than under conventional moldboard plowing (CT) during 2005 to 2018. Initially, NT and RT treatments rapidly increased the content of SOC in the soil surface layers, but after 17 years of SOC content was higher under the CT treatment than the NT and RT treatments. Therefore, no tillage and reduced tillage decreased both wheat yields and soil C sequestration over time. Hence, our hypotheses were both rejected. Tillage treatments did not significantly affect maize yields.
Tillage treatments influenced the distributions with the depth of available N, P and K. The AP/AN ratio in the 0–5 cm soil layer was relatively high at NT and RT treatments and low at CT and CK treatments. The AK/AP ratio was relatively high at NT and RT treatments and relatively low at CK treatments. These differential accumulations of available soil nutrients, together with a relatively high bulk density of the subsoil, may affect the nutrition of crops in the long-term, and may contribute to the relatively low winter wheat yield in the NT treatment in the double cropping system. Therefore, the dynamics of soil nutrients in different soil layers must be considered in studies evaluating the effects of tillage on soil carbon sequestration and crop yield under different regional climatic conditions.

Supplementary Materials

The following supporting information can be downloaded at: https://www.mdpi.com/article/10.3390/agronomy12010176/s1; Figure S1: Average daily temperature (℃) and total precipitation (mm) during the winter wheat and summer maize growing seasons for the period 2005 to 2018; Figure S2: Ratios (wt/wt) of available P (AP) and available N (AN) (a), available K (AK) and AP (b), and of AK and AN (c) in four soil layers (0–5, 5–10, 10–20 and 20–30 cm) and four tillage treatments (means of the years 2014, 2016 and 2018); Figure S3: The location of Luancheng experimental station.

Author Contributions

Conceptualization, C.H. and W.D.; methodology, S.C., C.H. and W.D.; formal analysis, S.C. and P.Y.; data curation, S.C. and P.Y.; writing—original draft preparation, S.C., P.Y. and Y.Z.; writing—review and editing, C.H., W.D. and O.O.; supervision, O.O.; funding acquisition, C.H. and W.D. All authors have read and agreed to the published version of the manuscript.

Funding

This research was funded by National Key Research and Development Program of China (2021YFD190100202) and Hebei Key R&D Initiative Project (20326422D).

Institutional Review Board Statement

Not applicable.

Informed Consent Statement

Not applicable.

Data Availability Statement

Not applicable.

Conflicts of Interest

The authors declare no conflict of interest.

References

  1. Li, Y.; Li, Z.; Cui, S.; Zhang, Q. Trade-off between soil pH, bulk density and other soil physical properties under global no-tillage agriculture. Geoderma 2020, 361, 114099. [Google Scholar] [CrossRef]
  2. Aguilera, E.; Lassaletta, L.; Gattinger, A.; Gimeno, B.S. Managing soil carbon for climate change mitigation and adaptation in Mediterranean cropping systems: A meta-analysis. Agric. Ecosyst. Environ. 2013, 168, 25–36. [Google Scholar] [CrossRef]
  3. Madejón, E.; Murillo, J.M.; Moreno, F.; López, M.V.; Arrúe, J.L.; Álvaro-Fuentes, J.; Cantero-Martinez, C. Effect of long-term conservation tillage on soil biochemical properties in Mediterranean Spanish areas. Soil Tillage Res. 2009, 105, 55–62. [Google Scholar] [CrossRef] [Green Version]
  4. Busari, M.A.; Kukal, S.S.; Kaur, A.; Bhatt, R.; Dulazi, A.A. Conservation tillage impacts on soil, crop and the environment. Int. Soil Water Conserv. Res. 2015, 3, 119–129. [Google Scholar] [CrossRef] [Green Version]
  5. Chimsah, F.A.; Cai, L.; Wu, J.; Zhang, R. Outcomes of long-term conservation tillage research in Northern China. Sustainability 2020, 12, 1062. [Google Scholar] [CrossRef] [Green Version]
  6. Nouri, A.; Lee, J.; Yin, X.; Tyler, D.D.; Saxton, A.M. Thirty-four years of no-tillage and cover crops improve soil quality and increase cotton yield in Alfisols, Southeastern USA. Geoderma 2019, 337, 998–1008. [Google Scholar] [CrossRef]
  7. Piazza, G.; Pellegrino, E.; Moscatelli, M.C.; Ercoli, L. Long-term conservation tillage and nitrogen fertilization effects on soil aggregate distribution, nutrient stocks and enzymatic activities in bulk soil and occluded microaggregates. Soil Tillage Res. 2020, 196, 104482. [Google Scholar] [CrossRef]
  8. Gathala, M.K.; Timsina, J.; Islam, S.; Rahman, M.; Hossain, I.; Rashid, H.A.; Ghosh, A.K.; Krupnik, T.J.; Tiwari, T.P.; McDonald, A. Conservation agriculture based tillage and crop establishment options can maintain farmers’ yields and increase profits in South Asia’s rice–maize systems: Evidence from Bangladesh. Field Crop. Res. 2015, 172, 85–98. [Google Scholar] [CrossRef]
  9. Pittelkow, C.M.; Liang, X.; Linquist, B.A.; van Groenigen, K.J.; Lee, J.; Lundy, M.E.; van Gestel, N.; Six, J.; Venterea, R.T.; van Kessel, C. Productivity limits and potentials of the principles of conservation agriculture. Nature 2015, 517, 365–368. [Google Scholar] [CrossRef]
  10. Büchi, L.; Wendling, M.; Amossé, C.; Jeangros, B.; Sinaj, S.; Charles, R. Long and short term changes in crop yield and soil properties induced by the reduction of soil tillage in a long term experiment in Switzerland. Soil Tillage Res. 2017, 174, 120–129. [Google Scholar] [CrossRef]
  11. Peng, Z.; Wang, L.; Xie, J.; Li, L.; Coulter, J.A.; Zhang, R.; Luo, Z.; Cai, L.; Carberry, P.; Whitbread, A. Conservation tillage increases yield and precipitation use efficiency of wheat on the semi-arid Loess Plateau of China. Agric. Water Manag. 2020, 231, 106024. [Google Scholar] [CrossRef]
  12. Kumara, T.K.; Kandpal, A.; Pal, S. A meta-analysis of economic and environmental benefits of conservation agriculture in South Asia. J. Environ. Manag. 2020, 269, 110773. [Google Scholar] [CrossRef]
  13. Li, Y.; Li, Z.; Cui, S.; Jagadamma, S.; Zhang, Q.P. Residue retention and minimum tillage improve physical environment of the soil in croplands: A global meta-analysis. Soil Tillage Res. 2019, 194, 104292. [Google Scholar] [CrossRef]
  14. Macholdt, J.; Honermeier, B. Yield stability in winter wheat production: A survey on German farmers’ and advisors’ views. Agronomy 2017, 7, 45. [Google Scholar] [CrossRef] [Green Version]
  15. Lampurlanes, J.; Angás, P.; Cantero-Martinez, C. Root growth, soil water content and yield of barley under different tillage systems on two soils in semiarid conditions. Field Crop. Res. 2001, 69, 27–40. [Google Scholar] [CrossRef] [Green Version]
  16. Su, Z.; Zhang, J.; Wu, W.; Cai, D.; Lv, J.; Jiang, G.; Huang, J.; Gao, J.; Hartmann, R.; Gabriels, D. Effects of conservation tillage practices on winter wheat water-use efficiency and crop yield on the Loess Plateau, China. Agric. Water Manag. 2007, 87, 307–314. [Google Scholar] [CrossRef]
  17. Taner, A.; Arisoy, R.Z.; Kaya, Y.; Gültekin, I.; Partigöç, F. The effects of various tillage systems on grain yield, quality parameters and energy indices in winter wheat production under the rainfed conditions. Fresenius Environ. Bull. 2015, 24, 1463–1473. [Google Scholar]
  18. Martínez, E.; Fuentes, J.-P.; Silva, P.; Valle, S.; Acevedo, E. Soil physical properties and wheat root growth as affected by no-tillage and conventional tillage systems in a Mediterranean environment of Chile. Soil Tillage Res. 2008, 99, 232–244. [Google Scholar] [CrossRef]
  19. Stockmann, U.; Adams, M.A.; Crawford, J.W.; Field, D.J.; Henakaarchchi, N.; Jenkins, M.; Minasny, B.; McBratney, A.B.; de Courcelles, V.d.R.; Singh, K.; et al. The knowns, known unknowns and unknowns of sequestration of soil organic carbon. Agric. Ecosyst. Environ. 2013, 164, 80–99. [Google Scholar] [CrossRef]
  20. Blanco-Canqui, H.; Lal, R. No-tillage and soil-profile carbon sequestration: An on-farm assessment. Soil Sci. Soc. Am. J. 2008, 72, 693–701. [Google Scholar] [CrossRef] [Green Version]
  21. Ussiri, D.A.; Lal, R. Long-term tillage effects on soil carbon storage and carbon dioxide emissions in continuous corn cropping system from an alfisol in Ohio. Soil Tillage Res. 2009, 104, 39–47. [Google Scholar] [CrossRef]
  22. Luo, Z.; Wang, E.; Sun, O. Can no-tillage stimulate carbon sequestration in agricultural soils? A meta-analysis of paired experiments. Agric. Ecosyst. Environ. 2010, 139, 224–231. [Google Scholar] [CrossRef]
  23. Ogle, S.M.; Alsaker, C.; Baldock, J.; Bernoux, M.; Breidt, F.J.; McConkey, B.; Regina, K.; Vazquez-Amabile, G.G. Climate and soil characteristics determine where no-till management can store carbon in soils and mitigate greenhouse gas emissions. Sci. Rep. 2019, 9, 11665. [Google Scholar] [CrossRef] [PubMed]
  24. Pedrotti, A.; Filho, R.N.D.A.; Assunção, S.J.R.; Filho, R.R.G.; de Oliveira, F.C.C.; Holanda, F.S.R.; Piscoya, V.C.; Filho, M.C. Soil Mechanical Resistance Penetration after Fifteen Years with Previous Crops and Tillage Systems and Productivity of Green Corn Cob in Northeast Brazil. J. Exp. Agric. Int. 2019, 1–9. [Google Scholar] [CrossRef]
  25. Dong, W.; Hu, C.; Chen, S.; Zhang, Y. Tillage and residue management effects on soil carbon and CO2 emission in a wheat–corn double-cropping system. Nutr. Cycl. Agroecosyst. 2009, 83, 27–37. [Google Scholar] [CrossRef]
  26. Qin, S.; Hu, C.; Clough, T.J.; Luo, J.; Oenema, O.; Zhou, S. Irrigation of DOC-rich liquid promotes potential denitrification rate and decreases N2O/(N2O+N2) product ratio in a 0–2 m soil profile. Soil Biol. Biochem. 2017, 106, 1–8. [Google Scholar] [CrossRef]
  27. Du, Z.; Ren, T.; Hu, C. Tillage and residue removal effects on soil carbon and nitrogen storage in the North China Plain. Soil Sci. Soc. Am. J. 2010, 74, 196–202. [Google Scholar] [CrossRef]
  28. Liu, X.; Feike, T.; Shao, L.; Sun, H.; Chen, S.; Zhang, X. Effects of different irrigation regimes on soil compaction in a winter wheat–summer maize cropping system in the North China Plain. Catena 2016, 137, 70–76. [Google Scholar] [CrossRef]
  29. Zhang, X.; Shao, L.; Sun, H.; Chen, S.; Wang, Y. Incorporation of soil bulk density in simulating root distribution of winter wheat and maize in two contrasting soils. Soil Sci. Soc. Am. J. 2012, 76, 638–647. [Google Scholar] [CrossRef]
  30. Drosos, M.; Vinci, G.; Spaccini, R.; Piccolo, A. Molecular dynamics of organic matter in a tilled soil under short term wheat cultivation. Soil Tillage Res. 2020, 196, 104448. [Google Scholar] [CrossRef]
  31. Staff, S. Keys to Soil Taxonomy, 12th ed.; Natural Resources Conservation Service, United States Department of Agriculture: Washington, DC, USA, 2014. [Google Scholar]
  32. Yeomans, J.C.; Bremner, J.M. A rapid and precise method for routine determination of organic carbon in soil. Commun. Soil Sci. Plant Anal. 1988, 19, 1467–1476. [Google Scholar] [CrossRef]
  33. Sparks, D.L.; Page, A.L.; Helmke, P.A.; Loeppert, R.H. Methods of Soil Analysis, Part 3: Chemical Methods; John Wiley & Sons: Hoboken, NJ, USA, 2020; Volume 14. [Google Scholar]
  34. Han, D.; Wiesmeier, M.; Conant, R.T.; Kühnel, A.; Sun, Z.; Kögel-Knabner, I.; Hou, R.; Cong, P.; Liang, R.; Ouyang, Z. Large soil organic carbon increase due to improved agronomic management in the North China Plain from 1980s to 2010s. Glob. Chang. Biol. 2018, 24, 987–1000. [Google Scholar] [CrossRef] [PubMed]
  35. Jaggard, K.W.; Qi, A.; Ober, E. Possible changes to arable crop yields by 2050. Philos. Trans. R. Soc. B Biol. Sci. 2010, 365, 2835–2851. [Google Scholar] [CrossRef] [PubMed] [Green Version]
  36. Xin-sheng, N.; Zhang, H.-Y.; Ling-an, N. Crop straw resources and utilization in typical agricultural region of north China plain. J. Anhui Agric. Sci. 2011, 39, 1710–1712. (In Chinese) [Google Scholar] [CrossRef]
  37. Jin, X.; Bai, Z.; Oenema, O.; Winiwarter, W.; Velthof, G.L.; Chen, X.; Ma, L. Spatial planning needed to drastically reduce nitrogen and phosphorus surpluses in China’s agriculture. Environ. Sci. Technol. 2020, 54, 11894–11904. [Google Scholar] [CrossRef] [PubMed]
  38. Qu, C.; Li, B.; Wu, H.; Giesy, J.P. Controlling Air Pollution from Straw Burning in China Calls for Efficient Recycling. Environ. Sci. Technol. 2012, 46, 7934–7936. [Google Scholar] [CrossRef]
  39. Wang, X.; He, C.; Liu, B.; Zhao, X.; Liu, Y.; Wang, Q.; Zhang, H. Effects of residue returning on soil organic carbon storage and sequestration rate in China’s croplands: A meta-analysis. Agronomy 2020, 10, 691. [Google Scholar] [CrossRef]
  40. Kong, L. Maize residues, soil quality, and wheat growth in China. A review. Agron. Sustain. Dev. 2014, 34, 405–416. [Google Scholar] [CrossRef] [Green Version]
  41. Cheng, W.X.; Ouy, Z.; Wu, L.F. Agro-ecosystems in Huang Huai Hai Plian. In The Ecosystems in China; Sun, H.L., Ed.; Science Press: Beijing, China, 2005; pp. 1098–1099. [Google Scholar]
  42. Coppens, F.; Garnier, P.; De Gryze, S.; Merckx, R.; Recous, S. Soil moisture, carbon and nitrogen dynamics following incorporation and surface application of labelled crop residues in soil columns. Eur. J. Soil Sci. 2006, 57, 894–905. [Google Scholar] [CrossRef]
  43. Giacomini, S.J.; Recous, S.; Mary, B.; Aita, C. Simulating the effects of N availability, straw particle size and location in soil on C and N mineralization. Plant Soil 2007, 301, 289–301. [Google Scholar] [CrossRef]
  44. Cade-Menun, B.J.; Carter, M.R.; James, D.C.; Liu, C.W. Phosphorus forms and chemistry in the soil profile under long-term conservation tillage: A phosphorus-31 nuclear magnetic resonance study. J. Environ. Qual. 2010, 39, 1647–1656. [Google Scholar] [CrossRef] [PubMed]
  45. Vu, D.T.; Tang, C.; Armstrong, R.D. Tillage system affects phosphorus form and depth distribution in three contrasting Victorian soils. Soil Res. 2009, 47, 33–45. [Google Scholar] [CrossRef]
  46. Weil, R.R.; Benedetto, P.W.; Sikora, L.J.; Bandel, V.A. Influence of tillage practices on phosphorus distribution and forms in three ultisols. Agron. J. 1988, 80, 503–509. [Google Scholar] [CrossRef]
  47. Zibilske, L.; Bradford, J.; Smart, J. Conservation tillage induced changes in organic carbon, total nitrogen and available phosphorus in a semi-arid alkaline subtropical soil. Soil Tillage Res. 2002, 66, 153–163. [Google Scholar] [CrossRef]
  48. Zuber, S.M.; Behnke, G.D.; Nafziger, E.D.; Villamil, M.B. Crop rotation and tillage effects on soil physical and chemical properties in Illinois. Agron. J. 2015, 107, 971–978. [Google Scholar] [CrossRef] [Green Version]
  49. Matowo, P.R.; Pierzynski, G.M.; Whitney, D.; Lamond, R.E. Soil chemical properties as influenced by tillage and nitrogen source, placement, and rates after 10 years of continuous sorghum. Soil Tillage Res. 1999, 50, 11–19. [Google Scholar] [CrossRef]
  50. Martinrueda, I.; Munozguerra, L.; Yunta, F.; Esteban, E.; Tenorio, J.L.; Lucena, J.J. Tillage and crop rotation effects on barley yield and soil nutrients on a Calciortidic Haploxeralf. Soil Tillage Res. 2007, 92, 1–9. [Google Scholar] [CrossRef]
  51. García, B.L.; Parras-Alcántara, L. Changes in soil properties and soil solution nutrients due to conservation versus conventional tillage in Vertisols. Arch. Agron. Soil Sci. 2014, 60, 1429–1444. [Google Scholar] [CrossRef]
  52. Li, Q.; Bian, C.; Liu, X.; Ma, C.; Liu, Q. Winter wheat grain yield and water use efficiency in wide-precision planting pattern under deficit irrigation in North China Plain. Agric. Water Manag. 2015, 153, 71–76. [Google Scholar] [CrossRef]
  53. Kan, Z.-R.; Liu, Q.-Y.; He, C.; Jing, Z.-H.; Virk, A.L.; Qi, J.-Y.; Zhao, X.; Zhang, H.-L. Responses of grain yield and water use efficiency of winter wheat to tillage in the North China Plain. Field Crop. Res. 2020, 249, 107760. [Google Scholar] [CrossRef]
  54. Känkänen, H.; Alakukku, L.; Salo, Y.; Pitkänen, T. Growth and yield of spring cereals during transition to zero tillage on clay soils. Eur. J. Agron. 2011, 34, 35–45. [Google Scholar] [CrossRef]
  55. Amato, G.; Ruisi, P.; Frenda, A.S.; Di Miceli, G.; Saia, S.; Plaia, A.; Giambalvo, D. Long-Term Tillage and Crop Sequence Effects on Wheat Grain Yield and Quality. Agron. J. 2013, 105, 1317–1327. [Google Scholar] [CrossRef]
  56. Eckert, D.J. Tillage System × Planting Date Interactions in Corn Production 1. Agron. J. 1984, 76, 580–582. [Google Scholar] [CrossRef]
  57. Graven, L.; Carter, P. Seed Quality effect on corn performance under conventional and no-tillage systems. J. Prod. Agric. 1991, 4, 366–372. [Google Scholar] [CrossRef] [Green Version]
  58. Herbek, J.H.; Murdock, L.W.; Blevins, R.L. Tillage System and Date of Planting Effects on Yield of Corn on Soils with Restricted Drainage 1. Agron. J. 1986, 78, 824–826. [Google Scholar] [CrossRef]
  59. Alvarez, R.; Steinbach, H. A review of the effects of tillage systems on some soil physical properties, water content, nitrate availability and crops yield in the Argentine Pampas. Soil Tillage Res. 2009, 104, 1–15. [Google Scholar] [CrossRef]
  60. Lundy, M.E.; Pittelkow, C.; Linquist, B.A.; Liang, X.; van Groenigen, K.J.; Lee, J.; Six, J.; Venterea, R.T.; van Kessel, C. Nitrogen fertilization reduces yield declines following no-till adoption. Field Crop. Res. 2015, 183, 204–210. [Google Scholar] [CrossRef] [Green Version]
  61. Rusinamhodzi, L.; Corbeels, M.; van Wijk, M.T.; Rufino, M.C.; Nyamangara, J.; Giller, K.E. A meta-analysis of long-term effects of conservation agriculture on maize grain yield under rain-fed conditions. Agron. Sustain. Dev. 2011, 31, 657. [Google Scholar] [CrossRef] [Green Version]
  62. Toliver, D.K.; Larson, J.A.; Roberts, R.K.; English, B.C.; Ugarte, D.G.D.L.T.; West, T.O. Effects of No-Till on Yields as Influenced by Crop and Environmental Factors. Agron. J. 2012, 104, 530–541. [Google Scholar] [CrossRef] [Green Version]
  63. Zhou, S.-L.; Wu, Y.-C.; Wang, Z.-M.; Lu, L.-Q.; Wang, R.-Z. The nitrate leached below maize root zone is available for deep-rooted wheat in winter wheat–summer maize rotation in the North China Plain. Environ. Pollut. 2008, 152, 723–730. [Google Scholar] [CrossRef] [PubMed]
  64. Dong, W.; Hu, C.; Zhang, Y.; Wu, D. Gross mineralization, nitrification and N2O emission under different tillage in the North China Plain. Nutr. Cycl. Agroecosyst. 2012, 94, 237–247. [Google Scholar] [CrossRef]
  65. Powlson, D.S.; Stirling, C.M.; Jat, M.L.; Gerard, B.; Palm, C.A.; Sanchez, P.A.; Cassman, K.G. Limited potential of no-till agriculture for climate change mitigation. Nat. Clim. Chang. 2014, 4, 678–683. [Google Scholar] [CrossRef]
  66. Corbeels, M.; Marchao, R.; Neto, M.S.; Ferreira, E.G.; Madari, B.; Scopel, E.; Brito, O.R. Evidence of limited carbon sequestration in soils under no-tillage systems in the Cerrado of Brazil. Sci. Rep. 2016, 6, 21450. [Google Scholar] [CrossRef] [PubMed] [Green Version]
  67. West, T.O.; Post, W.M. Soil Organic Carbon Sequestration Rates by Tillage and Crop Rotation. Soil Sci. Soc. Am. J. 2002, 66, 1930–1946. [Google Scholar] [CrossRef] [Green Version]
  68. Ogle, S.M.; Swan, A.; Paustian, K. No-till management impacts on crop productivity, carbon input and soil carbon sequestration. Agric. Ecosyst. Environ. 2012, 149, 37–49. [Google Scholar] [CrossRef]
Figure 1. Grain yields of winter wheat and summer maize in a double cropping system with four tillage treatments during the period 2004 to 2018 (means ± standard deviations; bars represent standard deviations of the mean of six replicates). Colored lines between means are only meant to make differences between treatments more clear. See Table 1 for the tillage treatments.
Agronomy 12 00176 g001
Figure 2. Organic carbon input (t/ha) into the soil from aboveground residues of winter wheat and summer maize in a double cropping system with four tillage treatments during the period 2004 to 2018. Bars represent standard deviations of the mean of six replicates. See Table 1 for the tillage treatments.
Agronomy 12 00176 g002
Figure 3. Soil organic carbon content (SOC, g kg−1) of the 0–5 cm (a), 5–10 cm (b), 10–20 cm (c) and 20–30 cm (d) soil layers in a double cropping system with four tillage treatments, during the period 2004 to 2018 (means ± standard deviations; bars represent standard deviations of the mean of six replicates. See Table 1 for the tillage treatments.
Agronomy 12 00176 g003
Figure 4. Changes in soil carbon stocks (t ha−1) in the topsoil (0–30 cm) of four tillage treatments during the period 2004 to 2018. Dotted lines represent trend lines. See Table 1 for the tillage treatments.
Agronomy 12 00176 g004
Figure 5. Available soil nitrogen ((a). AN, g kg−1), soil phosphorus ((b). AP, mg kg−1) and soil potassium ((c). AK, g kg−1) in the 0–5, 5–10, 10–20 and 20–30 cm soil layers in a double cropping system with four tillage treatments during the period 2004 to 2018. See Table 1 for the tillage treatments.
Agronomy 12 00176 g005
Figure 6. Soil bulk density (g cm−3) of the 0–5, 5–10, 10–20 and 20–30 cm soil layers of a double cropping system with four tillage treatments in 2005, 2006, 2012, 2015, and 2017. Line bars represent the standard deviation of the mean of six replicates. See Table 1 for the tillage treatments.
Agronomy 12 00176 g006
Table 1. Annual tillage and crop residue management practices per treatment *.
TreatmentTillage before Wheat Tillage before MaizeWheat Seeding PatternMaize Straw ManagementWheat Straw Management
CKMoldboard ploughing, tillage depth of 20 cmNo tillage15 cm between rows, 3–5 cm seeding depth Maize straw removed, root and stubble incorporated in the soil Wheat straw chopped (5–10 cm) and spread on soil surface
CTMoldboard plough, tillage depth of 20 cmNo tillageThe same as CKMaize straw chopped (5–10 cm) and incorporated in the soilThe same as CK
RTRotary tillage, tillage depth of 10 cmNo tillageThe same as CKThe same as CT The same as CK
NTNo tillage No tillage20 cm between rows, 10 cm inner row, 5 cm seeding depthMaize straw chopped (5–10 cm) and spread on the soil surface The same as CK
* Rotary tillage has become common practice in North China Plain in recent years; the soil (0–10 cm) is broken into pieces through blades or teeth attached to the disks of a rotating drum.
Table 2. Annual wheat and maize grain yields (means ± s.d.) and mass of carbon (C) in aboveground residues returned to the soil (means ± s.d.) in a double cropping system with four tillage treatments during the period 2005–2018. The results of the statistical analyses are presented in the lower half of Table. See Table 1 for the tillage treatments.
TreatmentsWheat Yield *
t ha−1 a−1
Maize Yield *
t ha−1 a−1
Returned Residues *
t C ha−1 a−1
CK6.2 ± 0.3 ab7.4 ± 0.2 a1.25 ± 0.09 c
CT6.3 ± 0.2 a7.7 ± 0.4 a2.83 ± 0.16 a
RT5.9 ± 0.1 b7.7 ± 0.4 a2.68 ± 0.19 b
NT5.2 ± 0.1 c7.7 ± 0.3 a2.64 ± 0.20 b
FPFPFP
--------------------------------------------------------------
Tillage36.00.000.80.4524.50.00
Year53.70.0026.70.00631.40.00
Soil x Year3.50.034.20.022.390.19
* Different letters in the same column indicate significant differences at p< 0.05.
Table 3. Soil C stocks (0–30 cm) in the four treatments in 2001, 2006, 2011 and 2018, and estimated C sequestration rates in the four tillage treatments for three periods. See Table 1 for the tillage treatments.
CKCTRTNT
C stock in 0–30 cm soil layer, t ha−1 *
200138.1 37.136.4 36.9
200638.0 bc 39.9 abc41.1 ab 41.8 a
201142.3 ab45.8 a44.2 b41.9 ab
201841.5 c48.9 a44.7 b43.0 b
C sequestration rate, kg C ha−1 a−1 *
2001–2006−0.01 c0.56 b0.94 a0.99 a
2001–20110.43 b0.87 a0.78 ab0.50 b
2001–20180.25 c0.69 a0.49 b0.36 bc
* Different letters in the same row indicate significant differences at p < 0.05.
Publisher’s Note: MDPI stays neutral with regard to jurisdictional claims in published maps and institutional affiliations.

