
Development of an Automatic Irrigation Method Using an Image-Based Irrigation System for High-Quality Tomato Production


Abstract
:1. Introduction
2. Materials and Methods
2.1. Experimental Site and Plant Materials
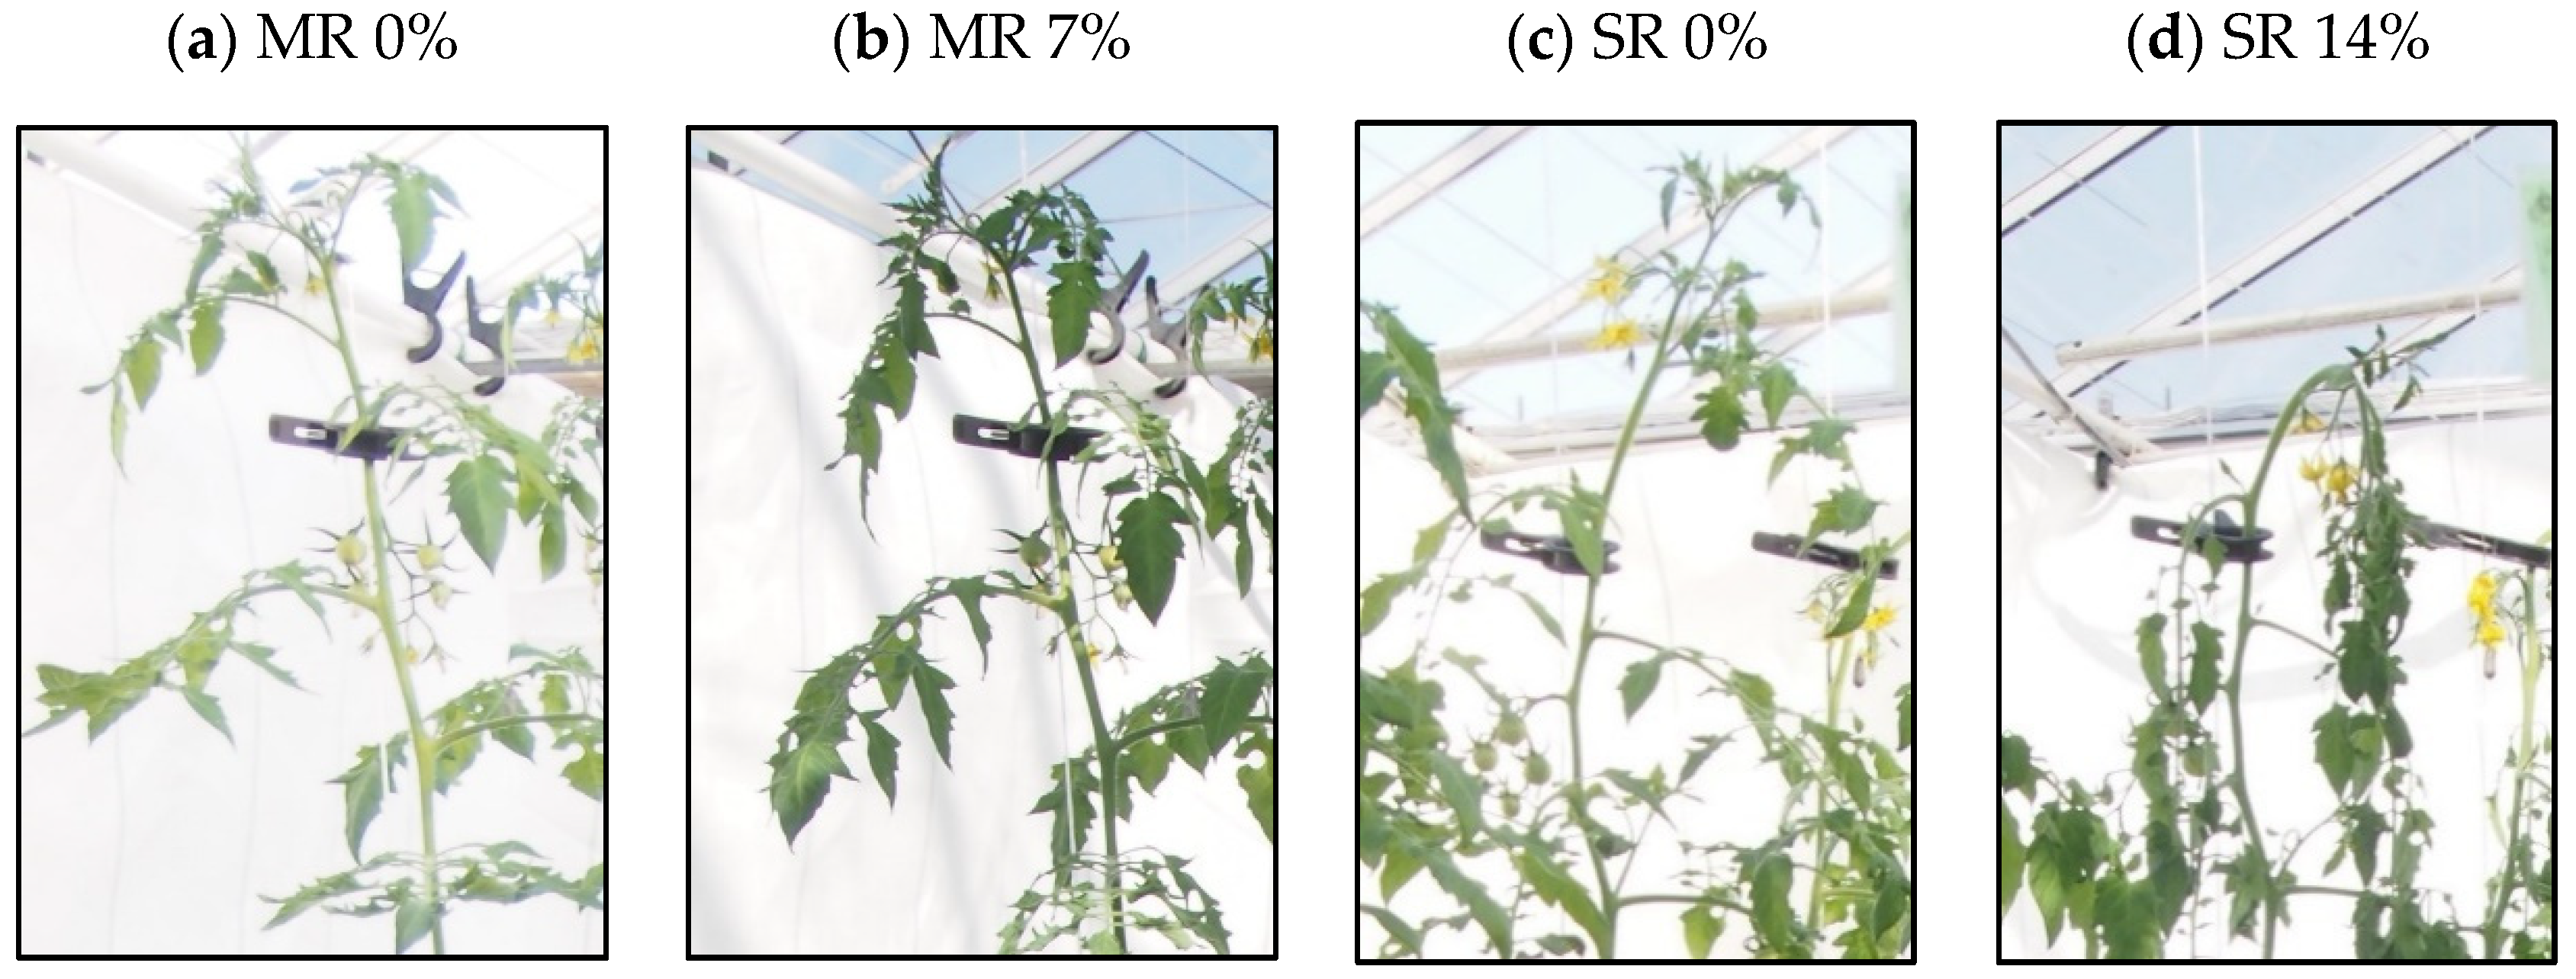
2.2. Treatments
2.3. Measured Parameters
2.3.1. Greenhouse Environment
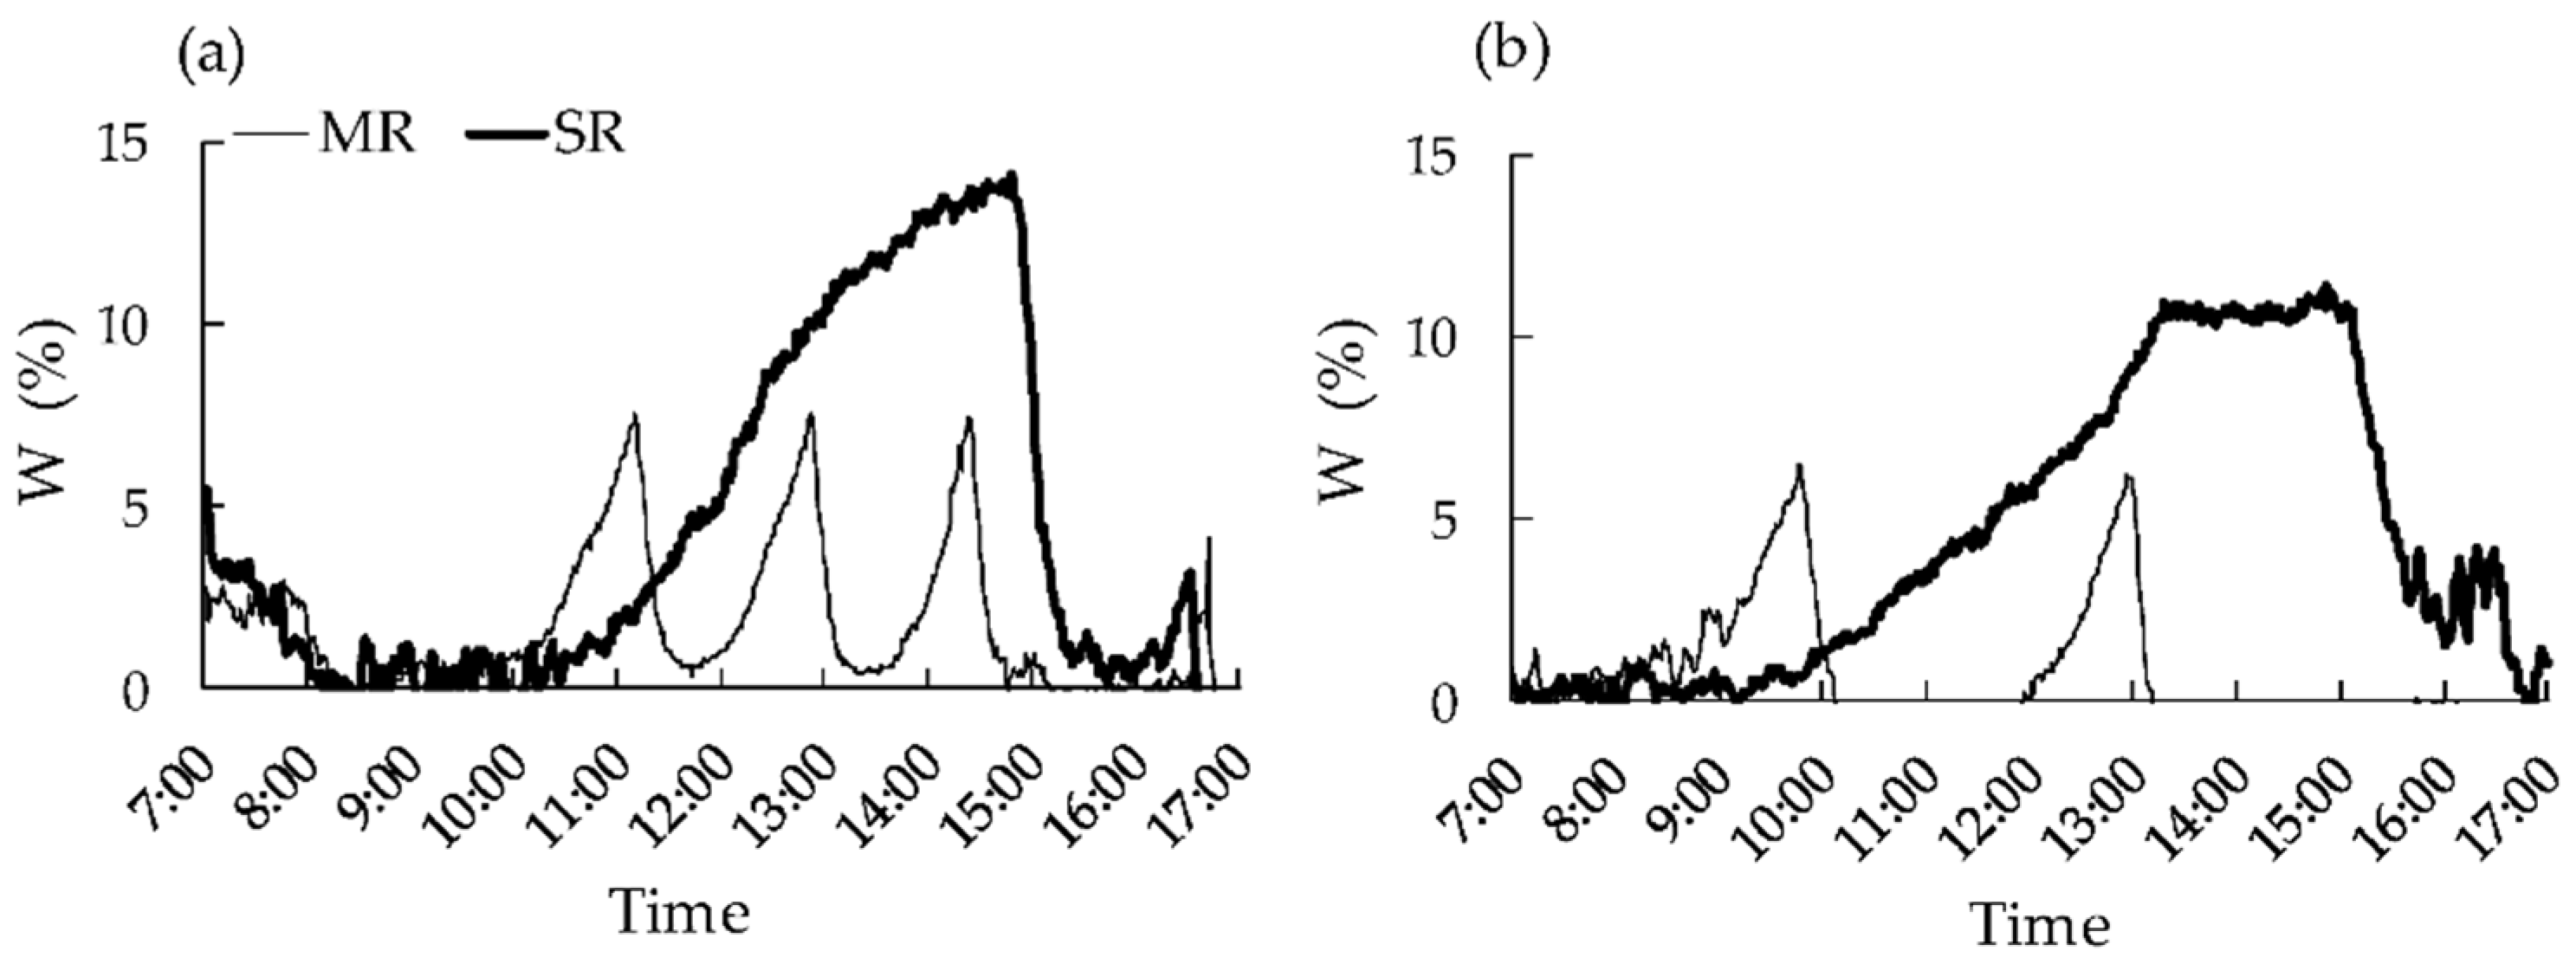
2.3.2. Cumulative Wilting Ratio
2.3.3. Plant Growth
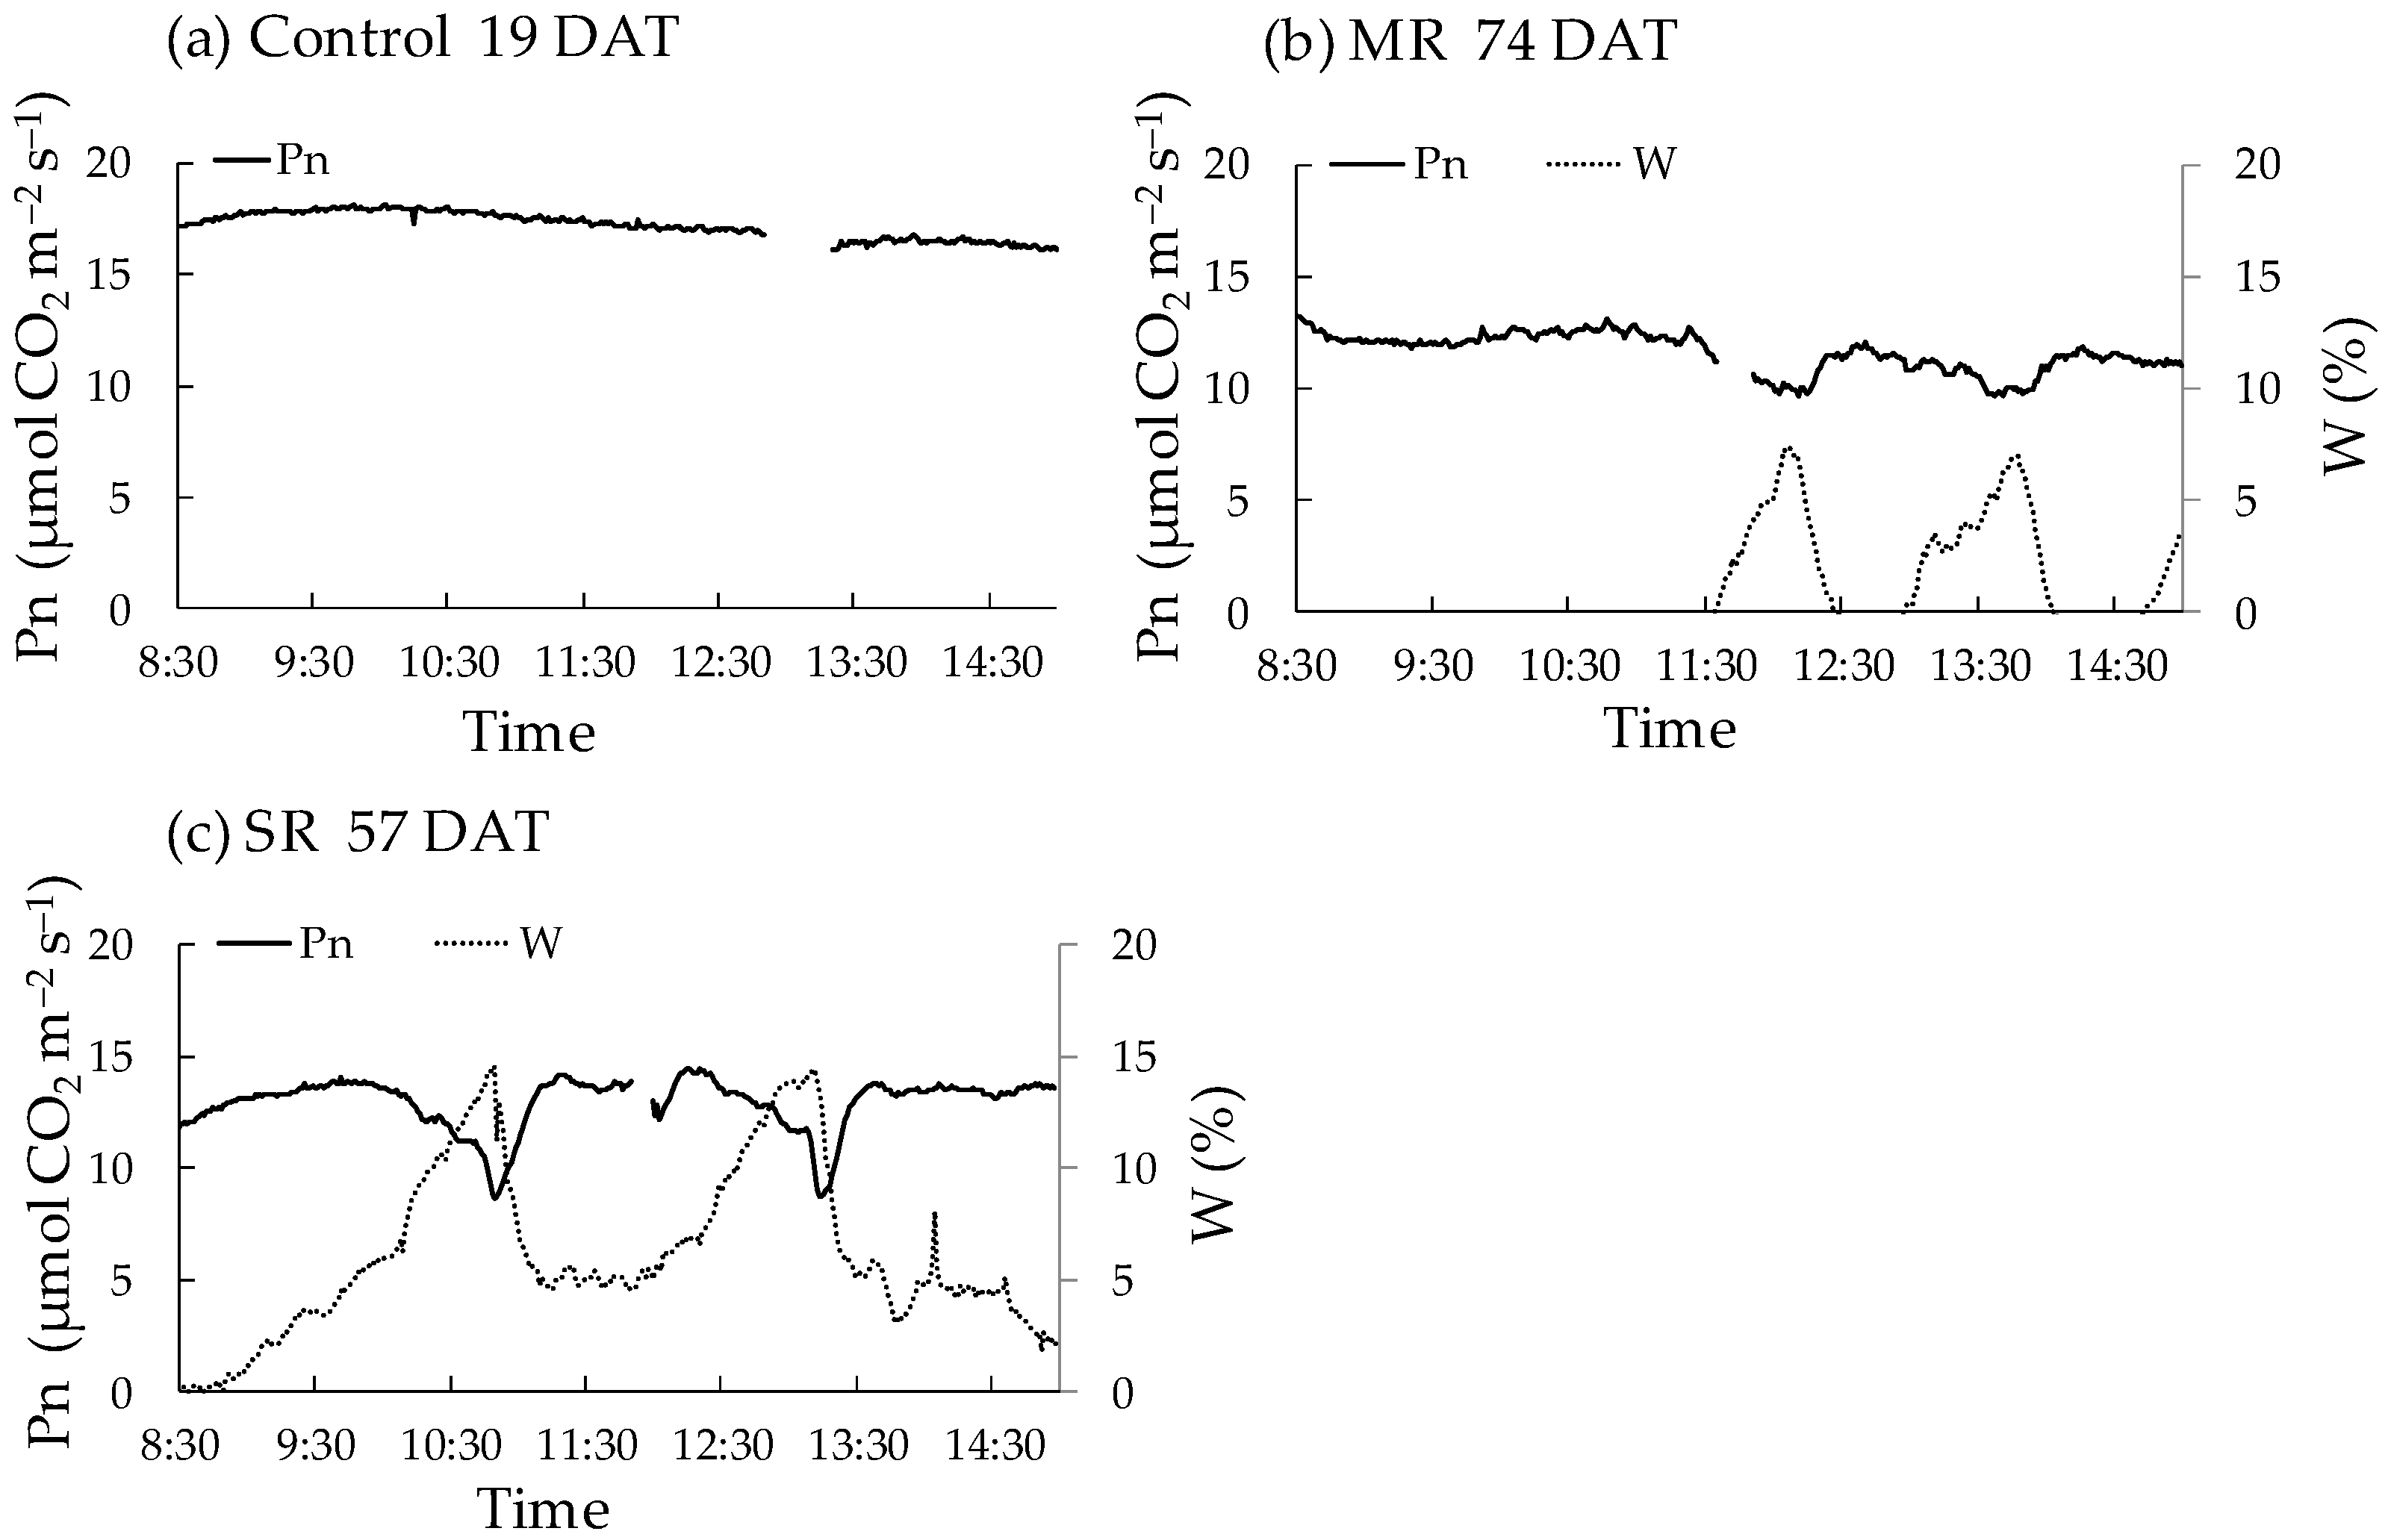
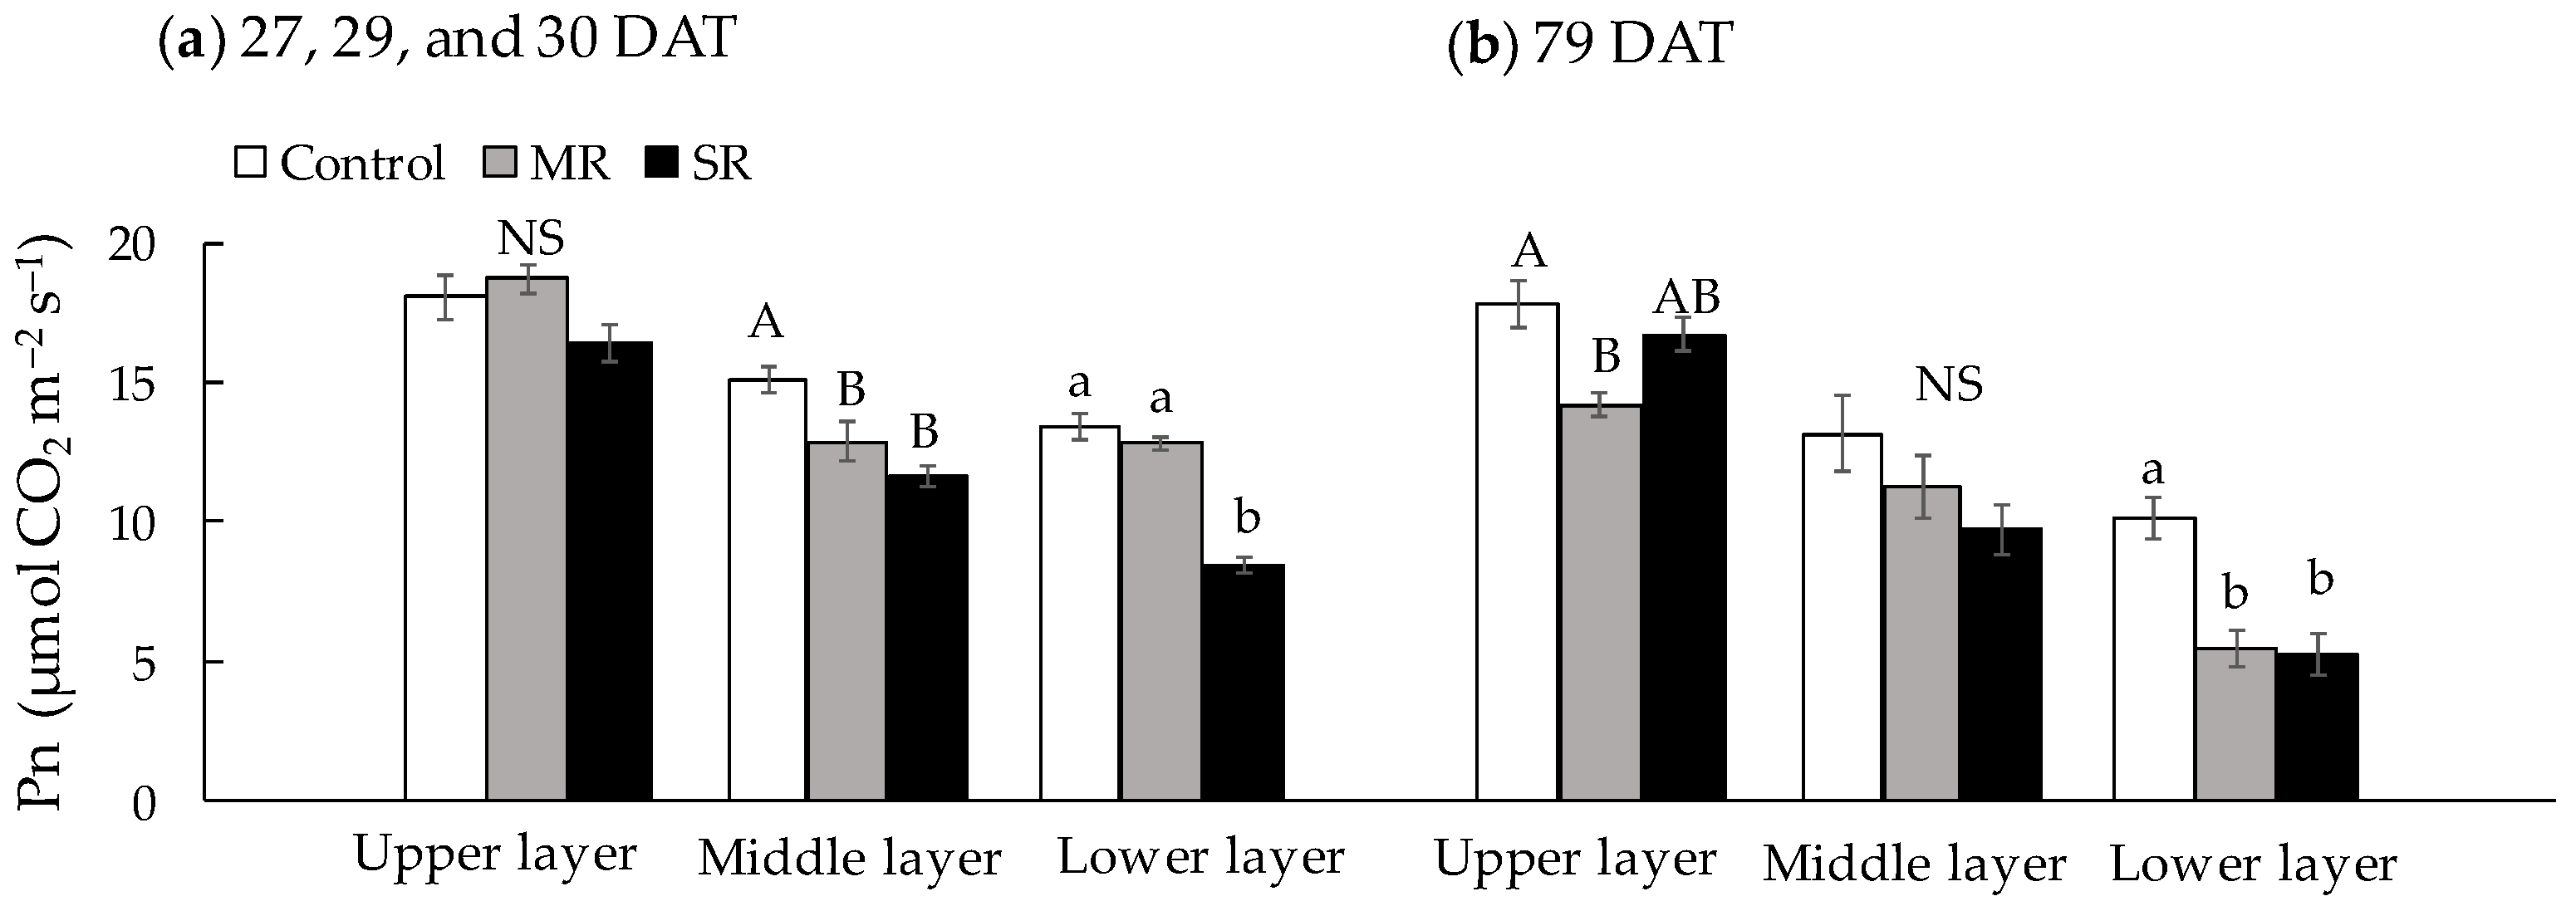
2.3.4. Diurnal Change in Pn and Potential Values of Pn in Different Leaf Layers
2.3.5. Yield and Fruit Quality
2.3.6. Cumulative Air Temperature of Fruit from Anthesis to Harvest
2.4. Statistical Analysis
3. Results
3.1. Irrigation Management
3.2. Photosynthesis
3.3. Plant Growth
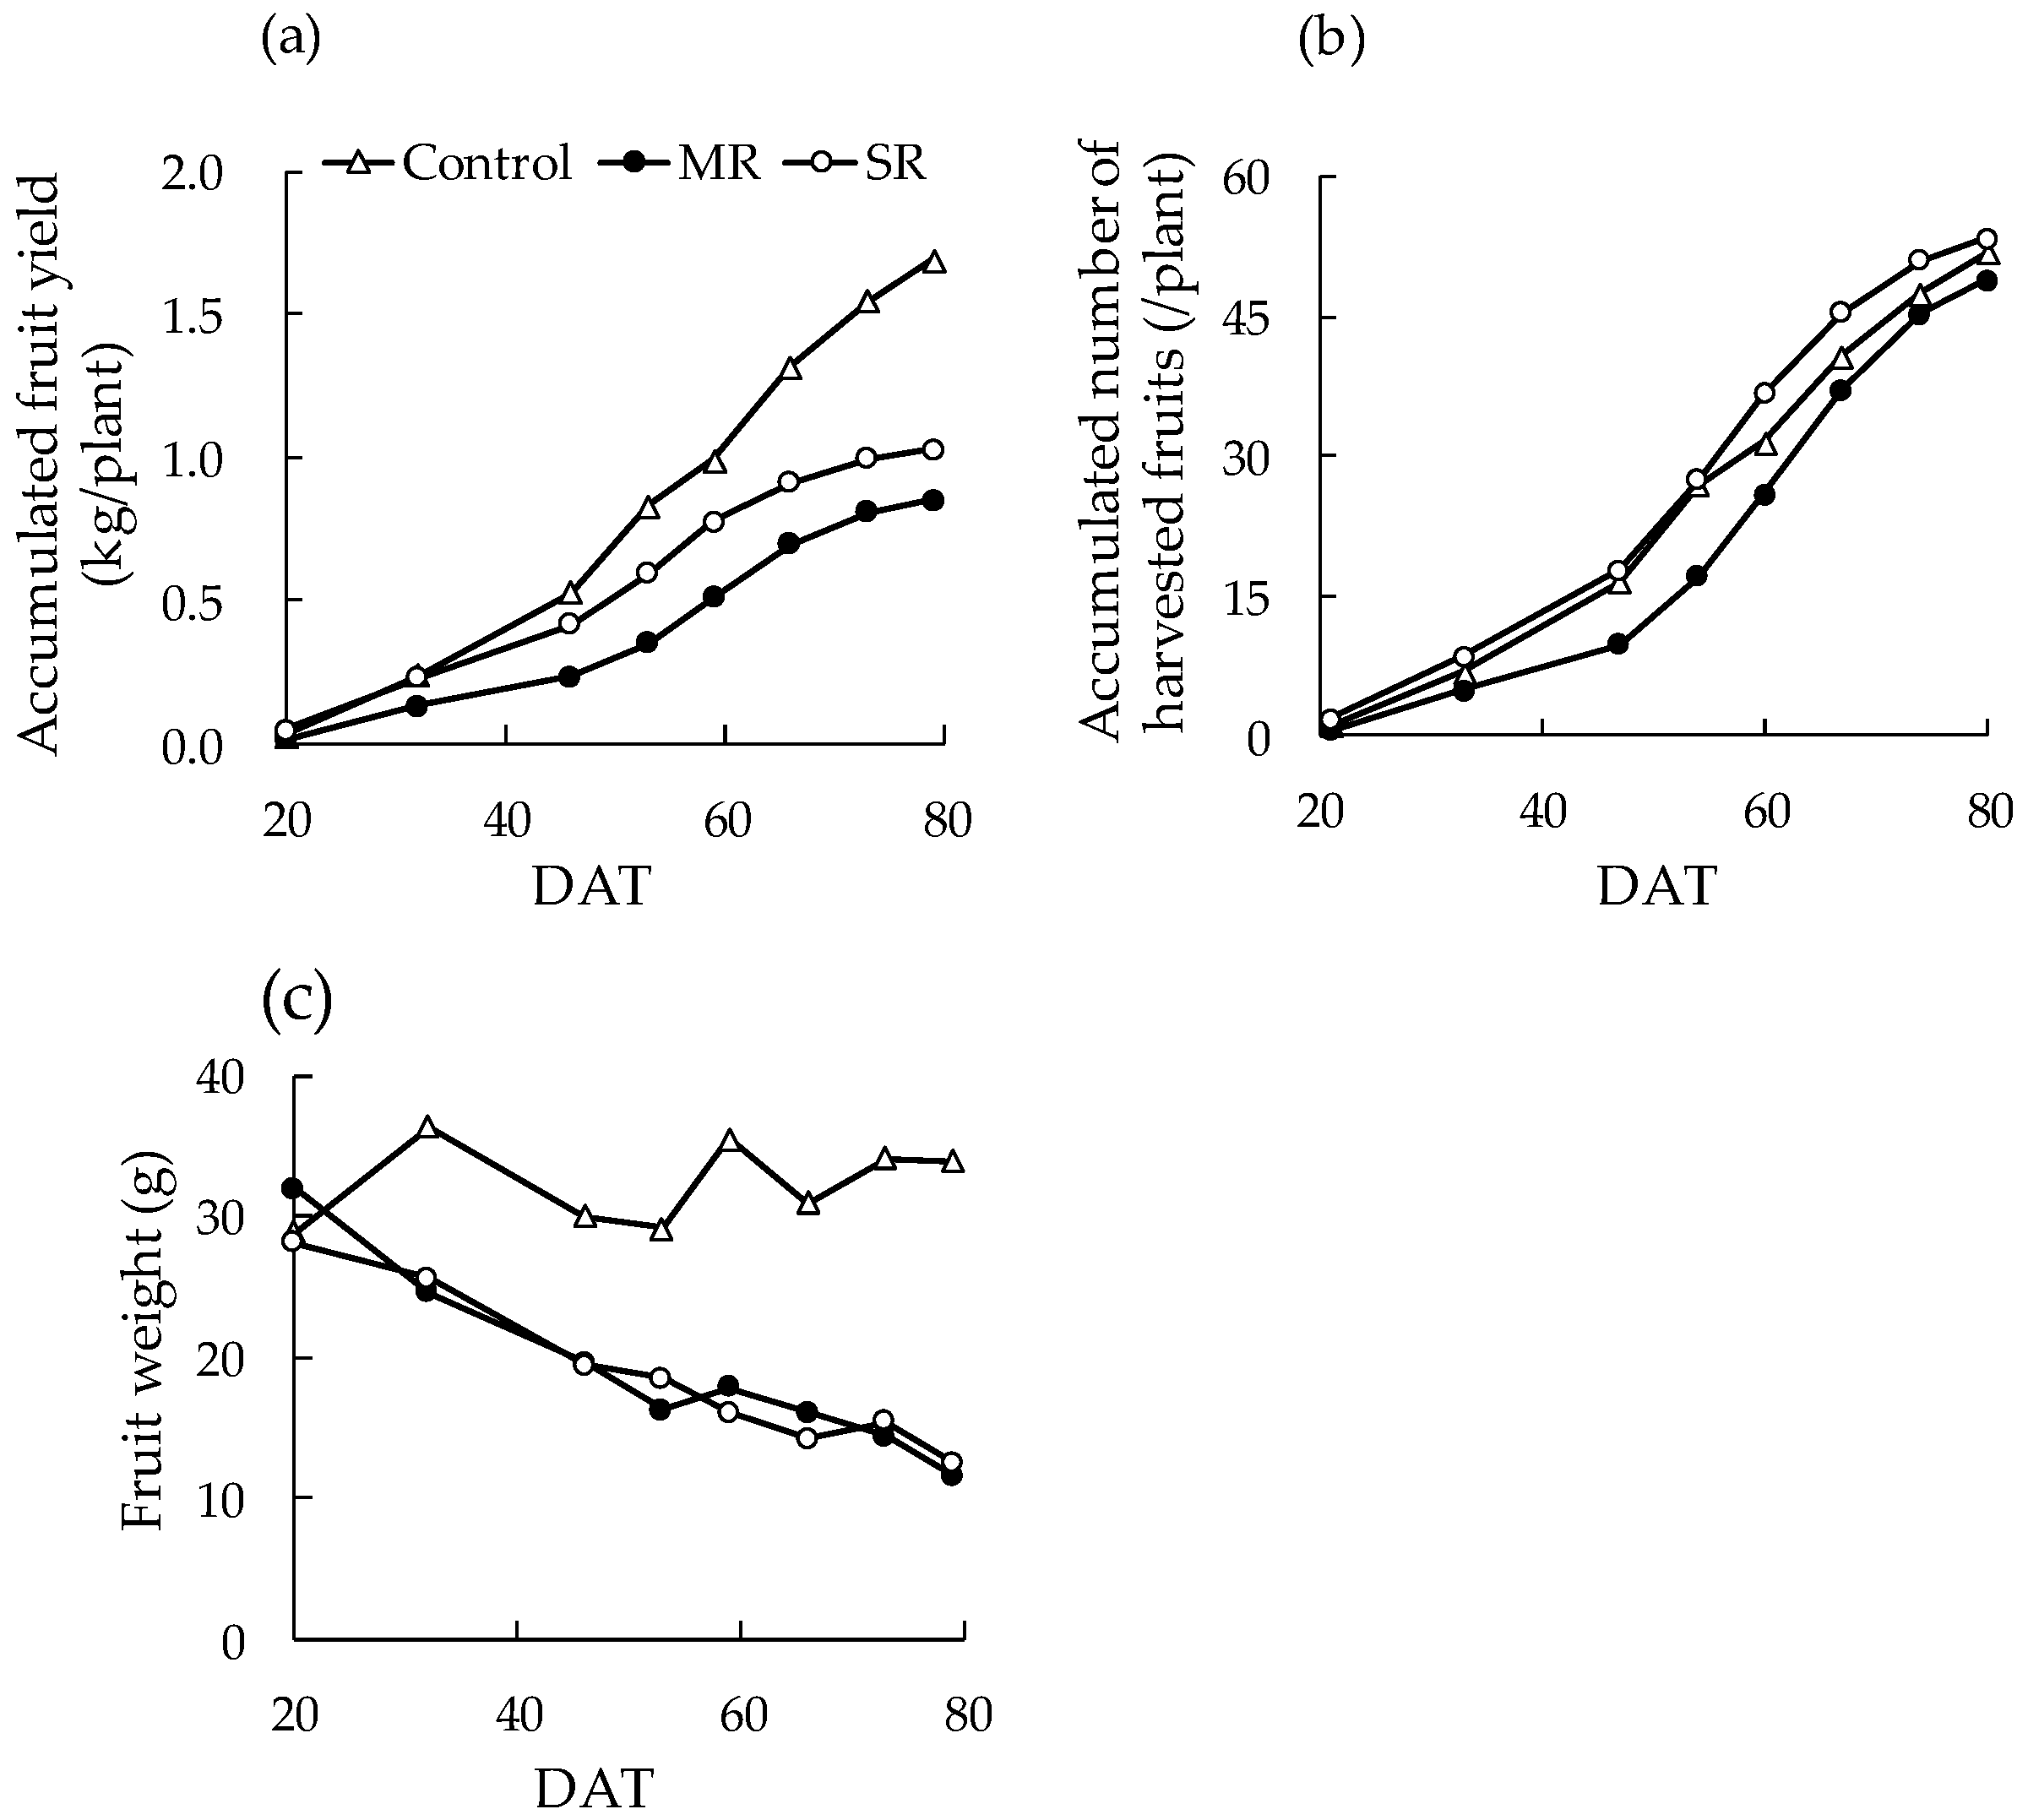
3.4. Yield
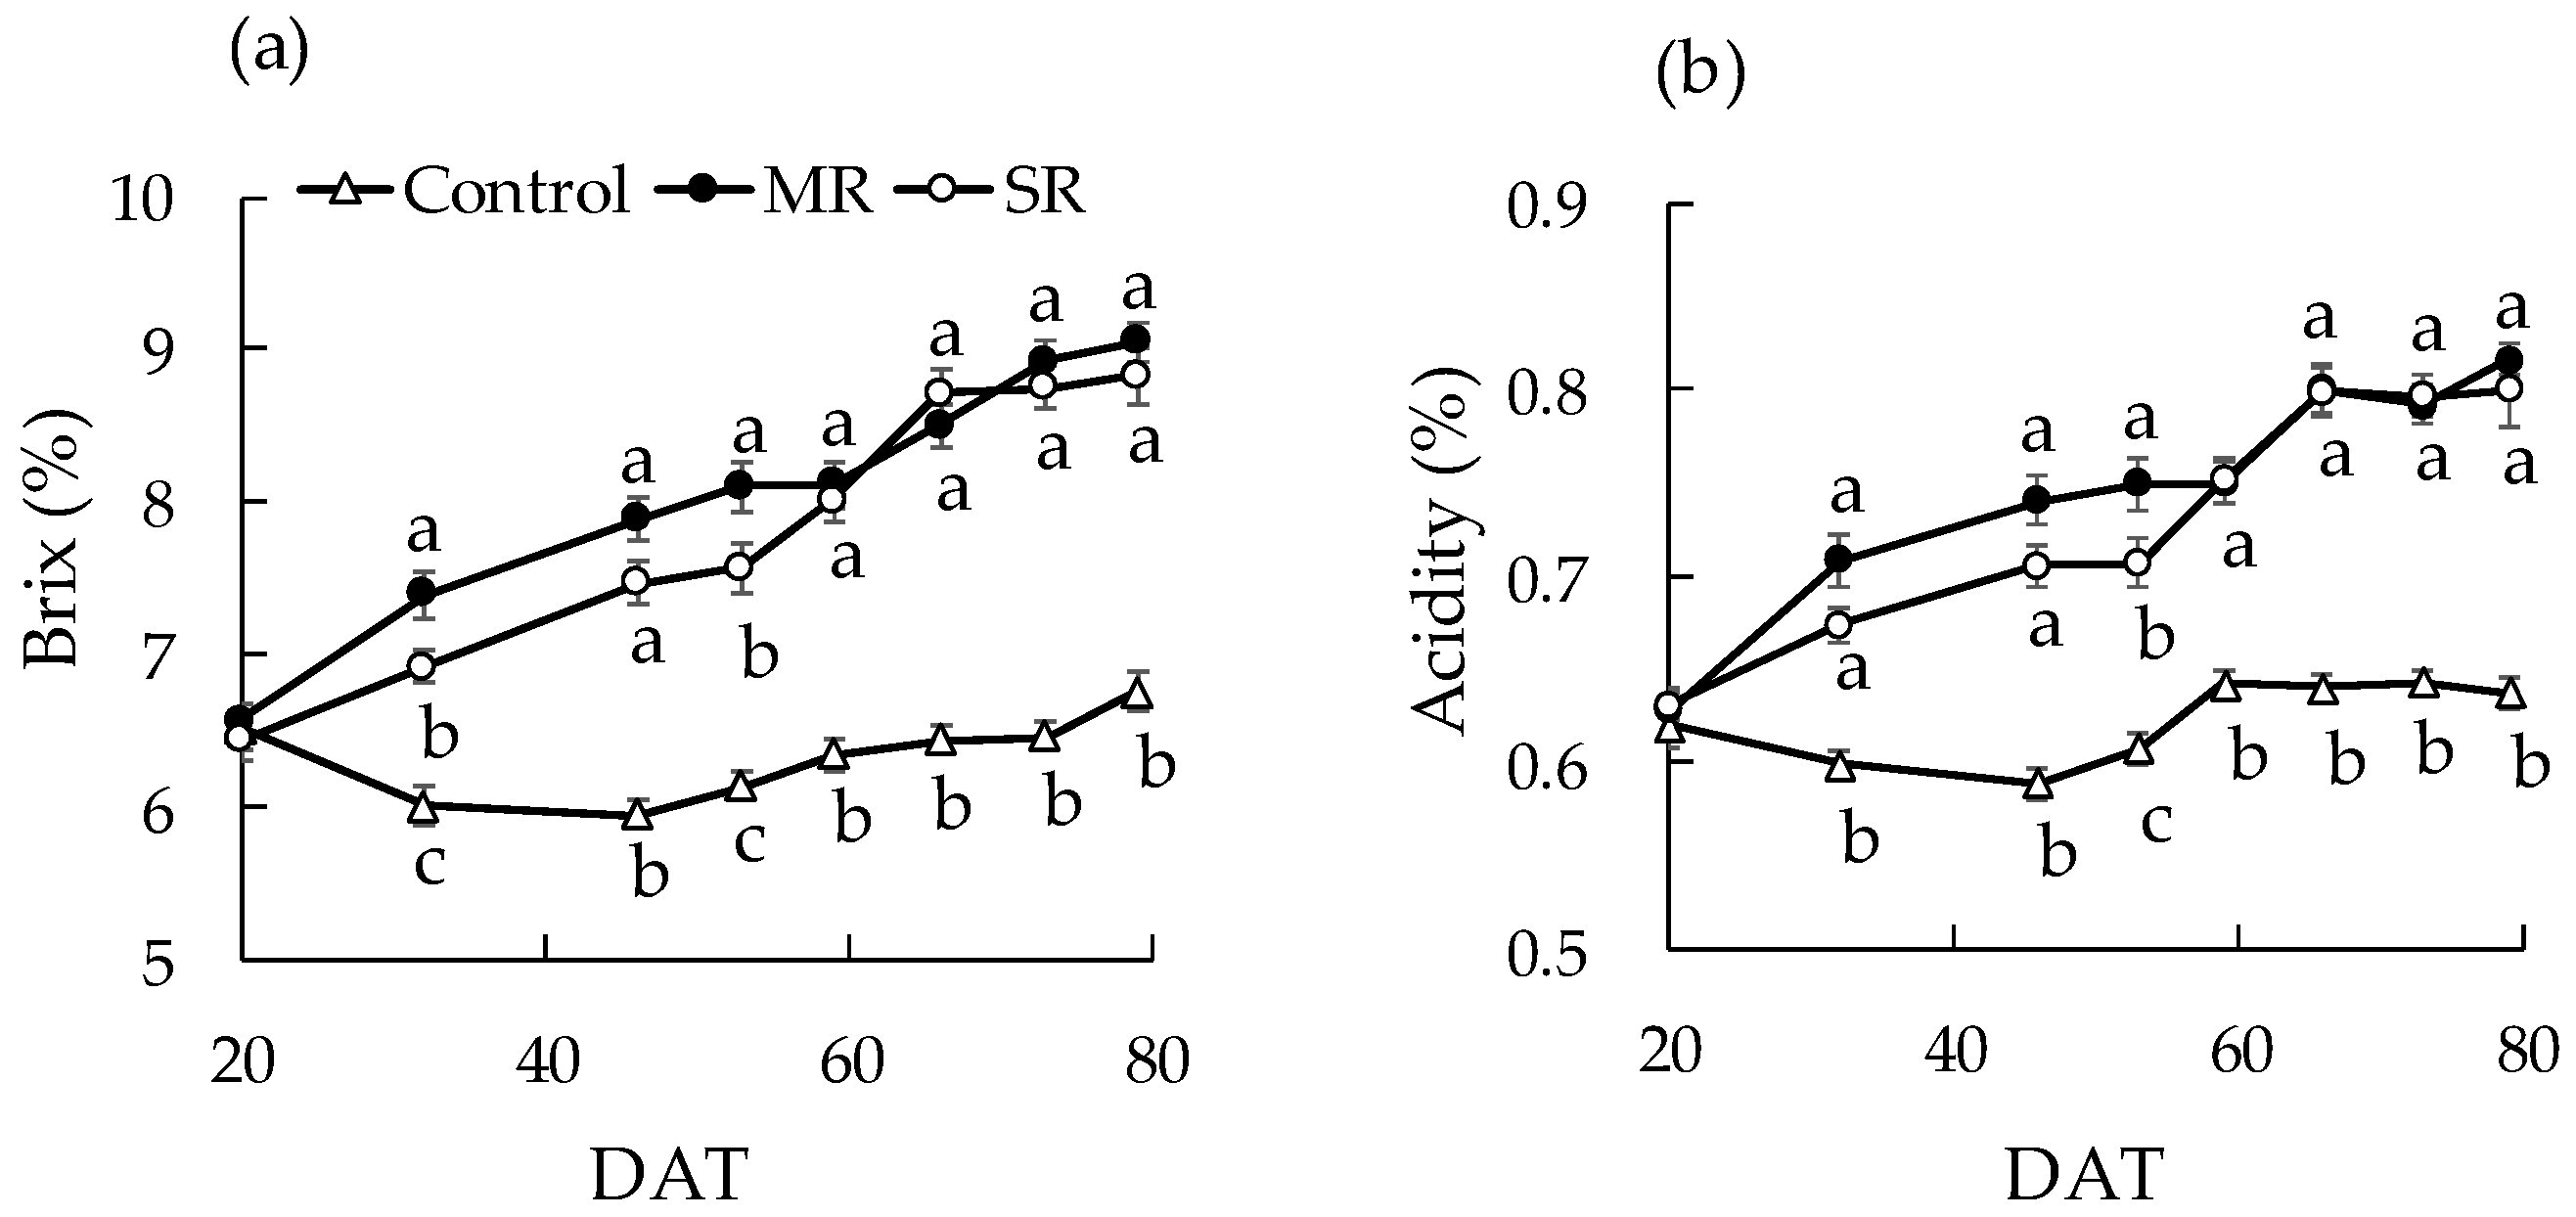
3.5. Fruit Quality
4. Discussion
4.1. Irrigation Management
4.2. Plant Growth and Photosynthesis
4.3. Fruit Yield, Quality, and Stress-Effective Development Stage
5. Conclusions
Author Contributions
Funding
Data Availability Statement
Acknowledgments
Conflicts of Interest
References
- Hikosaka, S.; Inoue, K.; Ishigami, Y.; Goto, E. Development of an automatic water-stress control system by image analysis for the production of high-quality tomato. Acta Hortic. 2019, 1296, 1027–1034. [Google Scholar] [CrossRef]
- Liu, H.; Li, H.H.; Ning, H.F.; Zhang, X.X.; Li, S.; Pang, J.; Wang, G.S.; Sun, J.S. Optimizing irrigation frequency and amount to balance yield, fruit quality and water use efficiency of greenhouse tomato. Agric. Water Manag. 2019, 226, 105787. [Google Scholar] [CrossRef]
- Nuruddin, M.M.; Madramootoo, C.A.; Dodds, G.T. Effects of water stress at different growth stages on greenhouse tomato yield and quality. HortScience 2003, 38, 1389–1393. [Google Scholar] [CrossRef] [Green Version]
- Liu, H.; Duan, A.W.; LI, F.S.; Sun, J.S.; Wang, Y.C.; Sun, C.T. Drip irrigation scheduling for tomato grown in solar greenhouse based on pan evaporation in North China Plain. J. Integr. Agric. 2013, 12, 520–531. [Google Scholar] [CrossRef]
- Zushi, K.; Matsuzoe, N. Effect of water management on vitamin C, sugar and organic acid contents in fruits of cherry type tomatoes. Jpn. Soc. Agric. Technol. Manag. 1998, 5, 41–47, (In Japanese with English abstract). [Google Scholar] [CrossRef]
- Rao, N.K.S.; Bhatt, R.M.; Sadashiva, A.T. Tolerance to water stress in tomato cultivars. Photosynthetica 2000, 38, 465–467. [Google Scholar] [CrossRef]
- Yuan, X.K.; Yang, Z.Q.; Li, Y.X.; Liu, Q.; Han, W. Effects of different levels of water stress on leaf photosynthetic characteristics and antioxidant enzyme activities of greenhouse tomato. Photosynthetica 2016, 54, 28–39. [Google Scholar] [CrossRef]
- Liang, G.T.; Liu, J.H.; Zhang, J.M.; Guo, J. Effects of drought stress on photosynthetic and physiological parameters of tomato. J. Am. Soc. Hortic. Sci. 2020, 145, 12–17. [Google Scholar] [CrossRef] [Green Version]
- Chand, J.; Hewa, G.; Hassanli, A.; Myers, B. Evaluation of deficit irrigation and water quality on production and water productivity of tomato in greenhouse. Agriculture 2020, 10, 297. [Google Scholar] [CrossRef]
- Nangare, D.D.; Singh, Y.; Kumar, P.S.; Minhas, P.S. Growth, fruit yield and quality of tomato (Lycopersicon esculentum Mill.) as affected by deficit irrigation regulated on phenological basis. Agric. Water Manag. 2016, 171, 73–79. [Google Scholar] [CrossRef]
- Badr, M.A.; El-Tohamy, W.A.; Abou-Hussein, S.D.; Gruda, N. Tomato yield, physiological response, water and nitrogen use efficiency under deficit and partial root zone drying irrigation in an arid region. J. Appl. Bot. Food Qual. 2018, 91, 332–340. [Google Scholar] [CrossRef]
- Gallardo, M.; Thompson, R.B.; Valdez, L.C.; Fernández, M.D. Use of stem diameter variations to detect plant water stress in tomato. Irrig. Sci. 2006, 24, 241–255. [Google Scholar] [CrossRef]
- Nakahara, M.; Inoue, Y. Detecting water stress in differentially-irrigated tomato plants with infrared thermometry for cultivation of high-Brix fruits. J. Agric. Meteorol. 1997, 53, 191–199. [Google Scholar] [CrossRef]
- Oishi, N.; Imahara, J.; Kani, H. Development of fertigation control system based on measuring plant weight using load cell for high-brix tomato hydroponics. J. Sci. High Technol. Agric. 2018, 30, 94–102. [Google Scholar] [CrossRef] [Green Version]
- Takayama, K.; Nishina, H. Early detection of water stress in tomato plants based on projected plant area. Environ. Control. Biol. 2007, 45, 241–249. [Google Scholar] [CrossRef] [Green Version]
- Kaneda, Y.; Shibata, S.; Mineno, H. Multi-modal sliding window-based support vector regression for predicting plant water stress. Knowl.-Based Syst. 2017, 134, 135–148. [Google Scholar] [CrossRef]
- Kawai, T.; Mineno, H. Evaluation environment using edge computing for artificial intelligence-based irrigation system. In Proceedings of the 2020 16th International Conference on Mobility, Sensing and Networking (MSN), Tokyo, Japan, 17–19 December 2020. [Google Scholar] [CrossRef]
- Saha, R.R.; Hara, M.H. Influence of different soil moisture regimes on biomass production, water use, and nitrogen nutrition of tomato plants. Environ. Control. Biol. 1998, 36, 1–12. [Google Scholar] [CrossRef] [Green Version]
- Pires, R.C.D.M.; Furlani, P.R.; Ribeiro, R.V.; Junior, D.B.; Sakai, E.; Lourenção, A.L.; Neto, A.T. Irrigation frequency and substrate volume effects in the growth and yield of tomato plants under greenhouse conditions. Sci. Agric. 2011, 68, 400–405. [Google Scholar] [CrossRef]
- Ismail, S.M.; Ozawa, K.; Khondaker, N.A. Influence of single and multiple water application timings on yield and water use efficiency in tomato (var. First power). Agric. Water Manag. 2008, 95, 116–122. [Google Scholar] [CrossRef]
- Harmanto, V.M.; Salokhe, M.S.; Babel, M.S.; Tantau, H.J. Water requirement of drip irrigated tomatoes grown in greenhouse in tropical environment. Agric. Water Manag. 2005, 71, 225–242. [Google Scholar] [CrossRef]
- Chen, J.L.; Kang, S.Z.; Du, T.S.; Qiu, R.J.; Guo, P.; Chen, R.Q. Quantitative response of greenhouse tomato yield and quality to water deficit at different growth stages. Agric. Water Manag. 2013, 129, 152–162. [Google Scholar] [CrossRef]
- Wang, C.X.; Gu, F.; Chen, J.L.; Yang, H.; Jiang, J.J.; Du, T.S.; Zhang, J.H. Assessing the response of yield and comprehensive fruit quality of tomato grown in greenhouse to deficit irrigation and nitrogen application strategies. Agric. Water Manag. 2015, 161, 9–19. [Google Scholar] [CrossRef]
- Pulupol, L.U.; Behboudian, M.H.; Fisher, K.J. Growth, yield and postharvest attributes of glasshouse tomatoes produced under water deficit. HortScience 1996, 31, 926–929. [Google Scholar] [CrossRef] [Green Version]
- Rodriguez-Ortega, W.M.; Martinez, V.; Rivero, R.M.; Camara-Zapata, J.M.; Mestre, T.; Garcia-Sanchez, F. Use of a smart irrigation system to study the effects of irrigation management on the agronomic and physiological responses of tomato plants grown under different temperatures regimes. Agric. Water Manag. 2017, 183, 158–168. [Google Scholar] [CrossRef]
- Machado, R.M.A.; Oliveira, M.D.R.G. Tomato root distribution, yield and fruit quality under different subsurface drip irrigation regimes and depths. Irrig. Sci. 2005, 24, 15–24. [Google Scholar] [CrossRef] [Green Version]
- Cahn, M.D.; Herrero, E.V.; Snyder, R.L.; Hanson, B.R. Water management strategies for improving fruit quality of drip-irrigated processing tomatoes. Acta Hortic. 2001, 542, 111–116. [Google Scholar] [CrossRef]


| Treatment | Total Irrigation Amount (L/plant) | Total Irrigation Frequency (Times) |
|---|---|---|
| Control | 89.6 | 2988 |
| MR z | 30.7 | 176 |
| SR y | 36.5 | 77 |
| DAT | Treatment | Plant Length (m) | Leaf Area (m2/plant) | Internode Length (cm) | Fresh Weight (kg/plant) | Dry Weight (g/plant) | Dry Matter Ratio (%) |
|---|---|---|---|---|---|---|---|
| 34 | Control | 3.6 ± 0.1 a x | 1.17 ± 0.04 a | 10.3 ± 0.3 a | 2.2 ± 0.2 a | 186 ± 13 a | 8.4 ± 0.3 b |
| MR z | 3.3 ± 0.1 b | 1.03 ± 0.03 b | 9.8 ± 0.1 b | 1.5 ± 0.1 b | 157 ± 7 b | 10.4 ± 0.3 a | |
| SR y | 3.0 ± 0.1 b | 1.01 ± 0.01 b | 9.6 ± 0.3 b | 1.4 ± 0.0 b | 126 ± 3 b | 9.2 ± 0.3 a | |
| 83 | Control | 5.2 ± 0.2 a | 0.91 ± 0.04 a | 10.3 ± 0.1 a | 4.3 ± 0.1 a | 407 ± 9 a | 9.5 ± 0.1 b |
| MR | 3.7 ± 0.0 b | 0.68 ± 0.07 b | 8.7 ± 0.4 b | 2.0 ± 0.0 b | 241 ± 5 b | 12.2 ± 0.1 a | |
| SR | 3.9 ± 0.1 b | 0.72 ± 0.04 b | 9.0 ± 0.2 b | 2.2 ± 0.0 b | 260 ± 1 b | 11.6 ± 0.1 a |
Publisher’s Note: MDPI stays neutral with regard to jurisdictional claims in published maps and institutional affiliations. |
© 2022 by the authors. Licensee MDPI, Basel, Switzerland. This article is an open access article distributed under the terms and conditions of the Creative Commons Attribution (CC BY) license (https://creativecommons.org/licenses/by/4.0/).
Share and Cite
Zhao, F.; Yoshida, H.; Goto, E.; Hikosaka, S. Development of an Automatic Irrigation Method Using an Image-Based Irrigation System for High-Quality Tomato Production. Agronomy 2022, 12, 106. https://doi.org/10.3390/agronomy12010106
Zhao F, Yoshida H, Goto E, Hikosaka S. Development of an Automatic Irrigation Method Using an Image-Based Irrigation System for High-Quality Tomato Production. Agronomy. 2022; 12(1):106. https://doi.org/10.3390/agronomy12010106
Chicago/Turabian StyleZhao, Fei, Hideo Yoshida, Eiji Goto, and Shoko Hikosaka. 2022. "Development of an Automatic Irrigation Method Using an Image-Based Irrigation System for High-Quality Tomato Production" Agronomy 12, no. 1: 106. https://doi.org/10.3390/agronomy12010106