Article

Dairy Effluent-Saturated Biochar Alters Microbial Communities and Enhances Bermudagrass Growth and Soil Fertility

1
Department of Biology, University of Texas at Arlington, 501 S. Nedderman Drive, Arlington, TX 76019, USA
2
Department of Biological Engineering, Konkuk University, Seoul 05029, Korea
3
Department of Animal Science and Veterinary Technology, Tarleton State University, 1333 W. Washington, Stephenville, TX 76401, USA
4
Texas A&M AgriLife Research, 1229 North US Highway 281, Stephenville, TX 76401, USA
5
Department of Wildlife and Natural Resources, Tarleton State University, 1333 W. Washington, Stephenville, TX 76401, USA
*
Author to whom correspondence should be addressed.
Agronomy 2021, 11(9), 1794; https://doi.org/10.3390/agronomy11091794
Submission received: 27 July 2021 / Revised: 27 August 2021 / Accepted: 1 September 2021 / Published: 7 September 2021

Abstract

:
Recently, biochar has been proposed for various agronomic applications including improved plant growth and soil fertility. In this study, the effects of dairy effluent-saturated (SBC) and unsaturated wood-derived biochar (UBC) on Bermudagrass (Cynodon spp.) growth, soil fertility and microbial communities were investigated in a greenhouse pot study. SBC and UBC were mixed with sandy loam soil at various loading rates (0, 1, 2, 4, and 8%) to grow Bermudagrass for 10 weeks. Soil physicochemical properties and plant growth measurements were taken, followed by 16S rRNA (V3-V4) amplicon sequencing of soil bacterial communities. Amendment of SBC to soil altered the soil physicochemical properties and increased the concentrations of N and P in the soil at 2 to 8% loading rates compared to UBC treated soil. The addition of SBC to soil also increased the overall plant biomass compared to UBC with more effects on aboveground biomass. Differential abundance analysis of taxa showed enrichment of Proteobacteria in UBC-amended soil, whereas Firmicutes and Nitrospirae were abundant in SBC-amended soil. Interestingly, enrichment of photosynthetic and N-fixing bacteria was observed in both SBC and UBC-amended soils after 10 weeks of treatments. However, oxidative phosphorylation and biotin metabolisms were found to be more abundant in SBC-amended soil compared to UBC-amended soil. Overall, our study suggested that amendment of SBC to soil resulted in enhanced soil nutrients, microbial capacity and Bermudagrass growth than that of UBC. Therefore, application of SBC to soil in field trials would be merited to identify sustainable and effective practices for enhancing plant growth, soil fertility and soil bacterial community.

1. Introduction

Biochar (BC) is a porous carbon material produced by thermal conversion (i.e., pyrolysis) of organic matter under limited oxygen concentration [1]. It exhibits a wide range of physicochemical properties based on feedstock [2], pyrolysis conditions [3], and nutrient saturation onto BC [4]. It also shows high potential in sustainable agriculture for mitigating greenhouse gas (GHG) emission [1,5]. However, outcomes of BC application in agricultural fields are greatly influenced by soil types, BC-soil mixture ratios, and climatic conditions [4,6]. Thus, a substantial knowledge gap exists for optimizing the use of BC in agriculture.
Use of charred biomass in agriculture dates back several thousand years as evidenced by the studies of “Terra Preta” soil in the Amazon basin [7]. Observation of the fertile nature of such soil vis-à-vis surrounding soils led to production and use of biochar in modern agriculture. BC, as a soil amendment, increases fertility of soil [8] thereby enhancing crop yield and plant biomass [6]. It increases cation exchange capacity (CEC) [9] and availability of organic carbon, and microbial activity [10] while providing buffering capacity to maintain appropriate pH [11,12]. As much as a 10-fold increase in crop productivity has been observed in biochar-amended fields [6]. Sequestered C in BC remains in the soil for prolonged periods, acting as a C sink [7]. BC produced by slow pyrolysis under medium temperature (300 to 600 °C) sequestered more C than that under relative higher temperature (600 to 900 °C) [13]. In addition to CO2, it also reduces emission of other harmful GHG including CH4, and N2O as opposed to traditional manure application [5]. The environmentally friendly nature of BC gives added benefits to its widespread use in agriculture.
With increased porosity and water retention capacity, BC exhibit heterogenous ionic properties that determine its ability to retain nutrients from soil, added manure or fertilizer by adsorption [14]. Organic coating on the manure-amended biochar or soil aged biochar provides labile nutrients rather than biochar surface oxidation [15]. Therefore, amendment of biochar with nutrient compounds before application in the field could achieve optimum short-term benefits from low application rates. Most studies suggest that biochar application rates of more than 10 Mg ha−1 enhance crop yields under field condition [4,12], which might not be economically feasible from a farm perspective. Biochar increases crop yield performance only in the second and third year after application, suggesting soil acclimatization delay under field conditions [5,12].
BC can adsorb N, P, K, and organic matter from anaerobic digestates, livestock wastewater and landfill leachates [4,16,17] and prevents leaching of nutrients through soil profiles [17]. Yao and co-workers [17] observed that peanut hull BC pyrolyzed at 600 °C reduced the total amount of NO3, NH4+, and PO43− in leachates by 34, 34.7, and 20.6%, respectively, from sandy soil. BC is more stable than most soil organic matter, therefore, nutrients from dairy effluents become available to plants over longer periods. Meta-analysis shows greater crop yield potential of BC, especially in low-nutrient, acidic soils in high-rainfall tropical regions [18]. Dairies in Texas are mostly concentrated in regions with sandy loam soil, low in organic matter and prone to drought. Several BC types, including those derived from hardwood, increase water holding capacity of sandy loam soil with low organic matter [2,19]. Therefore, in our study, we saturated BC with dairy effluents that could be a promising alternative to improving sandy soil nutrient and water holding efficiency in terms of application rate, availability of nutrients, and waste management.
Soil microbiomes play a crucial role in agricultural fields by regulating dynamic of biogeochemical cycle. The complexity of microbial communities in soil is largely governed by soil physicochemical properties. pH fluctuations [10], water retention capacity [2], C-N ratio, and surface area for biological activities are key factors governing changes in the biological properties of the soil [20]. Labile organic carbon and other nutrients leaching from BC serve as substrates for soil organic matter degradation to support microbial growth for an extended period of time [21]. Therefore, BC has been used as a soil conditioner in soil with low organic matter and nutrients [4]. However, the availability of those substrates is dependent upon BC mineralization degree and rate by abiotic and biotic means [20]. On the other hand, BC-mediated changes in soil microbiota can also be dependent upon the amount of BC applied. Yao and co-workers [22] observed a change in the type of microbes in soil in response to the BC-soil mixture ratio. Therefore, further study of biotic factors is imperative to better understand the mode of action by which BC improves overall soil health.
BC-induced changes in soil biological properties can be assessed by evaluating soil microbial community structure and their functional potentials. Increased soil fertility following BC application is attributed to an increase in microbial biomass and diversity in addition to the availability of nutrients [10,23]. BC amendment has a synergistic effect in the rhizosphere by enhancing colonization of rhizobia that assimilate plant-derived carbon [24]. Variations in the type of microorganisms being colonized are greatly influenced by the BC property associated with the type of organic matter being pyrolyzed [3]. Such properties leave the mechanisms by which BC affects microbiome composition and abundance relatively underexplored.
Although studies have determined effects of BC on plant growth, soil fertility, and microbial communities, few examined the effects of dairy effluent nutrient-saturated BC on plant growth, soil fertility, and microbial communities compared with pristine BC (without any nutrient loading). In our study, our objective was to compare the effect of unsaturated (raw) wood-derived BC (UBC) and dairy effluent nutrient-saturated wood-derived BC (SBC) on the growth of Bermudagrass (Cynodon spp.), soil fertility, and microbial communities in the rhizosphere and bulk soil. We used Bermudagrass (Cynodon spp.) to evaluate the effects of BC on plant growth because it is a widely cultivated pantropical grass used around dairies in north Texas as a forage. The 16S rRNA amplicon sequencing was performed to assess the taxonomy, alpha-beta diversity and functional potential of soil bacterial community. The statistical correlations among plant growth, soil fertility and microbial community for the application of BC on Bermudagrass were investigated.

2. Materials and Methods

2.1. Soil and BC Preparation

Sandy loam soil collected from the top 20 cm of Windthorst fine sandy loams, (fine, mixed, thermic, Udic Paleustaf) was used in our pot experiment [25,26]. Sandy loam soils are prevalent in North Texas where dairy concentrated animal feeding operations exist; however, it possesses low nutrients, and low water holding capacity vis-à-vis what forage crops grown for those dairies require. We used BC (produced from pine chip) purchased from Confluence Energy (Kremmling, CO, USA). This was ground and sieved (<100 µm) for greater effective soil properties. We saturated BC with the nutrients in dairy effluent taken from the 2nd lagoon of Southwest Regional Dairy Center at Tarleton State University (Stephenville, TX, USA). To saturate the nutrients (mostly N and P) onto BC, 1 L of the dairy effluent was stirred at 150 rpm with 100 g of BC for 3 days. The dairy effluent nutrient-saturated BC (SBC) was centrifuged at 3500 rpm for 10 min and dried at 60 °C for 12 h prior to incorporating into pot soil. The pristine BC (UBC), without any nutrient loading from dairy effluent, was incorporated directly after sieving.

2.2. Greenhouse Procedures

In a greenhouse located at Texas A&M AgriLife Research Center, Texas A&M University (Stephenville, TX, USA), SBC or UBC was added to sandy loam soil at 0, 1, 2, 4, and 8% of soil on a dry weight basis and mixed in 1.2-L pots by hand. A total of 1193 g of soil mixture in each pot contained 11.93, 23.86, 47.72, and 95.44 g of BC to make 1, 2, 4, and 8% BC, respectively (Figure S1). Soil in pots with SBC and UBC at 2% and 4% BC rates were compared to no-plant samples and measurements were taken at initial and final time points.
Because Bermudagrass propagates vegetatively, it was pre-cultured before the experiment, and a 15 cm sprig was transplanted into each pot. Pots were watered using 100 mL of reverse osmosis water every 3 days. The pot experiment was conducted in the greenhouse for 70 days with controlled temperature (28 °C) and relative humidity (<40% RH). All treatment combinations were applied in triplicate pots constituting three blocks which consisted of tables within the greenhouse.

2.2.1. Bermudagrass Growth Measurement

The number of leaves per plant was recorded at 1-week intervals during the pot experiments (70 days to observe the effects of BC on the plant growth). Plant growth was measured in the afternoon (1600 to 1800 h).

2.2.2. Soil and Bermudagrass Analyses

On Days 0 and 70, the soil in each pot was sampled for element composition analyses. The elemental composition of the soils with various ratios of BC addition (0–8%) was determined by an inductively coupled plasma emission spectroscopy (Spectro Radial Modula ICP, Spectro analytical Instruments). On Day 70, Bermudagrass was cut at the base and separated from washed roots. After harvesting the plants, stems and roots were dried at 55 °C in a forced-air oven until weight loss ceased, weighed, and then ground through a 1-mm screen using a shear mill. Carbon and N contents (percentage and yield on a dry matter basis) in stem and root were determined by combustion using an Elementar vario Macro C and N analyzer (Elementar Americas, Inc., Mt. Laurel, NJ, USA).

2.3. Microbial Community Analysis in Bulk and Rhizosphere Soil

2.3.1. Library Preparation and Sequencing

Rhizosphere soils were collected from each pot and genomic DNA was extracted in triplets using DNeasy PowerSoil Kit (Qiagen, Hilden, Germany) as recommended by the manufacturer. 16SrRNA V3-V4 hypervariable region was PCR amplified using Illumina adaptor ligated universal primers 341F (5′-tcgtcggcagcgtcagatgtgtataagagacagCCTACGGGNGGCWGCAG-3′) and 806R (5′-gtctcgtgggctcggagatgtgtataagagacagGGACTACNVGGGTWTCTAAT-3′) from each triplet. The thermocycler condition was maintained at 94 °C for 3 min, followed by 25 cycles of 94 °C for 30 s, 55 °C for 30 s, 72 °C for 30 s and a final extension of 72 °C for 3 min. PCR products were gel extracted visually in 1% agarose gel and purified by using QIAquick Gel Extraction Kit, (Qiagen, Hilden, Germany). Purified PCR products in triplets were mixed in equal concentration for each sample and sent to Genomics and Bioinformatics Service, College Station, TX, USA, for further library preparation and sequencing in Illumina MiSeq V3 sequencer (Illumina, San Diego, CA, USA) to produce 300 bp paired end reads. The raw sequencing data were deposited in the NCBI Sequence Read Archive (SRA) database with the BioProject accession ID PRJNA758431 (SRR15671103-SRR15671121).

2.3.2. Bioinformatics for Read Processing

Sequences were analyzed using QIIME 2-2019.7 [27]. Briefly, demultiplexed paired end sequences were denoised, dereplicated, and chimera filtered using DADA2 [28] plugin with the following input parameters; —p-trim-left-f 17, —p-trunc-len-f 280, —p-trim-left-r 20, —p-trunc-len-r 200. Thus, produced amplicon sequence variants (ASVs), considered as 100% Operational taxonomic units (OTUs), were clustered to 97% OTUs (named as OTUs from here onwards) by using open reference-based clustering algorithm in vsearch plugin against trained GreenGenes 13_8 database. To train the database, V3-V4 region of reference reads were extracted using our primer set followed by assigning taxonomy using naïve-bayes classifier in feature-classifier plugin. Singleton ASVs were filtered out prior to clustering to reduce possible sequencing artifacts. Clustered OTUs were further aligned using mafft [29] (via q2-alignment) to construct a phylogenetic tree with fasttree2 [30] (via q2-phylogeny). Taxonomies were assigned from trained GreenGenes 13_8 97% OTUs [31] using naïve Bayes classifier in q2-feature-classify plugin [32].

2.3.3. Predicted Functional Profiling of Microbial Communities

Functional potential of microbial communities was evaluated using phylogenetic investigation of Communities by Reconstruction of Unobserved States (PICRUSt) version 2.2.0_b [33] and Functional Annotation of Prokaryotic Taxa (FAPROTAX) version 1.2.1 [34]. PICRUSt2 [33] is the updated most recent version of the most widely used previous version PICRUSt [35]. OTUs were placed into reference tree of 20000 full 16S sequences from prokaryotic genomes from IMG database using ‘place_seqs.py’, which gives tree in Newick format by using GAPPA [36] after utilizing HMMER (http://hmmer.org/) to place OTUs in the reference tree, followed by rearrangement of OTUs to their best position by EPA-NG [37]. Hidden-state prediction of genomic content of sequences is done by ‘hsp.py’, that wraps castor R package [38] to normalize OTUs by 16S copy number and multiply by their functional predictions to produce a predicted metagenome. Prediction was done with default nearest sequenced taxon index (NSTI) cutoff value 2. Low NSTI value indicates closer placement of OTU from nearest sequenced neighbors, giving more accurate prediction [35]. Finally, KEGG pathway abundances were inferred using ‘pathway_pipeline.py’ that performs structural pathway mapping using MinPath [39].
Additionally, we performed functional annotation using FAPROTAX version 1.2.1, which is the most updated version. The database contains 90 functional groups with 8236 members, which was curated from experimental literatures [34].

2.4. Statistical Analysis

All results were present as average values. Spearman correlation, discriminant analysis (DA), and principal component analysis (PCA) were performed to evaluate the relationships between the physicochemical properties of soil and BC mixtures (i.e., pH, growth, conductivity, element compositions) and the loaded ratios of SBC and UBC using Minitab 16 Statistical Software (Minitab Inc., State College, PA, USA) and XLSTAT software (Addinsoft, New York, NY, USA). Statistical significance was set as p ≤ 0.05, 0.01, and 0.001.
Permutational multivariate analysis of variance (PERMANOVA) test was performed to identify differences in beta diversities among SBC and UBC, as well as between initial and final sampling times. Linear discriminant analysis effect size (LEfSe) [40] was performed to identify differentially abundant features at taxonomic as well as function levels between two different treatment groups using Galaxy Version 1.0 at http://huttenhower.sph.harvard.edu/galaxy/. LEfSe performs Kruskal–Wallis sum-rank test between classes (groups) to identify differential abundance followed by additional pairwise Wilcoxon rank-sum test to check consistency of differences among subclasses. Finally, effect size of each differentially abundant features were estimated using linear discriminant analysis (LDA) [40].

3. Results

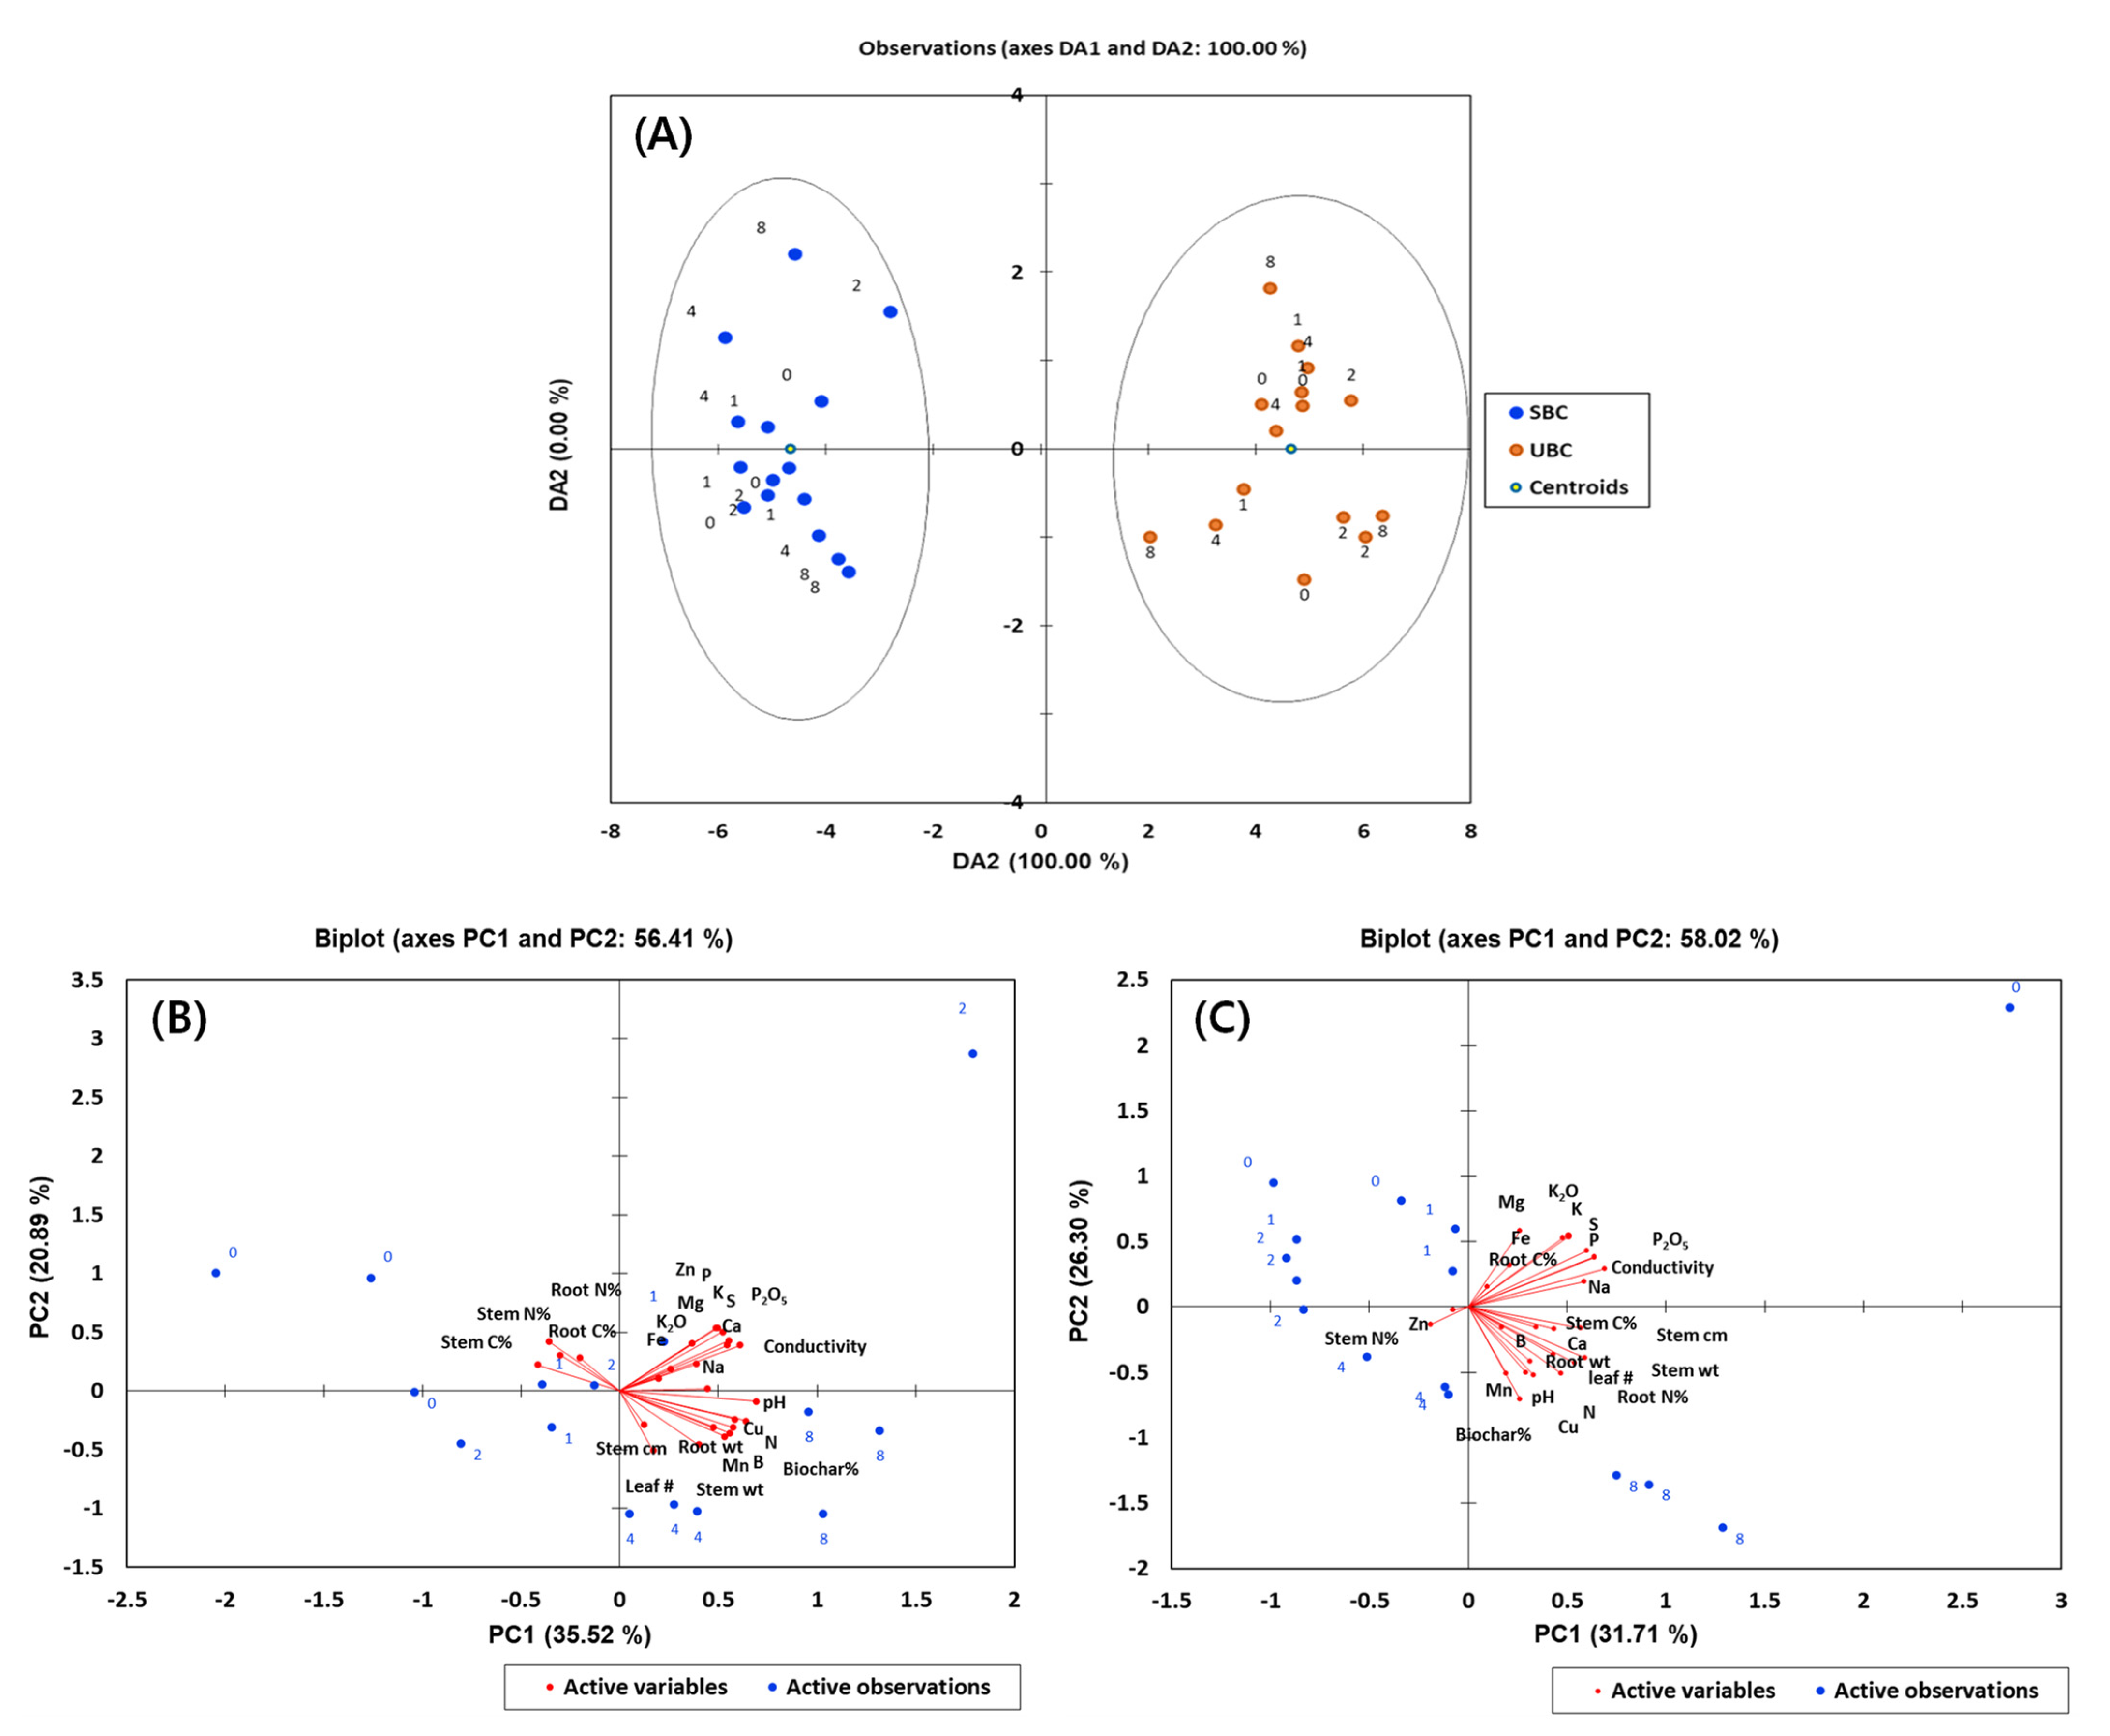
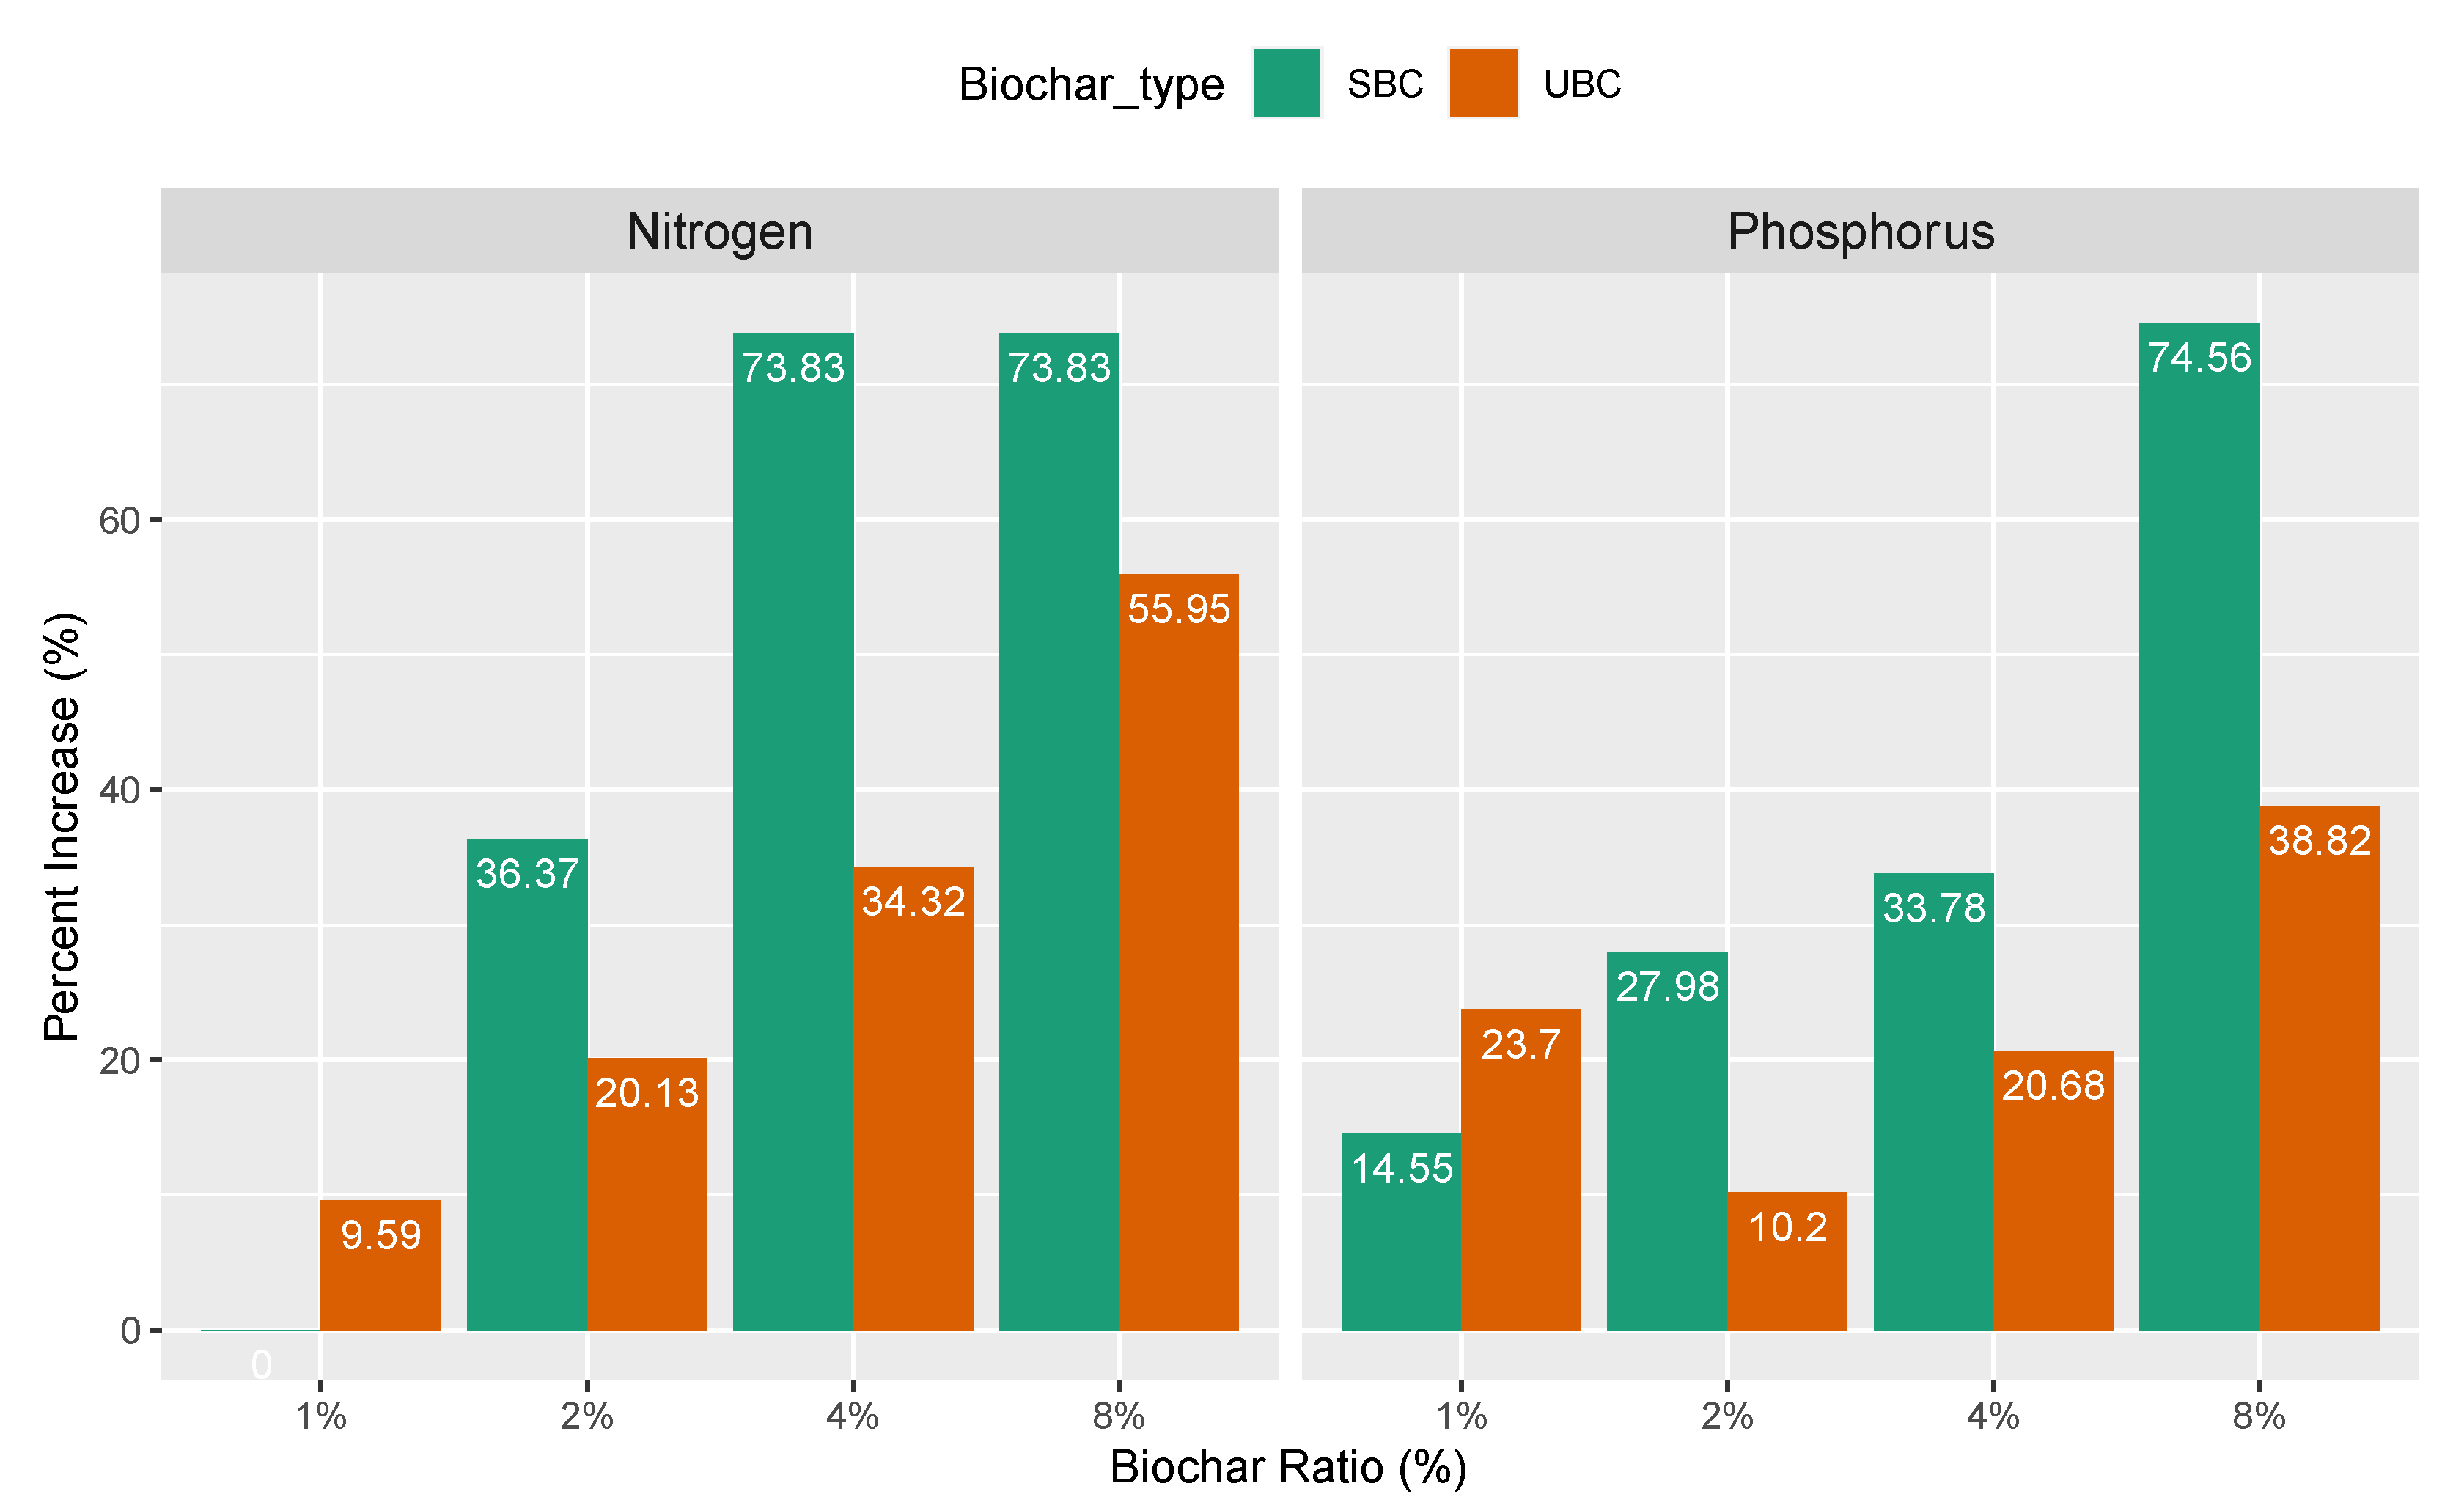
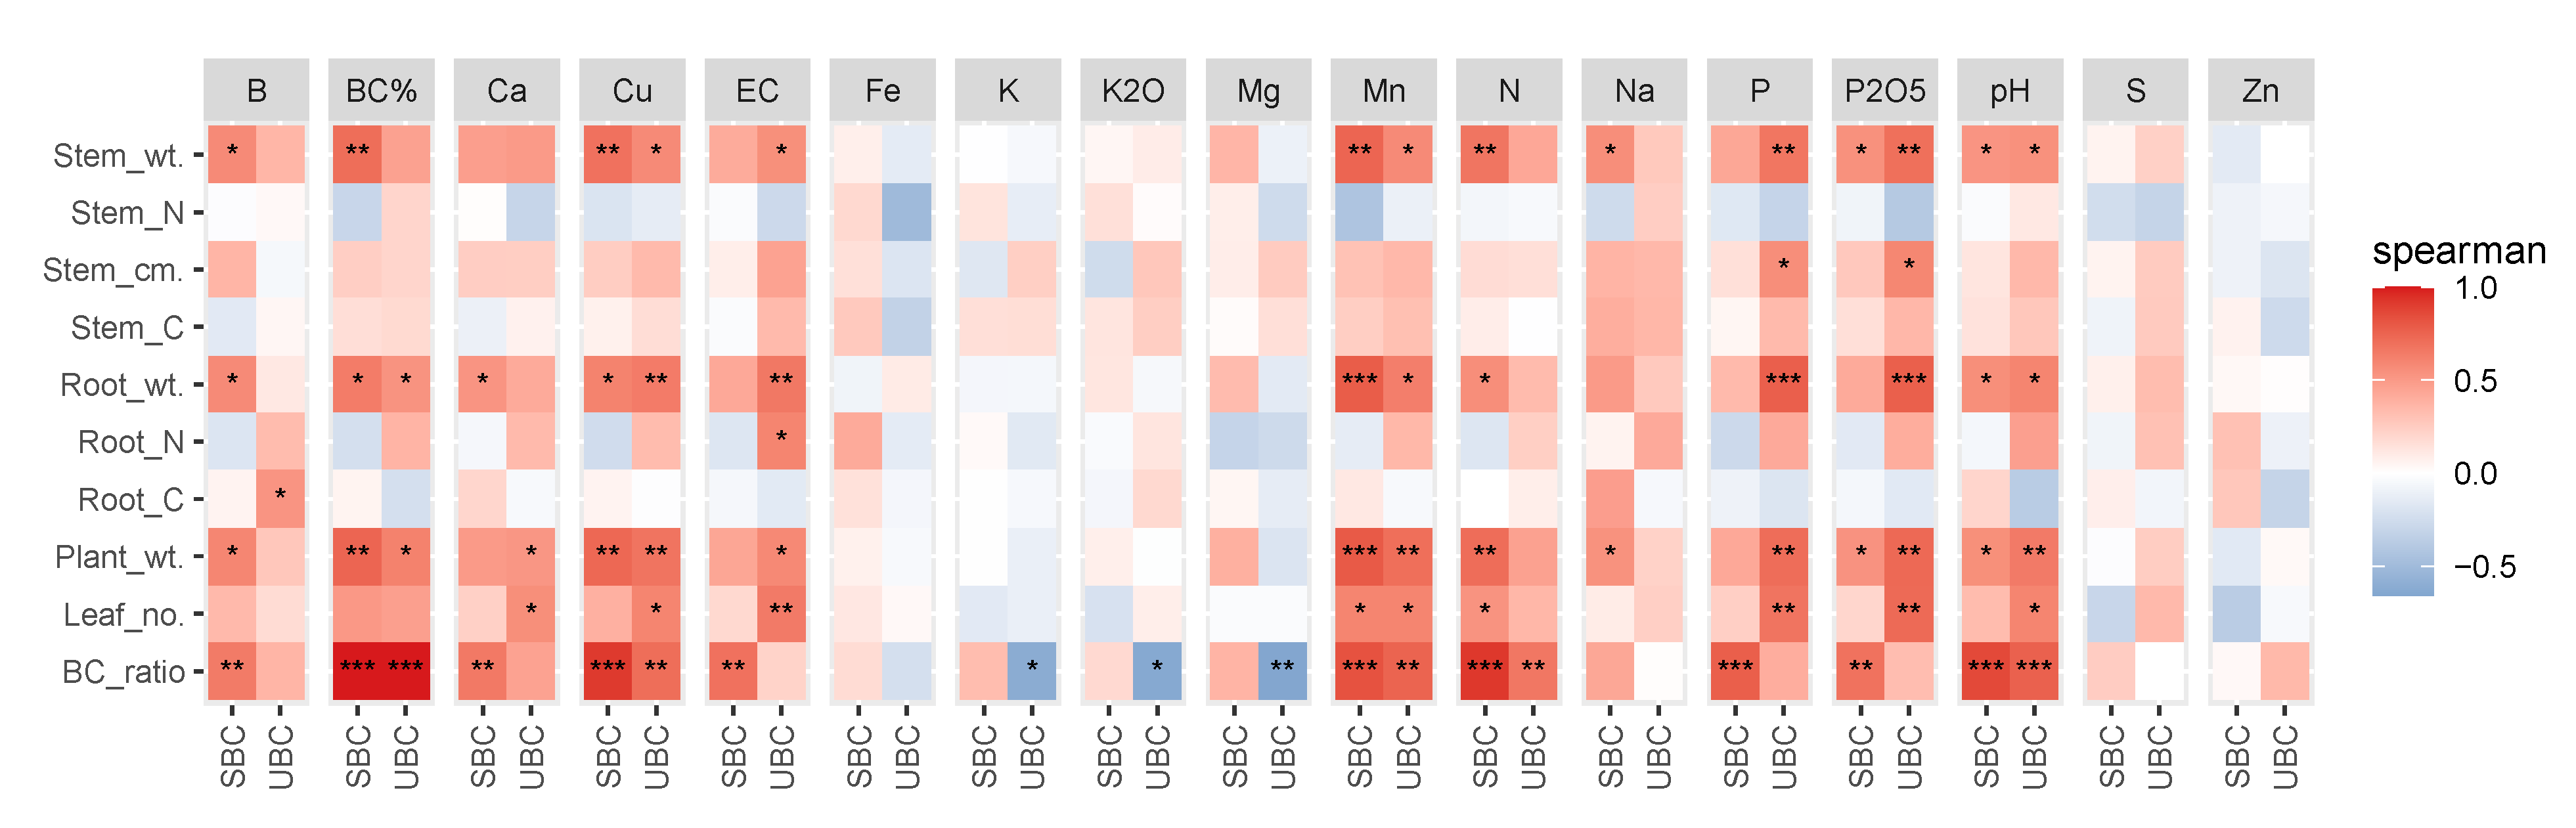
3.1. Soil Physicochemical Properties

Discriminant analysis (DA) of physicochemical properties of soil treated with SBC and UBC showed distinct clusters suggesting differences in soil chemical properties after 10 weeks in response to SBC (Figure 1A).
Table 1 shows the physicochemical properties of the soil (sandy loam soil) and UBC used for this study. Overall, the soil possessed low element contents except for Fe and high levels of electrical conductivity (EC) and low water holding capacity (Table 1). In contrast, N, P, Ca, and Mg contents and water holding capacity (56.60 mL water/100 g dry soil) in the BC pots were much higher than those in the sandy loam soil (Table 1). In addition, the saturation of BC with the dairy effluent increased as follows: 0.19 mg/g of N, 0.09 mg/g of P, and 3.12 mg/g of COD which were adsorbed onto the surface of SBC.
Principal component analysis of SBC- and UBC-treated soil showed that all physicochemical properties were positively correlated with the high BC rates and variation observed among SBC loading rates were less prominent than those observed in UBC (Figure 1B,C). We measured the N and P concentration at 10 weeks in each pot receiving BC. The percent increase in N and P concentrations at 2, 4 and 8% BC rates compared to the control pots were relatively higher in SBC than UBC (Figure 2).
Nitrogen concentration increased from 0 to 73.83% in SBC and 9.59 to 55.95% in UBC relative to the control soils. Similarly, P concentration increased from 14.55 to 74.56% in SBC and 23.7 to 38.82% in UBC. Spearman correlation of BC ratio with soil physicochemical variable showed positive correlation of N with BC ratio in both SBC and UBC treated soil whereas P was only positively correlated in SBC treated soil (Figure 3).

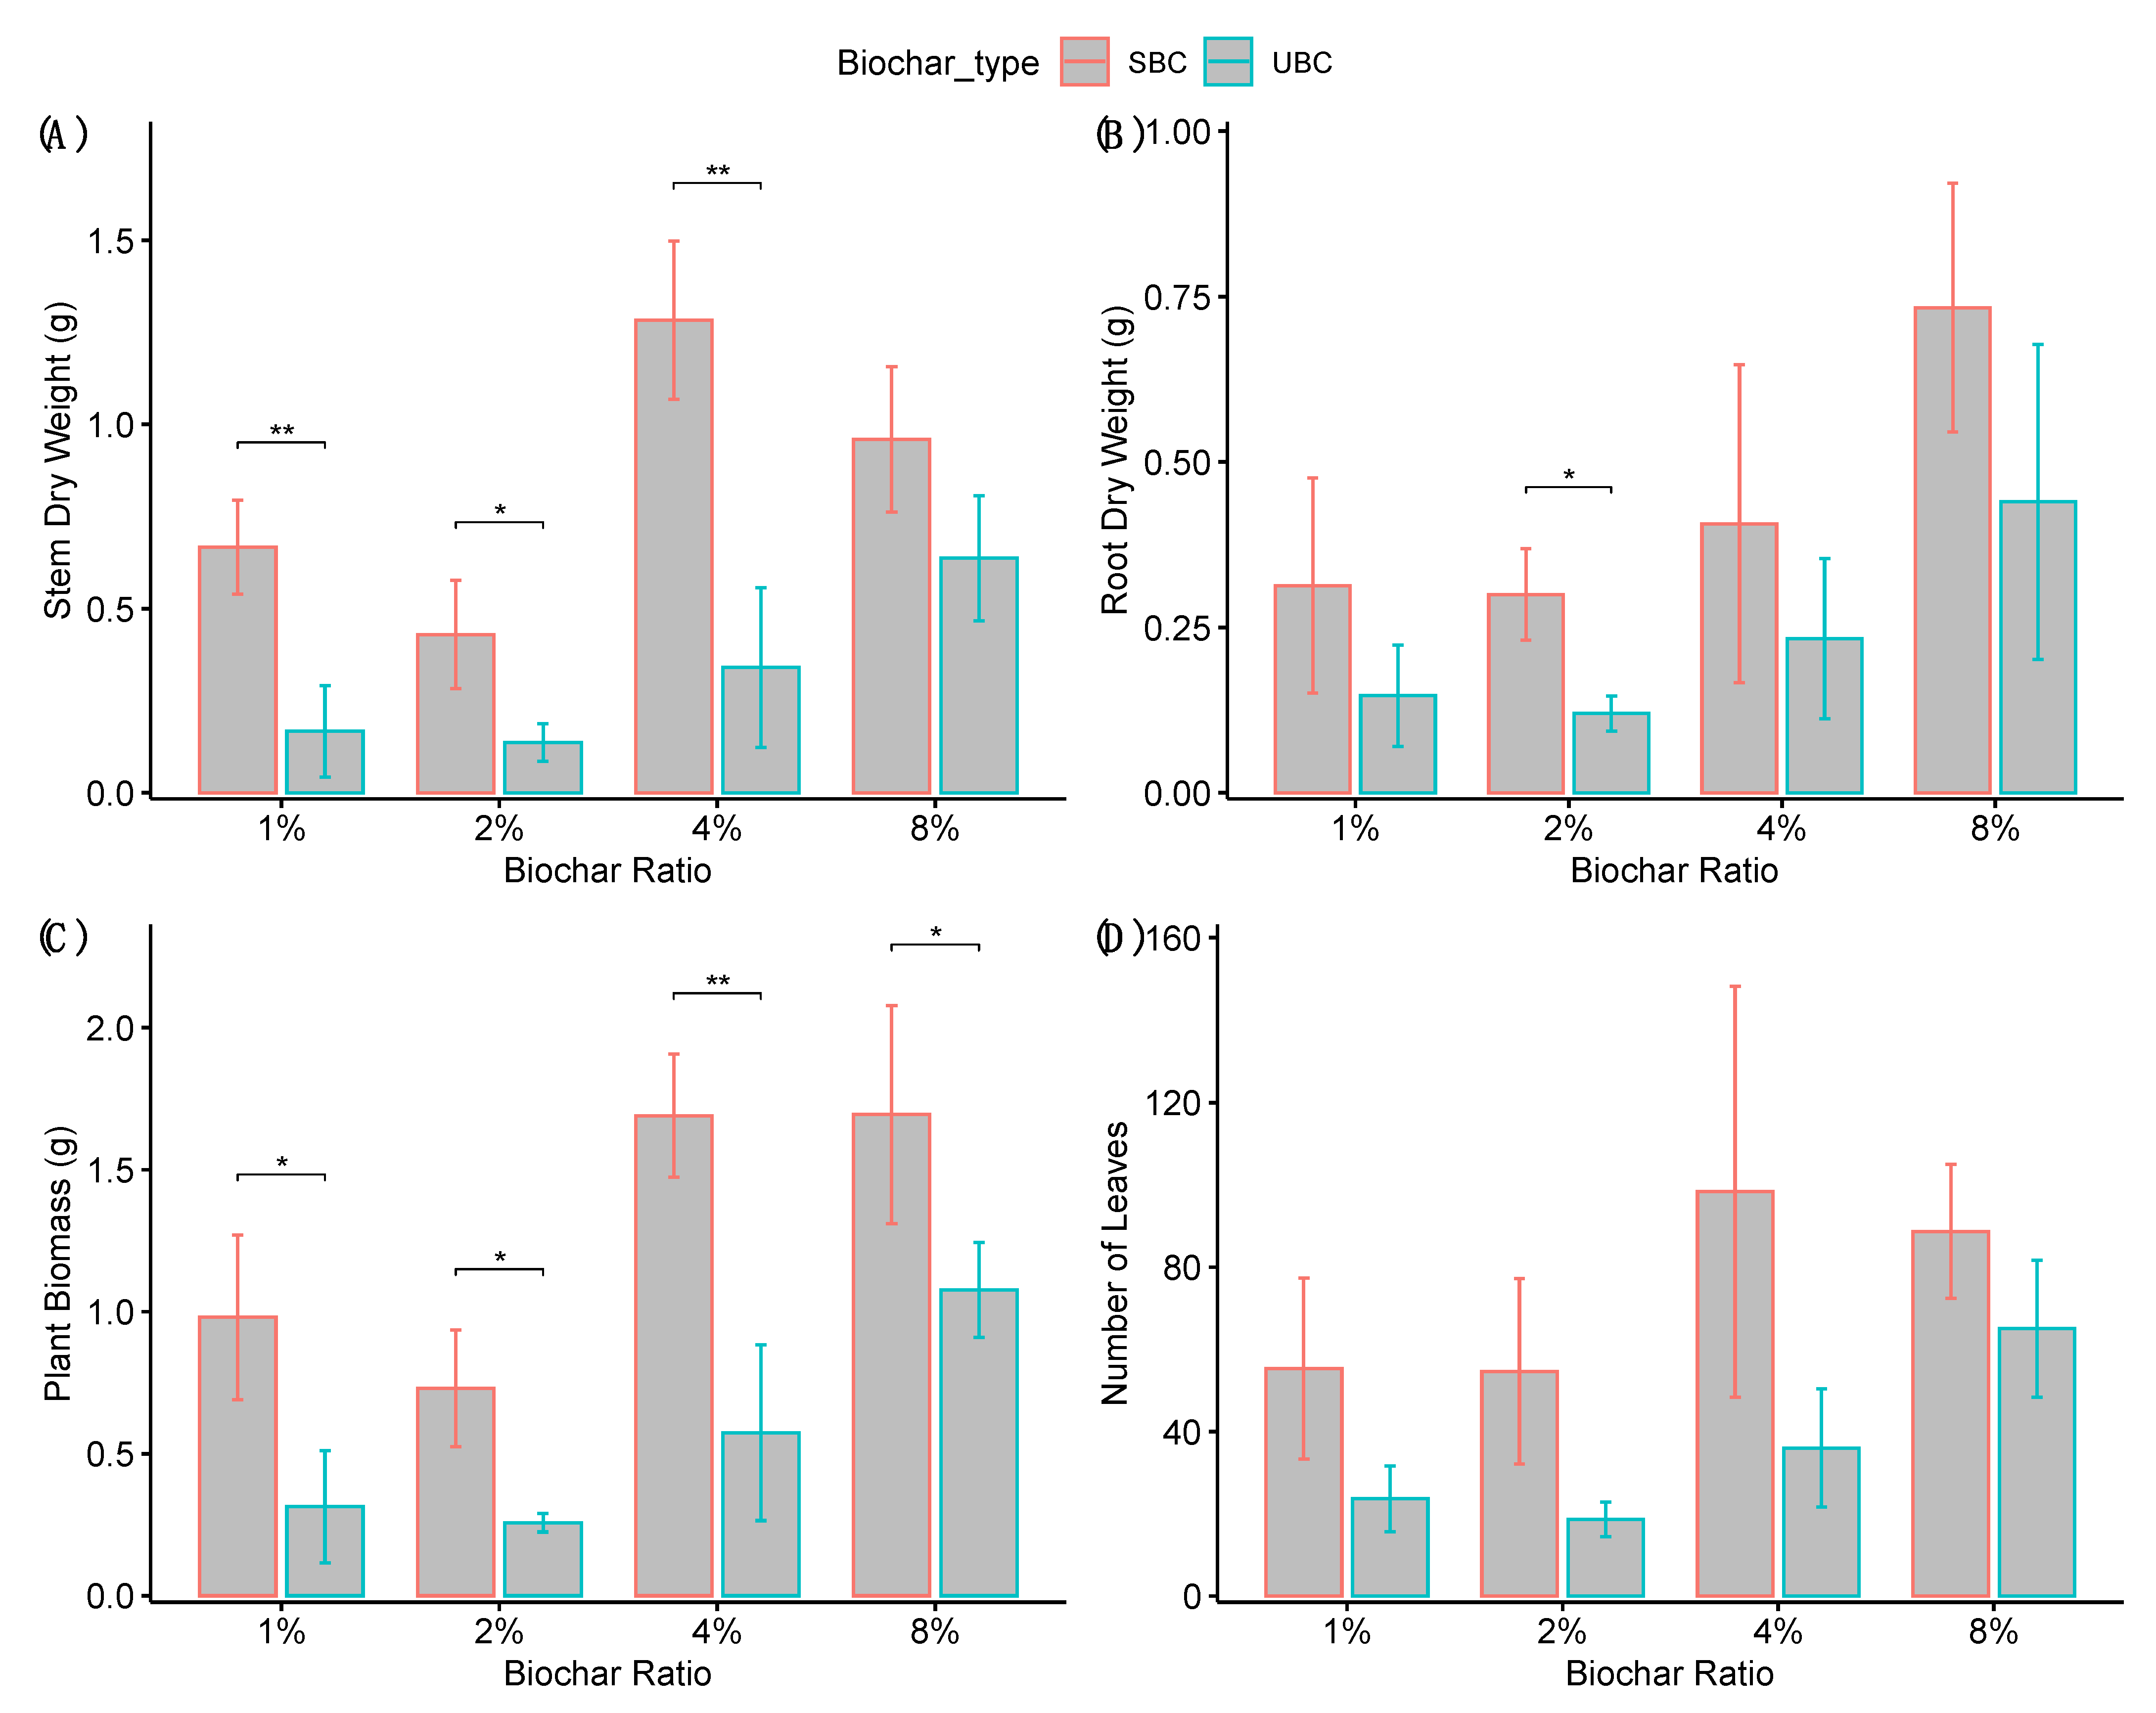
3.2. Effects on Plant Biomass

Soil amendments with SBC and UBC led to overall increase in the growth of the Bermuda grass (Figure S2). The addition of SBC to soil at 1 to 4% resulted in enhanced stem dry weight (Figure 4A): SBC at 1% (p < 0.01), 2% (p < 0.05) and 4% (p < 0.01). Compared with the SBC-amended soil, the plant in the UBC-amended soil had lower stem dry weight. On the other hand, the root dry weight in the SBC and UBC-amended soil increased along with the loading rates (Figure 4B). However, only the BC loading rate of 2% (p < 0.05) had clear differences in root dry weight from those in the SBC and UBC-amended soil. Overall plant biomass (stem and herbage dry weight combined) increased (p < 0.05) in SBC-treated soil compared to UBC-treated soil at all BC rates (Figure 4C). However, comparison of plant biomass between BC rates showed greater biomass only at 8% rates in UBC, whereas both 4 and 8% showed increases in pots receiving SBC (Figure S3C). On the other hand, adding 8% BC increased (p < 0.05) number of leaves (Figures S3D and S4D). No differences were observed in number of leaves among SBC-treated soil at all BC rates (p > 0.05). Therefore, the application of SBC at 1 to 8% to soil enhanced plant growth, while only application of UBC at 8% led to a clear positive effect on the plant growth. These results implied that the loading rates of UBC and SBC also influenced the growth of Bermudagrass during the pot experiment.

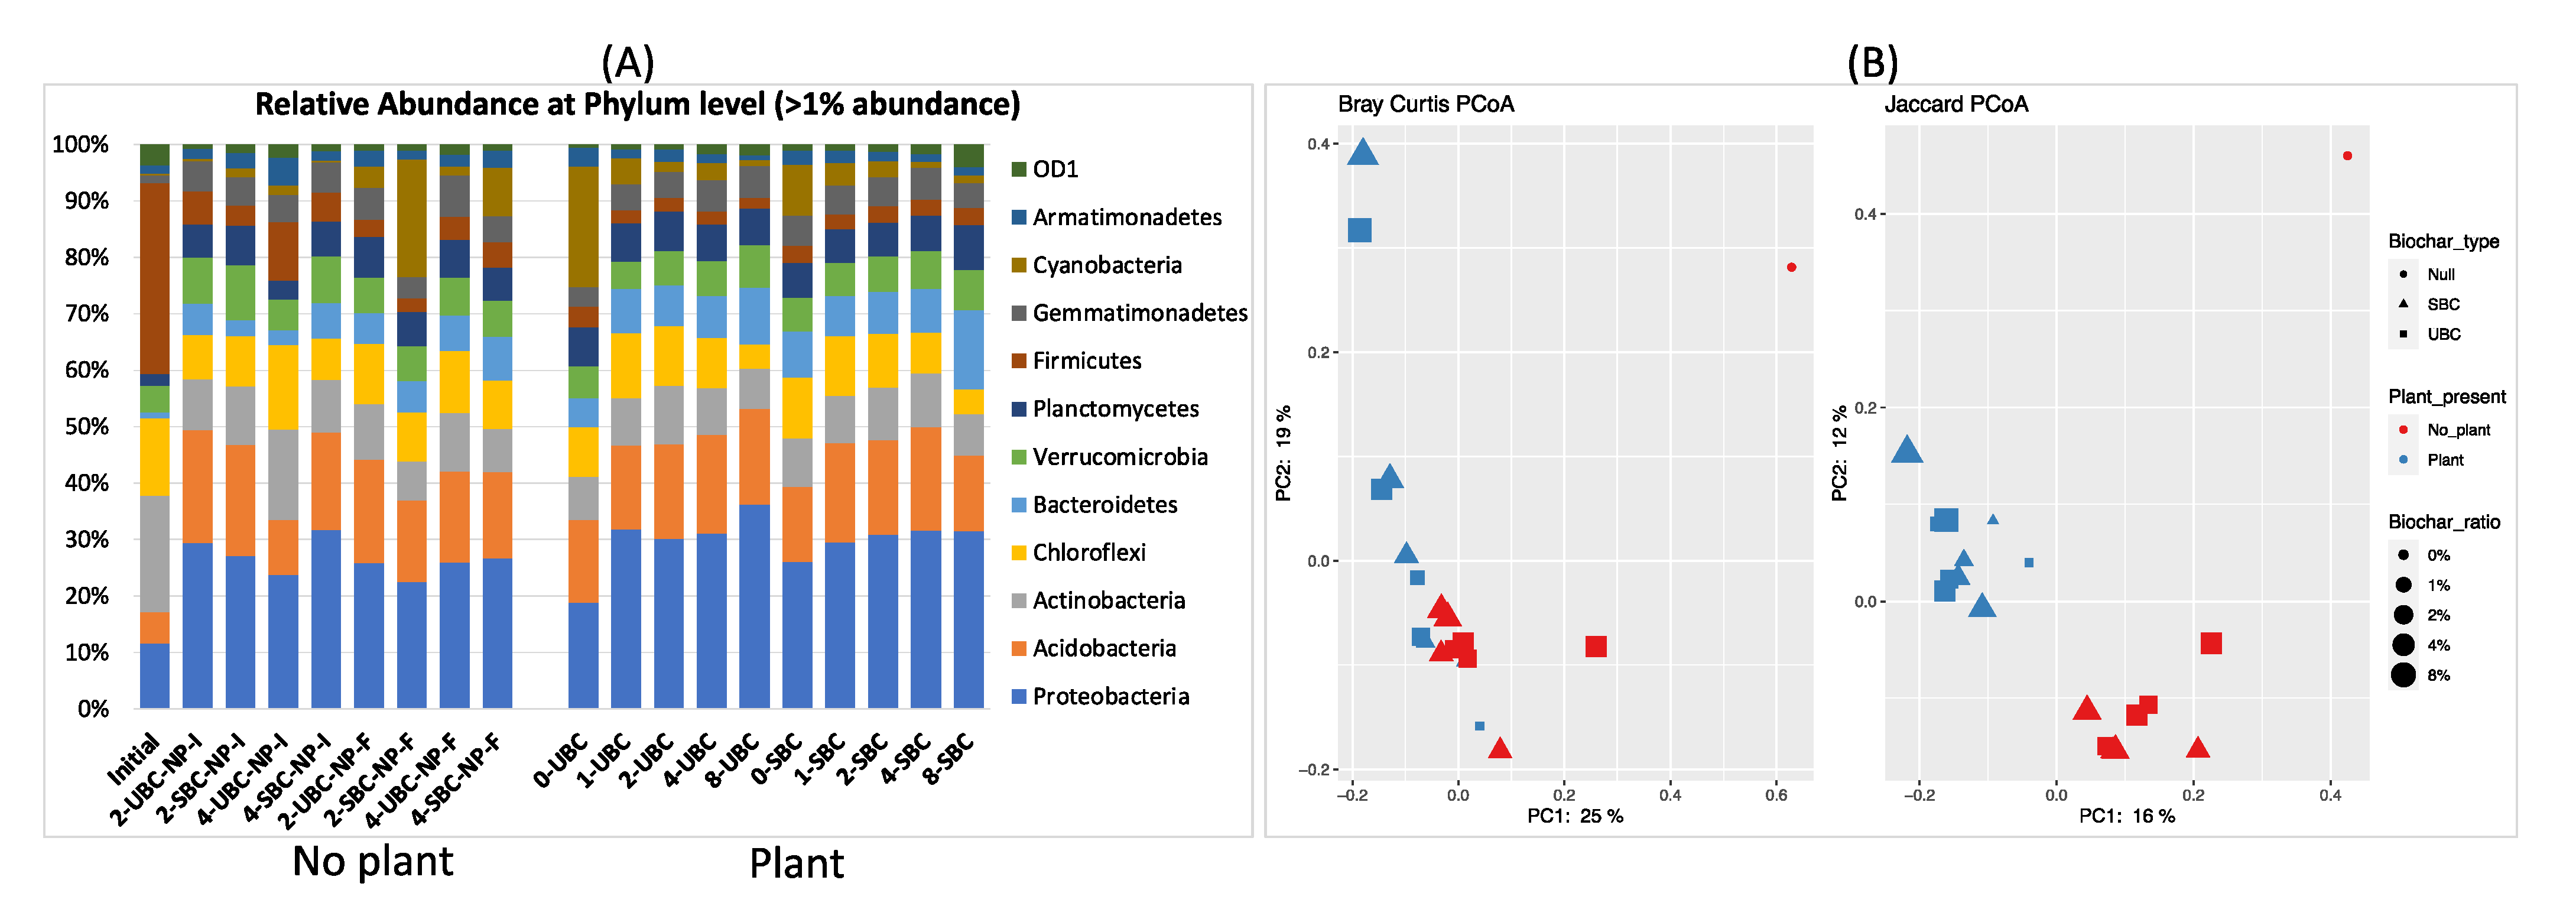
3.3. Microbial Community Composition

A total of 4,547,668 paired end reads (300 bp) were obtained with an average of 239,350 reads per sample. After denoising, dereplication, and chimera filtering, a total of 3,143,571 high-quality reads were obtained with an average read length of 413 bp. To reduce possible noise and sequencing errors, singleton ASVs were filtered out resulting in remaining 3,143,038 reads. Following filtering, sequences were clustered into 9702 OTUs at 97% similarity threshold where the number of reads per sample ranged from a minimum of 74,515 to a maximum of 243,196 reads. We rarefied OTUs at the depth of 74,000 reads/sample for alpha and beta-diversity analysis, which was nearly enough to cover most of the bacterial community in our samples as shown in the rarefaction curve approaching asymptote in (Figure S4).
There were 12 phyla with more than 1% cumulative relative abundance shared among all samples. Proteobacteria was the most abundant phylum in all samples except for initial and 0% UBC, followed by Acidobacteria, Actinobacteria, Chloroflexi and Bacteroidetes (Figure 5A). However, in initial soil, Firmicutes, Actinobacteria, Chloroflexi and Proteobacteria were the most abundant phyla in the given orders. LEfSe analysis showed 15 differentially abundant features (LDA > 2) between SBC and UBC in plant samples. Alpha-proteobacteria (LDA = 3.3, p = 0.02) were more abundant in UBC, whereas Nitrospirae (LDA = 2.48, p = 0.02) and Firmicutes (LDA = 2.98, p = 0.02) were more abundant in soil receiving SBC (Figure S5). Similarly, after 10 weeks, no-plant soils with BC, showed an increased abundance of many photosynthetic genera such as Rhodopila, Rhodobacter, Oscillatoria, Planktothrix, Pseudanabaena, Nodosilinea, Phormidium, and N-fixing genera such as Mesorhizobium, Devosia genera were abundant in BC amended soil (Figure S6).
We compared the beta diversity of the overall samples based on Bray–Curtis and Jaccard distance matrices to determine how communities varied based on abundance and presence-absence. We performed a PERMANOVA test to compare the differences in beta-diversity among groups. Most differences were observed in the type of OTU present based on rhizosphere and non-rhizosphere soil (p = 0.001) (Figure 5B). Furthermore, BC ratio caused a quantitative variation (p < 0.05) in the community composition (Figure 5B).
We predicted functional potential of microbial communities using PICRUst2 and FAPROTAX. OTUs with NSTI > 2 were not included for PICRUSt2 prediction, which increases the accuracy of predicted function [35]. After 10 weeks, KEGG pathway showed increases in photosynthesis and related functions in soil amended with BC (Figure S7B). The result is further confirmed by abundance of FAPROTAX-predicted phototrophy and photoautotrophy in the final sample (Figure S7A). Similarly, oxidative phosphorylation and biotin metabolism were greater in SBC than UBC-treat soils (Figure 6A). FAPROTAX identified more abundant nitrification and aerobic nitrite oxidation in soils receiving SBC (Figure 6B).

4. Discussion

4.1. Alteration of Soil Chemical Properties in Response to Biochar Saturation

Saturating UBC with dairy effluent resulted in distinct soil chemical properties compared to soil receiving UBC, as observed by discriminant analysis. These mainly correlated with higher biochar rates within each condition. However, SBC resulted in very similar nutrient content at all loading rates in contrast to the UBC (Figure 1B,C). In general, BC treatment increases total soil N content in the soil [41]. Biochar can absorb N and P on its surface, both nutrients abundant in dairy wastewater [42], thereby making it available for a long period of time [15]. Biochar mainly contains Ca-bound P [43], which is also suggested by the high amount of Ca in the wood biochar in Table 1. This effect can be seen in our experiment where the percent increase in N and P concentration are relatively higher in SBC- than UBC-treated soil (Figure 2). Both UBC and SBC increased the concentration of N and P in the soils. In addition, these macronutrients along with B, Ca, Cu, Mn, and P2O5 increased with greater BC rates (Figure 3). UBC and SBC treated soil increased the pH of soil while decreasing the EC in soil mainly due to high pH and low EC of BCs as found in Table 1. This suggests that the greater BC rates in soil favor increases in soil chemical reactivity thereby absorbing more nutrients from the dairy effluent. However, accurate economic assessment for agronomic applications of SBC and UBC will be made after large scale use on farms. Nonetheless, since SBC contained greater concentration of nutrients than UBC, possible price of SBC would be higher than that of UBC (USD 300–600/ton of biochar, average price of USD 400/ton of biochar).

4.2. Enhanced Plant Growth Due to Biochar Saturation

Amendment of soil with SBC led to the overall increase in Bermudagrass growth. Our study corroborates other studies that observed increased plant growth and productivity [12,44]. The effect was seen more on the aboveground shoot compared to belowground root development, a favorable trait for forage grass. Some studies have observed increased productivity only a few years after BC application [12], which is partly due to slow breakdown of the nutrients from raw biochar and acclimatization time [21]. In our study, we observed a pronounced immediate effect of BC saturation on plant growth within 10 weeks of growth. This emphasizes the significance of BC saturation prior to its application in the agricultural field. Additionally, pronounced effects at as low as 1% SBC rate suggests the efficacy of low BC application rates on farmland as a commercial biological alternative.
Plant biomass, including number of leaves, was consistently lower in pots receiving 1 and 2% UBC than that of control (Figure S3C,D). Biochar application has not always shown increases in plant growth parameters as exemplified by Yue et al. [44]. In contrast, all our saturated W-BC rates consistently showed an increase in aboveground plant biomass compared to control pots, with greatest increase at 4% (Figure S3A). An increase in biomass with UBC treated soil was only observed in pots receiving 8%, suggesting greater short-term efficacy of BC only after saturation with dairy effluent. Dairy effluents contain more nutrients in their bioavailable form facilitating assimilation of nutrient compounds by plants [42]. As seen in Figure 3, we observed a positive correlation of plant biomass with N and BC ratio associated with SBC-treated soil, suggesting efficient utilization of N by the plant in addition to increased N content in soil. This may be attributed to the active nitrification of ammonium to nitrates in bioavailable form as indicated by differentially abundant phylum Nitrospira in SBC-treated soil [45] (Figure S5). Our results suggest greater N-cycling following saturation rather than greater N accumulation in soil. In contrast, soil P did not correlate with plant biomass in pots receiving SBC although there is a positive correlation with BC rates (Figure 3). This could indicate slower P release in SBC-treated soil due to increased Ca-bound P in dairy effluent and increased pH associated with soil nitrate, which is found to inhibit P uptake by the plant [43].

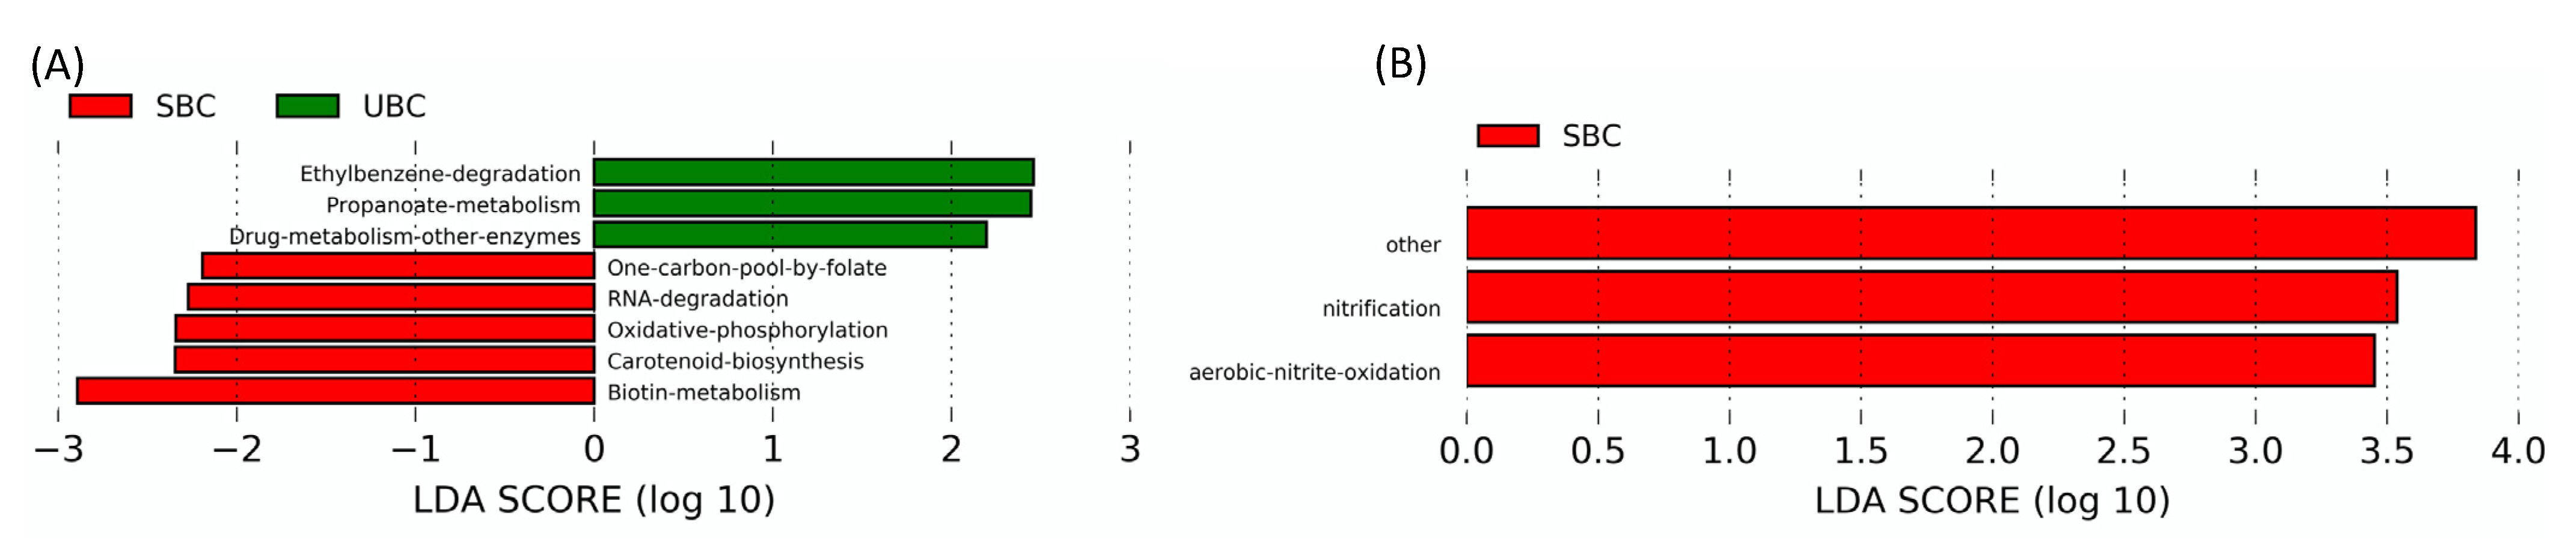
4.3. SBC and UBC Mediated Changes in Microbial Community and Their Functional Potential

We observed differences in microbial community abundance mainly between plant and no-plant samples as well as presence-absence of OTUs. These suggest that BC favors the stratification of specific bacterial community, especially plant growth-promoting bacteria, selectively favored by plant root exudates which provide substrate and/or surface area to increase their abundance. Other studies have found that BC not only provides soil labile-C for degradation [21] but also alters the growth of rhizosphere bacterial community that assimilate plant root exudates [24]. We observed an increased abundance of N-fixing bacteria in the control soil after 10 weeks (Figure S6) in response to overall BC treatment, which indicates enhanced biological N-fixation. Additionally, increased abundance of genera such as Devosia, which is well known to perform bioremediation [46], further emphasizes the significance of BC in remediating toxic chemical fertilizers in agricultural fields. This is an added benefit to the sequestration of greenhouse gases.
Few studies have evaluated the metabolic potential of microorganisms in BC-amended soil [47]. Increases in oxidative phosphorylation in SBC compared to UBC-treated soil indicate better aeration in the former thereby providing energy efficient conditions for microbes (Figure 6A). In photoelectron spectroscopy, co-composted BC increases O/C ratio on the surface [15]. In addition, biotin metabolism is abundant in SBC, an essential cofactor for enzymes involved in key metabolic pathways such as fatty acid metabolism, amino acid metabolism and Krebs cycle. Notably, biotin is stable at higher temperature and pH [48], thereby making it a key candidate for metabolic homeostasis in heat stress conditions. On the other hand, increased Nitrospira in soil containing SBC (Figure S5) suggests active anaerobic ammonia oxidation that plays an important role in N-cycling. Saturation of biochar with dairy effluent showed potential to increase soil nutrient content, thereby stabilizing excess nitrogenous compounds that might otherwise leach out to contaminate the environment.

5. Conclusions

This study investigated the effects of dairy effluent-nutrient loading and application rates on the growth of Bermudagrass, soil properties and microbial communities. SBC, produced from saturation of UBC with dairy effluent, possessed increased nutrients in soil, particularly N and P, resulting in enhanced plant growth and promoting bacteria in the soil. Thus, the application of SBC for enhanced soil fertility and plant growth could be more effective and economical route than UBC (pristine BC) for enhancing agricultural productivity and dairy waste management, thereby mitigating eutrophication and environmental pollution. The BC-mediated changes of soil microbiome showed that photosynthetic and N-fixing genera were predominant after 10 weeks. Similarly, the increased abundance of Nitrospira in SBC-treated soil indicates efficient utilization of ammonia which is available in higher concentration in dairy effluent. The PCA analysis also suggested that SBC could result in uniformity in soil physicochemical properties among different BC loading rates. In our study, both SBC and UBC showed more impact on aboveground biomass than the root biomass of Bermudagrass. Overall, both UBC and SBC at various loading rates should positively influence herbage production in a field setting. Further work will include largescale field studies to validate the outcomes from our greenhouse study so that farmers can apply SBC in crop fields to improve agricultural practices by integrating environmental health and economic profitability. For more economical applications, increased efficacy of SBC at lower rates might be a key to minimize the need of large-scale use of BCs in agricultural fields.

Supplementary Materials

The following are available online at https://www.mdpi.com/article/10.3390/agronomy11091794/s1, Figure S1. Mixture of soil and various rates of wood biochar. Figure S2. Plant growth with different loading rates of the nutrients saturated biochar. Figure S3. Comparison of stem dry weight (A), root dry weight (B), total plant biomass (C), and the number of leaves (D) among biochar rates within each biochar saturation condition. Total plant biomass is the combination of stem and root dry weight. Two sample t-test was performed among each group compared (p-value < 0.05 *, p-value < 0.01 **, p-value < 0.001 ***). Figure S4. Alpha rarefaction curve showing observed OTUs at sampling depth of 74,000 reads. Figure S5. Differentially abundant taxa at class level between SBC and UBC treated soil among plant samples determined by LEFSe analysis. Figure S6. Differentially abundant features after 10 weeks among no-plant soils determined by LEfSe analysis. Comparison was made among no-plant soils with time as class and saturation status subclass. Figure S7. LEfSe analysis of (A) FAPROTAX and (B) PICRUSt2 predicted functions showing temporal variation in functional potential of microbial communities in biochar amended soil. Comparison was made among no-plant samples with time as class and saturation status as subclass.

Author Contributions

Conceptualization, E.K.; methodology, E.K., J.P.M., W.-S.C.; validation, E.K., J.P.M., W.-S.C.; formal analysis, S.N., Y.-K.C.; investigation, S.N., Y.-K.C., K.P.; resources, E.K.; data curation, S.N., Y.-K.C.; writing—original draft preparation, S.N., Y.-K.C.; writing—review and editing, E.K., W.-S.C., J.P.M.; visualization, S.N., Y.-K.C.; supervision, E.K., W.-S.C., J.P.M.; project administration, E.K.; funding acquisition, E.K. All authors have read and agreed to the published version of the manuscript.

Funding

This research was funded by the Texas A&M University Chancellor Research Initiative Fund, grant number 435680, and U.S. Department of Agriculture, grant number TEX09764.

Conflicts of Interest

The authors declare no conflict of interest.

References

  1. Lehmann, J. Bio-energy in the black. Front. Ecol. Environ. 2007, 5, 381–387. [Google Scholar] [CrossRef] [Green Version]
  2. Batista, E.M.C.C.; Shultz, J.; Matos, T.T.S.; Fornari, M.R.; Ferreira, T.M.; Szpoganicz, B.; De Freitas, R.A.; Mangrich, A.S. Effect of surface and porosity of biochar on water holding capacity aiming indirectly at preservation of the Amazon biome. Sci. Rep. 2018, 8, 1–9. [Google Scholar] [CrossRef]
  3. Steinbeiss, S.; Gleixner, G.; Antonietti, M. Effect of biochar amendment on soil carbon balance and soil microbial activity. Soil Biol. Biochem. 2009, 41, 1301–1310. [Google Scholar] [CrossRef]
  4. Kizito, S.; Luo, H.; Lu, J.; Bah, H.; Dong, R.; Wu, S. Role of nutrient-enriched biochar as a soil amendment during maize growth: Exploring practical alternatives to recycle agricultural residuals and to reduce chemical fertilizer demand. Sustainability 2019, 11, 3211. [Google Scholar] [CrossRef] [Green Version]
  5. Zhang, A.; Bian, R.; Pan, G.; Cui, L.; Hussain, Q.; Li, L.; Zheng, J.; Zheng, X.; Han, X.; Yu, X. Effects of biochar amendment on soil quality, crop yield and greenhouse gas emission in a Chinese rice paddy: A field study of 2 consecutive rice growing cycles. Field Crop. Res. 2012, 127, 153–160. [Google Scholar] [CrossRef]
  6. Jeffery, S.; Verheijen, F.G.A.; van der Velde, M.; Bastos, A.C. A quantitative review of the effects of biochar application to soils on crop productivity using meta-analysis. Agric. Ecosyst. Environ. 2011, 144, 175–187. [Google Scholar] [CrossRef]
  7. Glaser, B. Prehistorically modified soils of central Amazonia: A model for sustainable agriculture in the twenty-first century. Philos. Trans. R. Soc. B Biol. Sci. 2007, 362, 187–196. [Google Scholar] [CrossRef] [PubMed] [Green Version]
  8. Ding, Y.; Liu, Y.; Liu, S.; Li, Z.; Tan, X.; Huang, X.; Zeng, G.; Zhou, L.; Zheng, B. Biochar to improve soil fertility. A review. Agron. Sustain. Dev. 2016, 36, 1–18. [Google Scholar] [CrossRef] [Green Version]
  9. Liang, B.; Lehmann, J.; Solomon, D.; Kinyangi, J.; Grossman, J.; O’Neill, B.; Skjemstad, J.O.; Thies, J.; Luizão, F.J.; Petersen, J.; et al. Black Carbon Increases Cation Exchange Capacity in Soils. Soil Sci. Soc. Am. J. 2006, 70, 1719–1730. [Google Scholar] [CrossRef] [Green Version]
  10. Domene, X.; Mattana, S.; Hanley, K.; Enders, A.; Lehmann, J. Medium-term effects of corn biochar addition on soil biota activities and functions in a temperate soil cropped to corn. Soil Biol. Biochem. 2014, 72, 152–162. [Google Scholar] [CrossRef] [Green Version]
  11. Buss, W.; Shepherd, J.G.; Heal, K.V.; Mašek, O. Spatial and temporal microscale pH change at the soil-biochar interface. Geoderma 2018, 331, 50–52. [Google Scholar] [CrossRef]
  12. Pandit, N.R.; Mulder, J.; Hale, S.E.; Zimmerman, A.R.; Pandit, B.H.; Cornelissen, G. Multi-year double cropping biochar field trials in Nepal: Finding the optimal biochar dose through agronomic trials and cost-benefit analysis. Sci. Total Environ. 2018, 637–638, 1333–1341. [Google Scholar] [CrossRef] [PubMed]
  13. Ding, Y.; Liu, Y.; Liu, S.; Huang, X.; Li, Z.; Tan, X.; Zeng, G.; Zhou, L. Potential Benefits of Biochar in Agricultural Soils: A Review. Pedosphere 2017, 27, 645–661. [Google Scholar] [CrossRef]
  14. Mukherjee, A.; Zimmerman, A.R.; Harris, W. Surface chemistry variations among a series of laboratory-produced biochars. Geoderma 2011, 163, 247–255. [Google Scholar] [CrossRef]
  15. Hagemann, N.; Joseph, S.; Schmidt, H.P.; Kammann, C.I.; Harter, J.; Borch, T.; Young, R.B.; Varga, K.; Taherymoosavi, S.; Elliott, K.W.; et al. Organic coating on biochar explains its nutrient retention and stimulation of soil fertility. Nat. Commun. 2017, 8, 1–11. [Google Scholar] [CrossRef] [PubMed]
  16. Hale, S.E.; Alling, V.; Martinsen, V.; Mulder, J.; Breedveld, G.D.; Cornelissen, G. The sorption and desorption of phosphate-P, ammonium-N and nitrate-N in cacao shell and corn cob biochars. Chemosphere 2013, 91, 1612–1619. [Google Scholar] [CrossRef] [PubMed]
  17. Yao, Y.; Gao, B.; Zhang, M.; Inyang, M.; Zimmerman, A.R. Effect of biochar amendment on sorption and leaching of nitrate, ammonium, and phosphate in a sandy soil. Chemosphere 2012, 89, 1467–1471. [Google Scholar] [CrossRef] [PubMed]
  18. Jeffery, S.; Abalos, D.; Prodana, M.; Bastos, A.C.; Van Groenigen, J.W.; Hungate, B.A.; Verheijen, F. Biochar boosts tropical but not temperate crop yields. Environ. Res. Lett. 2017, 12, 053001. [Google Scholar] [CrossRef]
  19. Basso, A.S.; Miguez, F.E.; Laird, D.A.; Horton, R.; Westgate, M. Assessing potential of biochar for increasing water-holding capacity of sandy soils. GCB Bioenergy 2013, 5, 132–143. [Google Scholar] [CrossRef] [Green Version]
  20. Lehmann, J.; Rillig, M.C.; Thies, J.; Masiello, C.A.; Hockaday, W.C.; Crowley, D. Biochar effects on soil biota—A review. Soil Biol. Biochem. 2011, 43, 1812–1836. [Google Scholar] [CrossRef]
  21. Smith, J.L.; Collins, H.P.; Bailey, V.L. The effect of young biochar on soil respiration. Soil Biol. Biochem. 2010, 42, 2345–2347. [Google Scholar] [CrossRef]
  22. Yao, Q.; Liu, J.; Yu, Z.; Li, Y.; Jin, J.; Liu, X.; Wang, G. Changes of bacterial community compositions after three years of biochar application in a black soil of northeast China. Appl. Soil Ecol. 2017, 113, 11–21. [Google Scholar] [CrossRef]
  23. Sun, D.; Meng, J.; Chen, W. Effects of abiotic components induced by biochar on microbial communities. Acta Agric. Scand. Sect. B Soil Plant Sci. 2013, 63, 633–641. [Google Scholar] [CrossRef]
  24. Liao, H.; Li, Y.; Yao, H. Biochar Amendment Stimulates Utilization of Plant-Derived Carbon by Soil Bacteria in an Intercropping System. Front. Microbiol. 2019, 10, 1–13. [Google Scholar] [CrossRef]
  25. Muir, J.P.; Terrill, T.H.; Mosjidis, J.A.; Luginbuhl, J.M.; Miller, J.E.; Burke, J.M.; Coleman, S.W. Season progression, ontogenesis, and environment affect Lespedeza cuneata herbage condensed tannin, fiber, and crude protein concentrations. Crop Sci. 2017, 57, 515–524. [Google Scholar] [CrossRef] [Green Version]
  26. United States Department of Agriculture Soil Conservation Service. Soil Survery of Erath County, Texas; United States Department of Agriculture Soil Conservation Service: Washington, DC, USA, 1973.
  27. Bolyen, E.; Rideout, J.R.; Dillon, M.R.; Bokulich, N.A.; Abnet, C.C.; Gabriel, A.; Ghalith, A.; Alexander, H.; Alm, E.J.; Arumugam, M.; et al. QIIME 2: Reproducible, interactive, scalable, and extensible microbiome data science. PeerJ Prepr. 2018, 6, e27295v2. [Google Scholar] [CrossRef]
  28. Callahan, B.J.; Mcmurdie, P.J.; Rosen, M.J.; Han, A.W.; Johnson, A.J.A.; Holmes, S.P. DADA2: High-resolution sample inference from Illumina amplicon data. Nat. Methods 2016, 13, 581–583. [Google Scholar] [CrossRef] [Green Version]
  29. Katoh, K.; Misawa, K.; Kuma, K.; Miyata, T. MAFFT: A novel method for rapid multiple sequence alignment based on fast Fourier transform. Nucleic Acids Res. 2002, 30, 3059–3066. [Google Scholar] [CrossRef] [Green Version]
  30. Price, M.N.; Dehal, P.S.; Arkin, A.P. FastTree 2—Approximately Maximum-Likelihood Trees for Large Alignments. PLoS ONE 2010, 5, e9490. [Google Scholar] [CrossRef] [PubMed]
  31. Mcdonald, D.; Price, M.N.; Goodrich, J.; Nawrocki, E.P.; Desantis, T.Z.; Probst, A.; Andersen, G.L.; Knight, R.; Hugenholtz, P. An improved Greengenes taxonomy with explicit ranks for ecological and evolutionary analyses of bacteria and archaea. ISME J. 2012, 6, 610–618. [Google Scholar] [CrossRef] [PubMed]
  32. Bokulich, N.A.; Kaehler, B.D.; Rideout, J.R.; Dillon, M.; Bolyen, E.; Knight, R.; Huttley, G.A.; Caporaso, J.G. Optimizing taxonomic classification of marker-gene amplicon sequences with QIIME 2’s q2-feature-classifier plugin. Microbiome 2018, 6, 1–17. [Google Scholar] [CrossRef]
  33. Douglas, G.M.; Maffei, V.J.; Zaneveld, J.; Yurgel, S.N.; Brown, J.R.; Taylor, C.M.; Huttenhower, C.; Langille, M.G.I. PICRUSt2: An improved and extensible approach for metagenome inference. bioRxiv 2019. [Google Scholar] [CrossRef] [Green Version]
  34. Louca, S.; Parfrey, L.W.; Doebeili, M. Decoupling function and taxonomy in the global ocean microbiome. Science 2016, 353, 1272–1277. [Google Scholar] [CrossRef] [PubMed]
  35. Langille, M.G.I.; Zaneveld, J.; Caporaso, J.G.; McDonald, D.; Knights, D.; Reyes, J.A.; Clemente, J.C.; Burkepile, D.E.; Vega Thurber, R.L.; Knight, R.; et al. Predictive functional profiling of microbial communities using 16S rRNA marker gene sequences. Nat. Biotechnol. 2013, 31, 814–821. [Google Scholar] [CrossRef] [PubMed]
  36. Czech, L.; Stamatakis, A. Scalable Methods for Analyzing and Visualizing Phylogenetic Placement of Metagenomic Samples. PLoS ONE 2019, 14, e0217050. [Google Scholar] [CrossRef] [PubMed] [Green Version]
  37. Barbera, P.; Kozlov, A.M.; Czech, L.; Morel, B.; Darriba, D.; Flouri, T.; Stamatakis, A. EPA-ng: Massively Parallel Evolutionary Placement of Genetic Sequences. Syst. Biol. 2019, 68, 365–369. [Google Scholar] [CrossRef] [PubMed]
  38. Louca, S.; Doebeli, M. Efficient comparative phylogenetics on large trees. Bioinformatics 2018, 34, 1053–1055. [Google Scholar] [CrossRef] [PubMed]
  39. Ye, Y.; Doak, T.G. A parsimony approach to biological pathway reconstruction/inference for genomes and metagenomes. PLoS Comput. Biol. 2009, 5, 1–8. [Google Scholar] [CrossRef] [Green Version]
  40. Segata, N.; Waldron, L.; Ballarini, A.; Narasimhan, V.; Jousson, O.; Huttenhower, C. Metagenomic microbial community profiling using unique clade-specific marker genes. Nat. Methods 2012, 9, 811. [Google Scholar] [CrossRef]
  41. Biederman, L.A.; Stanley Harpole, W. Biochar and its effects on plant productivity and nutrient cycling: A meta-analysis. GCB Bioenergy 2013, 5, 202–214. [Google Scholar] [CrossRef]
  42. Demirel, B.; Yenigun, O.; Onay, T.T. Anaerobic treatment of dairy wastewaters: A review. Process Biochem. 2005, 40, 2583–2595. [Google Scholar] [CrossRef]
  43. Xu, G.; Sun, J.N.; Shao, H.B.; Chang, S.X. Biochar had effects on phosphorus sorption and desorption in three soils with differing acidity. Ecol. Eng. 2014, 62, 54–60. [Google Scholar] [CrossRef]
  44. Yue, Y.; Cui, L.; Lin, Q.; Li, G.; Zhao, X. Efficiency of sewage sludge biochar in improving urban soil properties and promoting grass growth. Chemosphere 2017, 173, 551–556. [Google Scholar] [CrossRef]
  45. Daims, H.; Lebedeva, E.V.; Pjevac, P.; Han, P.; Herbold, C.; Albertsen, M.; Jehmlich, N.; Palatinszky, M.; Vierheilig, J.; Bulaev, A.; et al. Complete nitrification by Nitrospira bacteria. Nature 2015, 528, 504–509. [Google Scholar] [CrossRef] [PubMed]
  46. Talwar, C.; Nagar, S.; Kumar, R.; Scaria, J.; Lal, R.; Negi, R.K. Defining the Environmental Adaptations of Genus Devosia: Insights into its Expansive Short Peptide Transport System and Positively Selected Genes. Sci. Rep. 2020, 10, 1–18. [Google Scholar] [CrossRef]
  47. Sun, D.; Meng, J.; Xu, E.G.; Chen, W. Microbial community structure and predicted bacterial metabolic functions in biochar pellets aged in soil after 34 months. Appl. Soil Ecol. 2016, 100, 135–143. [Google Scholar] [CrossRef]
  48. Streit, W.R.; Entcheva, P. Biotin in microbes, the genes involved in its biosynthesis, its biochemical role and perspectives for biotechnological production. Appl. Microbiol. Biotechnol. 2003, 61, 21–31. [Google Scholar] [CrossRef] [PubMed]
Figure 1. Physicochemical properties of wood biochar (BC) treated soil. Discriminant analysis (DA) among soil treated with SBC and UBC (A). Principal component analysis (PCA) of soil properties, plant growth parameters and the loading rates of saturated BC (SBC) in soil (B) and unsaturated biochar (UBC) in soil (C).
Agronomy 11 01794 g001
Figure 2. Percent increase in the N and P concentration in 10-week samples in comparison to the control.
Agronomy 11 01794 g002
Figure 3. Spearman correlation of soil physicochemical variables and plant growth parameters among soil samples treated with saturated and unsaturated biochar (p-value < 0.05 *, p-value < 0.01 **, p-value < 0.001 ***).
Agronomy 11 01794 g003
Figure 4. Comparison of stem dry weight (A), root dray weight (B), total plant biomass (C), and the number of leaves (D). Total plant biomass is the combination of stem and root dry weight. Two sample t-test was performed among each group compared (p-value < 0.05 *, p-value < 0.01 **).
Agronomy 11 01794 g004
Figure 5. Microbial community composition. Relative abundance of major taxa at phylum level (A). Principal coordinate analysis of the microbial community at OUT level (B). (Abbreviations: NP; No plant, I; Initial, F; Final).
Agronomy 11 01794 g005
Figure 6. Differential abundance of predicted functions between SBC and UBC treated soil. LEFSe analysis of PICRUSt2 (A) and FAPROTAX (B) predicted functions in SBC and UBC treated soil among no-plant samples and plant samples, respectively.
Agronomy 11 01794 g006
Table 1. Characteristics of soil and wood-derived biochar.
ParametersSoilWood Biochar
pH6.068.80
Electrical conductivity (mmhos/cm)131.900.11
Water holding capacity
(mL water/100 g dry material)
26.9056.60
N (mg/g)0.554.06
P (mg/g)0.090.20
K (mg/g)1.201.34
Ca (mg/g)0.984.62
Mg (mg/g)0.591.12
Na (mg/g)0.130.44
Fe (mg/g)7.740.66
Zn (mg/g)0.020.06
Cu (mg/g)0.010.11
Mn (mg/g)0.110.43
S (mg/g)0.070.08
B (mg/g)0.000.01
Organic carbon (%)0.300.64
Publisher’s Note: MDPI stays neutral with regard to jurisdictional claims in published maps and institutional affiliations.

