Article

Effect of Forage Plant Mixture and Biostimulants Application on the Yield, Changes of Botanical Composition, and Microbiological Soil Activity

by
Waldemar Zielewicz
1,*,
Arkadiusz Swędrzyński
1,
Jakub Dobrzyński
2,
Dorota Swędrzyńska
3,
Iryna Kulkova
2,
Paweł Stanisław Wierzchowski
2 and
Barbara Wróbel
2,*
1
Department of Grassland and Natural Landscape Sciences, Poznan University of Life Sciences, Wojska Polskiego 28, 60-637 Poznan, Poland
2
Department of Grassland Farming, Institute of Technology and Life Sciences-National Research Institute, Falenty, 3 Hrabska Avenue, 05-090 Raszyn, Poland
3
Department of General and Environmental Microbiology, Poznan University of Life Sciences, Wojska Polskiego 28, 60-637 Poznan, Poland
*
Authors to whom correspondence should be addressed.
Agronomy 2021, 11(9), 1786; https://doi.org/10.3390/agronomy11091786
Submission received: 13 August 2021 / Revised: 2 September 2021 / Accepted: 4 September 2021 / Published: 7 September 2021
(This article belongs to the Special Issue Protection of Biodiversity of Agricultural Soils)

Abstract

:
Recently, an increasing interest in such fertilizers and fertilization methods which not only directly supply nutrients to plants, but also stimulate soil bioactivity is noted. Their effect on both soil microbiota and forage plants has not been fully recognized. The aim of the study was to investigate the combined effect of forage plant mixture type and mineral fertilizers (NPK) with biostimulants based on a marine algae extracts on the botanical composition, yield, the structure of selected taxonomic and trophic groups of soil microorganisms, and the soil enzymatic activity. During the years 2018–2019 a field experiment established in split-plot design with two different forage plant mixtures, as a first factor, and different fertilization basing on mineral fertilizers amended with biostimulants, as a second factor was conducted. Two types of forage mixtures of sown species were used: grass mixture (GM) and legume-grass mixture (LGM). Every year the following biostimulants were applied: N-14, PinKstart, Physiostart, Physioactive and they were compared with standard NPK fertilisation and no fertilisation as a control. The reaction of forage plant mixtures on applied fertilisation was different. The intensive development of grass species, mainly Lolium perenne, at the expense of Trifolium repens share in LGM was observed. In GM sward dominated Dactylis glomerata. A beneficial effects of biostimulants’ application on the biomass yields of both grass mixtures was observed. The systematic soil acidification and a decrease of soil enzymatic activity in result of applied fertilization, except NPK + Physioactive treatment (calcium fertilizer containing 76% calcium carbonate), was noted. Soil reaction to applied fertilisation was dependent on the botanical composition of the sward. The counts of microorganisms in the soil under LGM were almost two times higher than in the soil under GM. The most effective, in reducing the negative effect of nitrogen mineral fertilization on the pH of soil, was fertilization with NPK + Physioactiv.

1. Introduction

One of the main factors determining the productivity of all agricultural lands, including grasslands, is fertilization, especially mineral fertilization. The main goal of fertilization is to obtain a yield of optimal quality and quantity by supplying various micro- and macronutrients. Common mineral fertilizers such as ammonium nitrate, potassium salt and superphosphate, as well as natural fertilizers such as liquid manure and slurry are applied to the grassland. Fertilizers modify the botanical composition of the sward in meadow communities [1,2,3] and the biological composition of the soil environment [4,5,6,7,8,9]. Long-term use of mineral fertilisers limited to NPK alone can have an adverse effect on the soil environment. The chemical and biological properties of the soil are degraded. The content of calcium, magnesium and other elements is reduced, the pH of the soil decreases and the microbial life of the soil becomes poorer [6]. In recent years there has been increasing interest in the forms and methods of fertilization which not only directly supply minerals to plants, but also stimulate soil bioactivity and increase the availability of soil nutrients [10,11].
Soil bioactivity is the result of synergy between the activity of plants (e.g., root exudates) and the soil edaphon, where microorganisms are of key importance as they are responsible for most of the soil matter circulation and determining the nutrients availability to plants [12,13,14,15,16]. Thus, the taxonomic and trophic structure of the population of soil microorganisms is a good indicator of the processes occurring in soil, and it is commonly used to assess the influence of various factors, including agro technical practices [10,17,18,19].
Enzymatic activity is another indicator of soil bioactivity [20,21]. It results from plant metabolism, and above all, the metabolism of the soil microbiome [22]. The soil enzymes activity is determined by various environmental factors (humidity, temperature, availability of oxygen, pH, the presence of organic matter) and agrotechnical ones (pesticides, cultivation method, fertilization). Therefore, it is considered a very good and reliable indicator of the biological condition of soil, including its fertility [4,10,23,24,25,26].
Long-term fertilization with high doses of mineral fertilizers has both biologically and chemically negative influence on the soil environment. N fertilization affects the botanical composition negatively, resulting in a lower legume proportion which results in less crude protein content in forage [1]. This influence can be manifested by the improper structure of soil microbial communities, disturbances in the soil enzymatic activity, unfavourable changes in pH or disordered balance between mineral components of soil. All these changes lead to the degradation of soil and decrease in production potential [27,28].
Partial supplementation of mineral fertilizers with biostimulants may reduce their amounts needed to achieve the expected production effect [29,30,31]. Biostimulants added to fertilizers contain various chemical compounds or microorganisms, which are usually applied directly into soil. According to EU legislation a plant biostimulant is a product stimulating plant nutrition processes, the sole purpose of which is to improve at list one of the following characteristics of the plant or the plant rhizosphere: nutrient use efficiency, tolerance to abiotic stresses, quality traits, or availability of limited nutrients in the soil or rhizosphere [32]. There is a very wide spectrum of effects of this fertilization method. Biostimulants may positively affect plants’ health, yield, and increase their resistance to abiotic stresses, by direct and indirect effect on plants. For example, biostimulants may increase the counts of important physiological groups of microorganisms, and thus indirectly lead to more effective bioconversion of the forms of minerals which are difficult for plants to absorb [6,26,33]. There are also opinions about the lack or insignificant effect of biostimulants on crops and soil microflora [34,35,36,37].
Seaweed extracts, which contain a complex mixture of polysaccharides, micronutrients, and plant growth hormones, can also act as biostimulants. A variety of commercial seaweed extract products are now available worldwide for use in agriculture and horticulture [38,39]. Seaweed extract may have a significant impact on soil bacterial communities [40], and also may enhance arbuscular mycorrhizal fungal growth [39]. Moreover, these extracts are reported to act as chelators, improving the utilization of mineral nutrients by plants and improving soil structure and aeration, which may stimulate root growth [41]. They have a stimulatory effect on plant growth and can enhance plant resistance to abiotic and biotic stresses. Biostimulants in principle should have a positive influence not only on plants but also on the soil environment [38,39,42]. However, due the increasing number of these substances it is necessary to continuously investigate various aspects of the effects of their application.
The work hypothesis was that biostimulants increase soil microbial activity. These effects can be direct and indirect (soil pH, modification of biomass yield and botanical composition of the sward).
The aim of the study was to investigate how the supplementation of mineral fertilization (NPK) with biostimulants based on a marine algae extract influenced a sward with two types of forage plants mixtures (grasses, and legumes with grasses). The effect of the biostimulants on the botanical composition of the sward, yield, the structure and counts of selected taxonomic and trophic groups of soil microorganisms, and the soil enzymatic activity were investigated.

2. Materials and Methods

2.1. Study Site and Weather Conditions

The research was carried out in 2018 and 2019 on the field experiment established in 2015 (in split plot design) in the Experimental Station of the Department of Grassland and Natural Landscape Sciences at Poznań University of Life Sciences located in Brody Experimental Farm (Wielkopolska Voivodship, Lwówek municipality, Poland; 52°43′ N, 16°30′ E). The single plot area was 15.0 m2 (1.5 × 10.0 m). The space between the plots was 0.5 m.
It was located on soil classified into an order of lessive soils, subgroup of typic lessive soils, family of boulder clay, and series of light and heavy loamy sands. According to international World Reference Base [43] classification, the soil was included in Albic Luvisols, and according to Soil Taxonomy in Typic Hapludalfs, regarding granulation in loamy sand underlined by loam [44]. The soil of the experimental field was classified as bonitation class IIIb-IVa, of a very good rye complex. In terms of physic-chemical properties, the soil was characterized by the following parameters: mildly acidic reaction of a soil (pHKCl = 6.5), 1.24% content of humus, 16% share of floated parts. Content of available nutrients in the topsoil, measured each year before fertilization, was high for phosphorus—78 mg P·kg−1 soil, medium for potassium—132 mg K·kg−1 soil (double lactate method), and medium for magnesium—54 mg Mg·kg−1 soil (Schachtschabel method).
In autumn 2015 two seeds mixtures were sown (each for a quantity of 40 kg·ha−1). The grass mixture (GM) content was: Lolium perenne L. 4n—30%, Lolium westerwoldicum R.Br.—20%, Dactylis glomerata L.—20%, Festuca pratensis Huds.—15%, Phleum pratense L.—15%. Legume-grass mixture (LGM) was composed of: Lolium perenne L. 2n—20%, Lolium perenne L. 4n—20%, Lolium multiflorum Lam. 2n—10%, Festuca pratensis Huds.—15%, Festuca arundinacea Schreb.—10%, Phleum pratense L.—15%, Trifolium repens L.—10%. In 2016 (in the first year of utilization) the initial botanical composition of meadow swards was obtained. In the next years sward was mowed three times during the growing season.

2.2. Experimental Design

A two-factor experiment in split plot design in triplicate with two different forage plants mixtures, as a first factor, and the different fertilization basing on mineral fertlizers amended with biostimulants, as a second factor was conducted.
The first experimental factor was type of forage plants mixture differing with botanical compositions: grass mixture (GM) and legume-grass mixture (LGM).
In the sward of the grass mixture (GM) in 2016 the following species were observed: perennial ryegrass (Lolium perenne)—48%, cocksfoot (Dactylis glomerata)—19%, meadow fescue (Festuca pratensis)—8%, timothy (Phleum pratense)—7%, westerwold ryegrass (Lolium westerwoldicum)—6%, shepherd’s purse (Capsella bursa-pastoris (L.) Medik.)—3%, common dandelion (Taraxacum officinale F.H. Wigg.)—4%, small-flowered crane’s-bill (Geranium pusillum L.)—2%, scented mayweed (Matricaria chamomilla L.)—2%, common chickweed (Stellaria media (L.) Will.)—1%.
In the sward of the legume-grass mixture (LGM) the following species were found: white clover (Trifolium repens)—39%, perennial ryegrass (Lolium perenne)—19%, Festuca arundinacea—13%, italian ryegrass (Lolium multiflorum)—8%, meadow fescue (Festuca pratensis)—8%, timothy (Phleum pretense)—6%, common dandelion (Taraxacum officinale)—3%, common chickweed (Stellaria media)—2%, shepherd’s purse (Capsella bursa-pastoris)—1%, small-flowered crane’s-bill (Geranium pusillum)—1%.
The second experimental factor was type of fertilization. Every year the following types and doses of mineral fertilizers and biostimulants were applied in the experiment:
1/Control—no fertilization;
2/NPK—standard NPK fertilization—180 kg·ha−1 of ammonium nitrate 34% N (61.2 kg N·ha−1) per each regrowth (total of vegetation season 183.0 kg N·ha−1) + PK;
3/NPK + N-14 300—300 kg·ha−1 N-14 per the first regrowth (42.0 kg N·ha−1) and 180 kg·ha−1 of ammonium nitrate 34% N (61.2 kg N·ha−1) per the second and the third regrowth (total of vegetation season 164.4 kg N·ha−1) + PK;
4/NPK + N-14 900—300 kg·ha−1 N-14 per each regrowth (42.0 kg N·ha−1) (total dose of fertilizer N-14—900 kg·ha−1) (total of vegetation season 126.0 kg N·ha−1) + PK;
5/NPK + PinKstart—20 kg ha−1 before vegetation and 180.0 kg·ha−1 of ammonium nitrate 34% N per each regrowth (total of vegetation season 183.0 kg N·ha−1) + PK;
6/NPK + Physiostart—20 kg·ha−1 before vegetation and 180.0 kg·ha−1 of ammonium nitrate 34% N per each regrowth (total of vegetation season 183.16 kg N·ha−1) + PK;
7/NPK + Physioactiv—300 kg·ha−1 before vegetation and 180.0 kg·ha−1 of ammonium nitrate 34% N per each regrowth (total of vegetation season 183.0 kg N·ha−1) + PK.
Phosphorus-potassium fertilization with granulated triple superphosphate 46% P2O5 and potassium salt containing 60% of K2O was applied once a year, in spring, before vegetation in every variant of fertilization in doses of 80 kg·ha−1 P and 80 kg·ha−1 K, apart from an absolute control (unfertilised).

2.3. Characteristics of Fertilizers with Biostimulants

N-14—Timac Agro Poland (Roullier Group France) nitrogen fertilizer contained 14% of nitrogen (7% in an ammonia form and 7%—in an amide form), 22% of CaO, 2% of MgO, 28% of SO3 and Pheoflore complex. The complex is based on the extract of marine algae, rich in carbohydrates and polypeptides and, according to the producer, it enhances growth of bacterial biota, which may allow for the increase in nitrogen and phosphorus available in soil.
PinKstart®—Timac Agro Poland (Roullier Group France) is the starter fertilizer, containing 48% of CaCO3, 4.5% of SO3, 28% of P2O5, 5% of K2O and Physio+ complex based on the extract of marine algae, rich in carbohydrates and polypeptides. In this additive, cooperation of aminopurine and Mezolac (highly reactive calcium carbonate) was used. PinKstart stimulates intensive growth of plants’ root systems (especially of root hair).
Physiostart®—Timac Agro Poland (Roullier Group France) is starter fertilizer containing 8% of ammonium nitrogen, 25% of CaCO3, 23% of SO3, 28% of P2O5, 2% of Zn and Physio + complex which boosts physiological stimulation of early development of plants’ root systems (especially of root hair).
Physioactiv (the current name is Physiomax 975 physio+)—Timac Agro Poland (Roullier Group France) is a calcium fertilizer which contains 76% of CaCO3 in the form of Mezocalc, 3% of MgO and aminopurine—a natural extract from marine algae which provides bio-stimulation of plants’ root systems.
According to the producer, starter fertilizers application results in more effective intake of calcium and intensive development of a root system from the beginning of vegetation. It also prevents plants from the effect of “a lazy root” as plants build a root system despite favourable conditions connected with an optimal availability of nutrients [45,46].

2.4. Botanical Composition and Biomass Yield

The botanical composition of the sward was assessed three times during the growing season (before the harvest of each regrowth) with the botanical-weight method developed by Stebler and Schröter and modified by Filipek [47] and Novak [48]. With this method, the percentage share of each species in the sward was assessed.
The regrown plants were harvested on the following dates: 24 May 2018, 23 July 2018, 11 October 2018, 4 June 2019, 23 August 2019, and 24 October 2019. Plants were harvested during the 1st, 2nd and 3rd cut in both 2018 and 2019. Yields of biomass were assessed with a method of experimental cuts in an area of 7.5 m2 (1.5 m × 5.0 m from the central part of the plot) in each plot and were expressed in tons of fresh mass (FM) per hectare.

2.5. Soil Sampling and Analysis

In the third (2018) and fourth year (2019) of sward utilisation soil samples were collected for microbiological analysis and pH measurement. The samples were collected two times, on the dates of the harvest of the first (May 2018, June 2019) and third (October 2018 and 2019) of regrowth of the sward. The samples were collected with a soil sampler probe (20 punctures per plot), from the top layer of the soil profile (0–15 cm). In total, 42 soil samples were collected each sampling.
Microbiological analyses were conducted to determine the counts of selected groups of soil microorganisms (the total counts of heterotrophic bacteria, oligotrophic bacteria, copiotrophic bacteria, and fungi) with the pour plate method on appropriate agar mediums. Five replications of each analysis were made. The mean count of colonies was expressed as colony forming units (CFU)∙g−1 DM of soil.
The total count of heterotrophic bacteria was determined on nutrient agar (3.0 g yeast extract; 5.0 g peptone from casein; 5.0 g sodium chloride; 12.0 g agar, 1.0 dm3 H2O) [49], after 5–6 days of incubation at the temperature of 28 °C. Oligotrophic bacteria were counted on diluted nutrient agar (0.1 g peptone, 0.1 g beef extract, 0.05 g sodium chloride, 20.0 g agar, 1 dm3 H2O) after 21 incubation days at 28 °C [50]. Copiotrophic bacteria were determined on nutrient broth medium (10.0 g peptone, 10.0 g beef extract, 5.0 g sodium chloride, 20.0 g agar, 1.0 dm3 H2O) after 7 days of incubation at 28 °C [50]. Number of fungi (yeasts and moulds) was determined using Martin agar (1.0 g KH2PO4, 0.5 g MgSO4, 5.0 g peptone, 10.0 g glucose, 3.3 mL Rose bengal, 0.1 g chlortetracycline, 25.0 g agar, 1.0 dm3 H2O), counted after 5 days of incubation at 28 °C [51]. The mean number of colonies was converted into soil dry matter on the basis of used dilution of soil solution and moisture of the soil sample.
The activity of the following soil enzymes was determined: dehydrogenases (DHA) (EC 1.1.1), acid phosphatase (ACP) (EC 3.1.3.2), alkaline phosphatase (ALP) (EC 3.1.3.1), urease (URE) (EC 3.5.1.5), and catalase (CAT) (EC 1.11.1.6).
The dehydrogenase (DHA) activity was determined after 24-h incubation of soil at 30 °C, pH 7.4, with colourless, water-soluble 1% TTC (2,3,5-triphenyltetrazolium chloride) as a substrate, which is enzymatically reduced to a coloured, water-insoluble product, i.e., triphenylformazan (TPF). After incubation TPF was extracted from the soil with 96% ethanol and its concentration was measured spectrophotometrically at a wavelength of λ = 485 nm. The enzyme activity was expressed as µmol TPF∙kg−1 DM of soil∙24 h−1 [52].
The activity of acid (ACP) and alkaline phosphatases (ALP) was determined with pNPP (p-nitrophenyl phosphate) solutions (pH 6.5 for ACP and pH 11.0 for ALP) as buffered substrates. After 1-h incubation at 37 °C p-NP (p-nitrophenol) was produced. It was extracted and stained with sodium hydroxide. Its amount was measured spectrophotometrically at a wavelength of 400 nm. The enzyme activity was expressed as µmol pNP · g−1 DM of soil · h−1 [53].
The urease activity (URE) was also determined spectrophotometrically, using urea as a substrate. After 1-h incubation at 37 °C the amount of non-hydrolysed urea was measured at a wavelength of 410 nm. The enzyme activity was expressed as μg N-NH4+∙g−1 DM of soil∙18 h−1 [54].
Catalase activity (CAT) in the soil was determined by means of titration (permanganometry). The soil with 0.3% H2O2 solution was incubated for 20 min (temp. 20 °C) and then 1.5 M H2SO4 was added. The resulting solution was titrated with 0.02 M KMnO4. The catalase activity was expressed as μmol H2O2∙g−1 DM of soil∙min−1 [55].
The biological index of fertility (BIF) was also determined on the basis of the dehydrogenase and catalase activities [56].

2.6. Statistical Analyses

The results were tested by using multifactorial analyses of variance (ANOVA). Mean separations were made for significant effects with Tukey tests at the probability of p ≤ 0.05. Principal Component Analysis (PCA) [57], and Pearson correlation coefficient, was used to illustrate the relationship between the variables. All statistical analyses were carried out with the Statistica 13.1 software.

3. Results

3.1. Weather Condition

The weather data for characteristic of weather conditions in years of study came from the measurement station located in Brody. The local climate is classified as temperate. It is characterised by mutual influence of maritime and continental climates. It has a seasonal, transitional, and changeable nature, especially in summer [58]. The average air temperature for the period 1960–2017 was 8.4 °C, while the average rainfall was 603.1 mm·m2. It was noted that the weather conditions were diverse in the study period, especially regarding the amount and distribution of rainfall [Figure 1]. In the first year (2018) mean air temperature was 9.8 °C and was higher by 1.4 °C than the long-term average temperature. Annual sum of precipitation in 2018 was 444.1 mm·m2 and was lower by 161.7 mm·m2 than sum from the long-term period. The amount and distribution of rainfall in the growing season 2019 was more favourable for plant growth compared to the previous year.

3.2. Botanical Composition

Lolium perenne developed intensively in all the plots with LGM. The highest share of this grass species was observed in the biomass sward fertilized with NPK mineral fertilizers (41.0% in 2018 and 42% in 2019) and NPK + N-14 fertilizer applied at dose of 300 kg∙ha−1 (40.6 and 42.0%) and NPK + N-14 fertilizer applied at dose of kg∙ha−1 900 kg∙ha−1 (34.4 and 41.0%).
The share of this species at the other treatments ranged from 24.3–27.3% (control) to about 38% (NPK + Physiostart). Among the other grasses sown in this mixture, Festuca arundinacea had a significant share—in 2019 it was 24.6% at the plots fertilised with NPK + PinKstart. Festuca pratensis was less abundant—its share ranged from 1.3% (control) to 7.6% (NPK + PinKstart). The share of the other grass species sown in the mixture (Lolium westerwoldicum and Phleum pratense) amounted to only about a few per cent. Among the unsown, spontaneously occurring species in the sward, there was a relatively high share of Dactylis glomerata, which appeared in the sward fertilised with: NPK (7.0–10.3%), NPK + Physioactiv (3.3–7.3%), and NPK + PinKstart (3.3–8.6%). There were also other unsown grass species appearing spontaneously in the sward of most of the plots, Bromus inermis being the dominant species. Although grasses were dominant on the majority of treatments there were some treatments where Trifolium repens had a considerable share in the yielded biomass.
In 2019 the share of this species in the sward of the control, where no fertilizers had been applied, was as high as 52%. Among the fertilised plots, the highest share of Trifolium repens (nearly 40%) was observed in the sward treated with the calcium fertilizer combined with the biostimulant, i.e., NPK + Physioactiv. The share of Trifolium repens was much lower in the other treatments (Figure 2). The lowest share of this species, i.e., only about a dozen or so percent, was found in the sward where standard NPK fertilizers had been applied and in the combinations fertilised with NPK + Physiostart and NPK + PinKstart. Meadow herbs also appeared in the LGM sward in most of the fertilizer combinations. The dominant herb species was Taraxacum officinale. Its share was the highest in the sward fertilised with NPK + Physiostart, but it was absent from the swards fertilised with the N-14 at a dose of 300 kg∙ha−1 and with the calcium fertilizer NPK + Physioactiv.
In the third and fourth years after sowing of GM Dactylis glomerata was the dominant grass species in many of the experimental plots, except for the control plot (Figure 3). In 2018 the share of this species in the sward of the fertilized plots ranged from 53% (NPK + Physioactiv) to 67% (NPK + Physiostart). In 2019 it was even greater, i.e., from 58% in the sward fertilised with the NPK + Physioactiv to 74% in the plots treated with the NPK + Physiostart fertilizers. On the control plots, where no fertilizers had been applied, the share of Dactylis glomerata in the sward was about a dozen or so per cent. The second most numerous species in the sward of this mixture was Lolium perenne. The highest share of this species, i.e., over 60%, was found in the sward of the control plot. In the other plots, which had been treated with the fertilizers, its share was lower—it ranged from 18% in the plots treated with NPK + Physiostart to 32% in the ones fertilised with NPK + Physioactiv. The share of the other two species sown in the mixture, i.e., Festuca pratensis and Phleum pratense, was low or they were not found in the sward. Apart from the sown species, the sward of all the plots had some spontaneously occurring species of dicotyledons such as Trifolium repens and other species commonly classified as weeds (Capsella bursa-pastoris and Taraxacum officinale).
The starting point for further analysis of the research results was the distinction within the botanical composition dominant taxonomic-functional groups of species, characterized by specific biological and utility properties and fulfilling specific ecological functions in the biocenosis: Lolium perenne (the only representative of shortgrasses, distinguished by a large share in the sward of all experimental combinations of both—GM and LGM swards), other grasses (representing mid- and tallgrasses, understood as all grasses without Lolium perenne) and Trifolium repens (the only representative of the legumes). The significance of the influence of the investigated factors on the botanical composition of the sward was assessed regarding the share of groups shown above. The analysis of variance (Table 1) showed a significant influence of the applied experimental factors (sown mixture of seeds and type of fertilization) and the effect of interactions between them in relation to all analyzed variables characterizing the botanical composition of the sward.

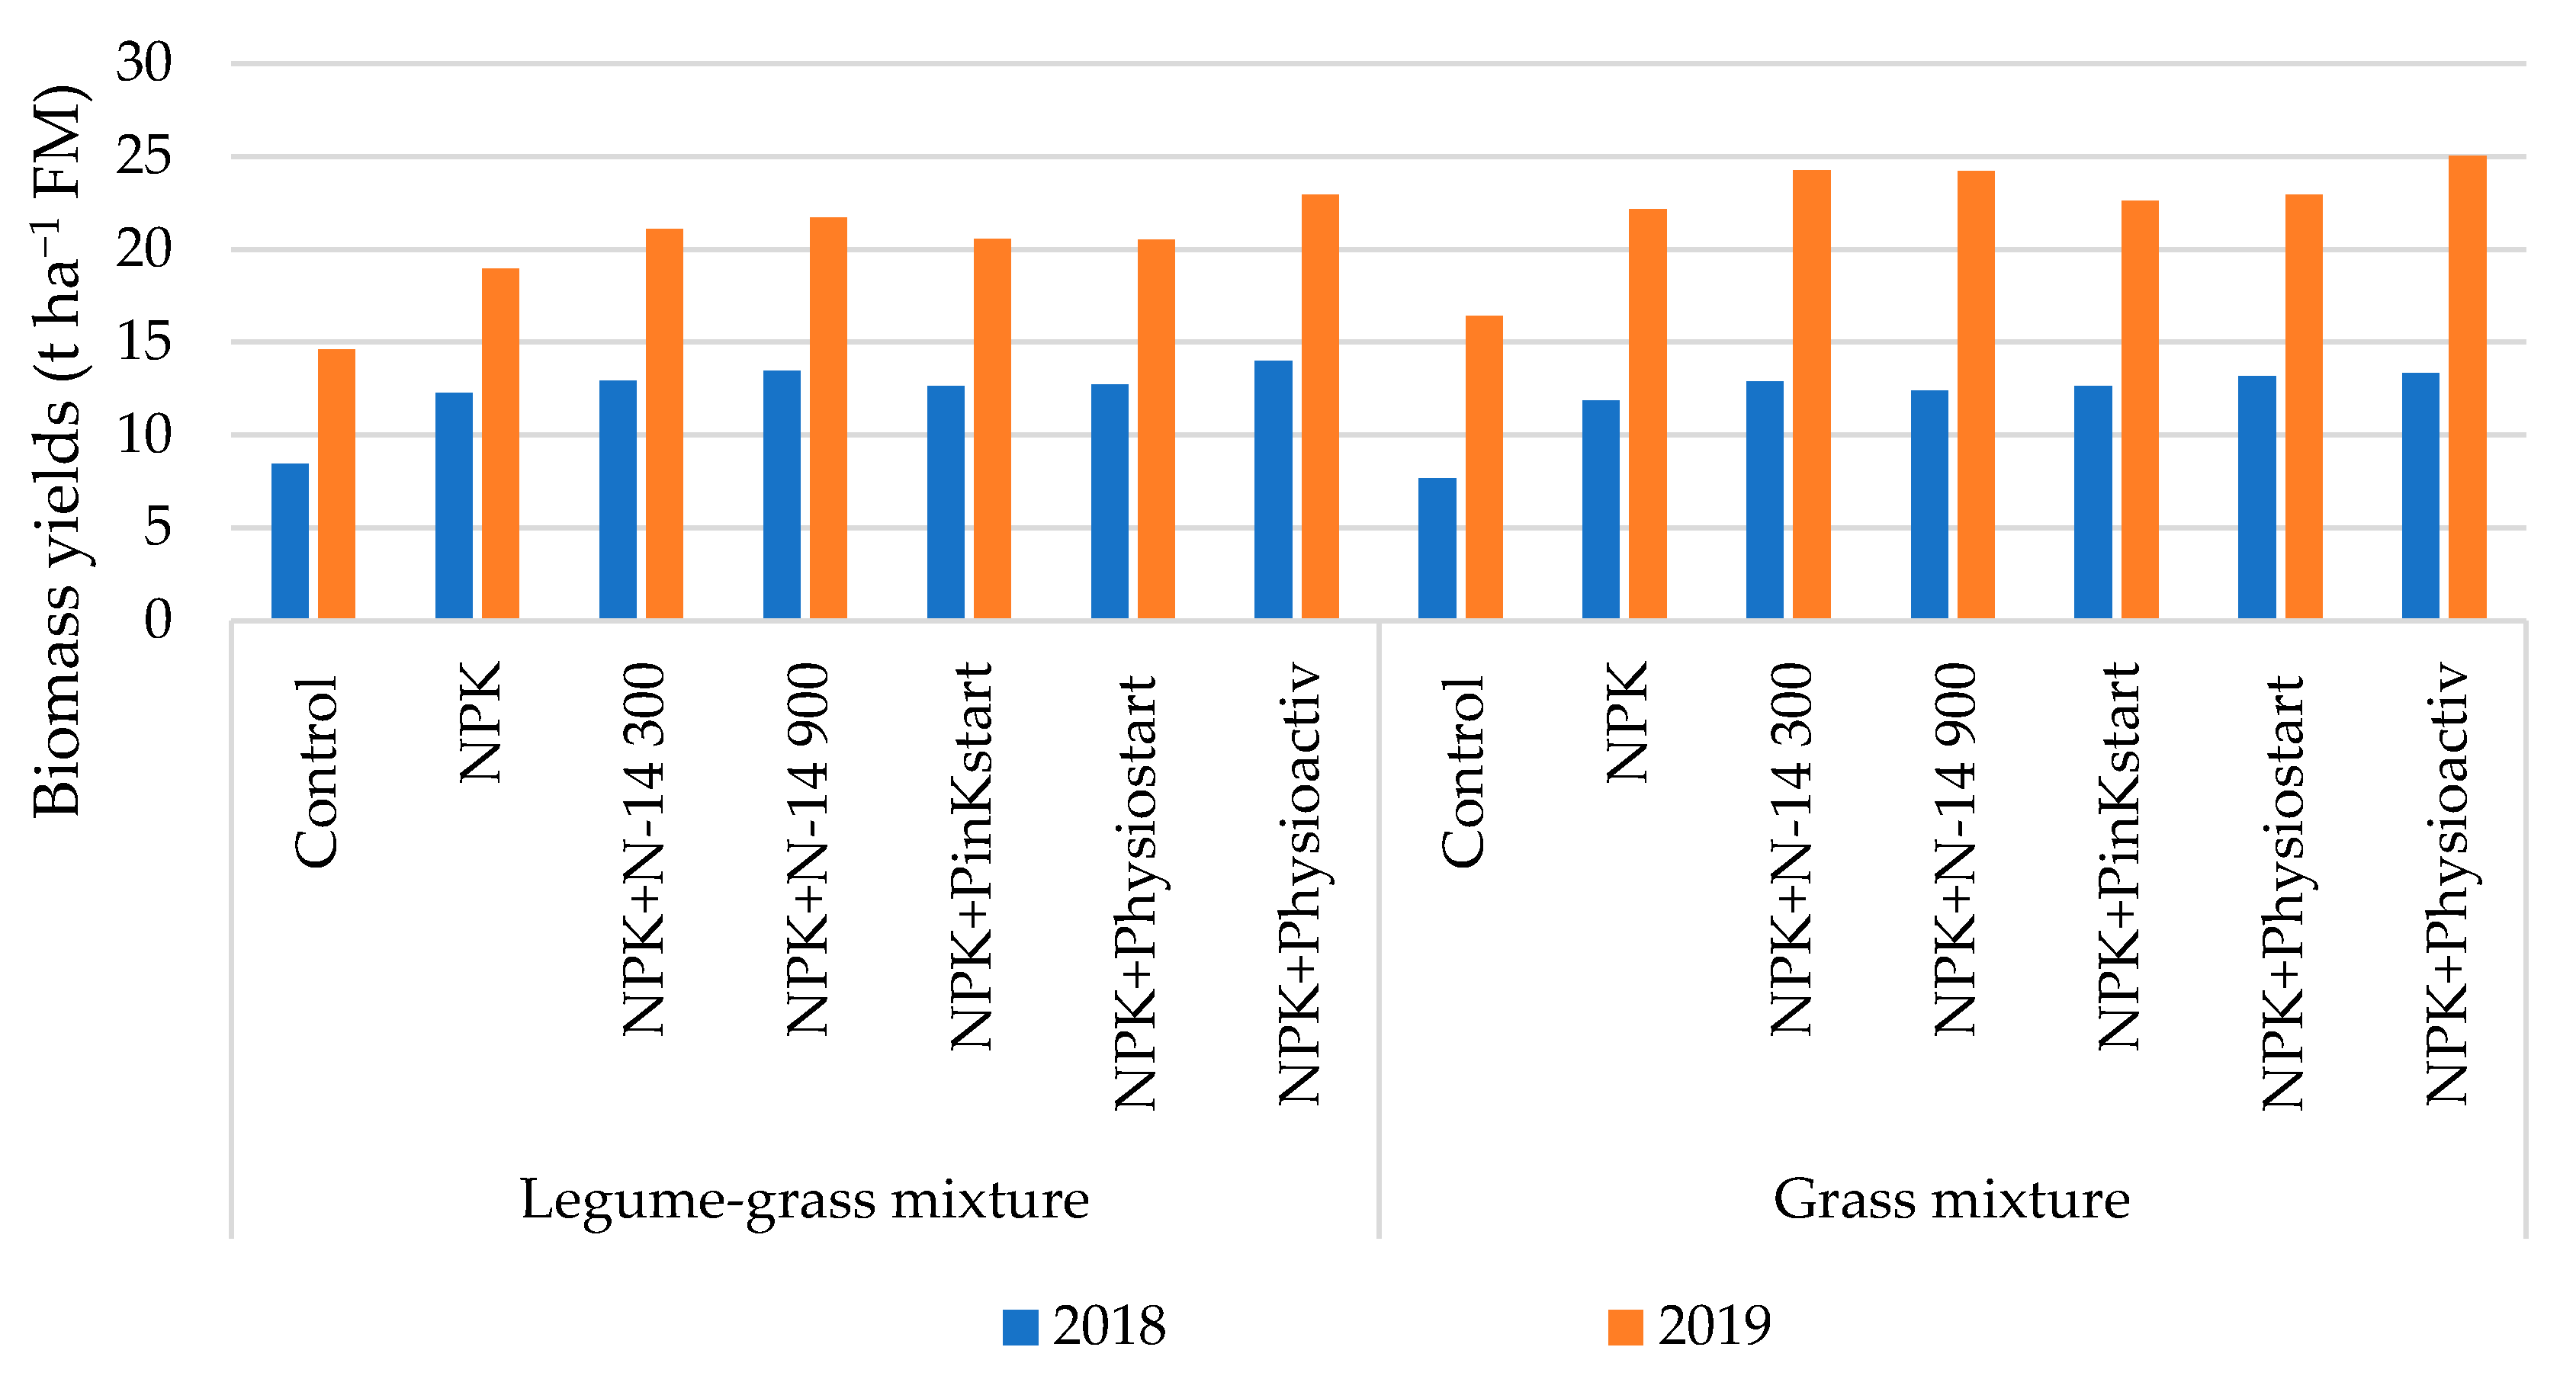
3.3. Biomass Production

An impact of an applied fertilization on the biomass yields in both years of study was significant (Table 2). The effect of grass mixture on sward yield was proven only in 2019. First of all, very visible differences between years were observed (Figure 4). In the first year of study significantly the lowest yields (8.1 t∙ha−1 of FM) were stated on control plots. The average biomass yields for individual fertilization treatments were higher, ranged from 12.1 t∙ha−1 of FM to 13.7 t∙ha−1 of FM, but did not differ significantly. No significant effect of grass mixture was proved. Such extremely low biomass yielding in 2018 was due to weather conditions i.e., low amount of precipitation in the vegetation season. In the second year noticed yields on average exceeded the level of 20 t∙ha−1 of FM. Both type of plants mixtures and fertilization treatment significantly influenced the sward yielding. Biomass yielding of GM was significantly higher than LGM. Regardless of the mixture sward yields ranged from 15.5 t∙ha−1 of FM (control plots) to 24.0 t∙ha−1 of FM (NPK + Physioactiv).

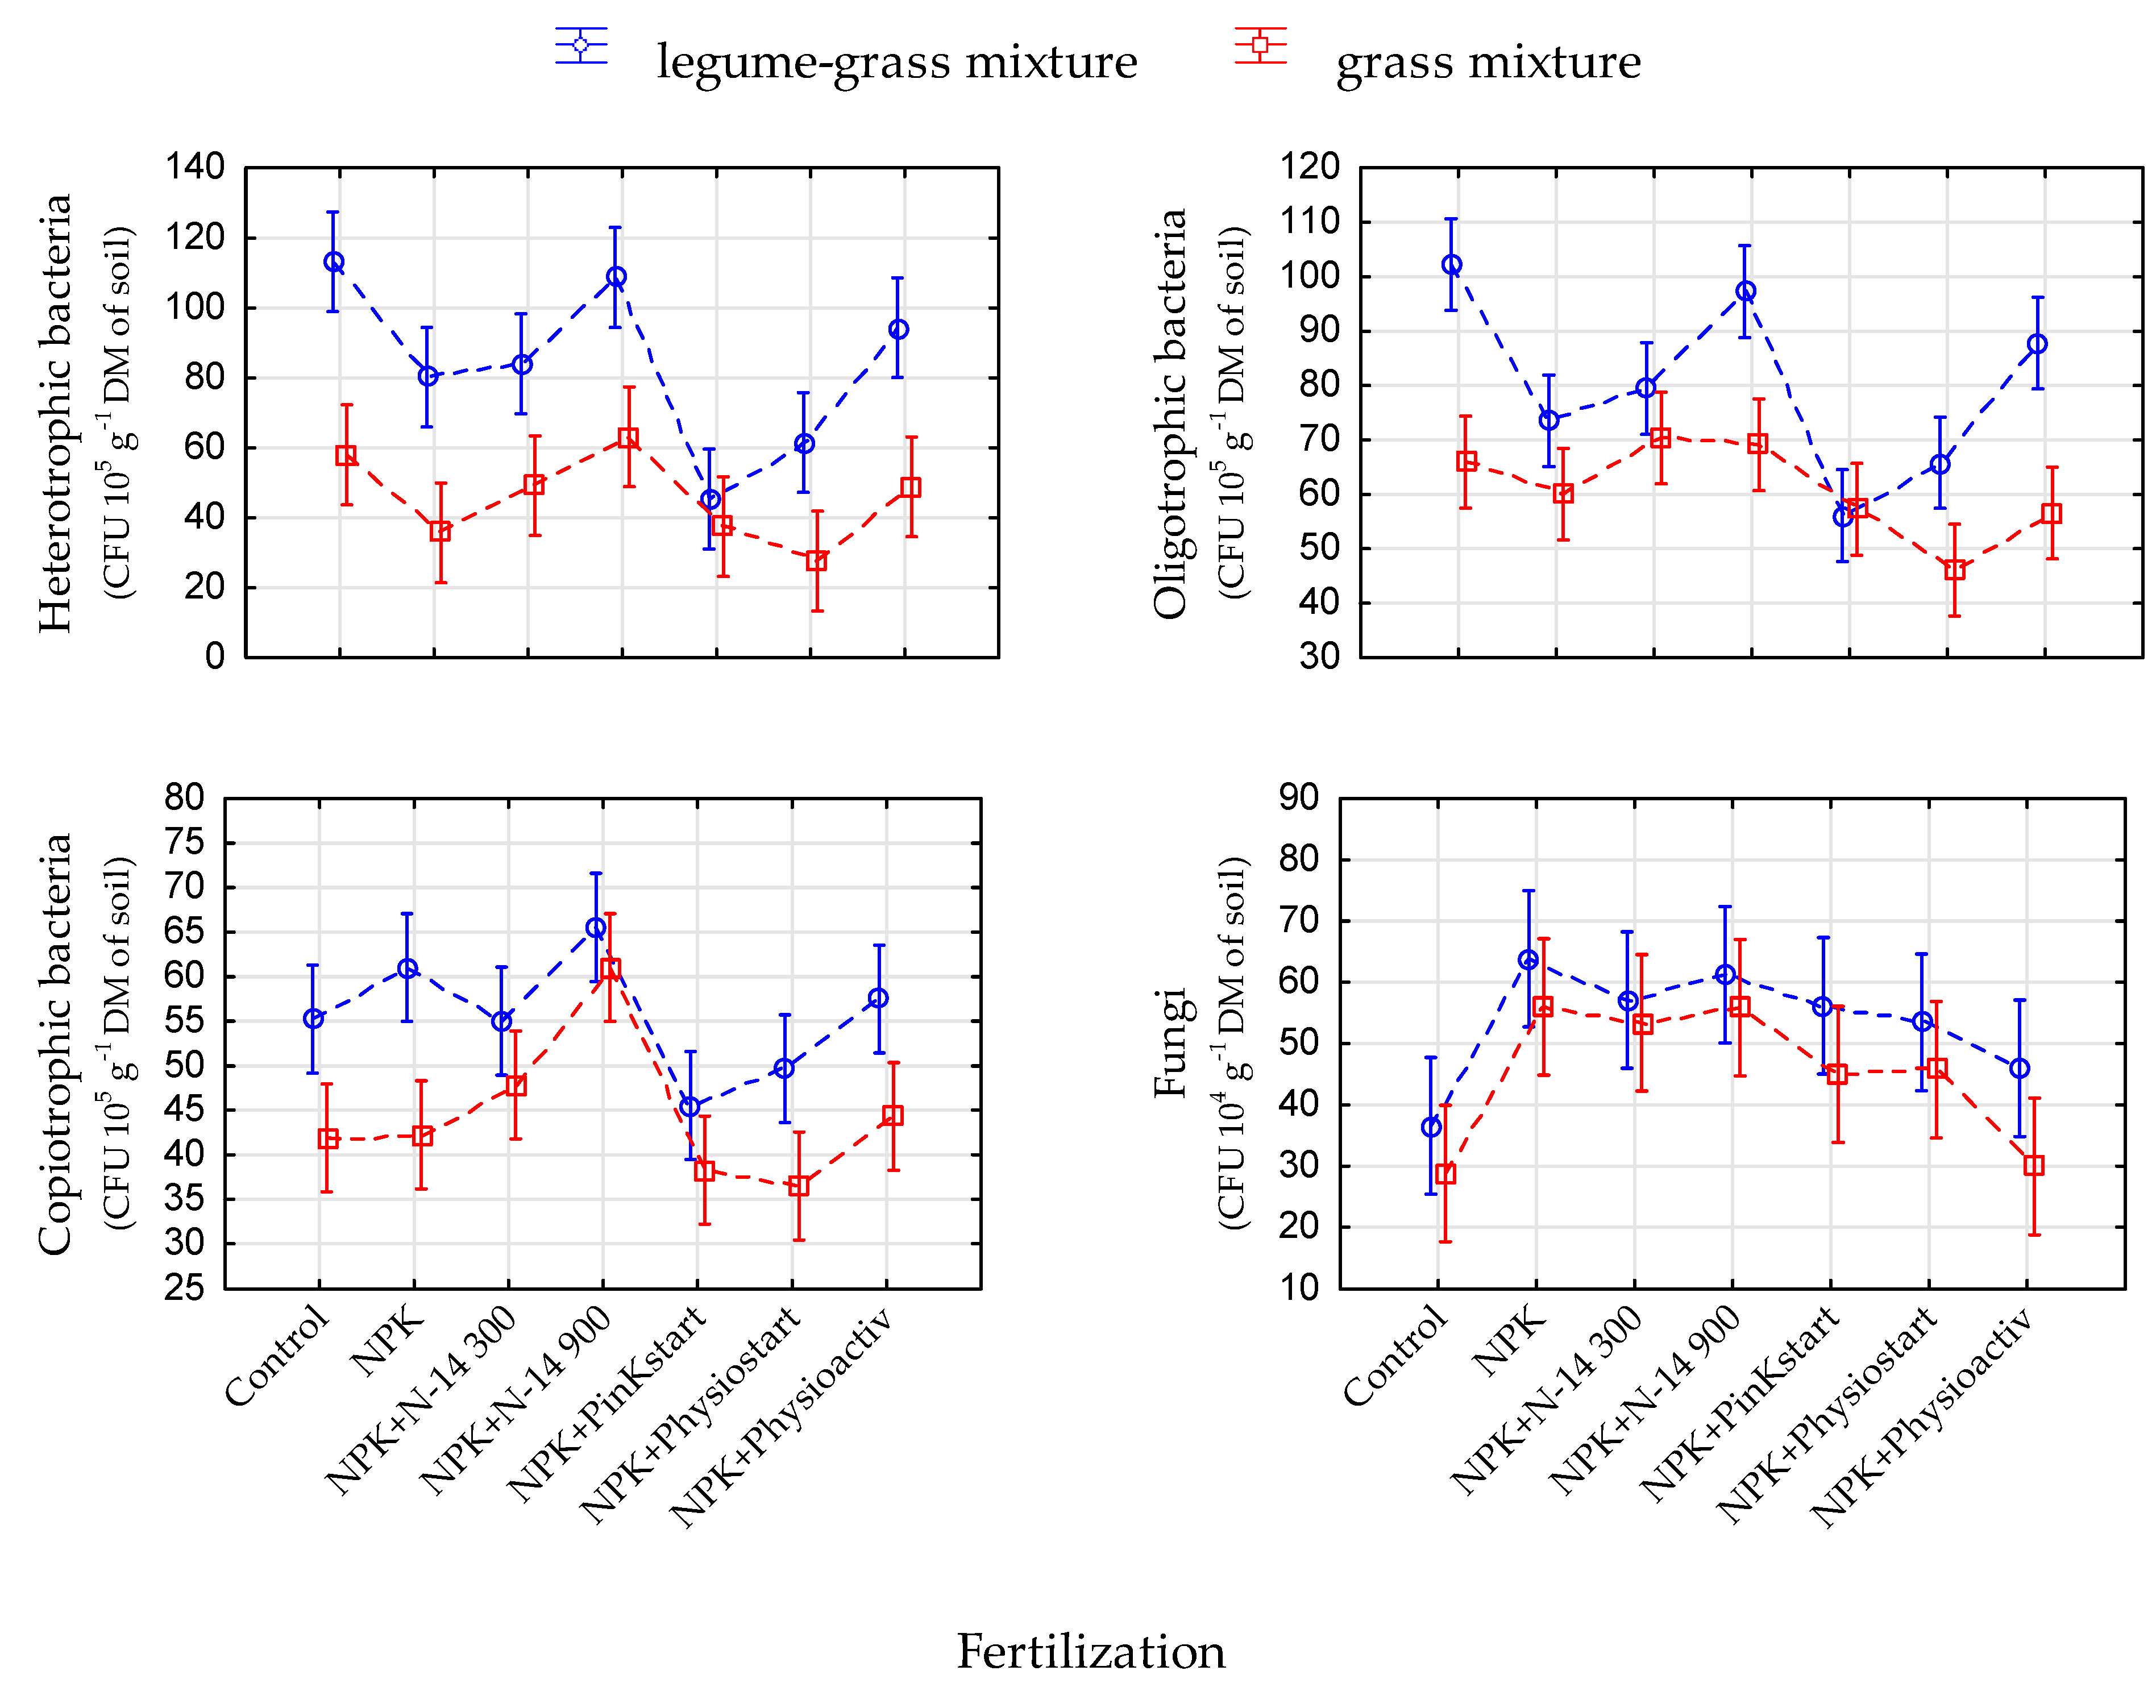
3.4. Soil pH and Counts of Microorganisms

Both types of grass mixtures and fertilization treatment significantly influenced the evaluated soil parameters (Table 3). Only the soil pH (F = 1.97) was not significantly influenced by the plant mixture. While the counts of heterotrophic and oligotrophic bacteria, were influenced by type of grass mixture and fertilization.
The average soil pH values for individual fertilization treatments ranged from 3.5 to 6.5 and were similar in both grass mixtures (Figure 5). The fertilization had a highly significant effect on soil pH, which was not proved for the type of sward (Table 3, Figure 4). The highest pH value (about 6.5) was noted in the treatment where the NPK + Physioactiv was used. The second highest pH value was stated in the control plot (pH ≈ 6.0). All the other fertilization treatments did not differ significantly in pH values, which ranged from 5.3 to 5.5.
The effect of the sward type and fertilization on the counts of studied soil microorganisms was significant (Table 3). It is noteworthy that the counts of microorganisms in the soil under LGM were almost twice higher compared to the values in the soil under the GM. This dependence was particularly noticeable for all groups of bacteria, and much less marked for fungi (Figure 6).
The analysis clearly showed that the applied fertilizers differently affected the counts of soil bacteria and fungi (Figure 6). Similar patterns were obtained for bacteria groups, especially heterotrophic and oligotrophic bacteria. The control plot and the plots fertilised with the N-14 applied at a dose of 900 kg∙ha−1 were distinguished by the count of these microorganisms. Copiotrophic bacteria were the most numerous in the treatment with the N-14 applied at a dose of 900 kg∙ha−1. This dependence was particularly noticeable in GM. The smallest counts of all bacterial groups were found in both mixtures in soil from plots fertilised with the NPK + PinKstart and NPK + Physiostart fertilizers.
In most cases the sward type and applied fertilizers did not interact with each other to take effect on the count of soil microorganisms. However, such interaction was observed in the case of heterotrophic and oligotrophic bacteria (Table 3). In comparison with the other fertilization treatments, the NPK + PinKstart treatment affected the counts of both groups of soil microorganisms and reduced differences between GM and LGM.

3.5. Soil Enzymes Activity

The influence of the experimental factors on the activity of soil enzymes is shown in Figure 7. A significant difference between the experimental treatments and significant interactions between the experimental factors were stated (Table 4). The exception was the urease activity, which was not significantly influenced by both experimental factors. The wide confidence intervals point to a large discrepancy in the results within the individual experimental variants.
The dehydrogenase activity (Figure 7) ranged widely from about 4 to 14 μmol TP∙kg−1 DM of soil∙24 h−1. It was the highest in the control variant and in the plots treated with the calcium fertilizer—Physioactiv. The differences between the mixtures were statistically insignificant, except for the control plots and the plots with the standard NPK fertilization.
The influence of the experimental treatments on the acid phosphatase activity was inconclusive. There was a noticeable interaction between both factors—type of fertilization and the type of the sward (Table 4, Figure 7). The lowest activity of acid phosphatase was below 0.13 μmol PNP∙g−1 DM of soil∙h−1. However, this value was noted only in the soil under GM treated with traditional NPK and NPK + PinKstart fertilizers. The acid phosphatase activity in the soil under LGM was much higher (0.17–0.18 μmol PNP∙g−1 DM of soil∙h−1) both in these two fertilization treatments and in the other ones, except for the control and the NPK + Physioactiv treatment. In these fertilization treatments the acid phosphatase activity in the soil under both plant mixtures was almost identical, but this enzyme exhibited the lowest activity in LGM and the highest in GM (apart from the fertilization with the N-14 applied at a dose of 900 kg∙ha−1).
The alkaline phosphatase activity was much more unequivocal. In both mixtures it was the highest in the control and the NPK + Physioactiv treatment, where its level was very similar, i.e., about 0.12 µmol PNP∙g−1 DM of soil∙h−1. The differences between the plant mixtures were particularly noticeable in the other fertilization treatments. The alkaline phosphatase activity in these treatments was close to the highest values in LGM, whereas in the GM it was much lower—below 0.07 μmol PNP∙g−1 DM of soil∙h−1.
In case of catalase activity, the highest values (close to 8.0) were noted in the control variant and the treatment with the NPK + Physioactiv fertilizer. However, there was a noticeable interaction between both factors—the effect of the fertilization depended on the plant mixture (Table 4). However, the application of the N-14 fertilizer at a dose of 900 kg∙ha−1 in both mixtures resulted in high catalase activity.
The diagram showing the mean values of urease activity is to some extent similar to the diagrams showing the activities of the other enzymes. The highest urease activity was noted in the control, NPK + N-14 applied at a dose of 900 kg∙ha−1, and the NPK + calcium fertilizer—Physioaktiv. However, the differences between the experimental treatments were statistically insignificant, mainly due to a large spread in the results between the first and second term of the analyses.
The value of BIF, which to some extent results from the activity of dehydrogenases and catalase, exposed the interactions between the analyzed experimental factors. It turned out to be significantly the highest in the control, but only in LGM and in the treatments with Physioactiv—only in the GM.

4. Discussion

The fertilization treatments used in the experiment aimed to show whether the formula of biostimulants resulted in an increased soil biological activity compared to standard mineral NPK fertilization. As the botanical composition of sward has great influence on the function of the soil microbiome [59,60,61,62], the influence of the biostimulants on the populations of selected taxonomic and trophic groups of soil microorganisms and the soil enzymatic activity was analysed in two forage plants mixtures (GM and LGM) differing with share of functional groups of grasses and legumes.
The microbiological analyses of the soil were conducted in the third and fourth year of mowing utilisation. Therefore, the share of individual plant species in the sward compared with the share of the species in the sown seed mixtures changed significantly (Figure 2 and Figure 3). These changes were significantly influenced by the fertilization treatments used in the experiment (Table 1). This effect was caused by several mechanisms. Firstly, fertilization, especially with nitrogen, promoted development of nitrophilous, highly competitive grass species. This phenomenon has been described by other authors [63,64]. The most abundant grass species in LGM were Lolium perenne and Festuca arundinacea (Figure 2). In GM it was Dactylis glomerata—a tall grass species, which turned out to be more competitive in these conditions than the photophilic, but low grass—Lolium perenne [65]. Lolium perenne was the dominant species in GM, but only in the control plot (Figure 3). Luxuriantly developing grasses displaced legume species—Trifolium repens from the sward. It was easily noticeable both in LGM, where the highest share of Trifolium repens was found in the non-fertilised control plots (Figure 2), and in GM, where Trifolium repens appeared spontaneously and most abundantly in the non-fertilised plots (Figure 3).
It is well known that fertilization with nitrogen stimulates grasses development, increasing their competitiveness against legumes in legume-grass mixtures [66]. The growth of legume plants can be enhanced with P fertilizers in pastures [67]. On the other hand, some studies revealed that the combined applications of N and P fertilizer resulted in the improvement of grass growth in pasture swards but not in legume species [68].
The negative effect of nitrogen fertilization on the competitiveness of Trifolium repens against grasses is also caused by the limitation of the nitrogen fixation capacity of rhizobia, which live in symbiosis with legumes [69]. A large amount of nitrogen ions in the soil environment deactivates the enzymatic complex responsible for nitrogen fixation-nitrogenase [70,71,72]. At the same time, the opposite situation, i.e., the lack of nitrogen fertilization, significantly increases the ability of legumes to compete with grasses. In our study this effect was clearly noticeable in the control plots in both plant mixtures (Figure 2 and Figure 3).
It is noteworthy that in our study the competitiveness of Trifolium repens, an extremely photophilic species typically found in pastures [73], against grasses was reduced by the relatively low sward mowing frequency (three times a season), which promoted tall species [74]. Similarly, the competitiveness of the short Lolium perenne against the tall Dactylis glomerata was also reduced [75].
The influence of the fertilization treatments on the botanical composition of the sward also depended on the way they modified the soil pH. Mineral fertilizers used in all treatments (except the control plot) caused systematic soil acidification. This effect is particularly noticeable for fertilizers based on nitrogen and potassium [76,77]. At the same time, some of the applied biostimulants contained calcium carbonate, which has deacidifying properties. However, only one of the fertilizers (Physioactiv) contained as much as 76% CaCO3, so it was mostly a calcium fertilizer. The plots treated with the NPK + Physioactiv fertilizer had the highest pH (higher than in the control variant) (Figure 5). A higher soil pH (6–6.5), noted in the control and the plots treated with the Physioactiv fertilizer, can stimulated the rhizobia growth thus promoted the development of legumes [78]. This dependence was noticeable in our study, because in both plant mixtures these treatments (the control plots and NPK + Physioactiv) were characterised by the highest share of Trifolium repens in the sward. Also another calcium fertilizer, containing CaCO3 from ocean deposits, also had a similar, positive effect on the share of white clover in the sward and its durability [79].
As a result of these observations, the Physioactiv fertilizer significantly reduced the negative effect of nitrogen fertilization on the capacity of Trifolium repens to compete with grasses. The most likely mechanism of this interaction was pH optimisation. A comparative study on other calcium fertilizers might provide an answer to the question whether the specific origin of calcium carbonate or the effect of other components of this fertilizer had significant influence on the competing capacity of Trifolium repens.
Principal component analysis (PCA) (Figure 8) and Pearson’s correlation coefficient (Table 5) were used to estimate and illustrate the relationships between the variables. Both principal components explained together 55.19% of the total variability (the first—37.80%, the second—17.39%).
As can be seen in the diagram in Figure 8, there are four clearly distinguishable groups of related variables. Most of the soil biological parameters, especially the counts of all trophic groups of bacteria and the catalase activity, were strongly related to the share of Trifolium repens in the sward. Although this is not evidence of a cause-and-effect dependence, most reports indicate it. Legume forage species are known to increase the biomass of the soil microbial community, because they enrich soil with organic matter from root exudates, dying tissues, including root nodules, etc. [80]. Helios [81] and Wolinska [82] observed most of the fragments of leaves and other aerial organs which cannot be harvested by mowing come from Trifolium repens rather than tall grasses. These dead fragments form a specific layer of felt (mulch), which increases the count of soil microorganisms. Residue quality, especially C:N ratio, is one of the factors that regulate decomposition and, therefore, persistence time of plant biomass in the soil [83]. The lowest biomass decomposition of grasses, in comparison with legumes, may be explained by higher C:N ratio [84]. Other factors that affect persistence of residues in the soil are the presence of (micro) organisms, soil chemical and physical characteristics, and environmental conditions [85]. Legumes include several pioneer species, able to colonize marginal soils and to improve the nutritional status and organic matter content (and thus water-holding capacity) of the soil [86,87,88]. Moreover, it was shown that apart from rhizobia, nodules are also inhabited by many other non-rhizobial bacterial taxa, e.g., Bacillus sp., Pseudomonas sp., Stenotrophomonas maltophilia, Micrococcus luteus, Erwinia persicina, and Chryseobacterium lathyri [89,90].
It should be recalled at this point that 70–90% of microorganisms inhabit all environments are non-cultivable [91,92]. Therefore, the CFU method we used to determine the counting from soil samples for the quantification of bacteria and fungi offers only limited amount of information. Despite its limitations, this method is still used in studies of soil microbial ecology, as it provides a reliable picture of their response to modifications in the soil environment [93].
Most of the studied enzymes: dehydrogenase, alkaline phosphatase, and urease were strongly related to the soil pH (Table 5). The enzymatic activity of soil usually increases with increasing soil pH [94,95]. In our study the highest pH value was noted in the control plot (pH 5.8–6.0) and the NPK + Physioactiv combination (pH ≈ 6.5). It was optimal for the dehydrogenase activity [96,97] and alkaline phosphatase, which is responsible for the transformation of organic phosphorus into phosphates [98,99,100]. The share of Lolium perenne in the sward was slightly less related to this group (Figure 8). However, it is noteworthy that the share of this species in the sward differed considerably from the share of the other grasses, which formed a separate group of variables in the diagram as they exhibited antagonism to almost all other parameters. This dependence confirmed the special bioceonotic role of Lolium perenne. This short grass species perfectly harmonises with the high share of Trifolium repens in the sward [101,102,103,104]. Moreover, it creates completely different conditions for the soil bioactivity compared to the tall Dactylis glomerata and Festuca arundinacea. Lolium perenne, has a very strong, shallowly spaced root system, which creates a much more compact turf and denser sward [105] that better protects the soil from overheating and drying [106]. Moreover, this grass has high sugar content and grows and develops very quickly, which translates into the amount and chemical characteristics of root exudates [6]. All these factors significantly influence the microbiome and soil enzyme activity [107,108].
The biomass yield shows a weak correlation with other variables and in the graph (Figure 8) it occupies a separate position, between Lolium perenne, which determines the yield of LGM, and other grasses, which determine the yield of the GM.
There may be some doubts about the relatively weak dependence between the count of soil bacteria and the activity of dehydrogenases, which are commonly regarded as enzymes of microbial origin [109,110,111]. However, it is noteworthy that dehydrogenases are usually the most positively correlated with the count of soil actinobacteria [112], which were not analysed in our study.
Fungi were a separate group showing very weak positive relations with the other parameters. They were characterised by a noticeably clear negative correlation with the soil pH. Soil fungi generally exhibit wider pH ranges for optimal growth, than bacteria [108], and tolerates lower pH better [1,100,108].
Apart from the urease activity, the other microbiological parameters almost always had higher values in the soil under LGM. This mixture was characterised by much higher shares of Trifolium repens and Lolium perenne in the sward. The influence of the fertilization treatments on the soil microbiological properties and its metabolism largely coincided with their influence on the soil pH and the sward botanical composition. It clearly resulted from the PCA and the high similarity of the diagrams shapes showing the influence of the fertilizer combinations on pH and on the activity of dehydrogenases and alkaline phosphatase. They had the highest values in the control plots and the treatments with the Physioactiv fertilizer. The shape of the diagrams showing the count of fungi (Figure 6) was exactly opposite and these two combinations were characterised by the lowest values. Many authors stress the fact that even small differences in pH translate into the size and structure of the soil microbiome [113].
Apart from dehydrogenases and to some extent urease (the effect of the latter proved to be statistically insignificant in our study), catalase is the enzyme whose activity is the most strongly related to the soil microbiome, the intensity of changes occurring in it, and plants’ viability [114]. The diagrams illustrating the counts of bacteria and the catalase activity also showed its highest values in the control plot and in the NPK + Physioactiv treatment. It was also high in the treatment with the N-14 fertilizer applied at a dose of 900 kg·ha−1 (Figure 6 and Figure 7). Why was the effect of the N-14 biostimulant so clearly pronounced despite the low pH? It is most likely that this effect was caused by high share of Trifolium repens in the sward.

5. Conclusions

  • Traditional NPK fertilization without biostimulants decreased the counts of most of the groups of soil microorganisms under analysis and the activity of soil enzymes, as compared with the non-fertilised absolute control variant. This effect was changed only in two cases, where the mineral NPK fertilization was accompanied by biostimulants, i.e., the N-14 at a dose of 900 kg·ha−1 and Physioactiv.
  • The applied fertilizers had multidimensional and largely indirect influence on the soil microbiome and the activity of soil enzymes. It was mainly caused by the modification of the share of Trifolium repens in the sward and the pH of the soil environment. The effect of additional substances contained in the biostimulants seemed to be significant only at very high doses of these fertilizers—the N-14 applied at a dose of 900 kg·ha−1 was effective but it was ineffective at a dose of 300 kg·ha−1.
  • The optimisation of the soil pH with CaCO3 applied at a dose increasing its value from 5.5 to 6.5 may reduce the negative effect of intensive nitrogen fertilization on the competitiveness of Trifolium repens against grasses. In our experiment this effect was observed after the application of the Physioactiv biostimulant. It is necessary to check whether the same effect can be observed after the application of other fertilizers containing calcium in the carbonate form.
  • The effect of biostimulants on forage plants and soil microflora is not well understood yet. The investigation of new solutions and combinations of mineral nutrients with new biostimulants in fertilizers, which will affect plants and soil not only by optimizing soil pH are still needed.

Author Contributions

Conceptualization, W.Z. and D.S.; methodology, W.Z., D.S., J.D.; software, A.S., B.W.; validation, P.S.W. and B.W.; formal analysis, W.Z., J.D., D.S., I.K.; investigation, W.Z., D.S., J.D.; resources, W.Z.; data curation, W.Z., B.W., A.S., I.K.; writing—original draft preparation, W.Z., D.S., J.D., A.S.; writing—review and editing, B.W., J.D., P.S.W.; visualization, W.Z., A.S., B.W.; supervision, W.Z.; project administration, W.Z.; funding acquisition, W.Z. All authors have read and agreed to the published version of the manuscript.

Funding

Publication was co-financed within the framework of the Polish Ministry of Science and Higher Education’s program: “Regional Initiative Excellence” in the years 2019–2022 (No. 005/RID/2018/19).

Data Availability Statement

All data generated or analysed during this study are included in this published article.

Conflicts of Interest

The authors declare no conflict of interest.

References

  1. Aydin, I.; Uzun, F. Nitrogen and phosphorus fertilization of rangelands affects yield, forage quality and the botanical composition. Eur. J. Agron. 2005, 23, 8–14. [Google Scholar] [CrossRef]
  2. Hejcman, M.; Sochorová, L.; Pavlů, V.; Štrobach, J.; Diepolder, M.; Schellberg, J. The steinach grassland experiment: Soil chemical properties, sward height and plant species composition in three cut alluvial meadow after decades-long fertilizer application. Agric. Ecosyst. Environ. 2014, 184, 76–87. [Google Scholar] [CrossRef]
  3. Wolski, K.; Biernacik, M.; Świerszcz, S.; Talar-Krasa, M.; Leshchenko, O. Effect of the application of a biostimulant and mineral fertilizers on the concentration of mineral elements in the sward of forage mixtures cultivated on light soil. J. Elem. 2019, 24, 385–397. [Google Scholar]
  4. Dinka, M.O.; Dawit, M. Spatial Variability and Dynamics of Soil pH, Soil Organic Carbon and Matter Content: The Case of the Wonji Shoa Sugar-cane Plantation. J. Water Land Dev. 2019, 42, 59–66. [Google Scholar] [CrossRef] [Green Version]
  5. Turner, T.R.; James, E.K.; Poole, P.S. The plant microbiome. Genome Biol. 2013, 14, 209. [Google Scholar] [CrossRef] [PubMed] [Green Version]
  6. Swędrzyńska, D.; Zielewicz, W.; Swędrzyński, A. Comparison of soil bioconditioners and standard fertilization in terms of the impact on yield and vitality of Lolium perenne and soil biological properties. Open Life Sci. 2019, 14, 666–680. [Google Scholar] [CrossRef] [Green Version]
  7. Burzyńska, I. Monitoring of selected fertilizer nutrients in surface waters and soils of agricultural land in the river valley in central Poland. J. Water Land Dev. 2019, 43, 41–48. [Google Scholar] [CrossRef] [Green Version]
  8. Dobrzyński, J.; Wierzchowski, P.S.; Stępień, W.; Górska, E.B. The reaction of cellulolytic and potentially cellulolytic spore-forming bacteria to various types of crop management and farmyard manure fertilization in bulk soil. Agronomy 2021, 11, 772. [Google Scholar] [CrossRef]
  9. Wierzchowski, P.S.; Dobrzyński, J.; Mazur, K.; Kierończyk, M.; Wardal, W.J.; Sakowski, T.; Barszczewski, J. Chemical properties and bacterial community reaction to acidified cattle slurry fertilization in soil from maize cultivation. Agronomy 2021, 11, 601. [Google Scholar] [CrossRef]
  10. Shahrajabian, M.H.; Chaski, C.; Polyzos, N.; Petropoulos, S.A. Biostimulants application: A low input cropping management tool for sustainable farming of vegetables. Biomolecules 2021, 11, 698. [Google Scholar] [CrossRef] [PubMed]
  11. Sible, C.N.; Seebauer, J.R.; Below, F.E. Plant biostimulants: A categorical review, their implications for row crop production, and relation to soil health indicators. Agronomy 2021, 11, 1297. [Google Scholar] [CrossRef]
  12. Mendes, R.; Garbeva, P.; Raaijmakers, J.M. The rhizosphere microbiome: Significance of plant beneficial, plant pathogenic, and human pathogenic microorganisms. FEMS Microbiol. Rev. 2013, 37, 634–663. [Google Scholar] [CrossRef]
  13. Ahemad, M.; Kibret, M. Mechanisms and applications of plant growth promoting rhizobacteria: Current perspective. JKSUS 2014, 26, 1–20. [Google Scholar] [CrossRef] [Green Version]
  14. Riggs, E.; Hobbie, S.E. Mechanisms driving the soil organic matter decomposition response to nitrogen enrichment in grassland soils. Soil Biol. Biochem. 2016, 99, 54–65. [Google Scholar] [CrossRef] [Green Version]
  15. Neufeld, K.R.; Garyston, S.J.; Bittman, S.; Krzie, M.; Hunt, D.E.; Smukler, S.M. Long-term alternative dairy manure management approaches enhance microbial biomass and activity in perennial forage grass. Biol. Fertil. Soils 2017, 53, 613–626. [Google Scholar] [CrossRef]
  16. Woźniak, M.; Gałązka, A. The rhizosphere microbiome and its beneficial effects on plants—Current knowledge and perspectives. Post. Microbiol. 2019, 58, 59–69. [Google Scholar] [CrossRef] [Green Version]
  17. Zhang, Y.Q.; Tang, Y.H.; Jiang, J.; Yang, Y.H. Characterizing the dynamics of soil organic carbon in grasslands on the Qunghai-Tibetan Plateau. Sci. China Ser. D Earth Sci. 2007, 50, 113–120. [Google Scholar] [CrossRef]
  18. Zhong, W.H.; Cai, Z.C. Long-term effects of inorganic fertilizers on microbial biomass and community functional diversity in a paddy soil derived from quaternary red clay. Appl. Soil Ecol. 2007, 36, 84–91. [Google Scholar] [CrossRef]
  19. Swędrzyńska, D.; Małecka, I.; Blecharczyk, A.; Swędrzyński, A.; Starzyk, J. The effect of various long-term tillage systems on some chemical and biological properties of soil. Pol. J. Environ. Stud. 2013, 22, 1835–1844. [Google Scholar]
  20. Telesiński, A.; Krzyśko-Łupicka, T.; Cybulska, K.; Wróbel, J. Response of soil phosphatase activities to contamination with two types of tar oil. Environ. Sci. Pollut. Res. 2018, 25, 28642–28653. [Google Scholar] [CrossRef]
  21. Zuber, S.M.; Villamil, M.B. Meta-analysis approach to assess effect of tillage on microbial biomass and enzyme activities. Soil Biol. Biochem. 2016, 97, 176–187. [Google Scholar] [CrossRef] [Green Version]
  22. Salazar, S.; Sanchez, L.; Alvarez, J.; Valverde, A.; Galindo, P.; Igual, J.M.; Peix, A.; Santa-Regina, I. Correlation among soil enzyme activities under different forest system management practices. Ecol. Eng. 2011, 37, 1123–1131. [Google Scholar] [CrossRef]
  23. García, C.; Hernández, M.T.; Costa, F. Potential use of dehydrogenase activity as an index of microbial activity in degraded soils. Commun. Soil Sci. Plant Anal. 1997, 28, 123–134. [Google Scholar] [CrossRef]
  24. Kalembasa, S.; Symanowicz, B. Enzymatic activity of soil after applying various waste organic materials, ash, and mineral fertilizers. Pol. J. Environ. Stud. 2012, 21, 1635–1641. [Google Scholar]
  25. Lemanowicz, J.; Bartkowiak, A.; Breza-Boruta, B. Changes in phosphorus content, phosphatase activity and some physicochemical and microbiological parameters of soil within the range of impact of illegal dumping sites in Bydgoszcz. Environ. Earth Sci. 2016, 75, 510. [Google Scholar] [CrossRef] [Green Version]
  26. Swędrzyńska, D.; Zielewicz, W.; Swędrzyński, A.; Starzyk, J.; Wolna-Maruwka, A. Influence of the soleflor soil bioconditioner on the microbiological state of soil and the vigour and yield of orchard grass (Dactylis glomerata L.). Rocz. Ochr. Środ. 2015, 17, 1320–1338. [Google Scholar]
  27. Francioli, D.; Schulz, E.; Lentendu, G.; Wubet, T.; Buscot, F.; Reitz, T. Mineral vs. organic amendments: Microbial community structure, activity and abundance of agriculturally relevant microbes are driven by long-term fertilization strategies. Front. Microbiol. 2016, 7, 1446. [Google Scholar] [CrossRef] [Green Version]
  28. Gu, Y.; Wang, Y.; Lu, S.; Xiang, Q.; Yu, X.; Zhao, K.; Zou, L.; Chen, Q.; Tu, S.; Zhang, X. Long-term fertilization structures bacterial and archaeal communities along soil depth gradient in a paddy soil. Front. Microbiol. 2017, 8, 1516. [Google Scholar] [CrossRef] [PubMed] [Green Version]
  29. Rouphael, Y.; Colla, G. Toward a sustainable agriculture through plant biostimulants: From experimental data to practical applications. Agronomy 2020, 10, 1461. [Google Scholar] [CrossRef]
  30. Du Jardin, P. Plant biostimulants: Definition, concept, main categories and regulation. Sci. Hortic. 2015, 196, 3–14. [Google Scholar] [CrossRef] [Green Version]
  31. Talar-Krasa, M.; Wolski, K.; Biernacik, M. Biostimulants and possibilities of their usage in grassland. Grassl. Sci. 2019, 65, 205–209. [Google Scholar] [CrossRef]
  32. Regulation (EU) 2019/1009 of the European Parliament and of the Council of 5 June 2019 Laying down Rules on the Making Available on the Market of EU Fertilising Products and Amending Regulations (EC) No 1069/2009 and (EC) No 1107/2009 and Repealing Regulation (EC) No 2003/2003. Available online: https://eur-lex.europa.eu/legal-content/EN/TXT/?uri=CELEX%3A32019R1009 (accessed on 9 August 2021).
  33. Niewiadomska, A.; Sulewska, H.; Wolna-Maruwka, A.; Ratajczak, K.; Waraczewska, Z.; Budka, A. The influence of Bio-stimulants and foliar fertilizers on yield, plant features, and the level of soil biochemical activity in white lupine (Lupinus albus L.) Cultivation. Agronomy 2020, 10, 150. [Google Scholar] [CrossRef] [Green Version]
  34. Martyniuk, S.; Księżak, J. Evaluation of pseudo-microbial biopreparations used in crop production. Pol. J. Agron. 2011, 6, 27–33. [Google Scholar]
  35. Mayer, J.; Scheid, S.; Oberholzer, H.R. How effective are “Effective microorganisms”? Results from an organic farming field experiment. In Proceedings of the 16th JFOAM Organic World Congress, Modena, Italy, 18–20 June 2008; pp. 40–43. Available online: http//orgprints.org/14838 (accessed on 8 August 2021).
  36. Van Vliet, P.C.J.; Bloem, J.; de Goede, R.G.M. Microbial diversity, nitrogen loss and grass production after addition of Effective Microorganisms (EM) to slurry manure. Appl. Soil Ecol. 2006, 32, 188–198. [Google Scholar] [CrossRef]
  37. Yakhin, O.I.; Lubyanov, A.A.; Yakhin, I.A.; Brown, P.H. Biostimulants in plant science: A global perspective. Front. Plant. Sci. 2017, 7, 2049. [Google Scholar] [CrossRef] [Green Version]
  38. Craigie, J.S. Seaweed extract stimuli in plant science and agriculture. J. Appl. Phycol. 2011, 23, 371–393. [Google Scholar] [CrossRef]
  39. Khan, W.; Rayirath, U.P.; Subramanian, S.; Jithesh, M.N.; Rayorath, P.; Hodges, D.M.; Critchley, A.T.; Craige, J.S.; Norrie, J.; Prithiviraj, B. Seaweed extracts as biostimulants of plant growth and development. J. Plant. Growth Regul. 2009, 28, 386–399. [Google Scholar] [CrossRef]
  40. Renaut, S.; Masse, J.; Norrie, J.P.; Blal, B.; Hijri, M. A commercial seaweed extract structured microbial communities associated with tomato and pepper roots and significantly increased crop yield. Microb. Biotechnol. 2019, 12, 1346–1358. [Google Scholar] [CrossRef] [Green Version]
  41. Milton, R.F. Liquid seaweed as a fertilizer. Proc. Int. Seaweed Symp. 1964, 4, 428–431. [Google Scholar]
  42. González, A.; Castro, J.; Vera, J.; Moenne, A. Seaweed oligosaccharides stimulate plant growth by enhancing carbon and nitrogen assimilation, basal metabolism, and cell division. J. Plant. Growth Regul. 2013, 32, 443–448. [Google Scholar] [CrossRef] [Green Version]
  43. WRB. World reference base for soil resources. In Word Soil Resources Reports, 106; Food and Agriculture Organization of the United Nations: Rome, Italy, 2015. [Google Scholar]
  44. Marcinek, J.; Komisarek, J.; Bednarek, R.; Mocek, A.; Skiba, S.; Wiatrowska, K. Polish soil classification. Soil Sci. Annu. 2011, 62, 193. [Google Scholar]
  45. Zielewicz, W.; Goliński, P.; Wróbel, B. Effect of application of mineral fertilizers containing biological additives on botanical composition, nitrogen status and yielding of grass-legume sward. J. Res. Appl. Agric. Eng. 2018, 63, 146–150. [Google Scholar]
  46. Available online: https://pl.timacagro.com/ (accessed on 1 May 2021).
  47. Filipek, J. Zagadnienia wielkości próbek przeznaczonych do analizy botaniczno-wagowej w doświadczeniach łąkarskich (Issues of samples size intended for botanical-weight analysis in meadow experiments). Post. Nauk Rol. 1970, 50, 77–96. (In Polish) [Google Scholar]
  48. Novak, J. Evaluation of grassland quality. Ecologia 2004, 23, 127–143. [Google Scholar]
  49. Merck-Polska. 101621 Standard Count Agar for Microbiology. 2004, p. 1. Available online: https://www.merckmillipore.com/PL/pl/product/Standard-count-agar,MDA_CHEM-101621#anchor_TI (accessed on 10 November 2016).
  50. Hattori, R.; Hattori, T. Sensitivity to salts and organic compounds of soil bacteria isolated on diluted media. J. Gen. Appl. Microbiol. 1980, 26, 1–14. [Google Scholar] [CrossRef]
  51. Martin, J.P. Use of acid, rose bengal and streptomycin in the plate method for estimating soil fungi. Soil Sci. 1950, 69, 215–232. [Google Scholar] [CrossRef]
  52. Thalmann, A. The method of determining the dehydrogenase activity in the soil using triphenytetrazolium chloride (TTC) (Zur Methodik der Bestimmung der Dehydrogenase aktivität im Boden mittels triphenytetrazoliumchlorid (TTC)). Landwirtsch Forsch. 1968, 21, 249–258. [Google Scholar]
  53. Tabatabai, M.A.; Bremner, J.M. Use of p-nitrophenyl phosphate for assay of soil phosphatase activity. Soil Biol. Biochem. 1969, 1, 301–307. [Google Scholar] [CrossRef]
  54. Hoffman, G.; Teicher, K. Colorimetric method for determining the activity of the soil urease. J. Plant. Nutr. Fertil. Soil Sci. 1961, 95, 55–63. (In German) [Google Scholar]
  55. Johnson, J.L.; Temple, K.L. Some variables affecting the measurement of “catalase activity” in soil 1. Soil Sci. Soc. Am. 1964, 28, 207–209. [Google Scholar] [CrossRef]
  56. Stefanic, F.; Ellade, G.; Chirnageanu, J. Researches concerning a biological index of soil fertility. In Proceeding of the 5th Symposium of Soil Biology; Nemes, M.P., Kiss, S., Papacostea, P., Stefanic, C., Rusan, M., Eds.; Romanian National Society of Soil Science: Bucharest, Romania, 1984; pp. 35–45. [Google Scholar]
  57. Abdi, H.; Lynne, J.W. Principal component analysis. Wiley Interdiscip. Rev. Comput. Stat. 2010, 2, 433–459. [Google Scholar] [CrossRef]
  58. Jongman, R.H.G.; Bunce, R.G.H.; Metzger, M.J.; Mucher, C.A.; Howard, D.C.; Mateus, V.L. Objectives and applications of a statistical environmental stratification of Europe. Landsc. Ecol. 2006, 21, 409–429. [Google Scholar] [CrossRef]
  59. Berendsen, R.L.; Pieterse, C.M.J.; Bakker, P.A.H.M. The rhizosphere microbiome and plant health. Trends Plant Sci. 2012, 17, 478–486. [Google Scholar] [CrossRef]
  60. Berg, G.; Grube, M.; Schloter, M.; Smalla, K. Unraveling the plant microbiome: Looking back and future perspectives. Front. Microbiol. 2014, 5, 148. [Google Scholar] [CrossRef] [Green Version]
  61. Bulgarelli, D.; Schlaeppi, K.; Spaepen, S.; Van Themaat, E.V.L.; Schulze-Lefert, P. Structure and functions of the bacterial microbiota of plants. Annu. Rev. Plant Biol. 2013, 64, 807–838. [Google Scholar] [CrossRef] [Green Version]
  62. Lakshmanan, V.; Selvaraj, G.; Bais, H.P. Functional soil microbiome: Belowground solutions to an aboveground problem. Plant Physiol. 2014, 166, 689–700. [Google Scholar] [CrossRef] [Green Version]
  63. Tshewang, S.; Rengel, Z.; Siddique, K.H.M.; Solaiman, Z.M. Nitrogen and potassium fertilisation influences growth, rhizosphere carboxylate exudation and mycorrhizal colonisation in temperate perennial pasture grasses. Agronomy 2020, 10, 1878. [Google Scholar] [CrossRef]
  64. Viljoen, C.; van der Colf, J.; Swanepoel, P.A. Benefits are limited with high nitrogen fertiliser rates in kikuyu-ryegrass pasture systems. Land 2020, 9, 173. [Google Scholar] [CrossRef]
  65. Dainese, M. Using natural gradients to infer a potential response to climate change: An example on the reproductive performance of Dactylis glomerata L. Biology 2012, 1, 857–868. [Google Scholar] [CrossRef]
  66. Lee, H.S.; Lee, I.D. Effect of N fertilizer levels on the dry matter yield, quality and botanical composition in eight-species mixtures. Korean J. Anim. Sci. 2000, 42, 727–734. [Google Scholar]
  67. Snyman, H.A. Short-term response of rangeland botanical composition and productivity to fertilization (N and P) in a semi-arid climate of South Africa. J. Arid Environ. 2002, 50, 167–183. [Google Scholar] [CrossRef]
  68. Kalmbacher, R.; Martin, F. Shifts in botanical composition of Flatwoods range following fertilization. J. Range Manag. 1996, 49, 530–534. [Google Scholar] [CrossRef] [Green Version]
  69. Samuel, M.J.; Hart, R.H. Nitrogen fertilization, botanical composition and biomass production on mixed-grass rangeland. J. Range Manag. 1998, 51, 408–416. [Google Scholar] [CrossRef] [Green Version]
  70. Silsbury, J.H.; Catchpoole, D.W.; Wallace, W. Effects of nitrate and ammonium on nitrogenase (C2H2 reduction) activity of swards of subterranean clover, Trifolium subterraneum L. Funct. Plant Biol. 1986, 13, 257–273. [Google Scholar] [CrossRef]
  71. Serraj, R.; Vadez, V.; Denison, R.F.; Sinclair, T.R. Involvement of ureides in nitrogen fixation inhibition in soybean. Plant Physiol. 1999, 119, 289–296. [Google Scholar] [CrossRef] [PubMed] [Green Version]
  72. Saito, A.; Tanabata, S.; Tanabata, T.; Tajima, S.; Ueno, M.; Ishikawa, S.; Ohtake, N.; Sueyoshi, K.; Ohyama, T. Effect of nitrate on nodule and root growth of soybean (Glycine max (L.) Merr.). Int. J. Mol. Sci. 2014, 15, 4464–4480. [Google Scholar] [CrossRef] [PubMed]
  73. Baker, M.J.; Williams, W.M. White Clover; C.A.B International: Wallingford, UK, 1987. [Google Scholar]
  74. Rysiak, A.; Chabuz, W.; Sawicka-Zugaj, W.; Zdulski, J.; Grzywaczewski, G.; Kulik, M. Comparative impacts of grazing and mowing on the floristics of grasslands in the buffer zone of Polesie National Park, eastern Poland. Glob. Ecol. Conserv. 2020, 27, e01612. [Google Scholar] [CrossRef]
  75. Fulkerson, W.J.; Michell, P.J. The effect of height and frequency of mowing on the yield and composition of perennial ryegrass—White clover swards in the autumn to spring period. Grass Forage Sci. 1987, 42, 169–174. [Google Scholar] [CrossRef]
  76. Bolan, N.S.; Hedley, M.J.; White, R.E. Processes of soil acidification during nitrogen cycling with emphasis on legume based pastures. Plant Soil 1991, 134, 53–63. [Google Scholar] [CrossRef]
  77. Filipek, T.; Skowrońska, M. Current dominant causes and effects of acidification of soils under agricultural use in Poland. Acta Agroph. 2013, 20, 283–294. [Google Scholar]
  78. Grzebisz, W.; Diatta, J.B.; Szczepaniak, W. Production and ecological conditions of liming arable land soils (Produkcyjne i ekologiczne uwarunkowania wapnowania gleb gruntów ornych). Nawozy Nawoż. 2006, 2, 69–85. (In Polish) [Google Scholar]
  79. Zielewicz, W.; Swędrzyńska, D.; Swędrzyński, A. The effect of different doses of Soleflor soil improver and mineral fertilizers on botanical composition and yielding of grass-legume sward (Wpływ zróżnicowanych dawek polepszacza glebowego Soleflor i nawozów mineralnych na skład botaniczny i plonowanie runi motylkowato-trawiastej). Łąk. Pol./Grassl. Sci. Pol. 2015, 18, 267–279. (In Polish) [Google Scholar]
  80. Elgersma, A.; Hassink, J. Effects of white clover (Trifolium repens L.) on plant and soil nitrogen and soil organic matter in mixtures with perennial ryegrass (Lolium perenne L.). Plant Soil 1997, 197, 177–186. [Google Scholar] [CrossRef]
  81. Helios, W. Effect of white clover (Trifolium repens L.) undersowing cultivation and nitrogen fertilization on weed infestation, biomass yield and its component, content and uptake of macroelements of willow (Salix viminalis L.). Agronomy 2021, 11, 786. [Google Scholar] [CrossRef]
  82. Wolinska, A.; Frąc, M.; Oszust, K.; Szafranek-Nakonieczna, A.; Zielenkiewicz, U.; Stępniewska, Z. Microbial biodiversity of meadows under different modes of land use: Catabolic and genetic fingerprinting. World J. Microbiol. Biotechnol. 2017, 33, 154. [Google Scholar] [CrossRef] [PubMed] [Green Version]
  83. Teixeira, R.A.; Soares, T.G.; Fernandes, A.R.; de Souza Braz, A.M. Grasses and legumes as cover crop in no-tillage system in northeastern Pará Brazil. Acta Amaz. 2014, 44, 411–418. [Google Scholar] [CrossRef]
  84. Borkert, C.M.; Gaudêncio, C.A.; Pereira, J.E. Mineral nutrients in the aboveground biomass of ground cover crops (Nutrientes minerais na biomassa da parte aérea em culturas de cobertura do solo). Pesqui. Agropecu. Bras. 2003, 38, 143–153. [Google Scholar] [CrossRef]
  85. Swift, M.J.; Heal, O.W.; Anderson, J.M. Decomposition in Terrestrial Ecosystems; Blackwell Scientific Publication: Oxford, UK, 1979; p. 384. [Google Scholar]
  86. Bidar, G.; Garçon, G.; Pruvot, C.; Dewaele, D.; Cazier, F.; Douay, F.; Shirali, P. Behavior of Trifolium repens and Lolium perenne growing in a heavy metal contaminated field: Plant metal concentration and phytotoxicity. Environ. Pollut. 2007, 147, 546–553. [Google Scholar] [CrossRef] [PubMed]
  87. Martinez-Hildago, P.; Hirsch, A.M. The nodule microbiome: N2-Fixing rhizobia do not live alone. Phytobiomes 2017, 1, 70–72. [Google Scholar] [CrossRef] [Green Version]
  88. Oleńska, E.; Małek, W. Genomic polymorphism of Trifolium repens root nodule symbionts from heavy metal-abundant 100-year-old waste heap in southern Poland. Arch. Microbiol. 2019, 201, 1405–1414. [Google Scholar] [CrossRef] [Green Version]
  89. Oleńska, E.; Małek, W. Sequence analysis of hypothetical lysine exporter genes of Rhizobium leguminosarum bv. trifolii from calamine old waste heaps and their evolutionary history. Curr. Microbiol. 2013, 66, 493–498. [Google Scholar] [CrossRef] [Green Version]
  90. Oleńska, E.; Małek, W. Genetic differentiation of Trifolium repens microsymbionts deriving from Zn–Pb waste-heap and control area in Poland. J. Basic Microbiol. 2015, 55, 462–470. [Google Scholar] [CrossRef]
  91. Hugenholtz, P.; Pace, N.R. Identifying microbial diversity in the natural environment: A molecular phylogenetic approach. Trends Biotechnol. 1996, 14, 190–197. [Google Scholar] [CrossRef]
  92. VanInsberghe, D.; Hartmann, M.; Stewart, G.R.; Mohn, W.W. Isolation of a substantial proportion of forest soil bacterial communities detected via pyrotag sequencing. Appl. Environ. Microbiol. 2013, 79, 2096–2098. [Google Scholar] [CrossRef] [Green Version]
  93. Niewiadomska, A.; Majchrzak, L.; Borowiak, K.; Wolna-Maruwka, A.; Waraczewska, Z.; Budka, A.; Gaj, R. The influence of tillage and cover cropping on soil microbial parameters and spring wheat physiology. Agronomy 2020, 10, 200. [Google Scholar] [CrossRef] [Green Version]
  94. Acosta-Martinez, V.; Tabatabai, M.A. Enzyme activities in a limed agricultural soil. Biol. Fertil. Soils 2000, 31, 85–91. [Google Scholar] [CrossRef]
  95. Błońska, E. Enzyme activity in forest peat soils. Folia For. Polonica Ser. A For. 2010, 52, 20–25. [Google Scholar]
  96. Fernández-Calviño, D.; Soler-Rovira, P.; Polo, A.; Díaz-Raviña, M.; Arias-Estévez, M.; Plaza, C. Enzyme activities in vineyard soils long-term treated with copper-based fungicides. Soil Biol. Biochem. 2010, 42, 2119–2127. [Google Scholar] [CrossRef]
  97. Włodarczyk, T.; Stępniewski, W.; Brzezińska, M. Dehydrogenase activity, redox potential, and emissions of carbon dioxide and nitrous oxide from Cambisols under flooding conditions. Biol. Fertil. Soils 2002, 36, 200–206. [Google Scholar] [CrossRef]
  98. Acosta-Martinez, V.; Tabatabai, M.A. Phosphorus cycle enzymes. In Methods of Soil Enzymology; Dick, R.P., Ed.; Soil Science Society of Ameriaca Inc.: Madison, WI, USA, 2011; pp. 161–182. [Google Scholar]
  99. Tautges, N.E.; Sullivan, T.S.; Reardon, C.L.; Burke, I.C. Soil microbial diversity and activity linked to crop yield and quality in a dryland organic wheat production system. Appl. Soil Ecol. 2016, 108, 258–268. [Google Scholar] [CrossRef] [Green Version]
  100. Abramczyk, K.; Gałązka, A. Diversity of soil microorganisms on areas under protection or with significant natural values. Sylwan 2017, 161, 496–503. (In Polish) [Google Scholar]
  101. Brock, J.L.; Kane, G.J. Variability in establishing white clover in pastures on farms. Proc. N. Z. Grassl. Assoc. 2003, 65, 223–228. [Google Scholar] [CrossRef]
  102. Caradus, J.R.; Woodfield, D. Overview and vision for white clover white clover: New Zealand’s competitive edge. Spec. Publ.-Agron. Soc. N. Z. 1995, 11, 1–6. [Google Scholar]
  103. Elgersma, A.; Schlepers, H.; Nassiri, M. Interactions between perennial ryegrass (Lolium perenne L.) and white clover (Trifolium repens L.) under contrasting nitrogen availability: Productivity, seasonal patterns of species composition, N2 fixation, N transfer and N recovery. Plant Soil 2000, 221, 281–299. [Google Scholar] [CrossRef]
  104. Schlueter, D.; Tracy, B. Sowing Method effects on clover establishment into permanent pasture. Agron. J. 2011, 104, 1217–1222. [Google Scholar] [CrossRef] [Green Version]
  105. Crush, J.R.; Nichols, S.N.; Ouyang, L. Adventitious root mass distribution in progeny of four perennial ryegrass (Lolium perenne L.) groups selected for root shape. N. Z. J. Agric. Res. 2010, 53, 193–200. [Google Scholar] [CrossRef] [Green Version]
  106. Fulkerson, W.J.; Donaghy, D.J. Plant-soluble carbohydrate reserves and senescence—Key criteria for developing an effective grazing management system for ryegrass-based pastures: A review. Aust. J. Exp. Agric. 2001, 41, 261–275. [Google Scholar] [CrossRef]
  107. Böhme, L.; Langer, U.; Böhme, F. Microbial biomass, enzyme activities and microbial community structure in two European long-term field experiments. Agric. Ecosyst. Environ. 2005, 109, 141–152. [Google Scholar] [CrossRef]
  108. Pietri, J.C.A.; Brookes, P.C. Substrate inputs and pH as factors controlling microbial biomass, activity and community structure in an arable soil. Soil Biol. Biochem. 2009, 41, 1396–1405. [Google Scholar] [CrossRef]
  109. Rousk, J.; Bååth, E.; Brookes, P.C.; Lauber, C.L.; Lozupone, C.; Caporaso, J.G.; Knight, R.; Fierer, N. Soil bacterial and fungal communities across a pH gradient in an arable soil. ISME J. 2010, 4, 1340–1351. [Google Scholar] [CrossRef]
  110. Wolińska, A.; Stępniewska, Z. Dehydrogenase activity in the soil environment. In Dehydrogenases; Canuto, R.A., Ed.; InTech: London, UK, 2012; pp. 183–210. [Google Scholar]
  111. Wolinska, A.; Stępniewska, Z.; Szymańska, E. Dehydrogenase activity of soil microorganisms and the total DNA level in soil of different use. J. Agric. Sci. Technol. B 2013, 3, 613–621. [Google Scholar]
  112. Praveen-Kumar, B.; Tarafdar, J.C. 2,3,5-Triphenyltetrazolinium chloride (TTC) as a electron acceptor of culturable soil bacteria, fungi, and actinomycetes. Biol. Fertil. Soils 2003, 38, 186–189. [Google Scholar] [CrossRef]
  113. Swędrzyńska, D.; Grześ, S. Microbiological parameters of soil under sugar beet as a response to the long-term application of different tillage systems. Pol. J. Environ. Stud. 2015, 24, 285–294. [Google Scholar] [CrossRef] [Green Version]
  114. Brzezińska, M.; Włodarczyk, T. Enzymes of intracellular redox transformations (oxidoreductases). Acta Agrophys. 2005, 3, 11–26. [Google Scholar]
Figure 1. Distribution of precipitation during the growing season and average temperature of the month. IV—April; V—May; VI—June; VII—July; VIII—August; IX—September.
Agronomy 11 01786 g001
Figure 2. Percentage share in biomass of plant species in the legume-grass mixture (LGM) sward in 2018 and 2019 (average of three cuts).
Agronomy 11 01786 g002
Figure 3. Percentage share in biomass of plant species in the grass mixture (GM) sward in 2018 and 2019 (average of three cuts).
Agronomy 11 01786 g003
Figure 4. Biomass yields of legume-grass mixture (LGM) and grass mixture (GM) in 2018 and 2019 (t∙ha−1 FM).
Agronomy 11 01786 g004
Figure 5. Soil pH values in 2018–2019 (estimated marginal means and 95% confidence intervals in each experimental combination).
Agronomy 11 01786 g005
Figure 6. Count of soil microorganisms in 2018–2019 (estimated marginal means and 95% confidence intervals in each experimental combination).
Agronomy 11 01786 g006
Figure 7. Soil enzymes activity in 2018–2019 (estimated marginal means and 95% confidence intervals in each experimental combination).
Agronomy 11 01786 g007
Figure 8. The projection of variables on a plane of the first and second factor—PCA method.
Agronomy 11 01786 g008
Table 1. Two-way ANOVA analyses of influence of fertilization and plant mixture on share of analyzed components in sward (n = 168).
MixtureFertilizationMixture × Fertiliz.ErrorTotal
df = 1df = 6df = 6df = 154df = 167
SSFpSSFpSSFpSSSS
Lolium perenne342.915.2<0.0014941.636.4<0.00116,998.6125.2<0.0013485.525,768.6
Other grasses24,432.6783.7<0.00121,329.3114.7<0.0016220.333.3<0.0014801.256,783.4
All grasses18,987.9877.8<0.0016353.649.0<0.0013428.826.4<0.0013331.232,098.5
Trifolium repens21,488.11722.9<0.0015915.379.0<0.0014165.855.7<0.0011920.733,489.9
Table 2. Effect of forage plant mixture type and fertilization treatment on total biomass yields (t∙ha−1 FM).
Study YearForage Plant Mixture Fertilization Treatment (FT)p-Values
GMLGMControlNPKNPK + N-14 300NPK + N-14 900NPK + PinKstartNPK + PhysiostartNPK + PhysioactivGMFTGM × FT
201812.0 a12.4 a8.1 a12.1 b12.9 b12.9 b12.6 b12.9 b13.7 bns<0.001ns
201922.5 a20.1 b15.5 a20.6 b22.7 bc23.0 bc21.6 bc21.7 bc24.0 c<0.001<0.001ns
ns—no significant; Means in the same row with different letter differ significantly (p < 0.05).
Table 3. Two-way ANOVA analyses of influence of fertilization and plant mixture on soil pH and counts of microorganisms in 2018–2019 (n = 168).
MixtureFertilizationMixture × FertilizationErrorTotal
df = 1df = 6df = 6df = 154df = 167
SSFpSSFpSSFpSSSS
pH0.0901.97ns13.3048.42<0.0010.1230.45ns3.20516.718
Heterotrophic bacteria30,590.699.91<0.00123,159.112.61<0.0014160.02.260.04721,433.879,346.6
Oligotrophic bacteria16,013.473.43<0.00118,819.414.38<0.0016379.44.870.00133,585.574,797.8
Copiotrophic bacteria5130.545.39<0.0017134.110.52<0.001881.31.30ns17,405.730,551.6
Fungi3049.87.980.00515,393.96.72<0.001588.60.26ns58,792.877,825.1
ns—no significant.
Table 4. Two-way ANOVA analyses of influence of fertilization and plant mixture on enzymes activity in 2018–2019 (n = 168).
Mixture FertilizationMixture × Fertiliz.ErrorTotal
df = 1df = 6df = 6df = 154df = 167
SSFpSSFpSSFpSSSS
Dehydrogenases51.939.580.003587.0118.06<0.001113.293.490.005379.231131.46
Acid phosphatase0.010754.22<0.0010.03442.900.0140.00685.710.0030.13420.0347
Alkaline phosphatase0.010630.05<0.0010.026211.32<0.0010.00572.680.0210.02480.0672
Catalase29.07433.20<0.00128.3625.40<0.00122.4094.260.00144.5599.990
Urease0.9500.003ns830.260.45ns194.370.01ns21,436.922,462.4
ns—not significant.
Table 5. Pearson’s correlation coefficient (r) for the examined parameters in 2018–2019 (n = 168).
VariablepHBiomass YieldLolium perenneOther GrassesAll GrassesTrifolium repensHetero. BacteriaOligo. BacteriaCopio. BacteriaFungiDehydro.Acid Phosphat.Alkaline Phosphat.Urease
Biomass yield0.09
Lolium perenne0.05−0.13
Other grasses−0.32 **0.18 *−0.66 **
All grasses−0.38 **0.120.020.74 **
Trifolium repens0.36 **−0.12−0.03−0.67 **−0.92
Heterotrophic bacteria0.37 **−0.050.11−0.61 **−0.720.69 **
Oligotrophic bacteria0.23 **−0.14−0.02−0.45 **−0.610.60 **0.66 **
Copiotrophic bacteria0.13−0.08−0.04−0.26 **−0.380.36 **0.56 **0.66 **
Fungi−0.29 **−0.11−0.20 **0.140.01−0.020.140.16 *0.18 *
Dehydrogenases0.57 **0.030.22 **−0.51 **−0.480.46 **0.21 **0.24 **0.04−0.45 **
Acid phosphat.−0.14−0.23 **0.28 **−0.38 **−0.250.24 **0.26 **0.150.26 **0.19 *0.17 *
Alkaline phosphatase0.67 **0.25 **0.28 **−0.56 **−0.490.50 **0.41 **0.27 **0.17 *−0.23 **0.63 **0.12
Urease0.23 **0.59 **0.06−0.15−0.140.15 *0.070.15 *0.07−0.42 **0.44 **−0.27 **0.45 **
Catalase0.52 **0.16 *−0.01−0.38 **−0.520.49 **0.65 **0.39 **0.40 **0.060.36 **0.26 **0.68 **0.21 **
*—significant at p < 0.05 **—significant at p < 0.01.
Publisher’s Note: MDPI stays neutral with regard to jurisdictional claims in published maps and institutional affiliations.

