Article

Evaluation of Advanced Backcrosses of Eggplant with Solanum elaeagnifolium Introgressions under Low N Conditions

1
Instituto de Conservación y Mejora de la Agrodiversidad Valenciana, Universitat Politècnica de València, Camino de Vera 14, 46022 Valencia, Spain
2
Seeds for Innovation, Parque Científico-Tecnológico de Almería, Avenida de la Innovación 15, 04131 Almería, Spain
3
Instituto de Biología Molecular y Celular de Plantas, Consejo Superior de Investigaciones Científicas-Univesitat Politècnica de València, Camino de Vera 14, 46022 Valencia, Spain
*
Author to whom correspondence should be addressed.
Agronomy 2021, 11(9), 1770; https://doi.org/10.3390/agronomy11091770
Submission received: 30 July 2021 / Revised: 26 August 2021 / Accepted: 30 August 2021 / Published: 3 September 2021

Abstract

:
Selection and breeding of eggplant (Solanum melongena) materials with good performance under low nitrogen (N) fertilization inputs is a major breeding objective to reduce environmental degradation, risks for human health, and production costs. Solanum elaeagnifolium, an eggplant wild relative, is a potential source of variation for introgression breeding in eggplant. We evaluated 24 plant, fruit, and composition traits in a set of genotyped advanced backcrosses (BC2 and BC3) of eggplant with S. elaeagnifolium introgressions under low N conditions. Significant differences were found between the two parents for most traits, and a wide phenotypic diversity was observed in the advanced backcrosses, with some individuals with a much higher yield, nitrogen use efficiency (NUE), and phenolics content than the S. melongena parent. In general, the lower the proportion of S. elaeagnifolium genome introgressed in the advanced backcrosses, the higher was the general phenotypic resemblance to S. melongena. Putative QTLs were detected for stem diameter (pd4), presence of prickles in stem (ps6), leaf (pl6) and fruit calyx (pc6), fruit width (fw7), chlorogenic acid content (cg5), total phenolic acid peaks area (ph6), chlorogenic acid peak area (ca1), and phenolic acids pattern (cp1). Our results reveal that introgression breeding of eggplant with S. elaeagnifolium has a great interest for eggplant breeding, particularly for adaptation to low N conditions. These materials can potentially contribute to the development of improved eggplant varieties for a more sustainable agriculture.

1. Introduction

The use of nitrogen (N) fertilizers is widespread in agriculture, as N has a fundamental role in increasing plant growth and crop yields and is frequently a limiting factor in soils [1]. In the past six decades, intensive and generalized use of N fertilizers has resulted in an increase of global food production and a reduction of world hunger. However, a continued N over fertilization has a negative impact on the environment, including surface and groundwater contamination and eutrophication of freshwater and estuarine ecosystems [2,3]. Contamination of water used for human consumption by nitrates is also a threat for human health in certain regions. Therefore, reducing N fertilization and increasing the nitrogen use efficiency (NUE) of crops is one of the main objectives to decrease environmental degradation while increasing crop productivity [2,4,5]. In addition, developing new varieties able to grow and give high yields under low N conditions can extend the range of cultivation conditions suitable for a crop.
Crop wild relatives (CWRs) are a fundamental resource for plant breeding in order to develop new varieties more adapted to low input conditions and to climate change-related stresses [6]. In this respect, many CWRs grow under stressful natural conditions, including low N levels in the soil. Thereby, introgression breeding from CWRs into the genetic background of the crops may result in the development of more diverse, resilient, and resource efficient, including enhanced NUE [7], crops that contribute to a sustainable agriculture [8].
Eggplant (Solanum melongena L.), also known as aubergine or brinjal, is an Old World domesticate from subgenus Leptostemonum [9] and it is an important and widely grown vegetable crop, especially in South and Southeast Asia, the Middle East, and the Mediterranean region [10]. In terms of global production, eggplant is the third most widely cultivated crop in the Solanaceae family, after tomato and potato, being grown on about 1.85 million (M) ha with a total production of 55.2 M of tons in 2019 [11].
A wide range of CWRs from several clades within subgenus Leptostemonum have been used to obtain interspecific hybrids and backcrosses of eggplant, particularly Old World relatives belonging to the primary (GP1) and the secondary (GP2) gene pools [12,13]. New World eggplant CWRs are included in the tertiary genepool (GP3), and some of them, such as S. elaeagnifolium Cav., S. sisymbriifolium Lam., and S. torvum Sw., awakened an interest among breeders for their tolerance to biotic and/or abiotic stresses [10,14]. However, introgression breeding of eggplant with New World CWRs has remained an elusive breeding goal due to unsuccessful hybridization or high sterility of hybrids [13]. However, recently, we reported the first successful development of first backcross generations of common eggplant (S. melongena) with the New World species S. elaeagnifolium [15]. This wild relative of eggplant is found in deserts and dry forests in North and South America, where N levels in the soil are low [16], and it is considered a noxious invasive weed in dry areas worldwide [17,18]. Moreover, S. elaeagnifolium, among other wild species, was reported to be a potential new source of variation for eggplant quality breeding due to the high levels of phenolic bioactive compounds [19].
Despite economic and social importance of eggplant, the development and the use of genetic and genomic tools lags behind other Solanaceae crops such as tomato, potato, or pepper [10,20]. However, recent efforts of sequencing and resequencing eggplant accessions [21,22,23,24,25] and the development of high-throughput genotyping platforms specific for eggplant, such as the 5k probes single primer enrichment technology (SPET) eggplant platform [26] facilitated eggplant breeding. In this way, in order to improve eggplant tolerance to abiotic stresses, the development of advanced backcrosses and introgression lines, the conservation and the study of eggplant crop-wild relatives (CWR,) and the functional analysis of adaptive traits (QTL) were highlighted as the three priority lines of introgression breeding research in this crop [10].
In this study, we evaluated advanced backcrosses (AB) obtained after the backcrossing for several generations of an S. melongena × S. elaeagnifolium interspecific hybrid [15] towards the recurrent S. melongena under low N conditions. The analysis of phenotypic and composition traits provides information of interest for breeding of eggplant materials with S. elaeagnifolium introgressions for cultivation under low N conditions. The high throughput genotyping of the AB individuals with the eggplant SPET platform also allowed a preliminary genome association study for the detection of QTLs of agronomic, morphological, and fruit quality traits under these conditions.

2. Materials and Methods

2.1. Plant Material

The S. melongena MEL3 and S. elaeagnifolium ELE2 accessions and a set of 56 advanced backcross (AB) individuals towards S. melongena of the interspecific hybrid between S. melongena MEL3 (recurrent parent) and S. elaeagnifolium ELE2 (donor parent) [15] were used for the present study. Out of the 56 AB individuals, five were from the second backcross generation (BC2) and 51 from the third backcross generation (BC3).

2.2. Genotyping

Genomic DNA of the two parents and the 56 ABs was extracted using the SILEX DNA extraction method [27] and evaluated for quality and integrity by agarose gel electrophoresis and spectrophotometric ratios 260:280 and 260:230 and for concentration with a Qubit® 2.0 Fluorometer (Thermo Fisher Scientific, Waltham, MA, USA). After dilution, the DNA samples were genotyped with the 5k SPET probes eggplant platform, which comprises 5093 probes [26]. The whole set of 34,570 single nucleotide polymorphisms (SNPs) was filtered using as criteria a minimum count value of 95% with a minimum allele frequency (MAF) higher than 5% and a maximum heterozygosity proportion of 70% using the Tassel software (version 5.0 Standalone, [28]). After filtering, 851 SNPs were retained and subsequently used for the downstream analysis. The genetic similarities among the parents and the individuals of the BC2 and the BC3 segregating generations were quantified with the identity by state (IBS) distance index. Genetic relationships were described using the neighbor joining clustering method by means of Tassel software (version 5.0 Standalone, [28]).

2.3. Cultivation Conditions

Plants were grown in an open airfield plot in Valencia (Spain) during the summer season (June to October 2019). The BC2 and the BC3 individuals, together with five plants of each of the parental lines, were distributed according to a completely randomized experimental design with 150 cm between rows and 70 cm between plants in each row. One of the plants of the recurrent parent S. melongena died in the early stages of the experiment and therefore was not included in the phenotyping. A drip irrigation system was used for irrigation and fertilization.
A soil physicochemical and composition analysis was performed before the transplant. Five samples consisting of five randomly selected spots of field were considered for soil analysis. For each sample, five fractions of soil 20 cm deep surrounding the selected spot were extracted, homogenized, and left to dry at room temperature. For each dried homogenate sample, 500 g were used for the analyses. Physical and chemical parameters were evaluated following the procedures described in van Reeuwijk [29]: particle size analysis, pH in water, and pH in potassium chloride, electrical conductivity, contents in total nitrogen, carbonates and organic matter, carbon:nitrogen ratio, and mineral contents of available phosphorus, potassium, calcium, magnesium, iron, zinc, and copper. Data of soil characteristics are included as Supplementary Table S1. According to the Spanish interpretation scales for each of the different elements evaluated [30], the soil was moderately basic, non-saline, had low content of nitrogen, high content of carbonates, low presence of organic matter, and high carbon:nitrogen ratio. A chemical composition analysis of water was performed before adding fertilizers. Data of water analysis are included as Supplementary Table S2. The intake water was slightly basic, had low content of nitrates, phosphates, and ammonium, moderate content of sulphates and magnesium, and high content of calcium.
Based on the soil composition and the intake water analyses, a low N fertilization solution was prepared by adding 2.3 mM K2SO4 (Antonio Tarazona SL., Valencia, Spain) plus 0.025 L/m3 of a microelements Welgro Hydroponic fertilizer (Química Massó S.A., Barcelona, Spain) containing boron (BO33−; 0.65% p/v), copper (Cu-EDTA; 0.17% p/v), iron (Fe-DTPA; 3.00% p/v), manganese (Mn-EDTA, 1.87% p/v), molybdenum (MoO42−; 0.15% p/v), and zinc (Zn-EDTA; 1.25% p/v) to the intake water. The pH of the irrigation solution was adjusted to 5.5–5.8. The only source of N in the irrigation water came from the intake water N content (0.65 mM N). In total, 116.83 L of irrigation solution were supplied per plant with a drip irrigation system throughout the growing cycle, corresponding to 1.067 g of N supplied per plant.

2.4. Traits Evaluated

A total of 24 plant and fruit traits were evaluated (Table 1). The SPAD index was measured using a SPAD-502Plus chlorophyll meter (Minolta, Osaka, Japan) as the mean of 10 measurements in five leaves of each plant. For plant traits, plant height, aerial biomass, and stem diameter were measured at the end of the trial. When plants were cut at the base of the stem, aerial shoot biomass was immediately weighed with a Sauter FK-250 dynamometer (Sauter, Balingen, Germany). Subsequently, they were dried at room temperature, and the dry weight was measured. Stem diameter was measured with a caliper at the base of the stem. Nitrogen use efficiency (NUE) was calculated as total fruit yield on a dry weight basis (yield (DM)) divided by N supply per plant [2,31,32].
For fruit traits, pedicel length, calyx length, fruit length, and width were evaluated in at least three fruits per plant harvested at the commercially mature stage (i.e., physiologically immature). The traits evaluated as well as their abbreviations and units in which they are expressed are included in Table 1.
For leaf N and C contents, five leaves per individual were collected, frozen in liquid N2, and stored at −80 °C until lyophilized. For fruit N, C, and phenolic acids analyses, at least three fruits at the commercial maturity stage per individual plant were harvested, cleaned, peeled, and chopped, and a sample was immediately frozen in liquid N2 and stored at −80 °C for subsequent lyophilization. Homogenized powdered tissue of leaf and fruit was used for the composition analyses.
N and C contents were measured in samples of 0.5 g of freeze-dried powder of leaves or fruit flesh. The analysis of N content was performed using the Dumas method based on a complete combustion of the sample at 950 °C in the presence of oxygen using a TruSpec CN elemental analyzer (Leco, MI, USA). Carbon content was calculated from the measurements of carbon dioxide (CO2) using an infrared detector [33]. Certificated reference standards of different N and C concentrations were used for the quantification.
Total phenolics content of fruit flesh was determined using 0.125 g of freeze-dried powdered material following the Folin–Ciocalteu method [34] after extraction with acetone (70% v/v) and acetic acid (0.5% v/v) according to Kaushik et al. [19]. Chlorogenic acid was extracted using 0.1 g of freeze-dried powdered material by ultrasonic bath according to Helmja et al. [35]. The subsequent determination of the content of chlorogenic acid (CGA) was performed by high-performance liquid chromatography (HPLC) using a 1220 Infinity LC System (Agilent 196 Technologies, Santa Clara, CA, USA) equipped with a binary pump, an automatic injector, and a UV detector following the procedure of Plazas et al. [36]. The total area of the peaks corresponding to the different eluted phenolic acids as well as the specific area of the chlorogenic acid peak were obtained from the chromatograms of each sample. Taking the former parameter as reference, the percentage of the peak area corresponding to chlorogenic acid was calculated. As two distinct phenolic acid chromatogram patterns (TP-Pattern) were observed between the donor and the recurrent parents, plants of the ABs were classified as having a S. melongena or S. elaeagnifolium phenolic acids pattern (Table 1).

2.5. Data Analysis

For each of the traits measured, the mean and its standard error (SE), range values, and coefficient of variation (CV; %) were calculated for recurrent and donor parents as well as for BC2 and BC3 generations. Normality of data within each of the two parents and BC generations was checked with a Shapiro–Wilk test. Statistical differences among the means of these four groups were assessed with an analysis of variance (ANOVA) with the Statgraphics Centurion XVII software (StatPoint Technologies, Warrenton, VA, USA). Mean separation was performed with the Student–Newman–Keuls multiple range test at p < 0.05. Due to the wide range of values and a positive relationship between mean and standard deviation values for P-Biomass, Yield, NUE, F-Length, F-Width, and F-Weight, these traits were subjected to a logarithmic transformation before analysis [37]. Estimation of broad-sense heritability (H2) in the ABs population was performed for each trait using the following formula [38]: H2 = VG/(VG + VE). The environmental variance (VE) was estimated as the phenotypic variance of the recurrent parental S. melongena MEL3, while the genotypic variance (VG) was calculated as the difference between the phenotypic variance of the advanced backcrosses BC2 and BC3 (VP) and the environmental variance (VE): VG = VP − VE.
A principal components analysis (PCA) with the traits evaluated was conducted in order to globally evaluate the variation of BC2 and BC3 individuals in comparison to the recurrent parent as well as to assess the effect of the proportion of the homozygous recurrent parent genome in the distribution and the relationships of BC2 and BC3 individuals and the recurrent parent. The PCA was performed on standardized values using pairwise Euclidean distances of the two parents, BC2 and BC3 individuals, using the R package stats of R statistical software v3.6.2 [39]. An additional PCA was performed excluding the S. elaeagnifolium individuals to obtain a more detailed relationship between the recurrent S. melongena parent and the advanced backcrosses towards it. The PCA score and the loading plots were drawn using R package ggplot2 [40]. Pearson pair-wise coefficient of correlation (r) and Spearman correlation among traits, including only the set of 56 advanced backcrosses (AB), were calculated, and the significance was assessed using a Bonferroni correction at the 0.05 probability level if significant [41] using R packages psych [42] and corrplot [43].

2.6. QTL Detection

The composite interval mapping (CIM) method was used to identify quantitative trait locus (QTL) for complex traits implemented by the R package R/qtl [44] of R statistical software v4.0.2 [39]. Putative QTLs with the threshold of LOD score at the 0.05 probability level were considered as significant. The heterozygous allelic effect of each significant QTL was calculated as the difference between the mean of the trait values of the ABs carrying the wild allele in heterozygosis and the mean of the trait values of those ABs with the homozygous recurrent allele. A t-test (p = 0.05) between the two groups was performed to confirm that the QTLs effects were statistically significant. Candidate genes were searched using the Genome browser of Sol Genomics Network [45] with eggplant genome consortium V4.

3. Results

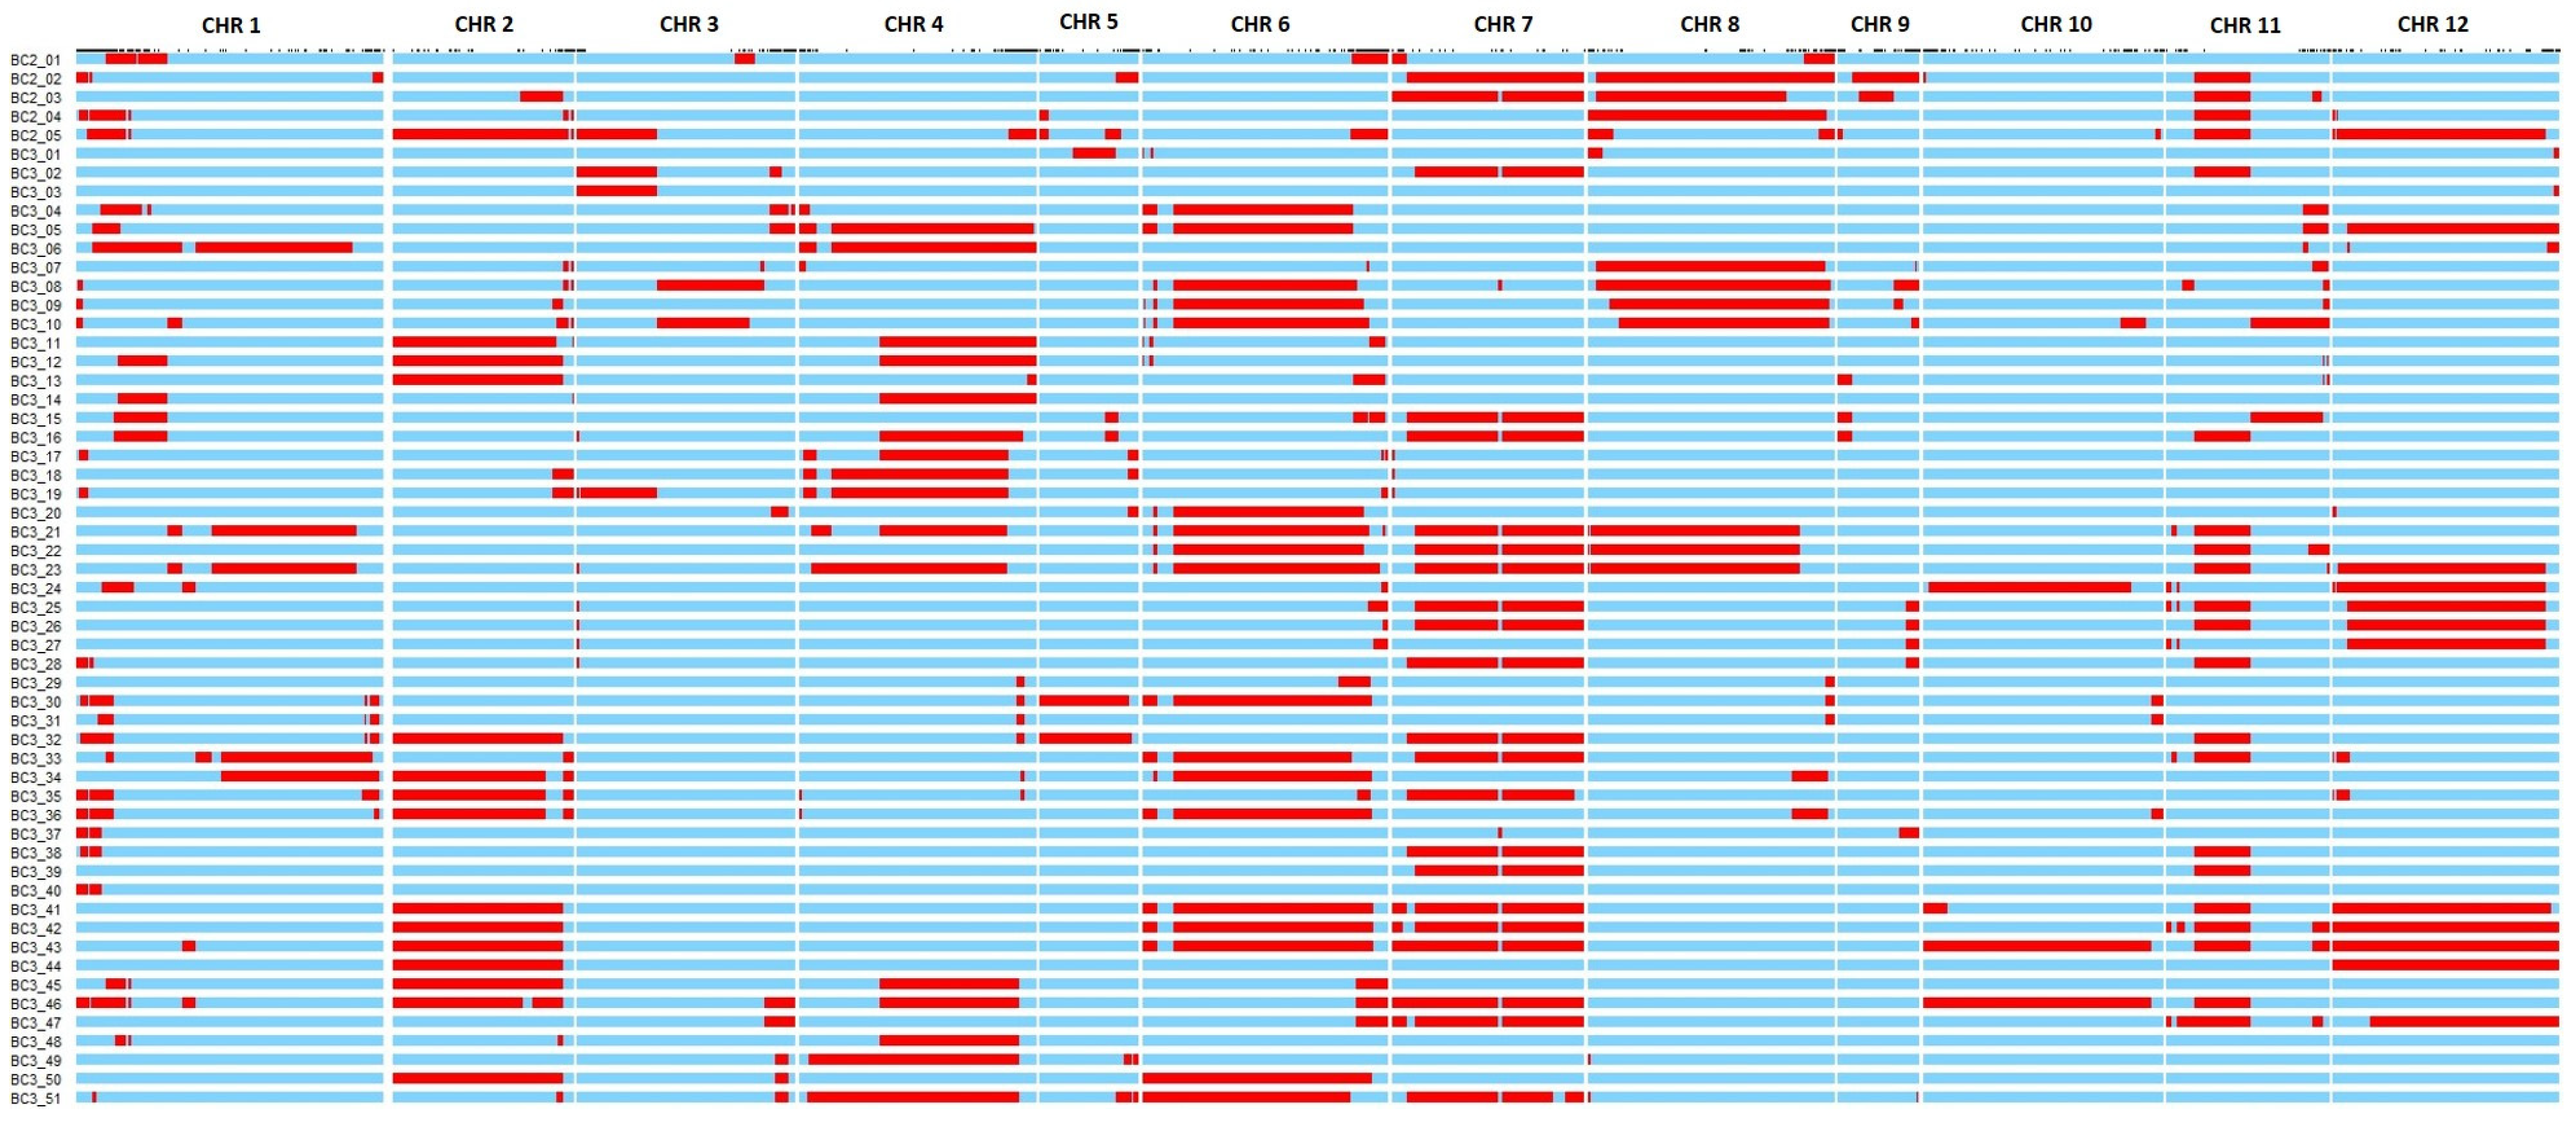
3.1. Genomic Characterization

After SNP marker filtering, a total of 851 markers out of the initial 34,570 markers were selected, although the number of markers in each chromosome differed (chr. 1: 150; chr. 2: 57; chr. 3: 68; chr. 4: 79; chr. 5: 41; chr 6: 99; chr. 7: 33; chr. 8: 71; chr. 9: 60; chr. 10: 90; chr. 11: 31; and chr. 12: 72). A complete coverage of the S. elaeagnifolium genome (in heterozygosis) was obtained with the 56 advanced backcrosses (Figure 1). The ABs had a mean recovery rate of the recurrent parent genetic background in homozygosis of 84.4% with a range of recovery among BC2 and BC3 individuals between 61.0% and 97.6%. The mean number of introgressions was 6.2 with a range between 1 and 13 (Figure 1). The frequency of heterozygosis of each marker along each chromosome was variable, the averages being higher in chromosomes 6 (0.26) and 7 (0.23) and lower in chromosomes 10 (0.06) and 9 (0.07). However, significant differences were observed in the representation among genomic regions within each chromosome (Figure 1).
The dendrogram performed on genetic data clearly separated the recurrent parent (S. melongena) and the BC2 and the BC3 generation individuals in a set of clusters that largely grouped individuals sharing common introgressions from S. elaeagnifolium (Supplementary Figure S1). In this way, BC2 and BC3 individuals were intermingled in the dendrogram grouping with other, while the recurrent parent plotted close to two BC3 individuals with few introgressed markers from S. elaeagnifolium.

3.2. Traits Evaluated

Statistically significant differences (p < 0.05) between parents were detected for all plant traits (Table 2). The plants of the S. melongena parent were larger than those of S. elaeagnifolium and had a higher plant height (P-Height; 1.6-fold), aerial biomass (P-Biomass; 4.9-fold), and stem diameter (P-Diam; 2.6-fold). Additionally, due to their higher yield, S. melongena plants also had higher yield (Yield; 55.6-fold) and nitrogen use efficiency (NUE; 31.6-fold) than those of S. elaeagnifolium. In addition, significant differences were found between parents for all fruit traits, except for the number of fruits per plant (F-Number). Thus, the recurrent parent had higher mean values for the following traits: pedicel length (F-PedLength; 2.7-fold), calyx length (F-CaLength; 4.3-fold), fruit length (F-Length; 9.2-fold), fruit width (F-Width; 4.5-fold), and fruit mean weight (F-Weight; 100.0-fold) (Table 2; Figure 2). For composition traits, S. melongena had significantly higher N content in leaf than S. elaeagnifolium (N-Leaf; 1.2-fold) and chlorogenic acid peak area (CGA-Area; 2.6-fold). Solanum elaeagnifolium displayed significantly higher values than S. melongena in C content in fruit (C-Fruit; 1.1-fold), total phenolics content (TPC; 3.1-fold), and total phenolic acid peak area (TP-Area; 1.9-fold) (Table 2). Few significant differences were observed among BC2 and BC3 means. In this way, only C content in fruit (C-Fruit) and total phenolics content (TPC) displayed higher mean values in BC2, although the relative differences were limited (4.6% and 32.5%, respectively), and C content in leaf (C-Leaf) displayed lower mean values in BC2 with a relatively limited difference (20.9%) (Table 2).
Regarding the comparison between the advanced backcrosses (BC2 and BC3) and S. melongena, significant differences were observed for pedicel, calyx, fruit lengths, fruit width, and fruit weight (F-PedLength, F-CaLength, F-Length, F-Width, and F-Weight, respectively), with S. melongena displaying higher mean values than the advanced backcrosses (51.2%, 43.4%, 43.0%, 34.7%, and 67.2% with BC2 and 34.1%, 31.3%, 30.3%, 21.4%, and 45.3% with BC3, respectively) than the recurrent parent (Table 2). For two composition traits (C-Fruit and TPC), significant differences between BC2 and the recurrent parent, but not between the latter and BC3, were observed. The distribution range and the coefficient of variation (CV) for traits evaluated in the advanced backcrosses were generally greater than those observed in the parents (Figure 2). For example, yield differences in BC3 were 65.4 times between the lowest (124 g) and the highest yielding (8109 g) plants, while in the parents, the differences were of only 2.1-fold in S. melongena and 9.5-fold in S. elaeagnifolium (Table 2).
A lack of overlap in the range of variation between parents was observed in all traits except for C content in leaf (C-leaf), N content in fruit (N-fruit), and chlorogenic acid content (CGA) (Table 2). All distribution ranges of advanced backcrosses overlapped with those of S. melongena, while with S. elaeagnifolium, they did not overlap for yield, nitrogen use efficiency (NUE), fruit calyx length (F-CaLength), fruit length (F-Length), fruit width (F-Width), fruit mean weight (F-Weight), and chlorogenic acid peak area (CGA-Area). For traits such as plant height (P-height), plant biomass (P-Biomass), yield, or nitrogen use efficiency (NUE), there were AB individuals with values higher than the highest for S. melongena, although this was not observed in case of fruit weight (F-Weight) (Table 2). In general, the coefficient of variation (CV) was higher in the BC3, being only higher in BC2 for aerial biomass (P-Biomass), nitrogen use efficiency (NUE), fruit width (F-Width), and chlorogenic acid peak area (CGA-Area) and being higher in the donor parent S. elaeagnifolium only for SPAD, total number of fruits per plant (F-Number), and nitrogen content in leaf (N-Leaf) (Table 2).
Broad-sense heritability (H2) values in the BC2 and the BC3 generations ranged between 0.15 for stem diameter (P-Diam) and 1.00 for the presence of prickles in the stem (P-StPrick), in the leaf (P-Leafprick), and in the calyx (F-CalPrick) and for the pattern of phenolic acids (TP-Pattern) (Table 2). In general, heritability values were high (H2 ≥ 0.65), except for P-Diam (H2 = 0.15), F-Width (H2 = 0.42), F-Weight (H2 = 0.57), and N-Leaf (H2 = 0.24) (Table 2).

3.3. Principal Component Analysis

A PCA performed with the traits evaluated and for all individuals of the two parents and the advanced backcrosses allowed to evaluate the variation within each of the parents and the two backcross segregating generations as well as to evaluate the relationships among all individuals evaluated. The PCA clearly separated the donor parent (S. elaeagnifolium) from the rest of materials, which clustered together (Supplementary Figure S2). In order to obtain a clearer picture of the relationships between the advanced backcrosses and the recurrent parent, a PCA was performed excluding the donor parent individuals (Figure 3). The first and the second principal components (PCs) of this PCA accounted for 33.0% and 16.2%, respectively, of the total variation observed. The first component displayed high positive correlations with phenolics content traits (total phenolics content, TPC; chlorogenic acid content, CGA; and, total phenolic acid peaks area, TP-Area) and negative ones with yield, NUE, and fruit size traits (fruit pedicel length, F-PedLength; fruit calyx length, F-CaLength; fruit length, F-Length; fruit width, F-Width; and, fruit weight, F-Weight) (Figure 3). The second component displayed high correlation values with plant vigor traits (SPAD; plant height, P-Height; aerial biomass, P-Biomass; plant diameter, P-Diam), total number of fruits (F-Number), and phenolic acids pattern (TP-Pattern). Some fruit size traits (fruit pedicel length, F-PedLenght; fruit calyx length, F-CaLength; and, fruit width, F-Width) and chlorogenic acid peak area (CGA-Area) displayed a high negative correlation with PC2 (Figure 3).
The projection of the individuals in the PCA score plot showed a wide distribution over the graph area. All the individuals of the recurrent parent clustered in the lower left quadrant were associated with fruit size traits, while four out of five of the BC2 individuals plotted in the upper right quadrant were associated with high contents in phenolics and N content in the fruit. The BC3 individuals were spread over the whole PCA plot. An association between traits evaluated and percentage of recovered genetic background was observed, as individuals with higher recovery of the donor parent genetic background plotted closer to the recurrent parent and individuals with lower proportion of the genome homozygous for the recurrent parent were situated farther apart from the recurrent parent (Figure 3).

3.4. Correlations among Traits in the ABs

Pearson’s and Spearman’s correlations were conducted, and in both analysis, the results were very similar. Therefore, we displayed Pearson’s correlations (Figure 4). Five traits (SPAD, N-Fruit, N-Leaf, C-Fruit, and C-Leaf) were not significantly correlated (p < 0.05) with any other trait in the BC2 and the BC3 individuals. High positive correlations (r > 0.7) were observed among several traits related to plant vigor: plant height (P-Height), aerial biomass (P-Biomass), and stem diameter (P-Diam) (Figure 4). Similarly, yield showed positive correlations with plant vigor traits (P-Height, P-Biomass, and P-Diam), nitrogen use efficiency (NUE), and fruit size traits (F-PedLength, F-CaLength, F-Length, and F-Width), total number of fruits (F-Number), and fruit mean weight (F-Weight) (Figure 4). Nitrogen use efficiency (NUE) was positively correlated with plant size (P-Height, P-Biomass, and P-Diam), yield, fruit size (F-PedLength, F-CaLength, F-Length, and F-Width), total number of fruits (F-Number), and fruit mean weight (F-Weight) (Figure 4). High positive correlations were observed among fruit size traits (F-PedLength, F-CaLength, F-Length, F-Width, and F- Weight) as well as among the three traits related with the presence of prickles (F-CalPrick, P-StPrick, and F-LeafPrick). The total number of fruits (F-number) showed significant correlations with plant size traits (P-Height, P-Biomass, and P-Diam), yield, and nitrogen use efficiency (NUE) (Figure 4).
Total phenolics content (TPC), chlorogenic acid content (CGA), and total phenolic acid peaks area (TP-Area) were positively intercorrelated (Figure 4). These three traits also showed significant negative correlations with fruit size traits (F-PedLength, F-CaLength, F-Length, F-Width, and F-Weight), except for total phenolics content (TPC), which did not show significant correlations with fruit length (F-Length) and fruit width (F-Width), although it displayed a negative correlation with fruit calyx length (F-CaLength) (Figure 4). Chlorogenic acid peak area (CGA-Area) was negatively correlated with phenolic acids pattern (TP-Pattern) (Figure 4).

3.5. QTL Detection

The genomic and the phenotypic information analysis allowed the detection of nine putative QTLs (Table 3). For plant traits, a QTL was detected for stem diameter (pd4) located on chromosome 4. For traits related with the presence of prickles (P-StPrick, LeafPrick, and F-CalPrick), three QTLs were found located in chromosome 6 at the same position (ps6, pl6, and pc6) with similar allelic effects. For fruit traits, a QTL for fruit width (fw7) was found on chromosome 7. Four QTLs associated with fruit phenolics traits were identified. They were located on chromosome 5 (cg5) for chlorogenic acid content, on chromosome 6 (ph6) for total phenolic acid peak area, and on chromosome 1 (ca1 and cp1) at the same position for both chlorogenic acid peak area and phenolic acid pattern (Table 3).

4. Discussion

Selecting plant materials that perform better under low N conditions is a main goal for developing a more sustainable agriculture less dependent on N fertilizers, which require significant energy for their synthesis and have a negative environmental impact [2,4]. Increasing nitrogen use efficiency (NUE) is one important pathway to enhance sustainability, and several strategies and genetic approaches were described for NUE improvement [45,46,47]. Several efforts for NUE breeding in cereals and others field crops were published in rice [7,48,49,50], wheat [51,52], maize [53,54,55,56], barley [57], millet [58], and oilseed rape [59]. In potato, breeding for NUE was also reported [60,61]. For vegetable crops, less efforts have been made, although recent contributions addressed this issue in tomato [62,63,64] and eggplant [65,66].
In this work, advanced backcrosses of eggplant with introgressions of an American crop wild relative (S. elaeagnifolium) from the tertiary genepool [67] in which the entire genome of the wild species is represented were evaluated for the first time. Genotyping with the 5k probes SPET platform [26] allowed us to obtain a good resolution at the genomic level of the advanced backcrosses with S. elaeagnifolium introgressions, revealing its utility for eggplant introgression breeding. These introgression materials are a resource of great interest for improvement of eggplant, as they widen the genetic background of the crop with exotic variation that has not been used thus far.
Solanum melongena plants developed adequately despite the low amounts of N applied. In this case, the fertilization irrigation solution did not contain any added N fertilizer, the only source of applied N being the intake water with a concentration of 0.65 mM N, much less than the recommended N concentration of 16.5 mM of N in the watering solutions for eggplant in soilless cultivation [68]. Aside from the fact that the wild parent S. elaeagnifolium is a species that grows in poor environments where the N is low [16,18], the evaluation of the advanced backcrosses allowed us to determine genetic parameters of great relevance for important traits in eggplant breeding, including the detection of putative QTLs for some of them. Similar studies were published on QTL detection in tomato under abiotic stress conditions [69,70] but not under low N conditions.
The results showed a large difference for all plant, fruit, and composition traits between the two species (S. melongena and S. elaeagnifolium) used as parents in the development of the advanced backcrosses. This result was expected due to the high phylogenetic distance between the two species [18,71]. High phenotypic diversity was observed in the advanced backcrosses with much higher ranges of variation than the parents for all traits. This fact demonstrates the interest of these materials, since transgressive individuals were found for many characters that can contribute to the development of improved materials. In this way, among the advanced backcrosses, we found materials with much higher yield, NUE, and phenolics content than the cultivated parent. In fact, despite the low N content in the soil and the irrigation water [65,68], plants of some advanced backcrosses had yields over 8 kg/plant, much higher than the recurrent parent S. melongena, suggesting that materials with S. elaeagnifolium introgressions have a high potential for the development of new cultivars adapted to low N conditions.
Phenotypes that were not observed in the parents appeared in some advanced backcrosses, in particular, the presence of prickles in the leaf was observed in some backcrosses although none of the parents had prickly leaves. This is a phenomenon that was observed in other interspecific crosses in eggplant and was attributed to the presence of complementary genes in the two parents [12,72]. It was previously reported that some eggplant wild relatives display higher levels of phenolic acids of interest for human health than cultivated eggplant [19,73,74]. In our case, we found that the eggplant wild relative S. elaeagnifolium displayed higher total phenolics content (TPC) as well as a different and more diverse phenolic acid chromatogram pattern (TP-Pattern). Some advanced backcrosses had higher total phenolics content than the recurrent parent (S. melongena), and, in addition, some of them showed the same phenolic acid chromatogram pattern of the wild parent. These results may be of interest to develop varieties with enhanced bioactive properties. Heritability values, in general, were higher or similar to other studies in which parental generations of eggplant and relatives, interspecific hybrids, and first backcrosses of eggplant were evaluated for different traits [72]. Additionally, H2 values were higher than those observed in the evaluation of a set of introgression lines (ILs) which used S. incanum as donor parent [75]. This fact together with the high ranges of variation indicate that a high response to selection can be obtained, confirming the interest of these materials.
Most of the correlations among traits observed in the advanced backcrosses were expected and are in agreement with observations in other eggplant studies [76,77]. In this way, we found intercorrelations among traits related to plant vigor (plant height, aerial biomass, and stem diameter) and also their correlation with yield, NUE, total number of fruits per plant, and fruit mean weight. Moreover, intercorrelations were observed among the three traits related to the presence of prickles (prickles in stem, in leaf, and in calyx) and among fruit size traits (fruit pedicel length, fruit calyx length, fruit length, fruit width, and fruit mean weight). For composition traits, correlations between total phenolics content (TPC), chlorogenic acid content (CGA), and total phenolic acid peaks area (TP-Area) were also expected [19,78]. In other cases, relevant correlations for breeding were found, such as the negative correlations among some fruit size traits with both total phenolics content (TPC) and chlorogenic acid content (CGA), indicating that a counterbalance between large fruits and high contents in phenolics may exist in the materials evaluated [78,79].
The PCA showed the wide variation observed and that a higher homozygous proportion from the recurrent parental genome resulted in greater overall phenotypic resemblance to the recurrent parent, indicating that large proportions of the S. elaeagnifolium genome in the genetic background of eggplant result in phenotypes that deviate from the recurrent parent. Nonetheless, there are individuals with high S. melongena genome recovery proportion that displayed considerable phenotypic differences among themselves, making them amenable to selection.
The availability of genotyping and phenotyping data allowed the detection of some putative QTLs for traits of interest. We detected a QTL that influenced stem diameter (pd4), an important trait related to vigor. Thus far, only a QTL for this trait was detected in eggplant in chromosome 2 in the ILs population of S. incanum in the genetic background of S. melongena [75]. For the three traits related to the presence of prickles (P-StPrick, F-LeafPrick, and F-CalPrick) we detected three QTLs (ps6, pl6, and pc6, respectively) located at the same position on chromosome 6, indicating a common genetic basis for these three traits. Previously, QTLs related to prickliness were mapped in chromosome 6 [80] in an S. linnaeanum × S. melongena F2 population [76,81], in a BC1 population of the ILs of S. incanum × S. melongena [82], in an F2 intraspecific population [83], and in a panel of 191 accessions of breeding lines, old varieties, and landrace selections of eggplant [77], supporting that a major gene conserved in the eggplant group is present in this region [84,85]. For fruit traits, a QTL was detected for fruit width (F-Width) on chromosome 7 (fw7). Previously, a QTL for fruit width was also detected in chromosome 7 in an F2 intraspecific eggplant population [83]. In addition, other QTLs associated with fruit width were detected scattered over six chromosomes (1, 2, 3, 8, 10, and 11) in several eggplant populations, such as the ILs of S. incanum [86], an S. linnaeanum × S. melongena F2 population [81,87], and the 191 eggplant accessions panel [77].
For composition traits, we identified a QTL for CGA content (cg5) in chromosome 5. Two QTLs related with CGA content were previously described, located in chromosomes 4 and 6 [88]. None of these three QTLs contain genes involved in the chlorogenic acid synthesis pathway [24,82], thus, the genetic basis of CGA related traits needs to be further investigated. For total phenolic acid peaks area (TP-Area), we found a QTL on chromosome 6 (ph6), in which there are two putative genes involved in phenolic pathways [89,90]. One of them is a gene described as similar to CCR1, cinnamoyl-CoA reductase 1 (SMEL_006g261420.1.01), and it was reported to play a role in soluble phenolic content in tomato (S. lycopersicum L.) [91], and the other is a gene described as similar to 4CL2, 4-coumarate-CoA ligase 2 (SMEL_006g261630.1.01), a gene involved in the CGA synthesis pathway in eggplant [82]. For the highly correlated traits chlorogenic acid peak area (CGA-Area) and phenolic acids pattern (TP-Pattern), we detected a QTL at the same position on chromosome 1, which was not previously reported and which is of great interest for eggplant breeding for bioactive phenolic acids content.

5. Conclusions

Overall, this work shows that introgressions of the phylogenetically distant S. elaeagnifolium in eggplant may be of interest for eggplant breeding, particularly for adaptation to low N conditions. These materials pave the way to the use of new exotic variation from a species that grows under low N conditions in its natural habitat for eggplant breeding. Together with the genomic information obtained from them, these materials can contribute to the development of new, dramatically improved eggplant varieties for a more sustainable agriculture. By means of selection and further backcrosses, eggplant introgression lines with improved agronomic characteristics and composition can be obtained, facilitating their incorporation in breeding pipelines.

Supplementary Materials

The following are available online at https://www.mdpi.com/article/10.3390/agronomy11091770/s1, Table S1. Mean values and standard error (SE) of the soil chemical composition before transplant. Table S2. Values of intake water chemical composition. Figure S1. Neighbor-joining dendrogram based on IBS distances of 56 individuals of advanced backcrosses (BC2 and BC3), individuals with introgressions from S. elaeagnifolium, and the recurrent parent (S. melongena). Figure S2. PCA loading plot (A) and score plot (B) evaluated in the present study based on the two first principal components of PCA. First and second components account for 40.1% and 14.7% of the total variation, respectively. The accessions are represented by different symbols according to the generation (BC2, BC3, and recurrent parent) and the gradient of color according to homozygous proportion from recurrent parent (1: dark purple to 0: yellow). The full name of each trait abbreviation can be found in Table 1.

Author Contributions

Conceptualization, J.P. and S.V.; methodology, G.V., E.R.-M. and A.Ş.; software, E.R.-M. and S.V.; validation, M.P., J.P. and S.V.; formal analysis, G.V., E.R.-M. and A.Ş.; investigation, G.V., E.R.-M., M.P., E.G.-F.; resources, E.G.-F. and J.P.; data curation, G.V., E.R.-M., A.Ş. and E.G.-F.; writing—original draft preparation, G.V.; writing—review and editing, E.R.-M., M.P., J.P. and S.V.; visualization, G.V., E.R.-M. and S.V.; supervision, M.P. and J.P.; project administration, J.P.; funding acquisition, J.P. All authors have read and agreed to the published version of the manuscript.

Funding

This research received no external funding.

Institutional Review Board Statement

Not applicable.

Informed Consent Statement

Not applicable.

Data Availability Statement

The data presented in this study are available on request from the corresponding author.

Acknowledgments

This work was supported by the project SOLNUE in the framework of the H2020 call SusCrop-ERA-Net (ID#47) and funded by Agencia Estatal de Investigación (PCI2019-103375) and by the Ministerio de Ciencia, Innovación y Universidades, Agencia Estatal de Investigación and Fondo Europeo de Desarrollo Regional (grant RTI2018-094592-B-I00 from MCIU/AEI/ FEDER, UE). The Spanish Ministerio de Ciencia e Innovación, Agencia Estatal de Investigación, and Fondo Social Europeo funded a predoctoral fellowship to Gloria Villanueva (PRE2019-103375). The Spanish Ministerio de Economía y Competitividad, Agencia Estatal de Investigación, and Fondo Social Europeo funded a predoctoral fellowship to Elena Rosa-Martínez (BES-2016-077482) and a postdoctoral fellowship to Mariola Plazas (IJC2019-039091-I).

Conflicts of Interest

The authors declare that they have no known competing financial interests or personal relationships that could have appeared to influence the work reported in this paper.

References

  1. Marschner, P.; Rengel, Z. Nutrient availability in soils. In Marschner’s Mineral Nutrition of Higher Plants, 3rd ed.; Elsevier Ltd.: Amsterdam, The Netherlands, 2011; pp. 315–330. ISBN 9780123849052. [Google Scholar]
  2. Xu, G.; Fan, X.; Miller, A.J. Plant nitrogen assimilation and use efficiency. Annu. Rev. Plant. Biol. 2012, 63, 153–182. [Google Scholar] [CrossRef] [Green Version]
  3. Albornoz, F. Crop responses to nitrogen overfertilization: A review. Sci. Hortic. 2016, 205, 79–83. [Google Scholar] [CrossRef]
  4. Zhang, X.; Davidson, E.A.; Mauzerall, D.L.; Searchinger, T.D.; Dumas, P.; Shen, Y. Managing nitrogen for sustainable development. Nature 2015, 528, 51–59. [Google Scholar] [CrossRef] [Green Version]
  5. Sharma, L.K.; Bali, S.K. A review of methods to improve nitrogen use efficiency in agriculture. Sustainability 2017, 10, 51. [Google Scholar] [CrossRef] [Green Version]
  6. Dempewolf, H.; Baute, G.; Anderson, J.; Kilian, B.; Smith, C.; Guarino, L. Past and future use of wild relatives in crop breeding. Crop. Sci. 2017, 57, 1070–1082. [Google Scholar] [CrossRef]
  7. Gao, Z.; Wang, Y.; Chen, G.; Zhang, A.; Yang, S.; Shang, L.; Wang, D.; Ruan, B.; Liu, C.; Jiang, H.; et al. The indica nitrate reductase gene OsNR2 allele enhances rice yield potential and nitrogen use efficiency. Nat. Commun. 2019, 10, 5207. [Google Scholar] [CrossRef]
  8. Prohens, J.; Gramazio, P.; Plazas, M.; Dempewolf, H.; Kilian, B.; Díez, M.J.; Fita, A.; Herraiz, F.J.; Rodríguez-Burruezo, A.; Soler, S.; et al. Introgressiomics: A new approach for using crop wild relatives in breeding for adaptation to climate change. Euphytica 2017, 213, 158. [Google Scholar] [CrossRef]
  9. Knapp, S.; Vorontsova, M.S.; Prohens, J. Wild relatives of the eggplant (Solanum melongena L.: Solanaceae): New understanding of species names in a complex group. PLoS ONE 2013, 8, e57039. [Google Scholar] [CrossRef] [Green Version]
  10. Chapman, M.A. Eggplant breeding and improvement for future climates. In Genomic Designing of Climate-Smart Vegatable Crops; Springer: Berlin/Heidelberg, Germany, 2020; pp. 257–276. ISBN 9783319933818. [Google Scholar]
  11. FAO. FAOSTAT Database Collections 2019; FAO: Rome, Italy, 2019. [Google Scholar]
  12. Plazas, M.; Vilanova, S.; Gramazio, P.; Rodríguez-Burruezo, A.; Fita, A.; Herraiz, F.J.; Ranil, R.; Fonseka, R.; Niran, L.; Fonseka, H.; et al. Interspecific hybridization between eggplant and wild relatives from different genepools. J. Am. Soc. Hortic. Sci. 2016, 141, 34–44. [Google Scholar] [CrossRef] [Green Version]
  13. Rotino, G.L.; Sala, T.; Toppino, L. Eggplant. In Alien Gene Transfer in Crop Plants; Springer: Berlin/Heidelberg, Germany, 2014; Volume 2, ISBN 978-1-4614-9571-0. [Google Scholar]
  14. Taher, D.; Solberg, S.Ø.; Prohens, J.; Chou, Y.; Rakha, M.; Wu, T. World Vegetable Center Eggplant Collection: Origin, Composition, Seed Dissemination and Utilization in Breeding. Front. Plant. Sci. 2017, 8, 1484. [Google Scholar] [CrossRef]
  15. García-Fortea, E.; Gramazio, P.; Vilanova, S.; Fita, A.; Mangino, G.; Villanueva, G.; Arrones, A.; Knapp, S.; Prohens, J.; Plazas, M. First successful backcrossing towards eggplant (Solanum melongena) of a New World species, the silverleaf nightshade (S. elaeagnifolium), and characterization of interspecific hybrids and backcrosses. Sci. Hortic. 2019, 246, 563–573. [Google Scholar] [CrossRef]
  16. Álvarez-Yépiz, J.C.; Martínez-Yrízar, A.; Búrquez, A.; Lindquist, C. Variation in vegetation structure and soil properties related to land use history of old-growth and secondary tropical dry forests in northwestern Mexico. For. Ecol. Manag. 2008, 256, 355–366. [Google Scholar] [CrossRef]
  17. Krigas, N.; Tsiafouli, M.A.; Katsoulis, G.; Votsi, N.; Kleunen, M. Van Investigating the Invasion Pattern of the Alien Plant Solanum. Plants 2021, 10, 805. [Google Scholar] [CrossRef]
  18. Knapp, S.; Sagona, E.; Carbonell, A.K.Z.; Chiarini, F. A revision of the Solanum elaeagnifolium clade (Elaeagnifolium clade; subgenus Leptostemonum, Solanaceae). PhytoKeys 2017, 84, 1–104. [Google Scholar] [CrossRef] [Green Version]
  19. Kaushik, P.; Gramazio, P.; Vilanova, S.; Raigón, M.D.; Prohens, J.; Plazas, M. Phenolics content, fruit flesh colour and browning in cultivated eggplant, wild relatives and interspecific hybrids and implications for fruit quality breeding. Food Res. Int. 2017, 102, 392–401. [Google Scholar] [CrossRef]
  20. Gramazio, P.; Prohens, J.; Plazas, M.; Mangino, G.; Herraiz, F.J.; García-Fortea, E.; Vilanova, S. Genomic tools for the enhancement of vegetable crops: A case in eggplant. Notulae Botanicae Horti Agrobotanici Cluj-Napoca 2018, 46, 1–13. [Google Scholar] [CrossRef] [Green Version]
  21. Barchi, L.; Pietrella, M.; Venturini, L.; Minio, A.; Toppino, L.; Acquadro, A.; Andolfo, G.; Aprea, G.; Avanzato, C.; Bassolino, L.; et al. A chromosome-anchored eggplant genome sequence reveals key events in Solanaceae evolution. Sci. Rep. 2019, 9, 11769. [Google Scholar] [CrossRef] [PubMed]
  22. Gramazio, P.; Yan, H.; Hasing, T.; Vilanova, S.; Prohens, J.; Bombarely, A. Whole-genome resequencing of seven eggplant (Solanum melongena) and one wild relative (S. incanum) accessions provides new insights and breeding tools for eggplant enhancement. Front. Plant. Sci. 2019, 10, 1220. [Google Scholar] [CrossRef]
  23. Hirakawa, H.; Shirasawa, K.; Miyatake, K.; Nunome, T.; Negoro, S.; Ohyama, A.; Yamaguchi, H.; Sato, S.; Isobe, S.; Tabata, S.; et al. Draft genome sequence of eggplant (Solanum melongena L.) the representative Solanum species indigenous to the old world. DNA Res. 2014, 21, 649–660. [Google Scholar] [CrossRef] [Green Version]
  24. Li, D.; Qian, J.; Li, W.; Yu, N.; Gan, G.; Jiang, Y.; Li, W.; Liang, X.; Chen, R.; Mo, Y.; et al. A high-quality genome assembly of the eggplant provides insights into the molecular basis of disease resistance and chlorogenic acid synthesis. Mol. Ecol. Resour. 2021, 21, 1274–1286. [Google Scholar] [CrossRef]
  25. Wei, Q.; Wang, J.; Wang, W.; Hu, T.; Hu, H.; Bao, C. A high-quality chromosome-level genome assembly reveals genetics for important traits in eggplant. Hortic. Res. 2020, 7, 153. [Google Scholar] [CrossRef]
  26. Barchi, L.; Acquadro, A.; Alonso, D.; Aprea, G.; Bassolino, L.; Demurtas, O.; Ferrante, P.; Gramazio, P.; Mini, P.; Portis, E.; et al. Single Primer Enrichment Technology (SPET) for high-throughput genotyping in tomato and eggplant germplasm. Front. Plant. Sci. 2019, 10, 1005. [Google Scholar] [CrossRef] [Green Version]
  27. Vilanova, S.; Alonso, D.; Gramazio, P.; Plazas, M.; García-Fortea, E.; Ferrante, P.; Schmidt, M.; Díez, M.J.; Usadel, B.; Giuliano, G.; et al. SILEX: A fast and inexpensive high-quality DNA extraction method suitable for multiple sequencing platforms and recalcitrant plant species. Plant. Methods 2020, 16, 110. [Google Scholar] [CrossRef]
  28. Bradbury, P.J.; Zhang, Z.; Kroon, D.E.; Casstevens, T.M.; Ramdoss, Y.; Buckler, E.S. TASSEL: Software for association mapping of complex traits in diverse samples. Bioinformatics 2007, 23, 2633–2635. [Google Scholar] [CrossRef] [PubMed]
  29. Van Reeuwijk, L. Procedures for Soil Analysis; International Soil Reference and Information Centre: Wageningen, The Netherlands, 2002; ISBN 90-6672-044-1. [Google Scholar]
  30. Yañez, J. Análisis de suelos y su interpretación. Hortic. Rev. Ind. Distrib. Y Socioecon. Hortícola Frutas Hortal. Flores Plantas Árboles Ornam. Y Viveros 1989, 49, 75–89. [Google Scholar]
  31. Moll, R.H.; Kamprath, E.J.; Jackson, W.A. Analysis and interpretation of factors which contribute to efficiency of nitrogen utilization 1. Agron. J. 1982, 74, 562–564. [Google Scholar] [CrossRef]
  32. Samonte, S.O.P.; Wilson, L.T.; Medley, J.C.; Pinson, S.R.M.; McClung, A.M.; Lales, J.S. Nitrogen utilization efficiency: Relationships with grain yield, grain protein, and yield-related traits in rice. Agron. J. 2006, 98, 168–176. [Google Scholar] [CrossRef] [Green Version]
  33. Gazulla, M.F.; Rodrigo, M.; Orduña, M.; Gómez, C.M. Determination of carbon, hydrogen, nitrogen and sulfur in geological materials using elemental analysers. Geostand. Geoanal. Res. 2012, 36, 201–217. [Google Scholar] [CrossRef]
  34. Singleton, V.L.; Rossi, J.A. Colorimetry of Total Phenolics with Phosphomolybdic-Phosphotungstic Acid Reagents. Am. J. Enol. Vitic. 1965, 16, 144–158. [Google Scholar]
  35. Helmja, K.; Vaher, M.; Püssa, T.; Raudsepp, P.; Kaljurand, M. Evaluation of antioxidative capability of the tomato (Solanum lycopersicum) skin constituents by capillary electrophoresis and high-performance liquid chromatography. Electrophoresis 2008, 29, 3980–3988. [Google Scholar] [CrossRef] [PubMed]
  36. Plazas, M.; Prohens, J.; Cuñat, A.N.; Vilanova, S.; Gramazio, P.; Herraiz, F.J.; Andújar, I. Reducing capacity, chlorogenic acid content and biological activity in a collection of scarlet (Solanum aethiopicum) and Gboma (S. macrocarpon) eggplants. Int. J. Mol. Sci. 2014, 15, 17221–17241. [Google Scholar] [CrossRef] [Green Version]
  37. Little, T.M.; Hills, F.J. Agricultural Experimentation: Desing and Analysis; Wiley: Hoboken, NJ, USA, 1978; ISBN 0471023523. [Google Scholar]
  38. Wricke, G.; Weber, E. Quantitative Genetics and Selection in Plant Breeding; De Gruyter: Berlin, Germany, 1986; ISBN 978-3110075618. [Google Scholar]
  39. R Core Team. R: A Language and Environment for Statistical Computing 2020; R Core Team: Vienna, Austria, 2020. [Google Scholar]
  40. Wickham, H. ggplot2: Elegant Graphics for Data Analysis 2016; Taylor & Francis: Abingdon, UK, 2016. [Google Scholar]
  41. Hochberg, Y. A sharper bonferroni procedure for multiple tests of significance. Biometrika 1988, 75, 800–802. [Google Scholar] [CrossRef]
  42. Revelle, W. psych: Procedures for Personality and Phychological Research 2017; Northwestern University: Evanston, IL, USA, 2017. [Google Scholar]
  43. Wei, T.; Simko, V. R Package “Corrplot”: Visualization of a Correlation Matrix 2017; R Core Team: Vienna, Austria, 2017. [Google Scholar]
  44. Broman, K.W.; Wu, H.; Sen, S.; Churchill, G.A. R/qtl: QTL mapping in experimental crosses. Bioinformatics 2003, 19, 889–890. [Google Scholar] [CrossRef] [Green Version]
  45. Fernandez-Pozo, N.; Menda, N.; Edwards, J.D.; Saha, P.; Tecle, I.Y.; Strickler, S.R.; Bombarely, A.; Fisher-York, T.; Pujar, A.; Foerster, H.; et al. The Sol Genomics Network (SGN): From genotype to phenotype to breeding. Nucleic Acids Res. 2015, 43, D1036–D1041. [Google Scholar] [CrossRef]
  46. Van Bueren, E.T.L.; Struik, P.C. Diverse concepts of breeding for nitrogen use efficiency. A review. Agron. Sustain. Dev. 2017, 37, 50. [Google Scholar] [CrossRef] [Green Version]
  47. Han, M.; Okamoto, M.; Beatty, P.H.; Rothstein, S.J.; Good, A.G. The genetics of nitrogen use efficiency in crop plants. Annu. Rev. Genet. 2015, 49, 269–289. [Google Scholar] [CrossRef]
  48. Kurai, T.; Wakayama, M.; Abiko, T.; Yanagisawa, S.; Aoki, N.; Ohsugi, R. Introduction of the ZmDof1 gene into rice enhances carbon and nitrogen assimilation under low-nitrogen conditions. Plant. Biotechnol. J. 2011, 9, 826–837. [Google Scholar] [CrossRef] [PubMed]
  49. Yang, X.; Xia, X.; Zhang, Z.; Nong, B.; Zeng, Y. QTL mapping by whole genome re-sequencing and analysis of candidate genes for nitrogen use efficiency in rice. Front. Plant. Sci. 2017, 8, 1634. [Google Scholar] [CrossRef] [Green Version]
  50. Neeraja, C.N.; Voleti, S.R.; Subrahmanyam, D.; Surekha, K.; Rao, P.R. Breeding rice for nitrogen use efficiency. Indian Soc. Genet. Plant Breed. 2019, 79, 208–215. [Google Scholar] [CrossRef]
  51. Cormier, F.; Foulkers, J.; Hirel, B.; Gouache, D.; Moênne-Loccoz, Y.; Gouis, J. le Review Breeding for increased nitrogen-use efficiency: A review for wheat (T. aestivum L.). Plant Breed. 2016, 278, 255–278. [Google Scholar] [CrossRef] [Green Version]
  52. Lupini, A.; Preiti, G.; Badagliacca, G.; Abenavoli, M.R.; Sunseri, F.; Monti, M.; Bacchi, M. Nitrogen use efficiency in durum wheat under different nitrogen and water regimes in the mediterranean basin. Front. Plant Sci. 2021, 11, 607226. [Google Scholar] [CrossRef]
  53. Weber, V.S.; Melchinger, A.E.; Magorokosho, C.; Makumbi, D.; Bänziger, M.; Atlin, G.N. Efficiency of managed-stress screening of elite maize hybrids under drought and low nitrogen for yield under rainfed conditions in southern Africa. Crop. Sci. 2012, 52, 1011–1020. [Google Scholar] [CrossRef] [Green Version]
  54. Cai, H.; Chu, Q.; Yuan, L. Identification of quantitative trait loci for leaf area and chlorophyll content in maize (Zea mays) under low nitrogen and low phosphorus supply. Mol. Breed. 2012, 30, 251–266. [Google Scholar] [CrossRef]
  55. Semagn, K.; Beyene, Y.; Babu, R.; Nair, S.; Gowda, M.; Das, B.; Tarekegne, A.; Mugo, S.; Mahuku, G.; Worku, M.; et al. Quantitative trait loci mapping andmolecular breeding for developing stress resilient maize for sub-saharan Africa. Crop. Sci. 2015, 1449–1459. [Google Scholar] [CrossRef]
  56. Ertiro, B.T.; Labuschagne, M.; Olsen, M.; Das, B.; Prasanna, B.M.; Gowda, M. Genetic dissection of nitrogen use efficiency in tropical maize through genome-wide association and genomic prediction. Front. Plant. Sci. 2020, 11, 474. [Google Scholar] [CrossRef]
  57. Rajala, A.; Jalli, M.; Jauhiainen, L.; Hannukkala, A. One century of Nordic barley breeding: Nitrogen use efficiency, agronomic traits and genetic diversity. J. Agric. Sci. 2017, 155, 582–598. [Google Scholar] [CrossRef]
  58. Pujarula, V.; Pusuluri, M.; Bollam, S.; Das, R.R.; Ratnala, R.; Adapala, G.; Thuraga, V.; Rathore, A. Genetic variation for nitrogen use efficiency traits in global diversity panel and parents of mapping populations in pearl millet. Front. Plant Sci. 2021, 12, 625915. [Google Scholar] [CrossRef]
  59. Stahl, A.; Vollrath, P.; Samans, B.; Frisch, M.; Wittkop, B.; Snowdon, R.J. Effect of breeding on nitrogen use efficiency-associated traits in oilseed rape. J. Exp. Bot. 2019, 70, 1969–1986. [Google Scholar] [CrossRef] [PubMed] [Green Version]
  60. Tiwari, J.K.; Plett, D.; Garnett, T.; Chakrabarti, S.K.; Singh, R.K. Integrated genomics, physiology and breeding approaches for improving nitrogen use efficiency in potato: Translating knowledge from other crops. Funct. Plant Biol. 2018, 45, 587–605. [Google Scholar] [CrossRef] [Green Version]
  61. Getahun, B.B. Potato breeding for nitrogen-use efficiency: Constraints, achievements, and future prospects. J. Crop Sci. Biotechnol. 2018, 21, 269–281. [Google Scholar] [CrossRef]
  62. Abenavoli, M.R.; Longo, C.; Lupini, A.; Miller, A.J.; Araniti, F.; Mercati, F.; Princi, M.P.; Sunseri, F. Phenotyping two tomato genotypes with different nitrogen use efficiency. Plant Physiol. Biochem. 2016, 107, 21–32. [Google Scholar] [CrossRef] [PubMed]
  63. Lupini, A.; Princi, M.P.; Araniti, F.; Miller, A.J.; Sunseri, F.; Abenavoli, M.R. Physiological and molecular responses in tomato under different forms of N nutrition. J. Plant Physiol. 2017, 216, 17–25. [Google Scholar] [CrossRef]
  64. Liang, L.; Ridoutt, B.G.; Lal, R.; Wang, D.; Wu, W.; Peng, P.; Hang, S.; Wang, L.; Zhao, G. Nitrogen footprint and nitrogen use efficiency of greenhouse tomato production in North China. J. Clean. Prod. 2019, 208, 285–296. [Google Scholar] [CrossRef]
  65. Mauceri, A.; Bassolino, L.; Lupini, A.; Badeck, F.; Rizza, F.; Schiavi, M.; Toppino, L.; Abenavoli, M.R.; Rotino, G.L.; Sunseri, F. Genetic variation in eggplant for Nitrogen Use Efficiency under contrasting NO3- supply. J. Integr. Plant Biol. 2020, 62, 487–508. [Google Scholar] [CrossRef] [Green Version]
  66. Mauceri, A.; Rosa Abenavoli, M.; Toppino, L.; Panda, S.; Mercati, F.; Miyassa Aci, M.; Aharoni, A.; Sunseri, F.; Rotino, G.L.; Lupini, A. Transcriptomic insights on molecular regulation of Solanum melongena L. N-Use Efficiency. J. Exp. Bot. 2021, erab121. [Google Scholar] [CrossRef]
  67. Syfert, M.M.; Castañeda-Álvarez, N.P.; Khoury, C.K.; Särkinen, T.; Sosa, C.C.; Achicanoy, H.A.; Bernau, V.; Prohens, J.; Daunay, M.-C.; Knapp, S. Crop wild relatives of the brinjal eggplant (Solanum melongena): Poorly represented in genebanks and many species at risk of extinction. Am. J. Bot. 2016, 103, 635–651. [Google Scholar] [CrossRef] [Green Version]
  68. Baixauli, C.; Aguilar, J. Cultivo Sin Suelo de Hortalizas: Aspectos Prácticos y Experiencias; Generalitat Valenciana: Valencia, Spain, 2002; ISBN 8448231457. [Google Scholar]
  69. Diouf, I.A.; Derivot, L.; Bitton, F.; Pascual, L.; Causse, M. Water deficit and salinity stress reveal many specific QTL for plant growth and fruit quality traits in tomato. Front. Plant Sci. 2018, 9, 279. [Google Scholar] [CrossRef] [Green Version]
  70. Asins, M.J.; Raga, M.V.; Torrent, D.; Roca, D.; Carbonell, E.A. QTL and candidate gene analyses of rootstock-mediated tomato fruit yield and quality traits under low iron stress. Euphytica 2020, 216, 1–19. [Google Scholar] [CrossRef]
  71. Särkinen, T.; Bohs, L.; Olmstead, R.G.; Knapp, S. A phylogenetic framework for evolutionary study of the nightshades (Solanaceae): A dated 1000-tip tree. BMC Evol. Biol. 2013, 13, 214. [Google Scholar] [CrossRef] [Green Version]
  72. Prohens, J.; Plazas, M.; Raigón, M.D.; Simarro, J.M.S.; Stommel, J.R.; Vilanova, S. Characterization of interspecific hybrids and first backcross generations from crosses between two cultivated eggplants (Solanum melongena and S. aethiopicum Kumba group) and implications for eggplant breeding. Euphytica 2012, 186, 517–538. [Google Scholar] [CrossRef]
  73. Meyer, R.S.; Whitaker, B.D.; Little, D.P.; Wu, S.B.; Kennelly, E.J.; Long, C.L.; Litt, A. Parallel reductions in phenolic constituents resulting from the domestication of eggplant. Phytochemistry 2015, 115, 194–206. [Google Scholar] [CrossRef]
  74. Stommel, J.R.; Whitaker, B.D. Phenolic Acid Content and composition of eggplant fruit in a germplasm core subset. J. Am. Soc. Hort. Sci. 2003, 128, 704–710. [Google Scholar] [CrossRef]
  75. Mangino, G.; Plazas, M.; Vilanova, S.; Prohens, J.; Gramazio, P. Performance of a set of eggplant (Solanum melongena) lines with introgressions from its wild relative S. incanum under open field and screenhouse conditions and detection of QTLs. Agronomy 2020, 10, 467. [Google Scholar] [CrossRef] [Green Version]
  76. Frary, A.; Frary, A.; Daunay, M.-C.; Huvenaars, K.; Mank, R.; Doğanlar, S. QTL hotspots in eggplant (Solanum melongena) detected with a high resolution map and CIM analysis. Euphytica 2014, 197, 211–228. [Google Scholar] [CrossRef] [Green Version]
  77. Portis, E.; Cericola, F.; Barchi, L.; Toppino, L.; Acciarri, N.; Pulcini, L.; Sala, T.; Lanteri, S.; Rotino, G.L. Association mapping for fruit, plant and leaf morphology traits in eggplant. PLoS ONE 2015, 10, e0135200. [Google Scholar] [CrossRef] [PubMed] [Green Version]
  78. Plazas, M.; López-Gresa, M.P.; Vilanova, S.; Torres, C.; Hurtado, M.; Gramazio, P.; Andújar, I.; Herráiz, F.J.; Bellés, J.M.; Prohens, J. Diversity and relationships in key traits for functional and apparent quality in a collection of eggplant: Fruit phenolics content, antioxidant activity, polyphenol oxidase activity, and browning. J. Agric. Food Chem. 2013, 61, 8871–8879. [Google Scholar] [CrossRef] [PubMed]
  79. Hanson, P.M.; Yang, R.Y.; Tsou, S.C.S.; Ledesma, D.; Engle, L.; Lee, T.C. Diversity in eggplant (Solanum melongena) for superoxide scavenging activity, total phenolics, and ascorbic acid. J. Food Compos. Anal. 2006, 19, 594–600. [Google Scholar] [CrossRef]
  80. Chapman, M.A. (Ed.) The Eggplant Genome; Springer: Berlin/Heidelberg, Germany, 2019; ISBN 9783319992075. [Google Scholar]
  81. Doganlar, S.; Frary, A.; Daunay, M.-C.; Lester, R.N.; Tanksley, S.D. Conservation of gene function in the Solanaceae as revealed by comparative mapping of domestication traits in eggplant. Genetics 2002, 161, 1713–1726. [Google Scholar] [CrossRef]
  82. Gramazio, P.; Prohens, J.; Plazas, M.; Andjar, I.; Herraiz, F.J.; Castillo, E.; Knapp, S.; Meyer, R.S.; Vilanova, S. Location of chlorogenic acid biosynthesis pathway and polyphenol oxidase genes in a new interspecific anchored linkage map of eggplant. BMC Plant Biol. 2014, 14, 350. [Google Scholar] [CrossRef] [PubMed] [Green Version]
  83. Portis, E.; Barchi, L.; Toppino, L.; Lanteri, S.; Acciarri, N.; Felicioni, N.; Fusari, F.; Barbierato, V.; Cericola, F.; Valè, G.; et al. QTL Mapping in Eggplant Reveals Clusters of Yield-Related Loci and Orthology with the Tomato Genome. PLoS ONE 2014, 9, e89499. [Google Scholar] [CrossRef] [Green Version]
  84. Miyatake, K.; Saito, T.; Nunome, T.; Yamaguchi, H.; Negoro, S.; Ohyama, A.; Wu, J.; Katayose, Y.; Fukuoka, H. Fine mapping of a major locus representing the lack of prickles in eggplant revealed the availability of a 0.5-kb insertion/deletion for marker-assisted selection. Breed. Sci. 2020, 70, 438–448. [Google Scholar] [CrossRef]
  85. Zhang, L.; Sun, H.; Xu, T.; Shi, T.; Li, Z.; Hou, W. Comparative transcriptome analysis reveals key genes and pathways involved in prickle development in eggplant. Genes 2021, 12, 341. [Google Scholar] [CrossRef] [PubMed]
  86. Mangino, G.; Vilanova, S.; Plazas, M.; Prohens, J.; Gramazio, P. Fruit shape morphometric analysis and QTL detection in a set of eggplant introgression lines. Sci. Hortic. 2021, 282, 110006. [Google Scholar] [CrossRef]
  87. Wei, Q.; Wang, W.; Hu, T.; Hu, H.; Wang, J.; Bao, C. Construction of a SNP-based genetic map using SLAF-Seq and QTL analysis of morphological traits in eggplant. Front. Genet. 2020, 11, 178. [Google Scholar] [CrossRef] [Green Version]
  88. Toppino, L.; Barchi, L.; Lo Scalzo, R.; Palazzolo, E.; Francese, G.; Fibiani, M.; D’Alessandro, A.; Papa, V.; Laudicina, V.A.; Sabatino, L.; et al. Mapping quantitative trait loci affecting biochemical and morphological fruit properties in eggplant (Solanum melongena L.). Front. Plant Sci. 2016, 7, 256. [Google Scholar] [CrossRef] [Green Version]
  89. Mouradov, A.; Spangenberg, G. Flavonoids: A metabolic network mediating plants adaptation to their real estate. Front. Plant Sci. 2014, 5, 620. [Google Scholar] [CrossRef]
  90. Günther, C.S.; Dare, A.P.; McGhie, T.K.; Deng, C.; Lafferty, D.J.; Plunkett, B.J.; Grierson, E.R.P.; Turner, J.L.; Jaakola, L.; Albert, N.W.; et al. Spatiotemporal modulation of flavonoid metabolism in blueberries. Front. Plant Sci. 2020, 11, 545. [Google Scholar] [CrossRef]
  91. Van der Rest, B.; Danoun, S.; Boudet, A.M.; Rochange, S.F. Down-regulation of cinnamoyl-CoA reductase in tomato (Solanum lycopersicum L.) induces dramatic changes in soluble phenolic pools. J. Exp. Bot. 2006, 57, 1399–1411. [Google Scholar] [CrossRef] [Green Version]
Figure 1. Graphical genotypes of 56 advanced backcross lines (ABs). The rows indicate ABs codes, and the columns indicate the chromosomes. The five first rows correspond to BC2 individuals, while the rest correspond to BC3 individuals. Introgressions of S. elaeagnifolium ELE2 in heterozygosis are depicted in red, and the genetic background of the recurrent parent (S. melongena MEL3) is depicted in blue.
Agronomy 11 01770 g001
Figure 2. Fruit size and morphology of fruits of parentals S. melongena (A) and S. elaeagnifolium (B) and of a representative set of different plants of advanced backcrosses (BC2 and BC3) (C). Scale in cm.
Agronomy 11 01770 g002
Figure 3. PCA loading plot (A) and score plot (B) on the two first principal components of PCA based on 24 plant, fruit, and composition traits of four individuals of S. melongena and 56 individuals of advanced backcrosses (five BC2 and 51 BC3) with S. elaeagnifolium introgressions. First and second components account for 33.0% and 16.2% of the total variation, respectively. The accessions are represented by different symbols according to the generation (BC2, BC3, and recurrent parent) and gradient of color according to homozygous proportion from recurrent parent of the 851 SNPs (1: dark purple to 0.6: yellow). The full name of each trait can be found in Table 1.
Agronomy 11 01770 g003
Figure 4. Pearson’s correlation among traits evaluated in the 56 individuals of advanced backcrosses (five BC2 and 51 BC3) of S. melongena with S. elaeagnifolium introgressions. Only traits for which there was at least a pairwise significant correlation at p < 0.05 according to the Bonferroni test are included in the figure. Correlation values include only those that are significant. Orange and purple colors correspond to negative and positive correlations, respectively. The full name of each trait can be found in Table 1.
Agronomy 11 01770 g004
Table 1. Plant, fruit, and composition traits evaluated in the S. melongena MEL3 recurrent parent, the S. elaeagnifolium ELE2 donor parent, and in the BC2 and the BC3 advanced backcrosses individuals, abbreviations used in tables and figures, and units in which they are expressed in the present study.
TraitAbbreviationUnits
Plant traits
SPADSPAD-
Plant heightP-Heightcm
Aerial biomassP-Biomasskg FW a
Stem diameterP-Diammm
Prickles in stemP-StPrick0 (absence); 1 (presence)
Prickles in leafP-LeafPrick0 (absence); 1 (presence)
YieldYieldg plant−1
Nitrogen Use EfficiencyNUE-
Fruit traits
Fruit pedicel lengthF-PedLengthmm
Fruit calyx lengthF-CaLengthmm
Fruit lengthF-Lengthmm
Fruit widthF-Widthmm
Prickles in calyxF-CalPrick0 (absence); 1 (presence)
Total number of fruits per plantF-Number-
Fruit mean weightF-Weightg
Composition traits
Nitrogen content in leafN-Leafg kg−1 DM b
Carbon content in leafC-Leafg kg−1 DM
Nitrogen content in fruitN-Fruitg kg−1 DM
Carbon content in fruitC-Fruitg kg−1 DM
Total phenolics contentTPCg kg−1 FW
Chlorogenic acid contentCGAg kg−1 FW
Total phenolic acid peaks areaTP-Areaunits
Chlorogenic acid peak areaCGA-Area%
Phenolic acids patternTP-Pattern0 (S. melongena pattern);
1 (S. elaeagnifolium pattern)
a FW: fresh weight. b DM: dry matter.
Table 2. Mean, range, and coefficient of variation (CV) of every trait analyzed for the donor parent (S. elaeagnifolium; n = 5), the recurrent parent (S. melongena; n = 4), the BC2 (n = 5) and the BC3 (n = 51) advanced backcrosses towards S. melongena, and the heritability (H2) of the trait in the advanced backcrosses. The full name of each trait in the first column can be found in Table 1. For each trait, means with different letters are significantly different according to the Student–Newman–Keuls multiple range test (p < 0.05).
TraitS. elaeagnifolium (n = 5)S. melongena (n = 4)BC2 (n = 5)BC3 (n = 51)H2
MeanRangeCV (%)MeanRangeCV (%)MeanRangeCV (%)MeanRangeCV (%)
Plant traits
SPAD63.7 b55.8–71.09.146.6 a44.0–47.93.944.2 a41.1–48.16.144.7 a37.0–56.99.00.79
P-Height (cm)58.8 a50.0–65.09.392.3 b79.0–107.012.8102.2 b90.0–130.016.385.4 b47.0–136.024.50.68
P-Biomass (kg FW)0.27 a0.16–0.4035.41.32 b0.85–2.0338.21.59 b0.51–3.8080.71.42 b0.18–4.9676.00.78
P-Diam (mm)10.5 a9.1–11.910.927.4 b19.3–35.425.426.3 b17.9–36.328.824.6 b11.0–46.230.90.15
P-StPrick1.0 b1.0–1.00.00.0 a0–00.00.4 a0–1136.90.2 a0–1234.11.00
P-LeafPrick0.00–00.00.00–00.00.20–1223.60.20–1234.11.00
Yield (g)52.9 a12.0–114.083.62891 b1925–402032.51258 b469.0–2941.079.42059 b124.0–8109.087.10.71
NUE10.3 a1.9–22.385.1325.8 b205.6–483.237.1200.5 b67.8–533.194.4272.7 b37.4–1019.382.30.70
Fruit traits
F-PedLength (mm)21.3 a20.5–22.54.158.2 c52.6–61.56.828.4 ab20.1–35.722.838.4 b17.2–63.730.80.89
F-CaLength (mm)12.2 a11.4–13.26.452.5 c49.2–56.75.929.8 b24.3–34.915.436.1 b20.2–52.623.80.87
F-Length (mm)10.3 a9.1–11.39.294.8 c86.4–101.16.654.0 b38.1–71.923.066.1 b24.5–113.229.90.90
F-Width (mm)10.1 a8.9–11.410.745.8 c41.8–53.912.029.9 b22.6–37.723.036.0 b18.9–50.519.60.42
F-CalPrick1.0 b1.0–1.00.00.0 a0.0–0.00.00.4 a0–1136.90.2 a0–1218.21.00
F-Number82.823.0–165.081.148.538.0–57.020.557.239.0–87.036.256.818.0–132.046.10.85
F-Weight (g)0.61 a0.46–0.8223.160.98 c33.77–77.7931.620.03 b11.44–33.846.533.35 b5.29–65.8847.50.57
Composition traits
N-Leaf (g/kg DM)45.0 a38.9–48.88.452.9 b49.4–54.74.553.1 b50.0–54.73.552.5 b45.0–58.25.30.24
C-Leaf (g/kg DM)439.8 a435.0–446.01.0443.3 a439.0–448.00.8446.0 a437.0–453.01.6455.5 b423.0–469.01.70.78
N-Fruit (g/kg DM)26.424.2–30.39.224.622.9–25.54.929.324.6–33.913.225.719.2–40.915.50.91
C-Fruit (g/kg DM)465.8 b461–4721.0428.3 a425–4300.5456.8 b438–4773.1435.7 a384–4793.70.98
TPC (g/kg FW)6.12 c4.1–7.4420.91.99 a1.7–2.3416.74.09 b3.62–5.013.42.76 a1.48–5.7530.80.86
CGA (g/kg FW)2.531.79–3.4122.81.781.61–2.0912.12.531.44–3.7432.52.271.02–5.0232.80.92
TP-Area (units)32,931 b31,290–34,8983.917,603 a15,639–20,41912.122,874 a19,472–28,81617.220,014 a11,517–32,80624.20.80
CGA-Area (%)31.4 a27.5–34.88.380.4 b76.7–81.51.067.8 b49.1–85.621.778.2 b49.1–88.411.70.99
TP-Pattern1.0 c1.0–1.00.00.0 a0.0–0.00.00.6 bc0–191.30.2 ab0–1192.61.00
Table 3. Traits for which putative QTLs were detected in advanced backcrosses of S. melongena with S. elaeagnifolium, QTL name, chromosome, and position (Mb) where they were located, S. elaeagnifolium heterozygous allelic effect (significant for all traits at p = 0.05 according to a t-test), and LOD score.
TraitQTLChr.Position (Mb.)Heterozygous Allelic Effect (Units)LOD Score
Plant traits
Stem diameter (P-Diam)pd4421.09–68.11−8.9 (mm)5.82
Prickles in stem (P-StPrick)ps66105.06–105.560.9111.10
Prickles in leaf (P-LeafPrick)pl66105.06–105.560.8233.08
Fruit traits
Fruit width (F-Width)fw770–0.52−9.5 (mm)6.12
Prickles in fruit calyx (F-CalPrick)pc66105.06–105.560.89447.96
Composition traits
Chlorogenic acid content (CGA)cg553.94–4.492.26 (g kg−1 DM)7.15
Total phenolic acid peaks area (TP-Area)ph6699.76–100.7851055.20
Chlorogenic acid peak area
(CGA-Area)
ca111.05–1.42−20.1 (%)19.13
Phenolic acids pattern
(TP-Pattern)
cp111.05–1.420.88416.14
Publisher’s Note: MDPI stays neutral with regard to jurisdictional claims in published maps and institutional affiliations.

