
Physical Attributes of Ferralsol in Fertigated Sugarcane Production Environments for Bioethanol in the Midwest of Brazil

 , , ,
, , ,  and
and
Abstract
:1. Introduction
2. Materials and Methods
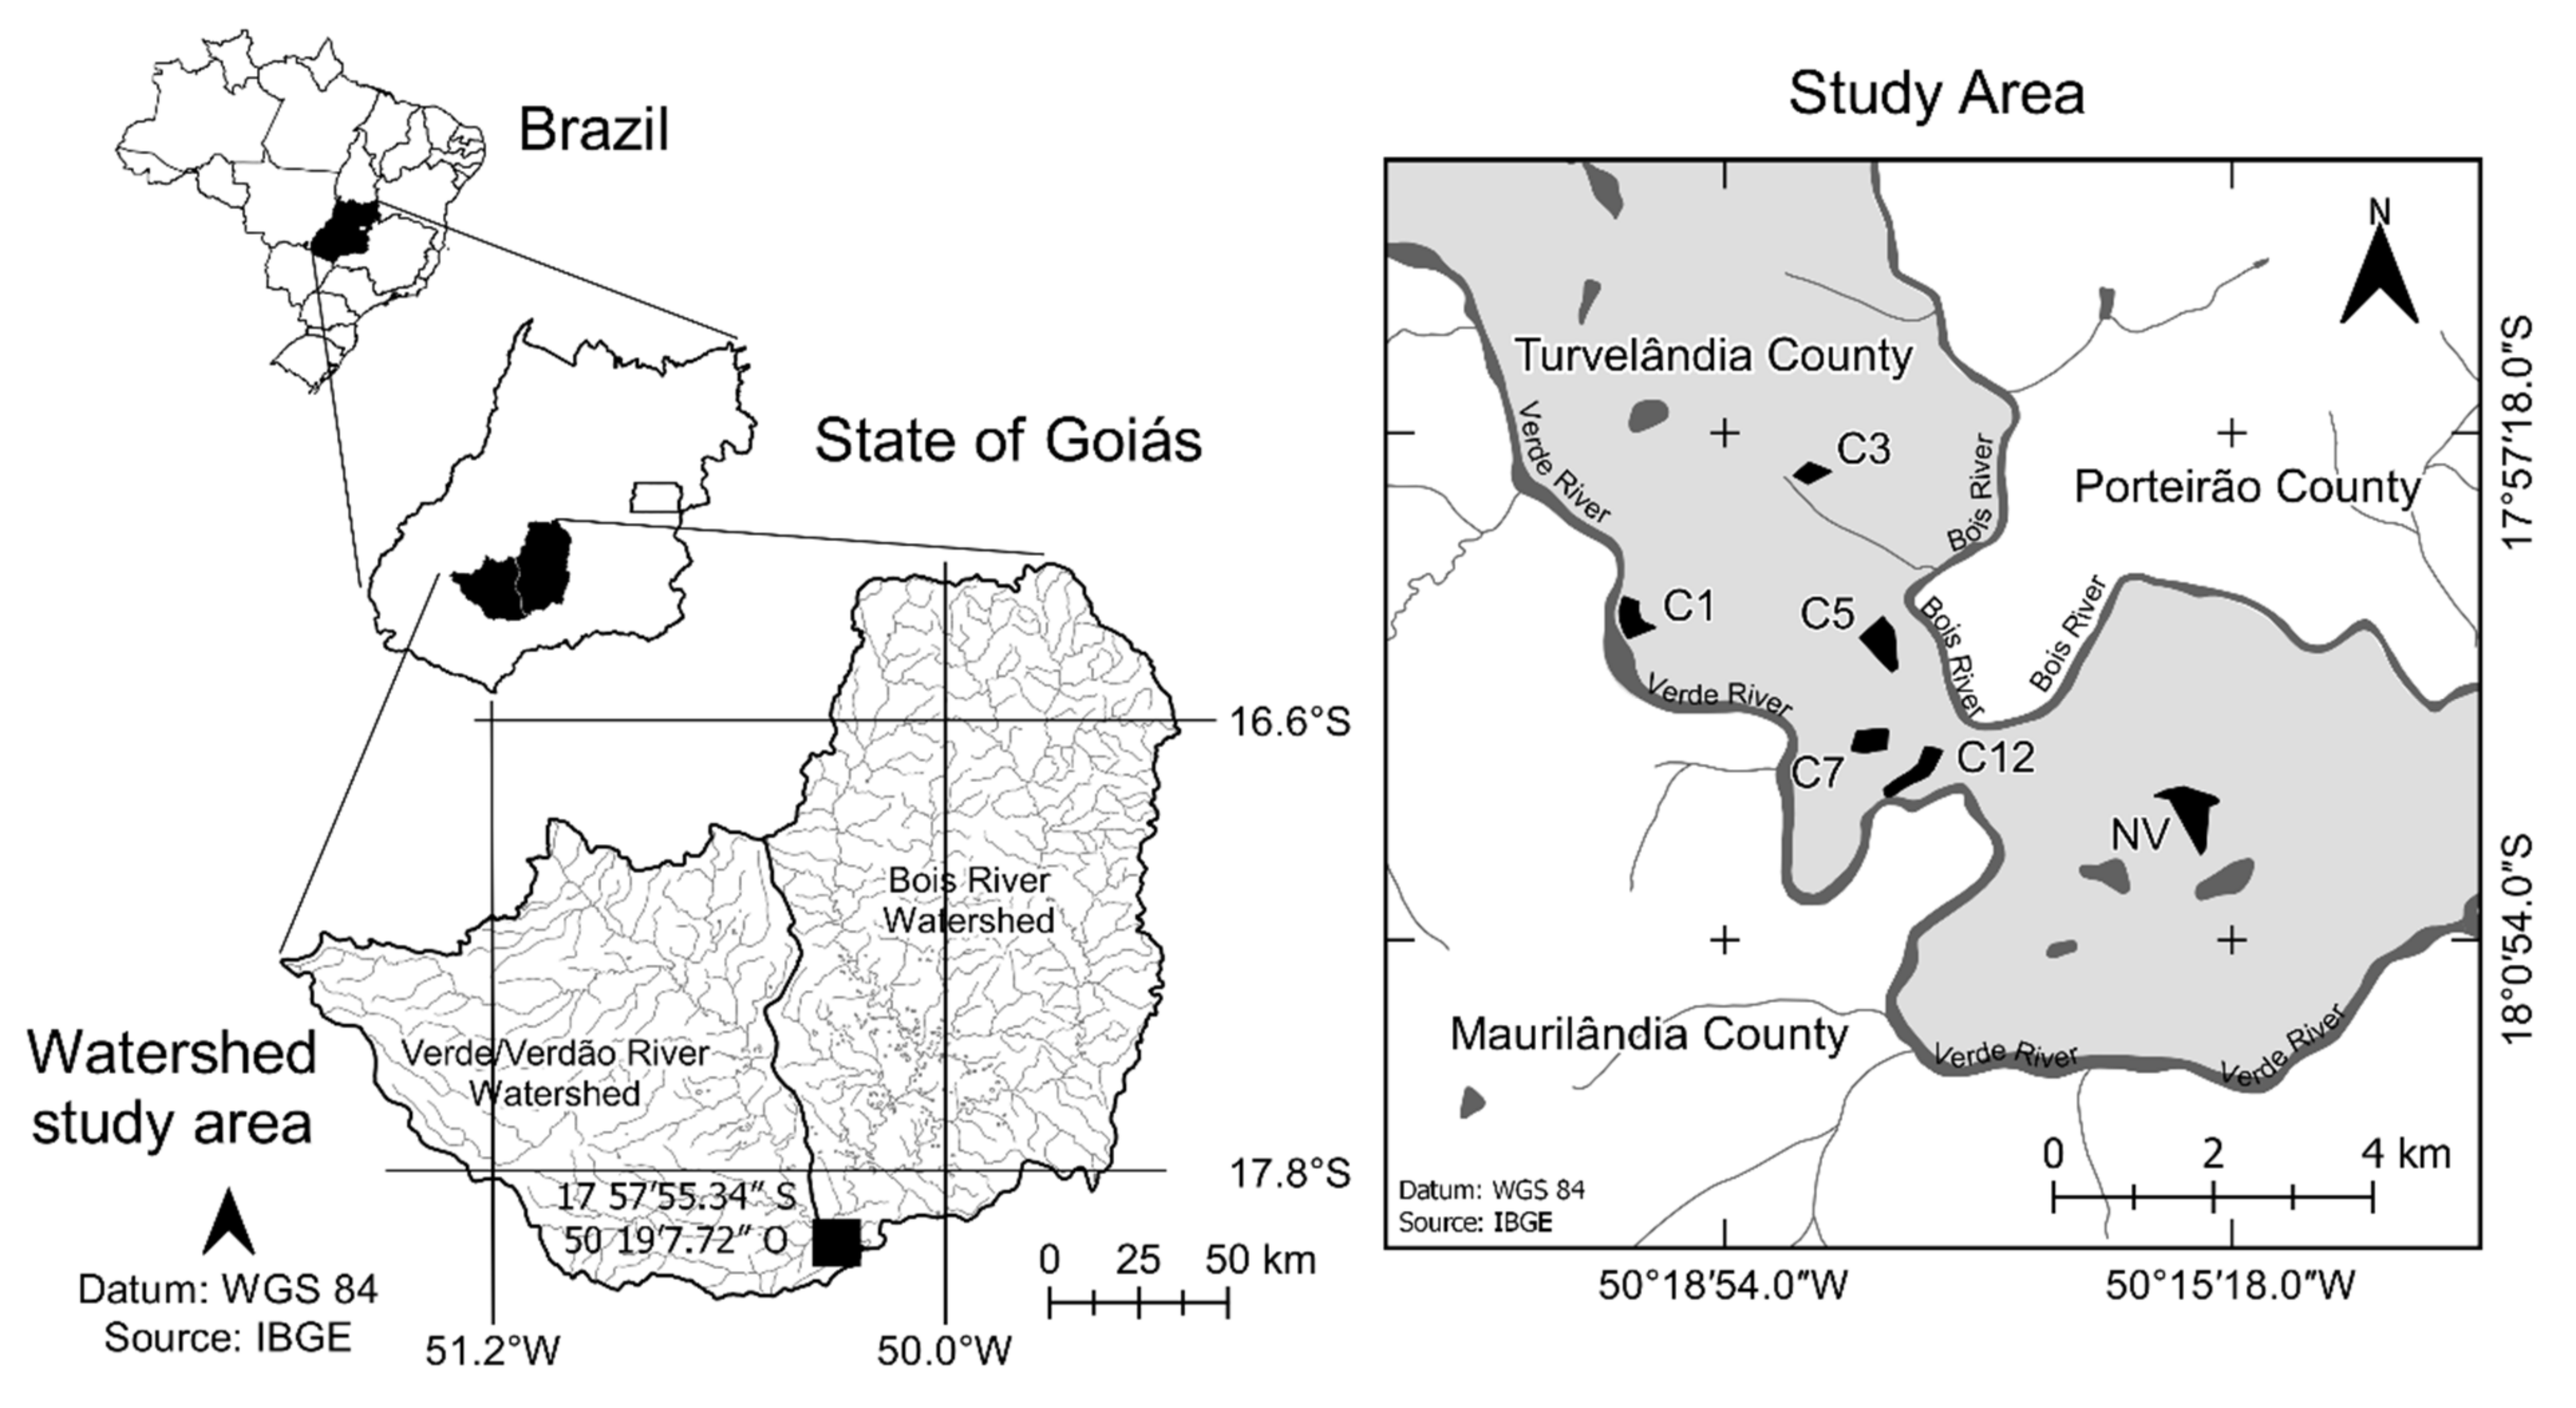
2.1. Experimental Area Description
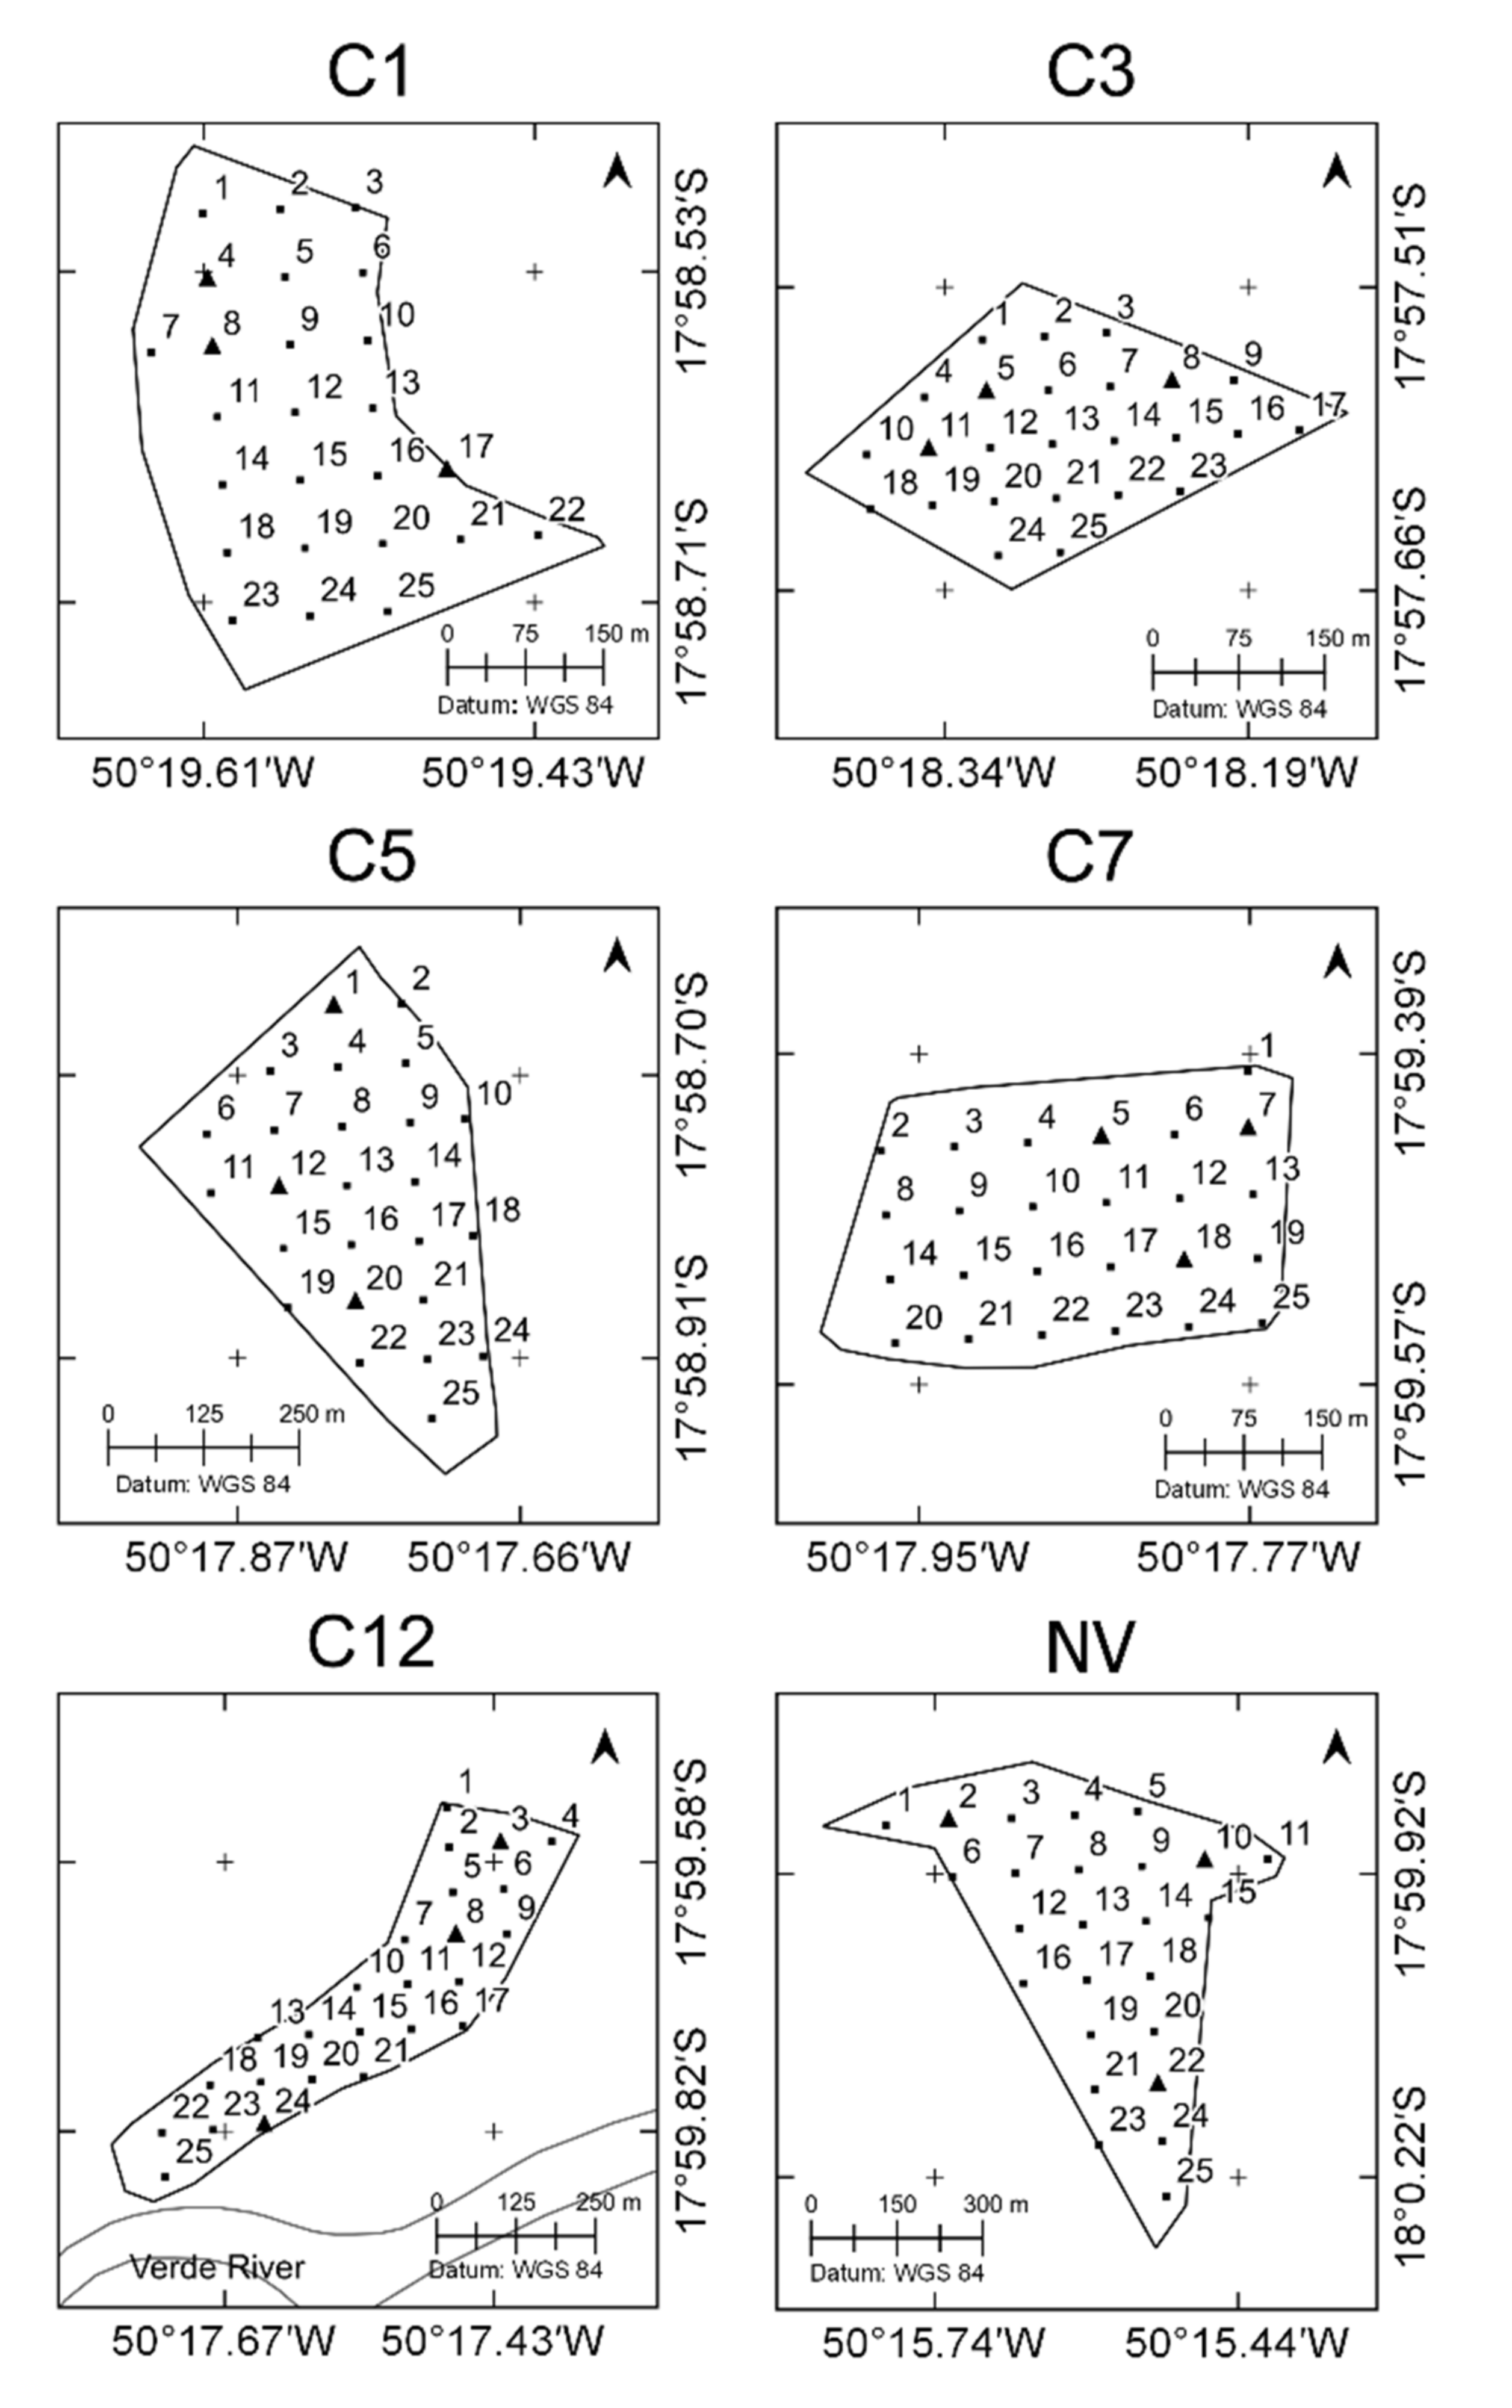
2.2. Soil Sampling
2.3. Laboratory Evaluations
2.4. Statistical Analysis
3. Results
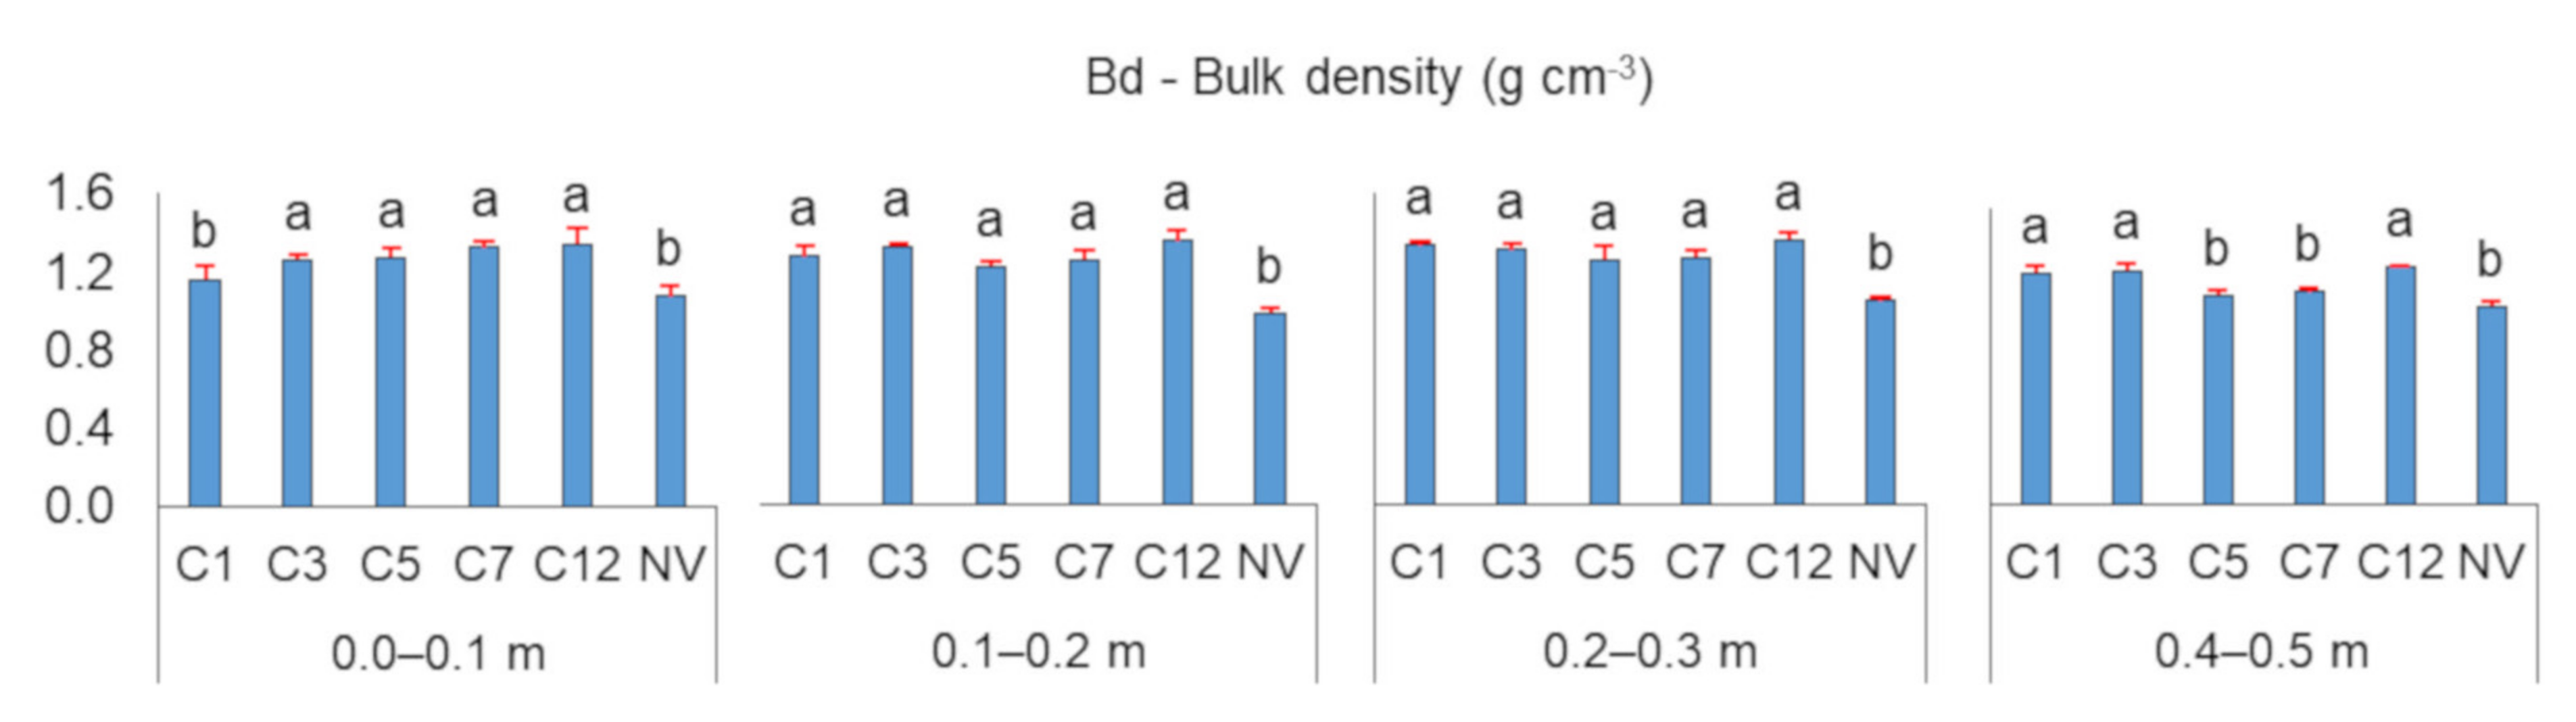
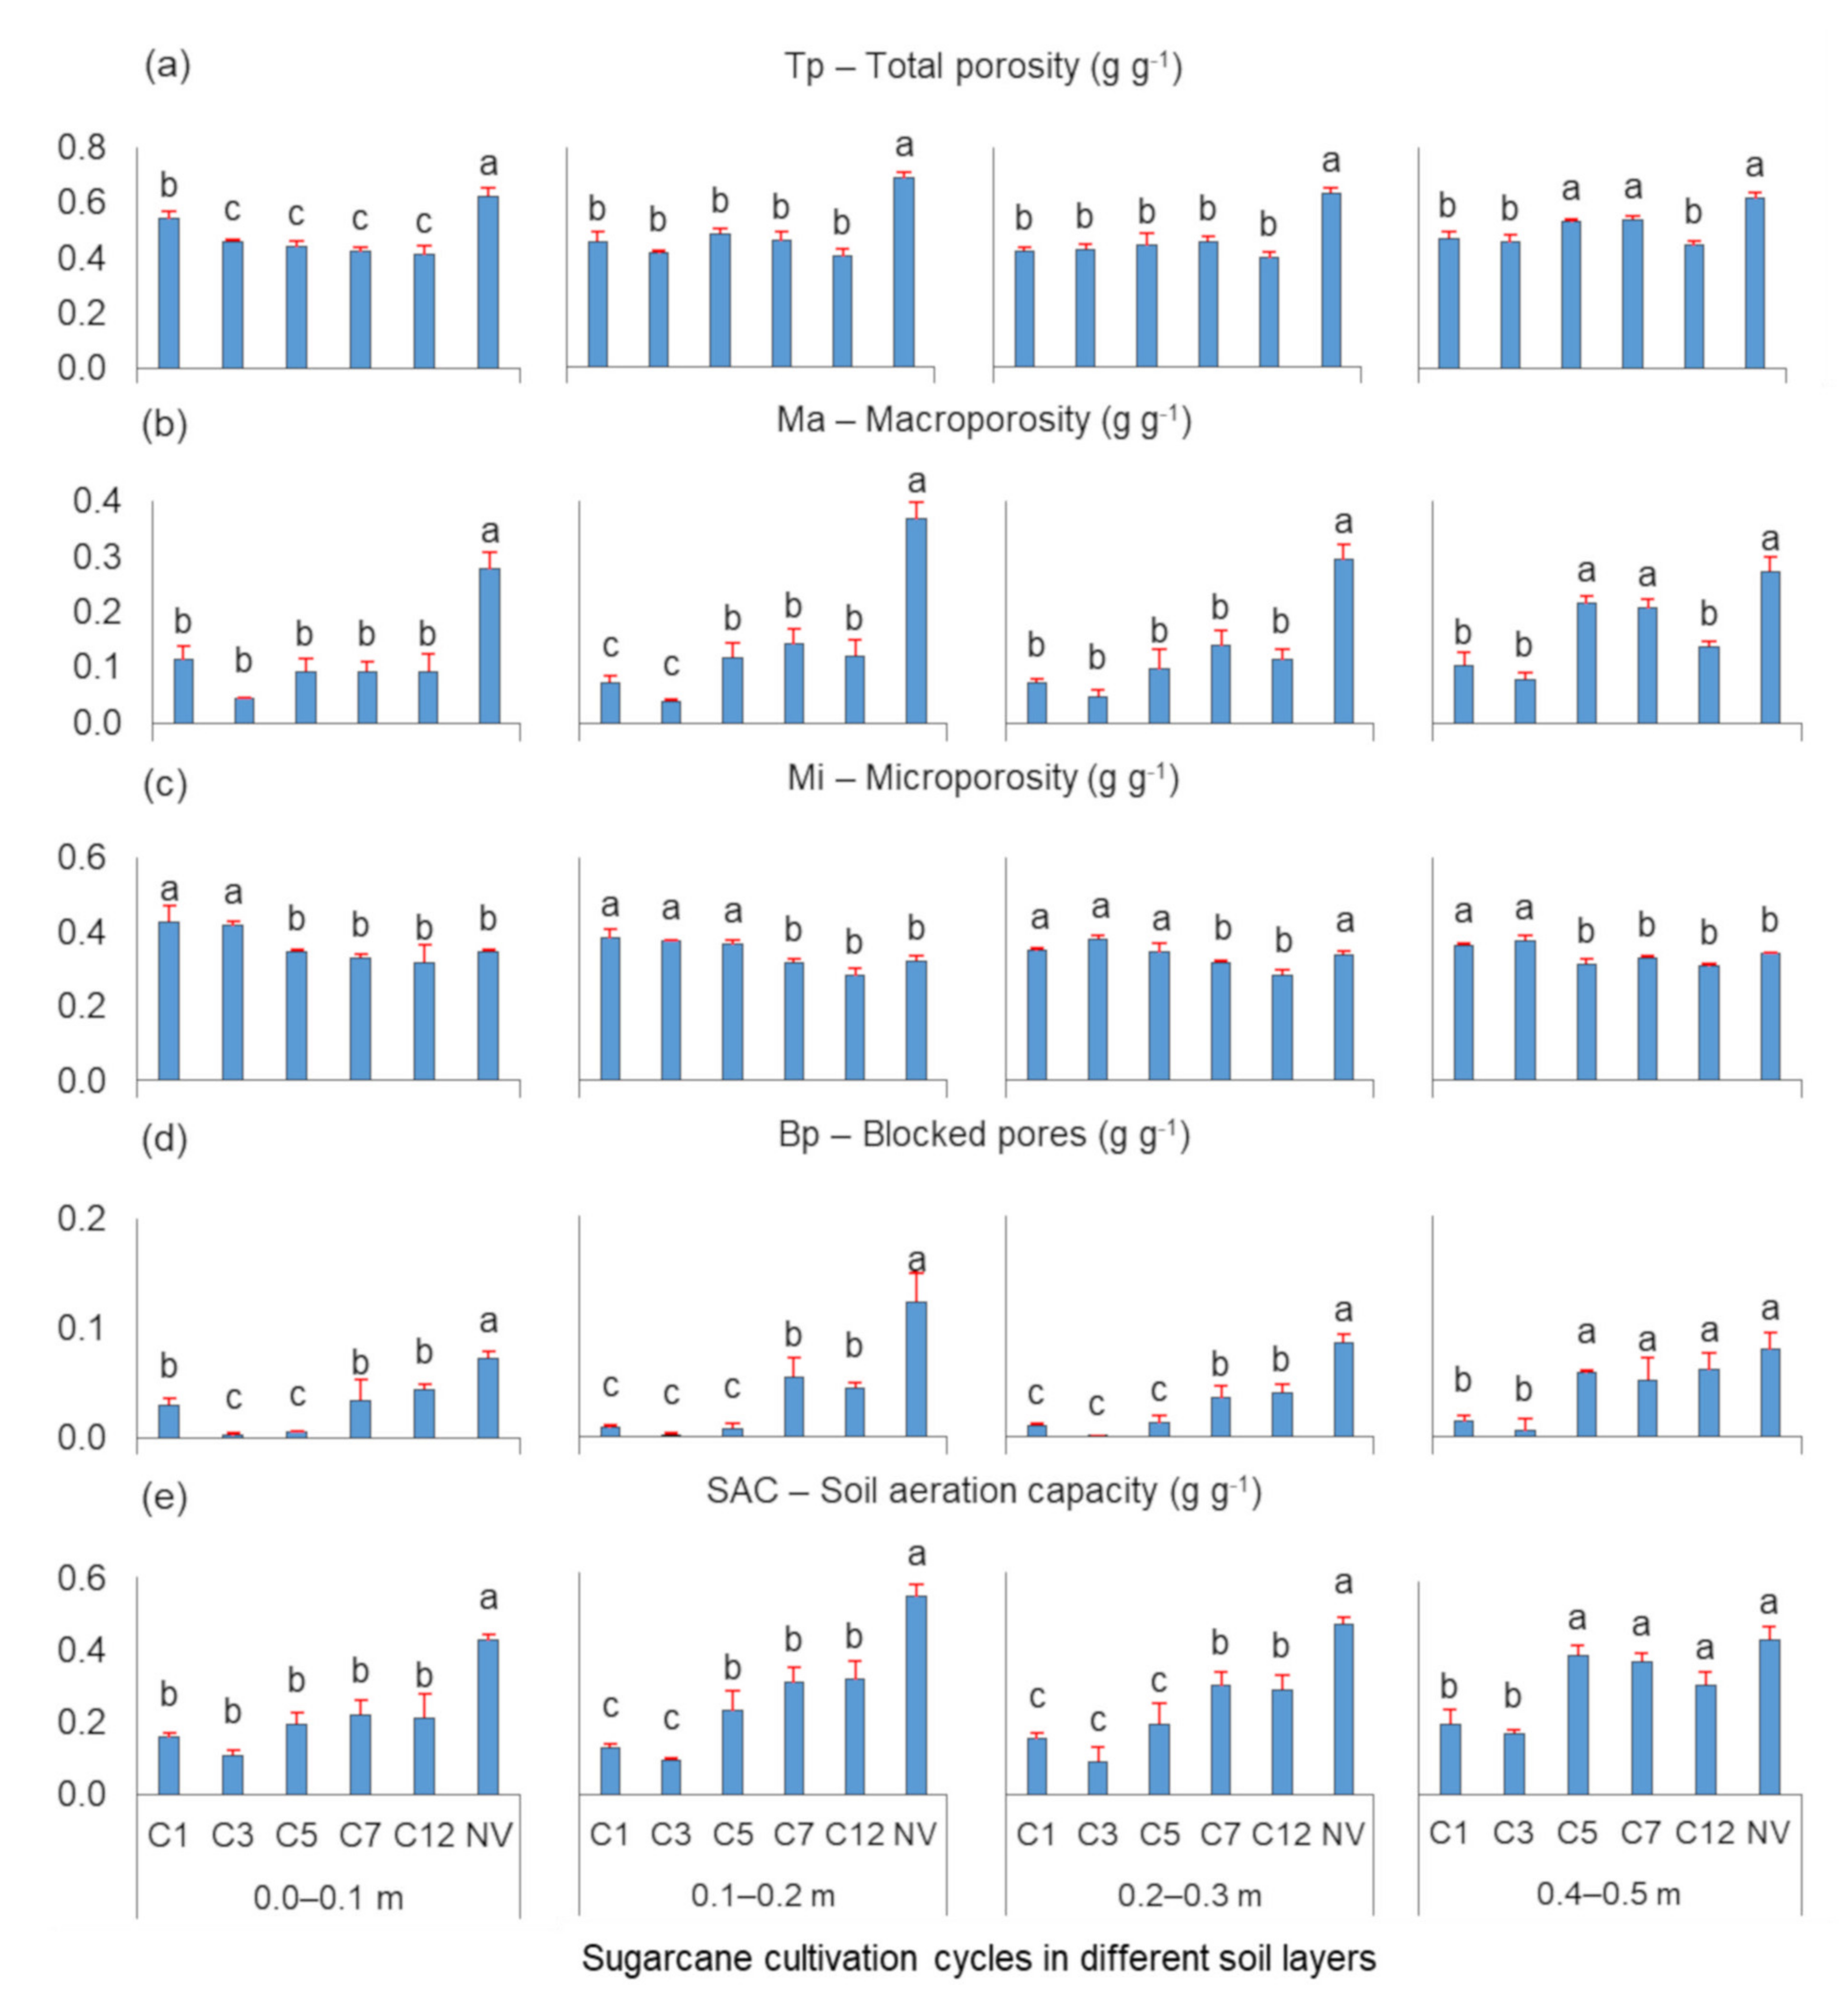
3.1. Soil Structure
3.2. Soil Aggregation and Organic Matter
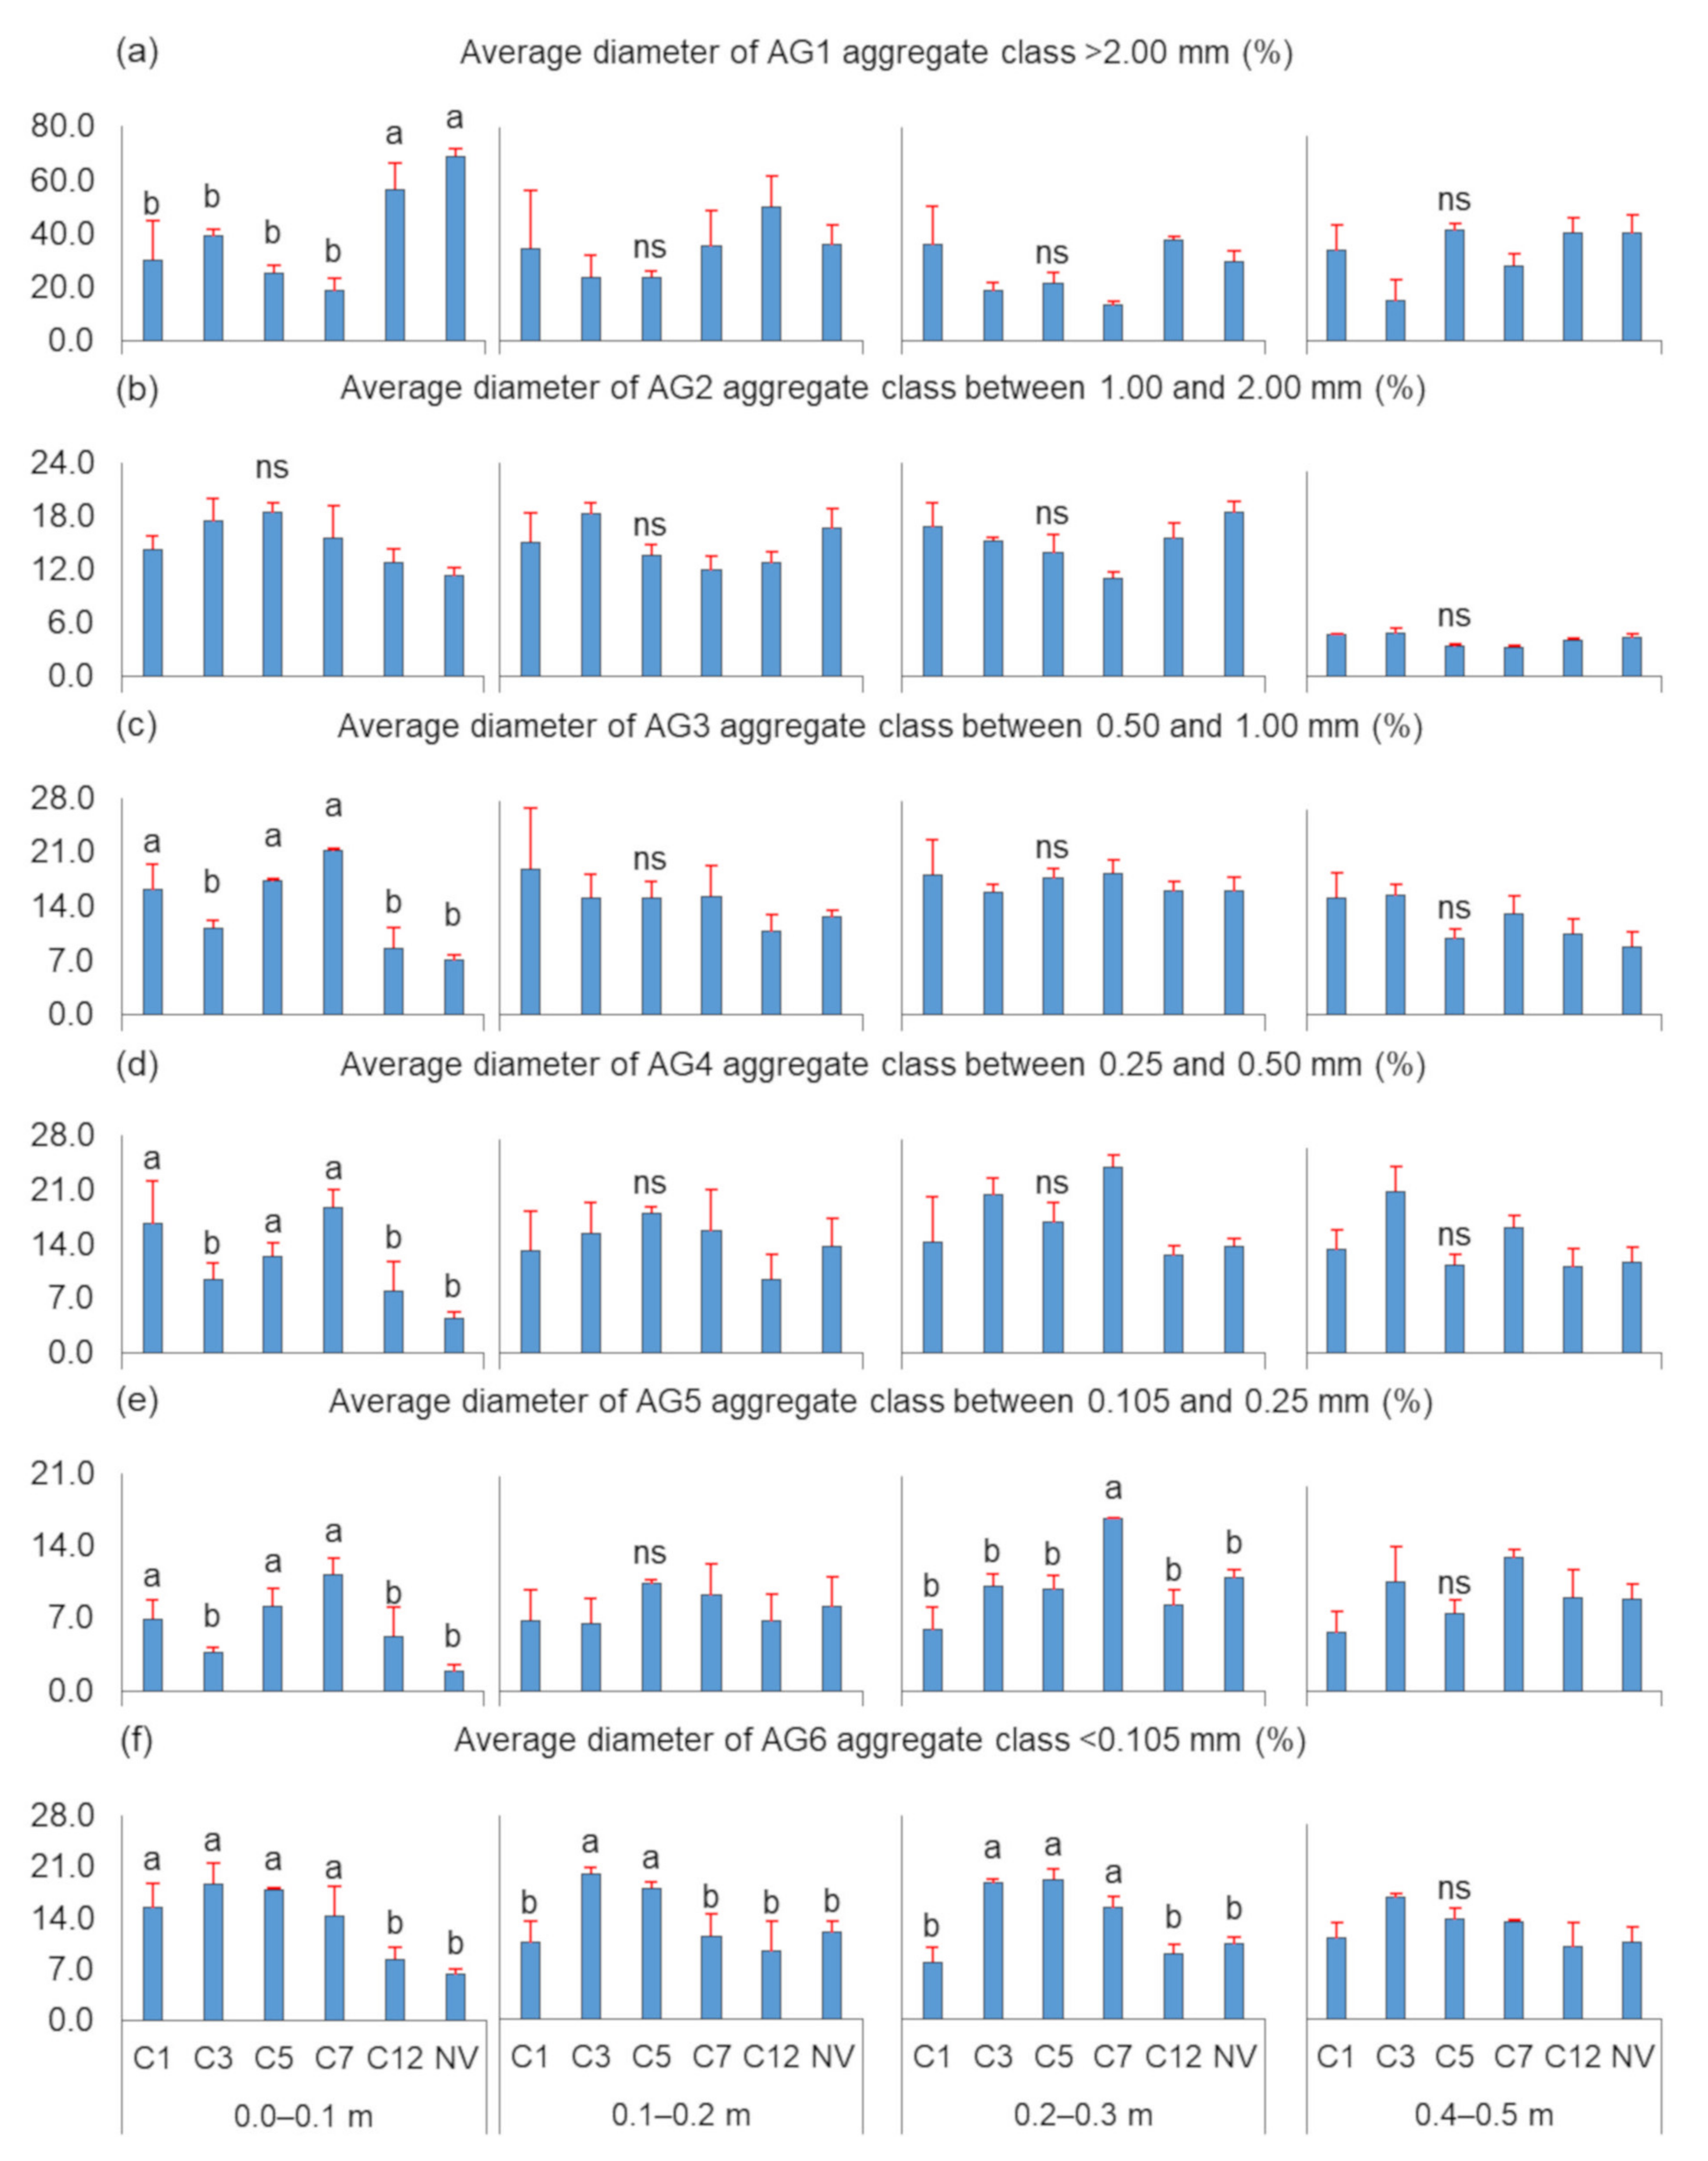
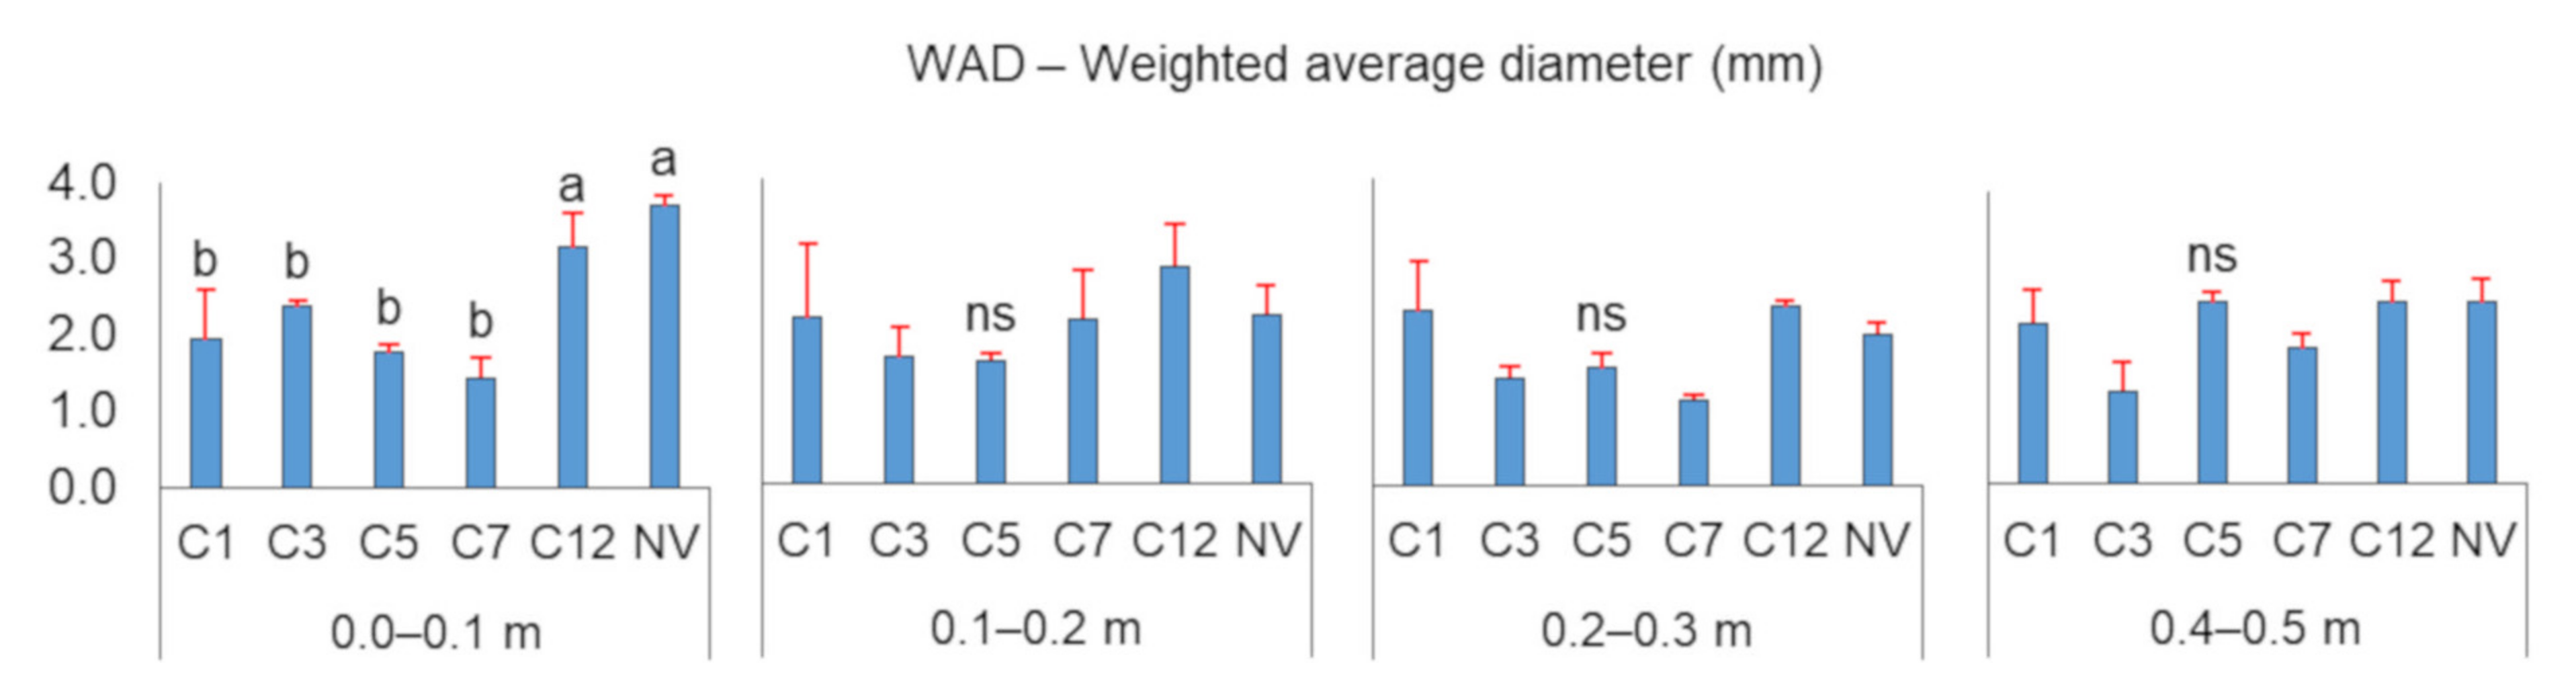
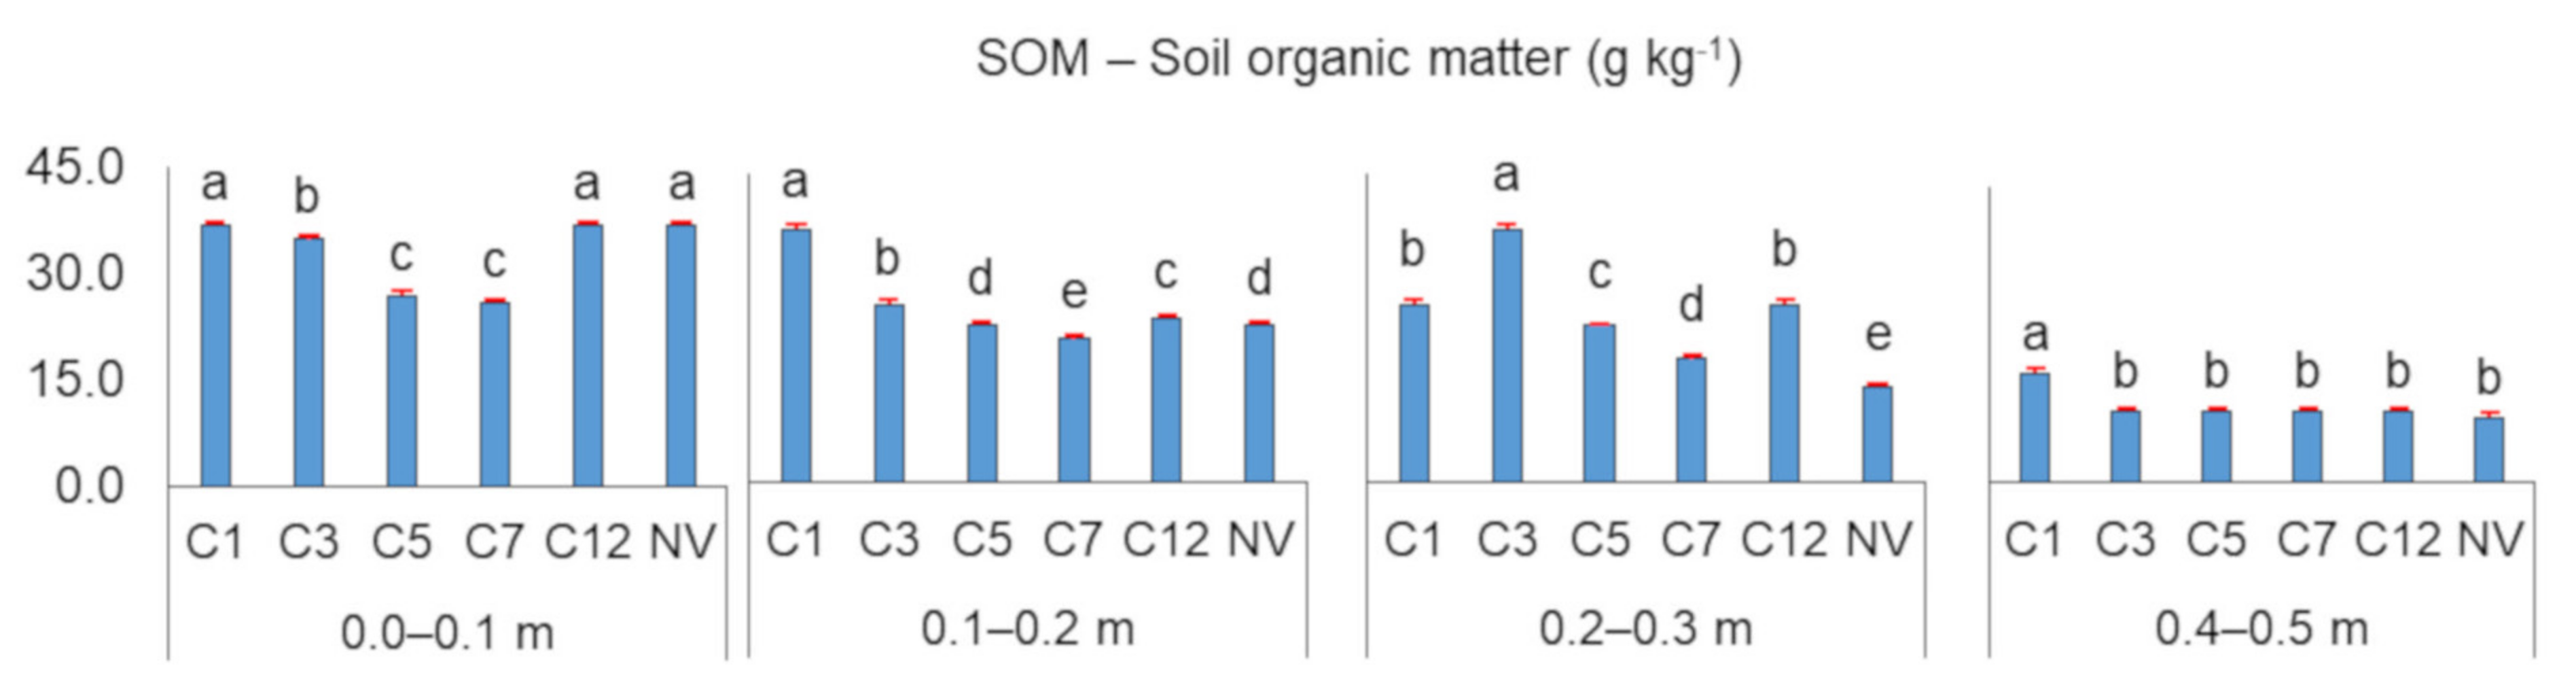
3.3. Structure, Aggregation and Organic Matter in Soil Layers
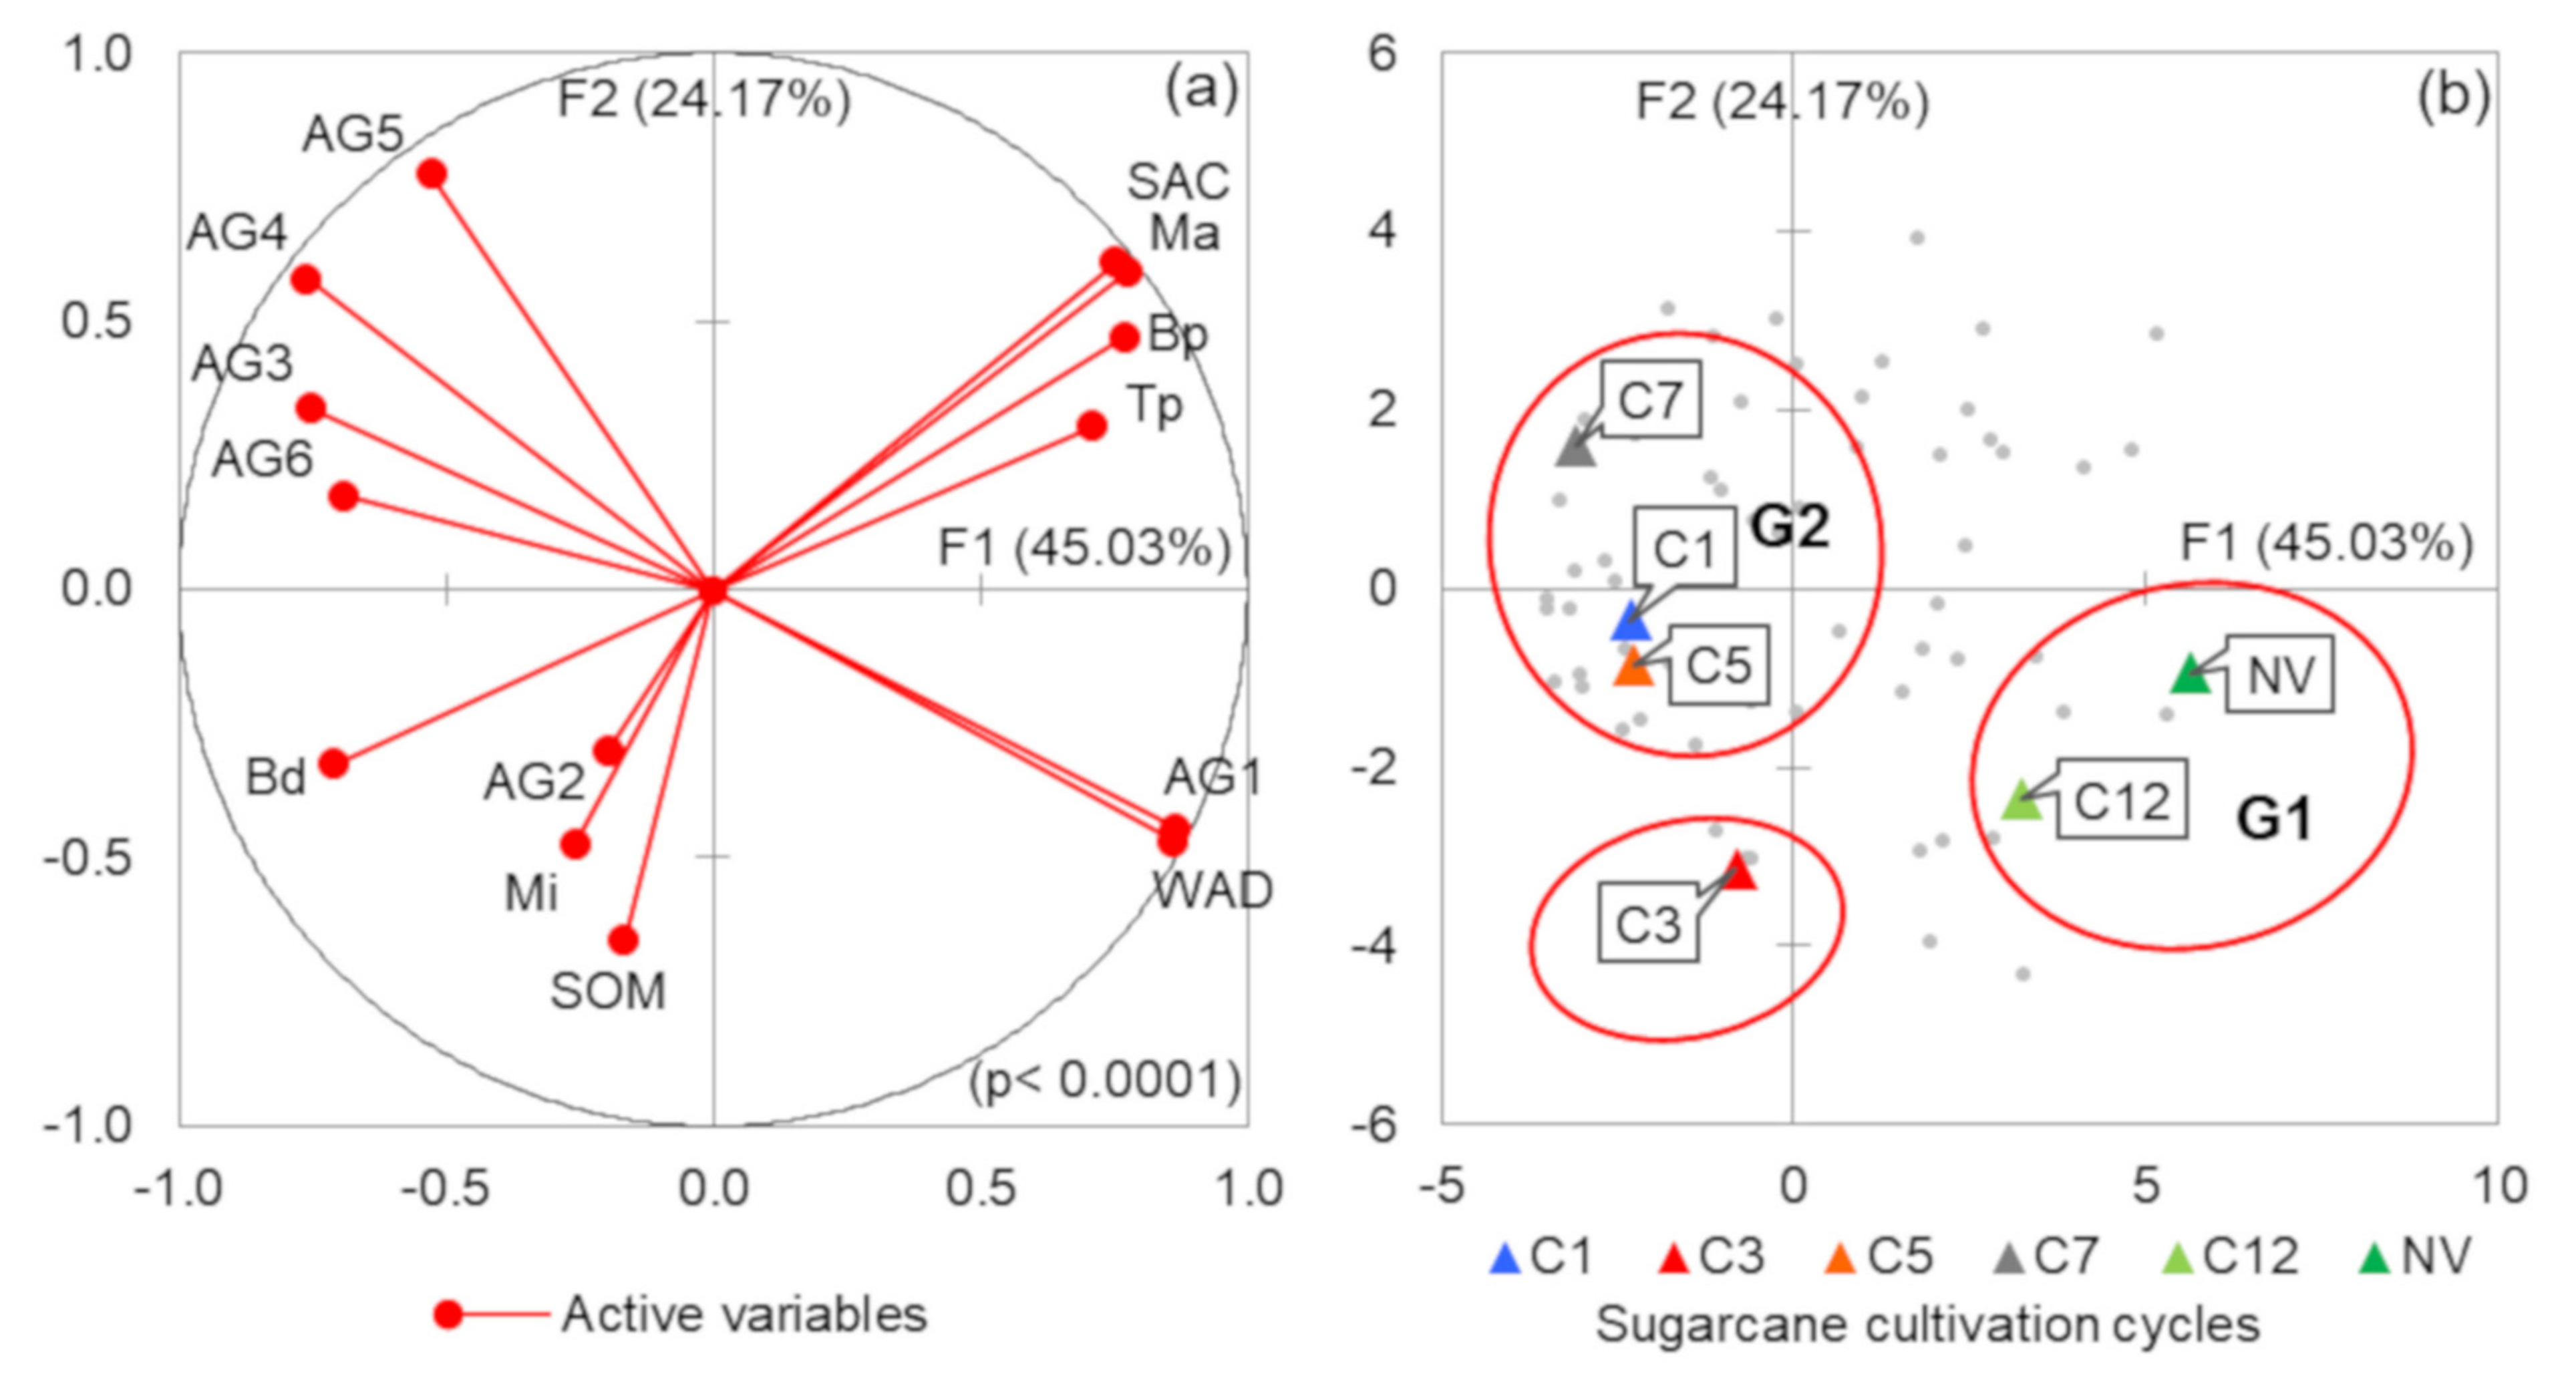
3.4. Principal Component Analysis
4. Discussion
5. Conclusions
Author Contributions
Funding
Institutional Review Board Statement
Informed Consent Statement
Data Availability Statement
Conflicts of Interest
References
- Wu, Q.; Zhou, W.; Chen, D.; Cai, A.; Ao, J.; Huang, Z. Optimizing soil and fertilizer phosphorus management according to the yield response and phosphorus use efficiency of sugarcane in Southern China. J. Soil Sci. Plant Nutr. 2020, 20, 1655–1664. [Google Scholar] [CrossRef]
- Andrade, A.F.; Flores, R.A.; Casaroli, D.; Bueno, A.M.; Pessoa-de-Souza, M.A.; Jardim, C.C.S.; Abdala, K.O.; Marques, E.P.; Mesquita, M. Biometric and Physiological Relationships and Yield of Sugarcane in Relation to Soil Application of Potassium. Sugar Tech 2021. [Google Scholar] [CrossRef]
- CONAB. Acompanhamento da Safra Brasileira-Cana-de-Açúcar; Companhia Nacional de Abastecimento, Ed.; CONAB: Brasília, Brazil, 2021; Volume 8. [Google Scholar]
- EPE. Analysis of Biofuels’ Current Outlook 2019; EPE: Timisoara, Romania, 2020; p. 79. [Google Scholar]
- Andrade, A.F.; Flores, R.A.; Casaroli, D.; Bueno, A.M.; Pessoa-de-Souza, M.A.; Lima, F.S.R.; Marques, E.P. K Dynamics in the Soil–Plant System for Sugarcane Crops: A Current Field Experiment Under Tropical Conditions. Sugar Tech 2021, 1–11. [Google Scholar] [CrossRef]
- Matsuoka, S.; Kennedy, A.J.; Santos, E.G.D.; Tomazela, A.L.; Rubio, L.C.S. Energy cane: Its concept, development, characteristics, and prospects. Adv. Bot. 2014, 2014, 1–13. [Google Scholar] [CrossRef] [Green Version]
- Ahorsu, R.; Medina, F.; Constantí, M. Significance and challenges of biomass as a suitable feedstock for bioenergy and biochemical production: A review. Energies 2018, 11, 3366. [Google Scholar] [CrossRef] [Green Version]
- Braunack, M.V.; Arvidsson, J.; Håkansson, I. Effect of harvest traffic position on soil conditions and sugarcane (Saccharum officinarum) response to environmental conditions in Queensland, Australia. Soil Tillage Res. 2006, 89, 103–121. [Google Scholar] [CrossRef]
- Centurion, J.F.; Freddi, O.S.; Aratani, R.G.; Metzner, A.F.M.; Beutler, A.M.; Andrioli, I. Influence of sugarcane cultivation and clay mineralogy in physical properties of Rhodic Oxisols. Rev. Bras. Ciência Solo 2007, 31, 199–209. [Google Scholar] [CrossRef]
- Roque, A.A.O.; Souza, Z.M.; Barbosa, R.S.; Souza, G.S. Agricultural traffic control and soil physical attributes in sugarcane areas. Pesqui. Agropecuária Bras. 2010, 45, 744–750. [Google Scholar] [CrossRef] [Green Version]
- Souza, G.S.; Souza, Z.M.; Silva, R.B.; Barbosa, R.S.; Araújo, F.S. Effects of traffic control on the soil physical quality and the cultivation of sugarcane. Rev. Bras. Ciência Solo 2014, 38, 135–146. [Google Scholar] [CrossRef] [Green Version]
- Cherubin, M.R.; Karlen, D.L.; Franco, A.L.C.; Tormena, C.A.; Cerri, C.E.P.; Davies, C.A.; Cerri, C.C. Soil physical quality response to sugarcane expansion in Brazil. Geoderma 2016, 267, 156–168. [Google Scholar] [CrossRef]
- Ortiz, P.F.S.; Rolim, M.M.; de Lima, J.L.P.; Pedrosa, E.M.R.; Dantas, M.S.M.; Tavares, U.E. Physical qualities of an Ultisol under sugarcane and Atlantic forest in Brazil. Geoderma Reg. 2017, 11, 62–70. [Google Scholar] [CrossRef]
- Esteban, D.A.A.; Souza, Z.M.; Tormena, C.A.; Lovera, L.H.; Lima, E.S.; Oliveira, I.N.; Ribeiro, N.P. Soil compaction, root system and productivity of sugarcane under different row spacing and controlled traffic at harvest. Soil Tillage Res. 2019, 187, 60–71. [Google Scholar] [CrossRef]
- Guimarães Júnnyor, W.S.; Diserens, E.; de Maria, I.C.; Araujo-Junior, C.F.; Farhate, C.V.V.; de Souza, Z.M. Prediction of soil stresses and compaction due to agricultural machines in sugarcane cultivation systems with and without crop rotation. Sci. Total Environ. 2019, 681, 424–434. [Google Scholar] [CrossRef]
- Moraes, M.T.; Bengough, A.G.; Debiasi, H.; Franchini, J.C.; Levien, R.; Schnepf, A.; Leitner, D. Mechanistic framework to link root growth models with weather and soil physical properties, including example applications to soybean growth in Brazil. Plant Soil 2018, 428, 67–92. [Google Scholar] [CrossRef] [Green Version]
- Severiano, E.C.; Oliveira, G.C.; Curi, N.; Dias Júnior, M.S. Use potential and structural quality of two soils under sugarcane production in Goianésia, Goiás State, Brazil. Rev. Bras. Ciência Solo 2009, 33, 159–168. [Google Scholar] [CrossRef]
- Lavanholi, M.G.D. Qualidade da cana-de-açúcar como matéria-prima para produção de açúcar e álcool. In Cana-de-Açúcar; Dinardo-Miranda, L.L., Vasconcelos, A.C.M., Landell, M.G.A., Eds.; Instituto Agronômico de Campinas: Campinas, Brazil, 2008; pp. 697–722. [Google Scholar]
- Larrahondo, J.E.; Castillo, E.F.; Peralta, Y.; Jaramillo, A.; Palma, A.; Briceño, C.; Giraldo, F. Impact of extraneous matter on post-harvest sucrose losses and quality parameters in sugarcane. Sugar Tech 2009, 11, 171–175. [Google Scholar] [CrossRef]
- Gupta, S.C.; Sharma, P.P.; DeFranchi, S.A. Compaction effects on soil structure. Adv. Agron. 1989, 42, 311–338. [Google Scholar] [CrossRef]
- Cortez, L.; Magalhães, P.; Happi, J. Principais subprodutos da agroindústria canavieira e sua valorização. Rev. Bras. Energ. 1992, 2, 1–17. [Google Scholar]
- Paulino, J.; Zolin, C.A.; Bertonha, A.; Freitas, P.S.L.; Folegatti, M.V. Exploratory study of the stillage use along the time. II. Characteristics of the sugarcane crop. Rev. Bras. Eng. Agrícola Ambient. 2011, 15, 244–249. [Google Scholar] [CrossRef] [Green Version]
- Christofoletti, C.A.; Escher, J.P.; Correia, J.E.; Marinho, J.F.U.; Fontanetti, C.S. Sugarcane vinasse: Environmental implications of its use. Waste Manag. 2013, 33, 2752–2761. [Google Scholar] [CrossRef]
- Elia Neto, A.; Nakahodo, T. Caracterização Físico-Química da Vinhaça–Projeto n.9500278; Copersucar: Piracicaba, Brazil, 1995; p. 26. [Google Scholar]
- Rossetto, R.; Dias, F.L.F.; Vitti, A.C.; Tavares, S. Potássio. In Cana-de-Açúcar; Dinardo-miranda, L.L., Vasconcelos, A.C.M., Landell, M.G.A., Eds.; Instituto Agronômico de Campinas: Campinas, Brazil, 2008; pp. 289–312. [Google Scholar]
- Dalri, A.B.; Cortez, G.P.E.; Riul, L.G.S.; Araújo, J.A.C.; Cruz, R.L. Vinasse application influence on infiltration capacity of sandy loam soil. Irriga 2010, 15, 344–352. [Google Scholar] [CrossRef] [Green Version]
- Oliveira, B.G.; Carvalho, J.L.N.; Cerri, C.E.P.; Cerri, C.C.; Feigl, B.J. Greenhouse gas emissions from sugarcane vinasse transportation by open channel: A case study in Brazil. J. Clean. Prod. 2015, 94, 102–107. [Google Scholar] [CrossRef]
- Bernal, A.P.; Santos, I.F.S.; Silva, A.P.M.; Barros, R.M.; Ribeiro, E.M. Vinasse biogas for energy generation in Brazil: An assessment of economic feasibility, energy potential and avoided CO2 emissions. J. Clean. Prod. 2017, 151, 260–271. [Google Scholar] [CrossRef] [Green Version]
- Miranda, T.L.; Pedrosa, E.M.R.; De Ilva, E.F.F.; Rolim, M.M. Physical and biological alterations in sugarcane cultivated soil after harvest and vinasse application. Rev. Bras. Ciências Agrar. 2012, 7, 150–158. [Google Scholar] [CrossRef] [Green Version]
- Gloria, N.A.; Magro, J.A. Utilização agrícola de resíduos da usina de açúcar e destilaria na Usina da Pedra. In Proceedings of the Seminário Copersucar da Agroindústria Açucareira; Copersucar: São Paulo, Brazil, 1977; pp. 163–180. [Google Scholar]
- Camilotti, F.; Andrioli, I.; Marques, M.O.; da Silva, A.R.; Tasso, L.C.; de Nobile, F.O. Physical atributes of Oxisol cultivated with sugar cane after applications of sewage sludge and vinasse. Eng. Agric. 2006, 26, 738–747. [Google Scholar] [CrossRef]
- Longati, A.A.; Lino, A.R.A.; Giordano, R.C.; Furlan, F.F.; Cruz, A.J.G. Biogas production from anaerobic digestion of vinasse in sugarcane biorefinery: A techno-economic and environmental analysis. Waste Biomass Valorization 2020, 11, 4573–4591. [Google Scholar] [CrossRef]
- Canellas, L.P.; Velloso, A.C.X.; Marciano, C.R.; Ramalho, J.F.G.P.; Rumjanek, V.M.; Rezende, C.E.; Santos, G.A. Chemical soil properties of an Inceptisol under long-term sugarcane crops with vinasse application and without slash burning. Rev. Bras. Ciência Solo 2003, 27, 935–944. [Google Scholar] [CrossRef]
- Passarin, A.L.; Rodrigueiro, E.L.; Robaina, C.R.P.; Medina, C.C. Evaluation of aggregate stability in an Oxisol treated with different vinasse doses. Rev. Bras. Ciência Solo 2007, 31, 1255–1260. [Google Scholar] [CrossRef]
- Oliveira, V.S.; Rolim, M.M.; Vasconcelos, R.F.B.; Costa, Y.D.J.; Pedrosa, E.M.R. Compaction of a Ultisol submitted to different managements. Rev. Bras. Eng. Agrícola Ambient. 2010, 14, 914–920. [Google Scholar] [CrossRef]
- Vicente, T.F.S.; Pedrosa, E.M.R.; Rolim, M.M.; Oliveira, V.S.; Oliveira, A.N.S.; Souza, A.M.P.L. Soil attributes and soil aggregate stability relationship in sugarcane fields with and without vinasse application. Rev. Bras. Eng. Agrícola Ambient. 2012, 16, 1215–1222. [Google Scholar] [CrossRef] [Green Version]
- Oliveira, A.P.P.; Lima, E.; Anjos, L.H.C.; Zonta, E.; Pereira, M.G. Sugarcane harvesting systems: Current knowledge about modifications of attributes in Tableland soils. Rev. Bras. Eng. Agrícola Ambient. 2014, 18, 939–947. [Google Scholar] [CrossRef] [Green Version]
- Vasconcelos, R.F.B.; Souza, E.R.; Cantalice, J.R.B.; Silva, L.S. Physical quality of Latossolo Amarelo of a coastal plain under different management systems in sugarcane. Rev. Bras. Eng. Agrícola Ambient. 2014, 18, 381–386. [Google Scholar] [CrossRef]
- Almeida, J.R. O problema da vinhaça. Bras. Açucareiro 1955, 46, 72–77. [Google Scholar]
- Lopes, E.S.; Peron, S.C.; Portugal, E.P.; Camargo, O.A.; Freitas, S.S. Respiratory activity of stillage and herbicide treated soil. Bragantia 1986, 45, 205–210. [Google Scholar] [CrossRef]
- Silva, A.J.N.; Cabeda, M.S.V.; Carvalho, F.G. Organic matter and physical properties of a Argissolo Amarelo cohesive under different management systems with sugar cane. Rev. Bras. Eng. Agrícola Ambient. 2006, 10, 579–585. [Google Scholar] [CrossRef] [Green Version]
- Prado, E.A.F.; Vitorino, A.C.T.; Oliveira, W.H.; Espindola, D.L.P.; Arantes, H.P. Dispersion index of aggregates in a Rhodic Ferrasol cultivated with cane under stillage application. Semin. Ciências Agrárias 2014, 35, 2347–2356. [Google Scholar] [CrossRef] [Green Version]
- IBGE. Cartas e mapas. Available online: https://www.ibge.gov.br/geociencias/cartas-e-mapas (accessed on 24 March 2021).
- QGIS.org. QGIS-Geographic Information System, Version 3.16.2; QGIS Association; 2021. Available online: https://www.qgis.org/en/site/ (accessed on 22 June 2021).
- Alvares, C.A.; Stape, J.L.; Sentelhas, P.C.; de Moraes Gonçalves, J.L.; Sparovek, G. Köppen’s climate classification map for Brazil. Meteorol. Zeitschrift 2013, 22, 711–728. [Google Scholar] [CrossRef]
- CPRM. Mapa Geológico do Estado de Goiás e Distrito Federal; CRPM: Brasilia, Brazil, 2000; p. 1. [Google Scholar]
- WRB. World Reference Base for Soil Resources 2014, Update 2015-International Soil Classification System for Naming Soils and Creating Legends for Soil Maps; FAO: Rome, Italy, 2015. [Google Scholar]
- Santos, H.G.; Jacomine, P.K.T.; Anjos, L.H.C.; Oliveira, V.A.; Lumbreras, J.F.; Coelho, M.R.; Almeida, J.A.; Araújo Filho, J.C.; Oliveira, J.B.; Cunha, T.J.F. Brazilian Soil Classification System, 5th ed.; Embrapa: Brasília, Brazil, 2018; ISBN 978-85-70-35. [Google Scholar]
- Silva, A.J.N.; Cabeda, M.S.V.; Lima, J.F.W.F. Effect of use and management systems on the physical and hydraulic properties of a Argissolo Amarelo of coastal Tablelands. Rev. Bras. Ciência Solo 2005, 29, 833–842. [Google Scholar] [CrossRef]
- Teixeira, P.C.; Donagemma, G.K.; Fontana, A.; Teixeira, W.G. Manual de Métodos de Análise de Solo, re., 3rd ed.; Embrapa, Ed.; Embrapa: Brasília, Brazil, 2017; ISBN 978-85-7035-771-7. [Google Scholar]
- Donagema, G.K.; Campos, D.V.B.; Calderano, S.R.; Teixeira, W.G.; Viana, J.H.M. Manual de Métodos de Análise de Solo, 2nd ed.; Embrapa Solos: Rio de Janeiro, Brazil, 2011. [Google Scholar]
- Santos, G.G.; Marchão, R.L.; Silva, E.M.; Silveira, P.M.; Becquer, T. Soil physical quality in integrated crop-livestock systems. Pesqui. Agropeuária Bras. 2011, 46, 1339–1348. [Google Scholar] [CrossRef]
- Libardi, P.L. Dinâmica da Água no Solo, 3rd ed.; EDUSP: São Paulo, Brazil, 2018; ISBN 13:9788531417054. [Google Scholar]
- Reynolds, W.D.; Bowman, B.T.; Drury, C.F.; Tan, C.S.; Lu, X. Indicators of good soil physical quality: Density and storage parameters. Geoderma 2002, 110, 131–146. [Google Scholar] [CrossRef]
- Yoder, R.E. A direct method of aggregate analysis of soils and a study of the physical nature of erosion losses 1. Agron. J. 1936, 28, 337–351. [Google Scholar] [CrossRef]
- Torman, V.B.L.; Coster, R.; Riboldi, J. Normality of variables: Diagnosis methods and comparison of some nonparametric tests by simulation. Clin. Biomed. Res. 2012, 32, 227–234. [Google Scholar]
- Ferreira, D.F. Sisvar: A guide for its bootstrap procedures in multiple comparisons. Cienc. Agrotecnologia 2014, 38, 109–112. [Google Scholar] [CrossRef]
- Addinsoft. Xlstat version 2016.4. Software and user guide 2016; Addinsoft: Paris, France, 2016. [Google Scholar]
- Marsili, A.; Servadio, P.; Pagliai, M.; Vignozzi, N. Changes of some physical properties of a clay soil following passage of rubber- and metal-tracked tractors. Soil Tillage Res. 1998, 49, 185–199. [Google Scholar] [CrossRef]
- Ceddia, M.B.; Anjos, L.H.C.; Lima, E.; Ravelli Neto, A.; Silva, L.A. Sugar cane harvesting systems and changes on physical properties of a Yellow Podzolic soil in Espírito Santo, Brazil. Pesqui. Agropecuária Bras. 1999, 34, 1467–1473. [Google Scholar] [CrossRef] [Green Version]
- Machado, W.; Telles, T.S.; Filho, J.T.; Guimarães, M.F.; Alves, G.B.; Borges, J.L.B. Physical properties of a Rhodic Haplustox under two sugarcane harvesting systems. Rev. Bras. Ciência Solo 2010, 34, 1803–1809. [Google Scholar] [CrossRef] [Green Version]
- Albert, R.P.; Pinto, M.A.B.; Lima, C.L.R.; Santos, F.J.; Scheunemann, T.; Miguel, P. Physico-mechanical attributes of a Typic Hapludox in areas with different sugarcane cultivation times. Rev. Bras. Ciências Agrárias-Brazilian J. Agric. Sci. 2018, 13, 1–8. [Google Scholar] [CrossRef] [Green Version]
- Severiano, E.C.; Oliveira, G.C.; Dias Júnior, M.S.; Curi, N.; Costa, K.A.P.; Carducci, C.E. Preconsolidation pressure, soil water retention characteristics, and texture of Latossolos in the Brazilian Cerrado. Soil Res. 2013, 51, 193–202. [Google Scholar] [CrossRef]
- Barbosa, L.C.; Magalhães, P.S.G.; Bordonal, R.O.; Cherubin, M.R.; Castioni, G.A.F.; Tenelli, S.; Franco, H.C.J.; Carvalho, J.L.N. Soil physical quality associated with tillage practices during sugarcane planting in south-central Brazil. Soil Tillage Res. 2019, 195, 104383. [Google Scholar] [CrossRef]
- Cavalieri, K.M.V.; Carvalho, L.A.; Silva, A.P.; Libardi, P.L.; Tormena, C.A. Soil physical quality of three soils under mechanical sugarcane harvesting. Rev. Bras. Ciência Solo 2011, 35, 1541–1549. [Google Scholar] [CrossRef] [Green Version]
- Otto, R.; Silva, A.P.; Franco, H.C.J.; Oliveira, E.C.A.; Trivelin, P.C.O. High soil penetration resistance reduces sugarcane root system development. Soil Tillage Res. 2011, 117, 201–210. [Google Scholar] [CrossRef]
- Zolin, C.A.; Paulino, J.; Bertonha, A.; Freitas, P.S.L.; Folegatti, M.V. Exploratory study of the stillage use along the time. I. Characteristics of the soil. Rev. Bras. Eng. Agrícola Ambient. 2011, 15, 22–28. [Google Scholar] [CrossRef]
- Souza, Z.M.; Marques Júnior, J.; Pereira, G.T. Geostatistics and soil attributes in area cultivated with sugar cane. Ciência Rural 2010, 40, 48–56. [Google Scholar] [CrossRef] [Green Version]
- Glória, N.A. Utilização agrícola da vinhaça. Bras. Açucareiro 1975, 86, 11–17. [Google Scholar]
- Camargo, O.A.; Valadares, J.M.A.S.; Geraldi, R.N. Características Químicas e Físicas de Solo que Recebeu Vinhaça por Longo Tempo; Instituto Agronômico de Campinas: Campinas, SAO, Brazil, 1983. [Google Scholar]
- Souza, Z.M.; Prado, R.M.; Paixão, A.C.S.; Cesarin, L.G. Harvest systems and residue management of sugarcane. Pesqui. Agropecuária Bras. 2005, 40, 271–278. [Google Scholar] [CrossRef]
- Gmach, M.R.; Scarpare, F.V.; Cherubin, M.R.; Lisboa, I.P.; Santos, A.K.B.; Cerri, C.E.P.; Cerri, C.C. Sugarcane straw removal effects on soil water storage and drainage in southeastern Brazil. J. Soil Water Conserv. 2019, 74, 466–476. [Google Scholar] [CrossRef]
- Satiro, L.S.; Cherubin, M.R.; Safanelli, J.L.; Lisboa, I.P.; Rocha Junior, P.R.; Cerri, C.P.P.; Cerri, C.C. Sugarcane straw removal effects on Ultisols and Oxisols in south-central Brazil. Geoderma Reg. 2017, 11, 86–95. [Google Scholar] [CrossRef]
- Castioni, G.A.F.; Cherubin, M.R.; Bordonal, R.O.; Barbosa, L.C.; Menandro, L.M.S.; Carvalho, J.L.N. Straw removal affects soil physical quality and sugarcane yield in Brazil. BioEnergy Res. 2019, 12, 789–800. [Google Scholar] [CrossRef]
- Cavalcanti, R.Q.; Rolim, M.M.; Lima, R.P.; Tavares, U.E.; Pedrosa, E.M.R.; Gomes, I.F. Soil physical and mechanical attributes in response to successive harvests under sugarcane cultivation in Northeastern Brazil. Soil Tillage Res. 2019, 189, 140–147. [Google Scholar] [CrossRef]
- Dufranc, G.; Dechen, S.C.F.; Freitas, S.S.; Camargo, O.A. Physical, chemical and biological soil attributes related to aggregate stability of two Oxisols under no-tillage in the State of São Paulo, Brazil. Rev. Bras. Ciência Solo 2004, 28, 505–517. [Google Scholar] [CrossRef]
- Angers, D.A. Changes in soil aggregation and organic carbon under corn and alfafa. Soil Sci. Soc. Am. J. 1992, 56, 1244–1249. [Google Scholar] [CrossRef]
- Góes, G.B.; Greggio, T.C.; Centurion, J.F.; Beutler, A.N.; Andrioli, I. Effect of sugar cane cultivation on soil aggregate stability and hydraulic conductivity. Irriga 2005, 10, 116–122. [Google Scholar] [CrossRef]
- Corrêa, J.C. Effect of cropping systems on the stability of Latossolo Vermelho-Amarelo aggregates in Querência, Mato Grosso, Brazil. Pesqui. Agropecuária Bras. 2002, 37, 203–209. [Google Scholar] [CrossRef] [Green Version]
- Cavalcanti, R.Q.; Rolim, M.M.; de Lima, R.P.; Tavares, U.E.; Pedrosa, E.M.R.; Cherubin, M.R. Soil physical changes induced by sugarcane cultivation in the Atlantic Forest biome, northeastern Brazil. Geoderma 2020, 370, 114353. [Google Scholar] [CrossRef]
- Silva, I.F.; Mielniczuk, J. Aggregate stability as affected by cropping systems and soil characteristics. Rev. Bras. Ciência Solo 1998, 22, 311–317. [Google Scholar] [CrossRef]
- Esteban, D.A.A.; Souza, Z.M.; Silva, R.B.; Lima, E.S.; Lovera, L.H.; Oliveira, I.N. Impact of permanent traffic lanes on the soil physical and mechanical properties in mechanized sugarcane fields with the use of automatic steering. Geoderma 2020, 362, 114097. [Google Scholar] [CrossRef]


| Cycle | Description |
|---|---|
| C1 | Area on the first fertigation cycle of the RB 85-5453 variety in 2018 (plant cane), 11.98 ha, altitude 462 m, at geographical coordinates 17°58′37.54″ S and 50°19′33.73″ W. Previous cultivation of sugarcane fertigated with vinasse from 2009 to 2016. Soybean planting in the summers of 2016–2017. Planting of RB 85-5453 in June 2017, after soybean harvest. Sampling performed before the harvesting operations and yield obtained in the plot of 147.83 Mg ha−1 of the RB 85-5453 variety in the 2017/2018 harvest. |
| C3 | Area on the third fertigation cycle (second cut) of RB 85-5453 in 2018, 6.26 ha, altitude 470 m, at geographical coordinates 17°57′33.84″ S and 50°18′17.15″ W. Previous cultivation of sugarcane fertigated with vinasse from 2009 to 2014. Soybean planting in the summers of 2014–2015. Planting of RB 85-5453 in July 2015, after soybean harvest. Productivities of 124.18, 90.10, and 82.95 Mg ha−1 of RB 85-5453 in the harvests of 2016/2017, and 2017/2018, respectively. |
| C5 | Area on the fifth fertigation cycle (fourth cut) of the RB 85-5453 variety in 2018, 17.10 ha, altitude 466 m, at geographic coordinates 17°58′48.54″ S and 50°17′46.83″ W. Previous cultivation of sugarcane fertigated with vinasse from 2003 to 2012. Soybean planting in the summers of 2012–2013. Planting of RB 85-5453 in June 2013, after soybean harvest. Productivities of 89.28, 97.09, 77.82, 88.87, and 63.78 Mg ha−1 of RB 85-5453 in the harvests of 2014/2015, 2015/2016, 2016/2017, and 2017/2018, respectively. |
| C7 | Area on the seventh fertigation cycle (sixth cut) of the RB 85-5453 variety in 2018, 11.31 ha, altitude 466 m, at geographic coordinates 17°59′29.92″ S and 50°17′52.01″ W. Previous cultivation of sugarcane fertigated with vinasse from 2005 to 2010. Soybean planting in the summers of 2010–2011. Planting of RB 85-5453 in June 2011, after soybean harvest. Productivities of 84.46, 70.73, 103.38, 86.76, 77.90, 70.45, and 50.14 Mg ha−1 of RB 85-5453 in the harvests of 2012/2013, 2013/2014, 2014/2015, 2015/2016, 2016/2017, and 2017/2018, respectively. |
| C12 | Area of twelfth fertigation cycle (eleventh cut) of the RB 85-5453 variety in 2018, 11.43 ha, altitude 454 m, at geographic coordinates 17°59′39.94″ S e 50°17′28.19″ W. Soybean planting in the summers of 2005/2006. Planting of RB 85-5453 in July 2006, after soybean harvest. Productivities of 105.63, 94.22, 99.83, 66.10, 88.18, 89.14, 74.71, 80.10, and 51.87 Mg ha−1 of RB 85-5453 in the harvests of 2007/2008, 2009/2010, 2011/2012, 2012/2013, 2013/2014, 2014/2015, 2015/2016, 2016/2017, and 2017/2018, respectively. |
| NV | Area of native vegetation of typical Cerrado (savannah), without human interference, 27.9 ha, altitude 475 m, at geographic coordinates 18°0′3.74″ S and 50°15′34.10″ W. |
| Cultivation Cycles (1) | SOM | Coarse Sand | Fine Sand | Silt | Clay |
|---|---|---|---|---|---|
| g kg−1 | |||||
| 0.0–0.1 m | |||||
| C1 | 37 ± 0.58 | 120 ± 21.40 | 158 ± 21.57 | 323 ± 18.77 | 399 ± 24.85 |
| C3 | 35 ± 0.58 | 152 ± 10.86 | 199 ± 13.25 | 230 ± 10.73 | 419 ± 34.28 |
| C5 | 27 ± 0.58 | 85 ± 10.03 | 200 ± 26.92 | 184 ± 15.06 | 531 ± 25.62 |
| C7 | 26 ± 0.58 | 55 ± 5.79 | 140 ± 5.27 | 239 ± 16.18 | 566 ± 14.32 |
| C12 | 37 ± 0.58 | 162 ± 8.95 | 216 ± 29.62 | 244 ±48.64 | 378 ± 18.55 |
| NV | 37 ± 0.58 | 82 ± 27.68 | 159 ± 5.76 | 230 ± 36.86 | 529 ± 21.54 |
| 0.1–0.2 m | |||||
| C1 | 37 ± 0.58 | 117 ± 22.52 | 157 ± 19.61 | 325 ± 8.44 | 401 ± 33.62 |
| C3 | 26 ± 0.58 | 95 ± 12.79 | 168 ± 20.99 | 265 ± 17.57 | 472 ± 37.85 |
| C5 | 23 ± 0.58 | 85 ± 8.38 | 202 ± 32.61 | 221 ± 32.99 | 492 ± 33.67 |
| C7 | 21 ± 0.58 | 46 ± 2.79 | 143 ± 6.66 | 230 ± 27.83 | 581 ± 23.98 |
| C12 | 24 ± 0.58 | 118 ± 13.76 | 214 ± 33.20 | 180 ± 20.14 | 488 ± 30.10 |
| NV | 23 ± 0.58 | 95 ± 0.65 | 158 ± 5.50 | 154 ± 1.37 | 593 ± 7.52 |
| 0.2–0.3 m | |||||
| C1 | 26 ± 0.58 | 71 ± 14.81 | 124 ± 17.31 | 296 ± 2.44 | 509 ± 29.68 |
| C3 | 37 ± 0.58 | 98 ± 14.92 | 150 ± 17.83 | 245 ± 10.27 | 507 ± 38.39 |
| C5 | 23 ± 0.00 | 83 ± 12.46 | 202 ± 32.11 | 204 ± 7.03 | 511 ± 37.31 |
| C7 | 18 ± 0.58 | 45 ± 2.54 | 143 ± 2.54 | 238 ± 4.42 | 574 ± 5.68 |
| C12 | 26 ± 0.058 | 110 ± 13.06 | 206 ± 29.70 | 205 ± 16.80 | 479 ± 27.74 |
| NV | 14 ± 0.58 | 68 ± 4.96 | 150 ± 6.47 | 174 ± 2.27 | 608 ± 8.03 |
| 0.4–0.5 m | |||||
| C1 | 17 ± 0.88 | 44 ± 8.24 | 118 ± 14.29 | 251 ±22.14 | 587 ± 3.07 |
| C3 | 11 ± 0.58 | 76 ± 4.45 | 126 ± 4.57 | 215 ± 18.18 | 583 ± 9.18 |
| C5 | 11 ± 0.58 | 58 ± 8.40 | 185 ± 31.09 | 171 ± 34.14 | 586 ± 34.73 |
| C7 | 11 ± 0.58 | 33 ± 4.10 | 134 ± 5.59 | 225 ± 10.23 | 608 ± 12.05 |
| C12 | 11 ± 0.58 | 89 ± 15.43 | 215 ± 31.04 | 152 ± 7.14 | 544 ± 53.61 |
| NV | 10 ± 0.58 | 63 ± 6.12 | 137 ± 1.68 | 188 ± 4.56 | 612 ± 8.28 |
| Cultivation Cycles (1) | Bulk Density | Total Porosity | Macroporosity | Microporosity | Blocked Pores | Soil Aeration Capacity |
|---|---|---|---|---|---|---|
| (g cm−3) | (g g−1) | (g g−1) | (g g−1) | (g g−1) | (g g−1) | |
| C1 | 1.26 ± 0.030 (b) | 0.47 ± 0.022 (b) | 0.09 ± 0.010 (c) | 0.38 ± 0.014 (a) | 0.02 ± 0.003 (c) | 0.16 ± 0.013 (c) |
| C3 | 1.30 ± 0.014 (a) | 0.44 ± 0.008 (c) | 0.05 ± 0.006 (d) | 0.39 ± 0.007 (a) | 0.00 ± 0.001 (d) | 0.12 ± 0.013 (c) |
| C5 | 1.23 ± 0.027 (b) | 0.48 ± 0.017 (b) | 0.13 ± 0.019 (b) | 0.34 ± 0.008 (b) | 0.02 ± 0.008 (c) | 0.25 ± 0.033 (b) |
| C7 | 1.25 ± 0.025 (b) | 0.47 ± 0.016 (b) | 0.15 ± 0.015 (b) | 0.33 ± 0.004 (b) | 0.04 ± 0.007 (b) | 0.30 ± 0.022 (b) |
| C12 | 1.34 ± 0.027 (a) | 0.42 ± 0.015 (c) | 0.12 ± 0.011 (b) | 0.30 ± 0.012 (c) | 0.05 ± 0.004 (b) | 0.28 ± 0.023 (b) |
| NV | 1.05 ± 0.017 (c) | 0.64 ± 0.014 (a) | 0.30 ± 0.017 (a) | 0.34 ± 0.005 (b) | 0.09 ± 0.009 (a) | 0.47 ± 0.017 (a) |
| Sugarcane Area (2) | AG1 | AG2 | AG3 | AG4 | AG5 | AG6 | WAD | SOM |
|---|---|---|---|---|---|---|---|---|
| (%) | (%) | (%) | (%) | (%) | (%) | (mm) | (g kg−1) | |
| C1 | 34.21 ± 6.78 (b) | 15.77 ± 1.03 (a) | 17.41 ± 2.25 (a) | 14.72 ± 2.15 (a) | 6.48 ± 1.02 (b) | 11.40 ± 1.42 (c) | 2.15 ± 0.30 (b) | 29.2 ± 2.58 (a) |
| C3 | 24.46 ± 3.45 (b) | 17.02 ± 0.75 (a) | 14.76 ± 0.99 (a) | 17.00 ± 1.87 (a) | 7.99 ± 1.11 (b) | 18.77 ± 0.78 (a) | 1.68 ± 0.16 (b) | 27.3 ± 3.10 (b) |
| C5 | 28.70 ± 2.97 (b) | 14.51 ± 0.94 (b) | 15.25 ± 1.15 (a) | 14.97 ± 1.14 (a) | 9.17 ± 0.61 (b) | 17.39 ± 0.60 (a) | 1.85 ± 0.13 (b) | 21.0 ± 1.82 (d) |
| C7 | 24.41 ± 4.22 (b) | 12.57 ± 1.03 (b) | 17.31 ± 1.34 (a) | 19.09 ± 1.70 (a) | 12.81 ± 1.29 (a) | 13.81 ± 1.40 (b) | 1.64 ± 0.20 (b) | 19.0 ± 1.66 (e) |
| C12 | 46.93 ± 4.30 (a) | 13.93 ± 0.81 (b) | 11.74 ± 1.19 (b) | 10.55 ± 1.43 (b) | 7.53 ± 1.26 (b) | 9.33 ± 1.00 (c) | 2.70 ± 0.20 (a) | 24.5 ± 2.79 (c) |
| NV | 44.31 ± 5.10 (a) | 15.47 ± 1.03 (a) | 11.37 ± 1.22 (b) | 11.24 ± 1.52 (b) | 7.68 ± 1.29 (b) | 9.93 ± 0.90 (c) | 2.59 ± 0.23 (a) | 21.0 ± 3.14 (d) |
Publisher’s Note: MDPI stays neutral with regard to jurisdictional claims in published maps and institutional affiliations. |
© 2021 by the authors. Licensee MDPI, Basel, Switzerland. This article is an open access article distributed under the terms and conditions of the Creative Commons Attribution (CC BY) license (https://creativecommons.org/licenses/by/4.0/).
Share and Cite
Gravina, O.S.; Santos, G.G.; Correchel, V.; Silva, G.C.d.; Medrado, L.d.C.; Flores, R.A.; Mesquita, M.; Severiano, E.d.C. Physical Attributes of Ferralsol in Fertigated Sugarcane Production Environments for Bioethanol in the Midwest of Brazil. Agronomy 2021, 11, 1641. https://doi.org/10.3390/agronomy11081641
Gravina OS, Santos GG, Correchel V, Silva GCd, Medrado LdC, Flores RA, Mesquita M, Severiano EdC. Physical Attributes of Ferralsol in Fertigated Sugarcane Production Environments for Bioethanol in the Midwest of Brazil. Agronomy. 2021; 11(8):1641. https://doi.org/10.3390/agronomy11081641
Chicago/Turabian StyleGravina, Otavio Silveira, Glenio Guimarães Santos, Vladia Correchel, Gustavo Cassiano da Silva, Lucas de Castro Medrado, Rilner Alves Flores, Márcio Mesquita, and Eduardo da Costa Severiano. 2021. "Physical Attributes of Ferralsol in Fertigated Sugarcane Production Environments for Bioethanol in the Midwest of Brazil" Agronomy 11, no. 8: 1641. https://doi.org/10.3390/agronomy11081641