1. Introduction
The current global climate change trend, caused by the dramatic concentration increase in greenhouse gases (GHG) in the atmosphere (IPCC, REFs), requires a significant investment in technologies that reduce GHG emissions and increase C sinks in order to meet the ambitious climate mitigation target posed by the Paris Agreement. Agriculture has always been considered a very relevant source of GHG (ref); however, it also offers important opportunities for large improvements based on GHG mitigation land management strategies and introduction of low-carbon technologies.
Most of the soils of the Far Eastern region of the Russian Federation are characterized by heavy texture [
1]. Intensive agricultural management in these areas leads to soil compaction and to a relative fast loss of soil structure, with consequent increase in erosion phenomena, and deterioration of the water-air regime in the root zone of plants. Unfavorable conditions are created for the cultivation of agricultural crops; this applies to vegetable crops, since their growth strongly depends on the content and availability of nutrients and the optimal amount of moisture available for plants in the arable soil layer.
Among the solutions tested in the agroforestry sector, biochar production and application to field represents one of the most recent technologies tested to increase C sequestration in plant biomass and soil, and, in many cases, a soil amendment that is also able to reduce soil GHG emission [
2,
3,
4,
5,
6]. Biochar is produced by pyrolysis from a large range of biomass and is characterized by high carbon content and a high porous structure, which is able to improve water retention and increase the soil surface area [
7] when biochar is applied to the field. Biochar has also been shown to have a positive effect on several soil physicochemical properties including soil pH, nutrient availability, bulk density, and organic carbon availability [
8]. It physical properties and its positive effect on soil chemical properties have shown to have direct and indirect positive effects on soil biota [
9,
10,
11].
An important property of biochar is the very low rate of decomposition compared with the original biomass, which allows for longer residence time in the soil compared with other forms of organic amendments [
12]. As such, biochar increases represent a technique to increase biosphere sequestration capacity and reduce CO
2 emissions, based on a “fast in” and “slow out” C cycling concept applied to the biomass transformed in biochar. Biochar is considered also to have a direct and indirect effect on the production and emission of GHG (CO
2, CH
4, and N
2O) generated during the decomposition and C and N cycling of the soil organic matter. In this respect, findings of field application of biochar have provided quite different results in terms of reduction, increase, or the neutral effect of biochar on GHG emissions from soil [
4,
5,
6,
13,
14,
15,
16,
17]. There are many factors that can influence the experimental outputs, including biochar quality and quantity, soil types, climatic conditions, combined treatments with fertilizer, redox conditions of the soil, and so on [
4,
5,
6,
13,
14,
15,
16,
17].
In this work, we analyzed the effect of biochar on CO2 flux from Luvic Anthrosols in the south of Primorsky region (Russian Far East). Biochar was added to the soil of an agronomic station characterized by clay soil texture under a rainfall regime that, during the growing season, easily leads to soil waterlogging with consequent stress on the root systems of crops, reducing yield. Biochar was tested as a means to decrease soil bulk density, to increase porosity, to improve crop yield, and possibly, to reduce GHG emissions from the system.
2. Methodology
2.1. Fields and Soil Sampling
The effect of biochar on CO
2 flux was studied in a field experiment. The field experiment was in 2018–2019 on the territory of the Primorskaya Vegetable Experimental Station of the All-Russian Scientific Research Institute of Vegetables (Surazhevka village, Primorsky Territory, Russian Federation 43.423110, 132.313573). Biochar effect on crop growth was tested in two different land management conditions, a field where a drainage system was in place to avoid soil waterlogging for extended periods during the period of most intense rainfall, and another site without drainage system. Biochar in doses of 0 kg/m
2 (control), 1 kg/m
2, and 3 kg/m
2 was applied to experimental plots in two fields. Four replicate plots of 5,6 m
2 were selected for each biochar treatment for a total of 48 experimental plots. Biochar was added to the soil once on 15 June 2018. Biochar was introduced into the soil in the form of particles ranging in size from 0.5 to 50 mm (for more information, see Bovsun et al. [
18]). Biochar was first homogeneously manually distributed on the experimental surfaces and then mechanically integrated in the top soil centimeters (0–10 cm). The mechanical process of soil milling further broke down the biochar into smaller pieces.
The agricultural management of the sites in the experiment sites corresponded to the recommendations developed at the Primorsky vegetable experimental station and included: autumn disking of the soil to a depth of 15–18 cm, early spring harrowing and grooving (three times during the growing season). Crops were planted on ridges to minimize the waterlogging effect on roots. The distance between two ridges was 180 cm. Each ridge was 90 cm long. In each site, the following crop rotation is carried out over a 4-year scheme: green fertilizers (soybean) (2017), cabbage (2018), potatoes (2019), and green fertilizers (oats) (2020).
According to the World Reference Base of Soil Resources, the soil in the studied areas is represented by Luvic Anthrosols. The first 30 cm of the control area in the field without a drainage system has a medium loamy granulometric composition (in Russian classification), close to the neutral reaction of the medium (pHH2O = 6.8; pHKCl = 5.45) and a carbon content of 2.6%. [
19].
The cultivated agricultural crop in the growing season of 2018 was white cabbage of the “Coastal” variety. In the growing season of 2019, soy was grown in the field. The cabbage was planted on 15 June 2018. Soybeans were planted on 28 June 2018. Harvesting and calculation of crop biomass was done manually. The cabbage harvest and the assessment of its biomass in 2018 were carried out from 2 to 3 November. The harvesting of soybeans and the assessment of their biomass in 2019 were carried out from 10 to 12 October.
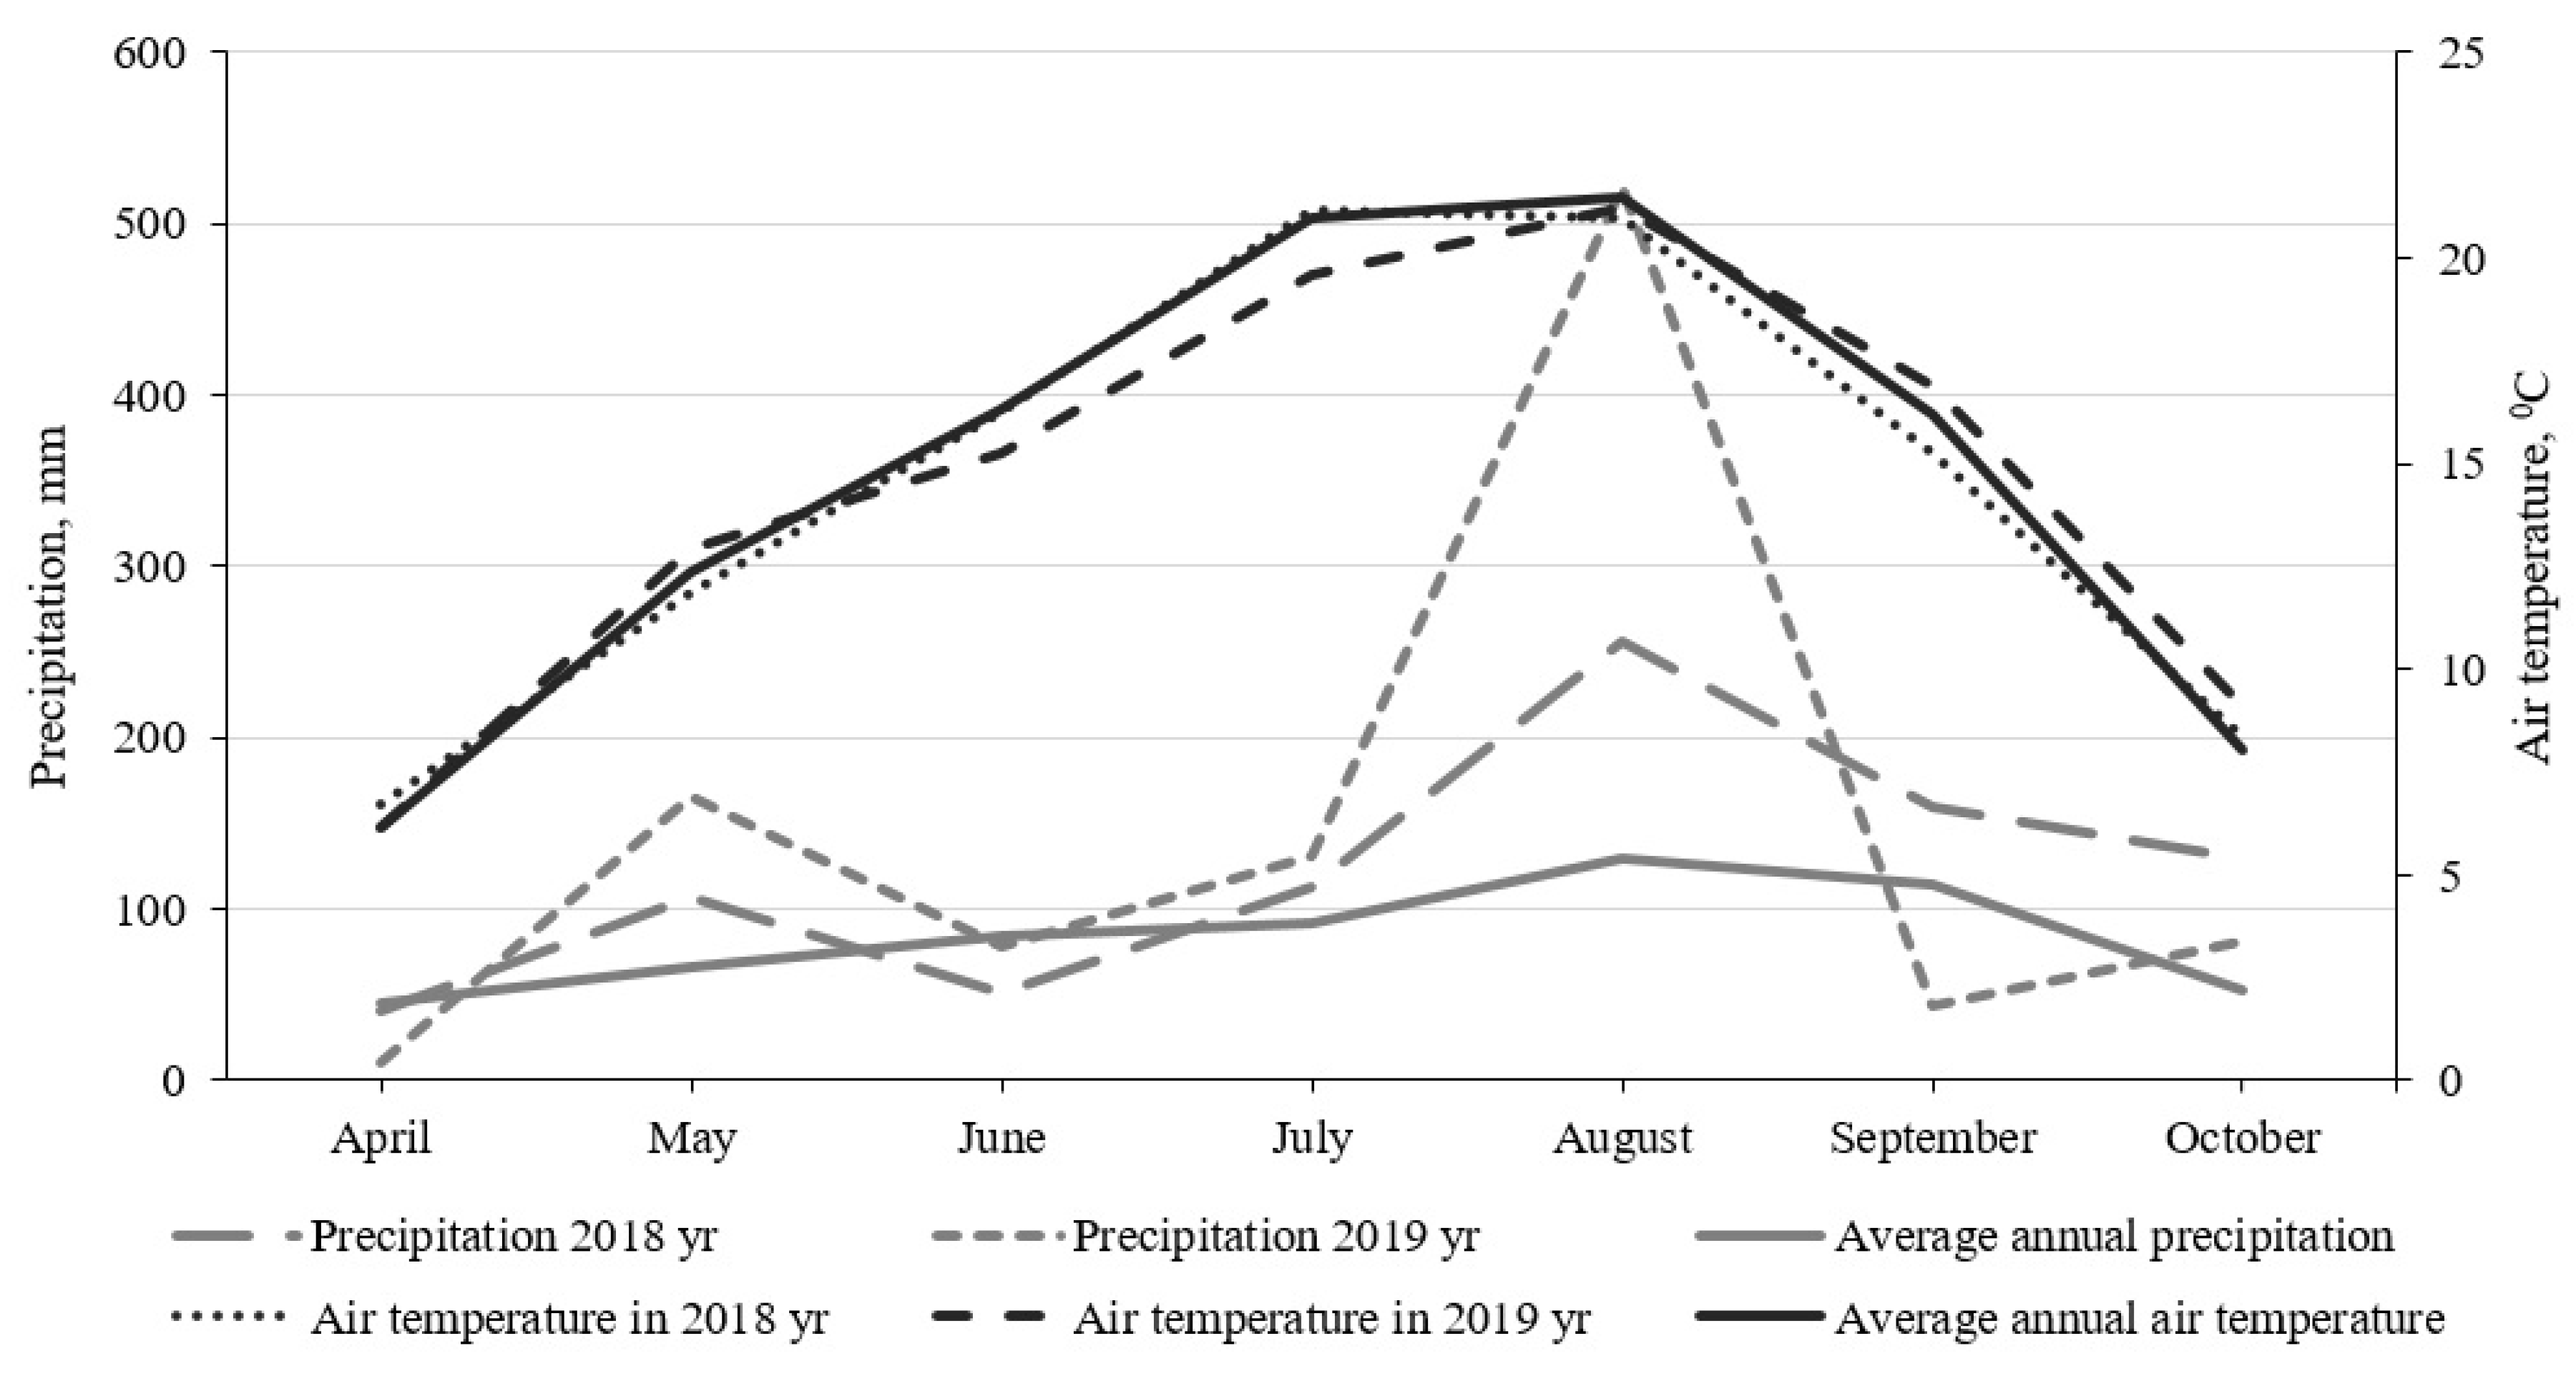
The climate of the area is cold and temperate. The summers are much rainier than the winters. According to Köppen and Geiger [
20], this climate is classified as warm humid continental climate (Dwb). According to the amount of precipitation in the study area, the considered growing seasons of 2018 and 2019 are characterized as abnormally wet (
Figure 1). The total amount of precipitation for the period from April to October 2018 was higher than the total annual average value for the same period (584 mm) by 272.6 mm. The total amount of precipitation for the period from April to October 2019 exceeded the total annual average by 448 mm. The most abnormally wet month for the two growing seasons was August.
According to the average monthly value of air temperature, both the growing season of 2018 and 2019 did not have significant differences compared to the average long-term values (
Figure 1).
2.2. Biochar
The biochar used in the experiment was made from Betula alba, birch. The biochar was produced by slow pyrolysis at a temperature range between 360 and 380 °C. The properties of biochar were evaluated before application in the field, according to the requirements of IBI International Standard. The biochar had a very low content of metals, which allowed to classify it as a safe product: with a surface area of 73.25 m
2/g; a pore volume of 0.048 sm
3/g and with good water sorption properties [
20]; a high percentage of C (78%); H/C and O/C ratio of 0.0518 and 0.1452, respectively; pH 8.09, EC 186.3 µS/cm, n ash content in the range of 5.4–7.3% and volatile compounds in the range of 29–31.2%. The investigated biochar before any treatment had a surface area value of 73.25 m
2/g. According to Tomczyk et al. [
21] and Leng et al. [
22], the surface area of biochar most typically ranges from 8 to 132 m
2/g, although values up to 3000 m
2/g have been determined.
On average, the pore volume reported for biochar ranged from 0.016 to 0.083 cm
3/g, although, also for this measure, higher values can be reached [
21,
22]. The studied biochar was characterized by a relatively low porosity, equal to 0.048 cm
3/g.
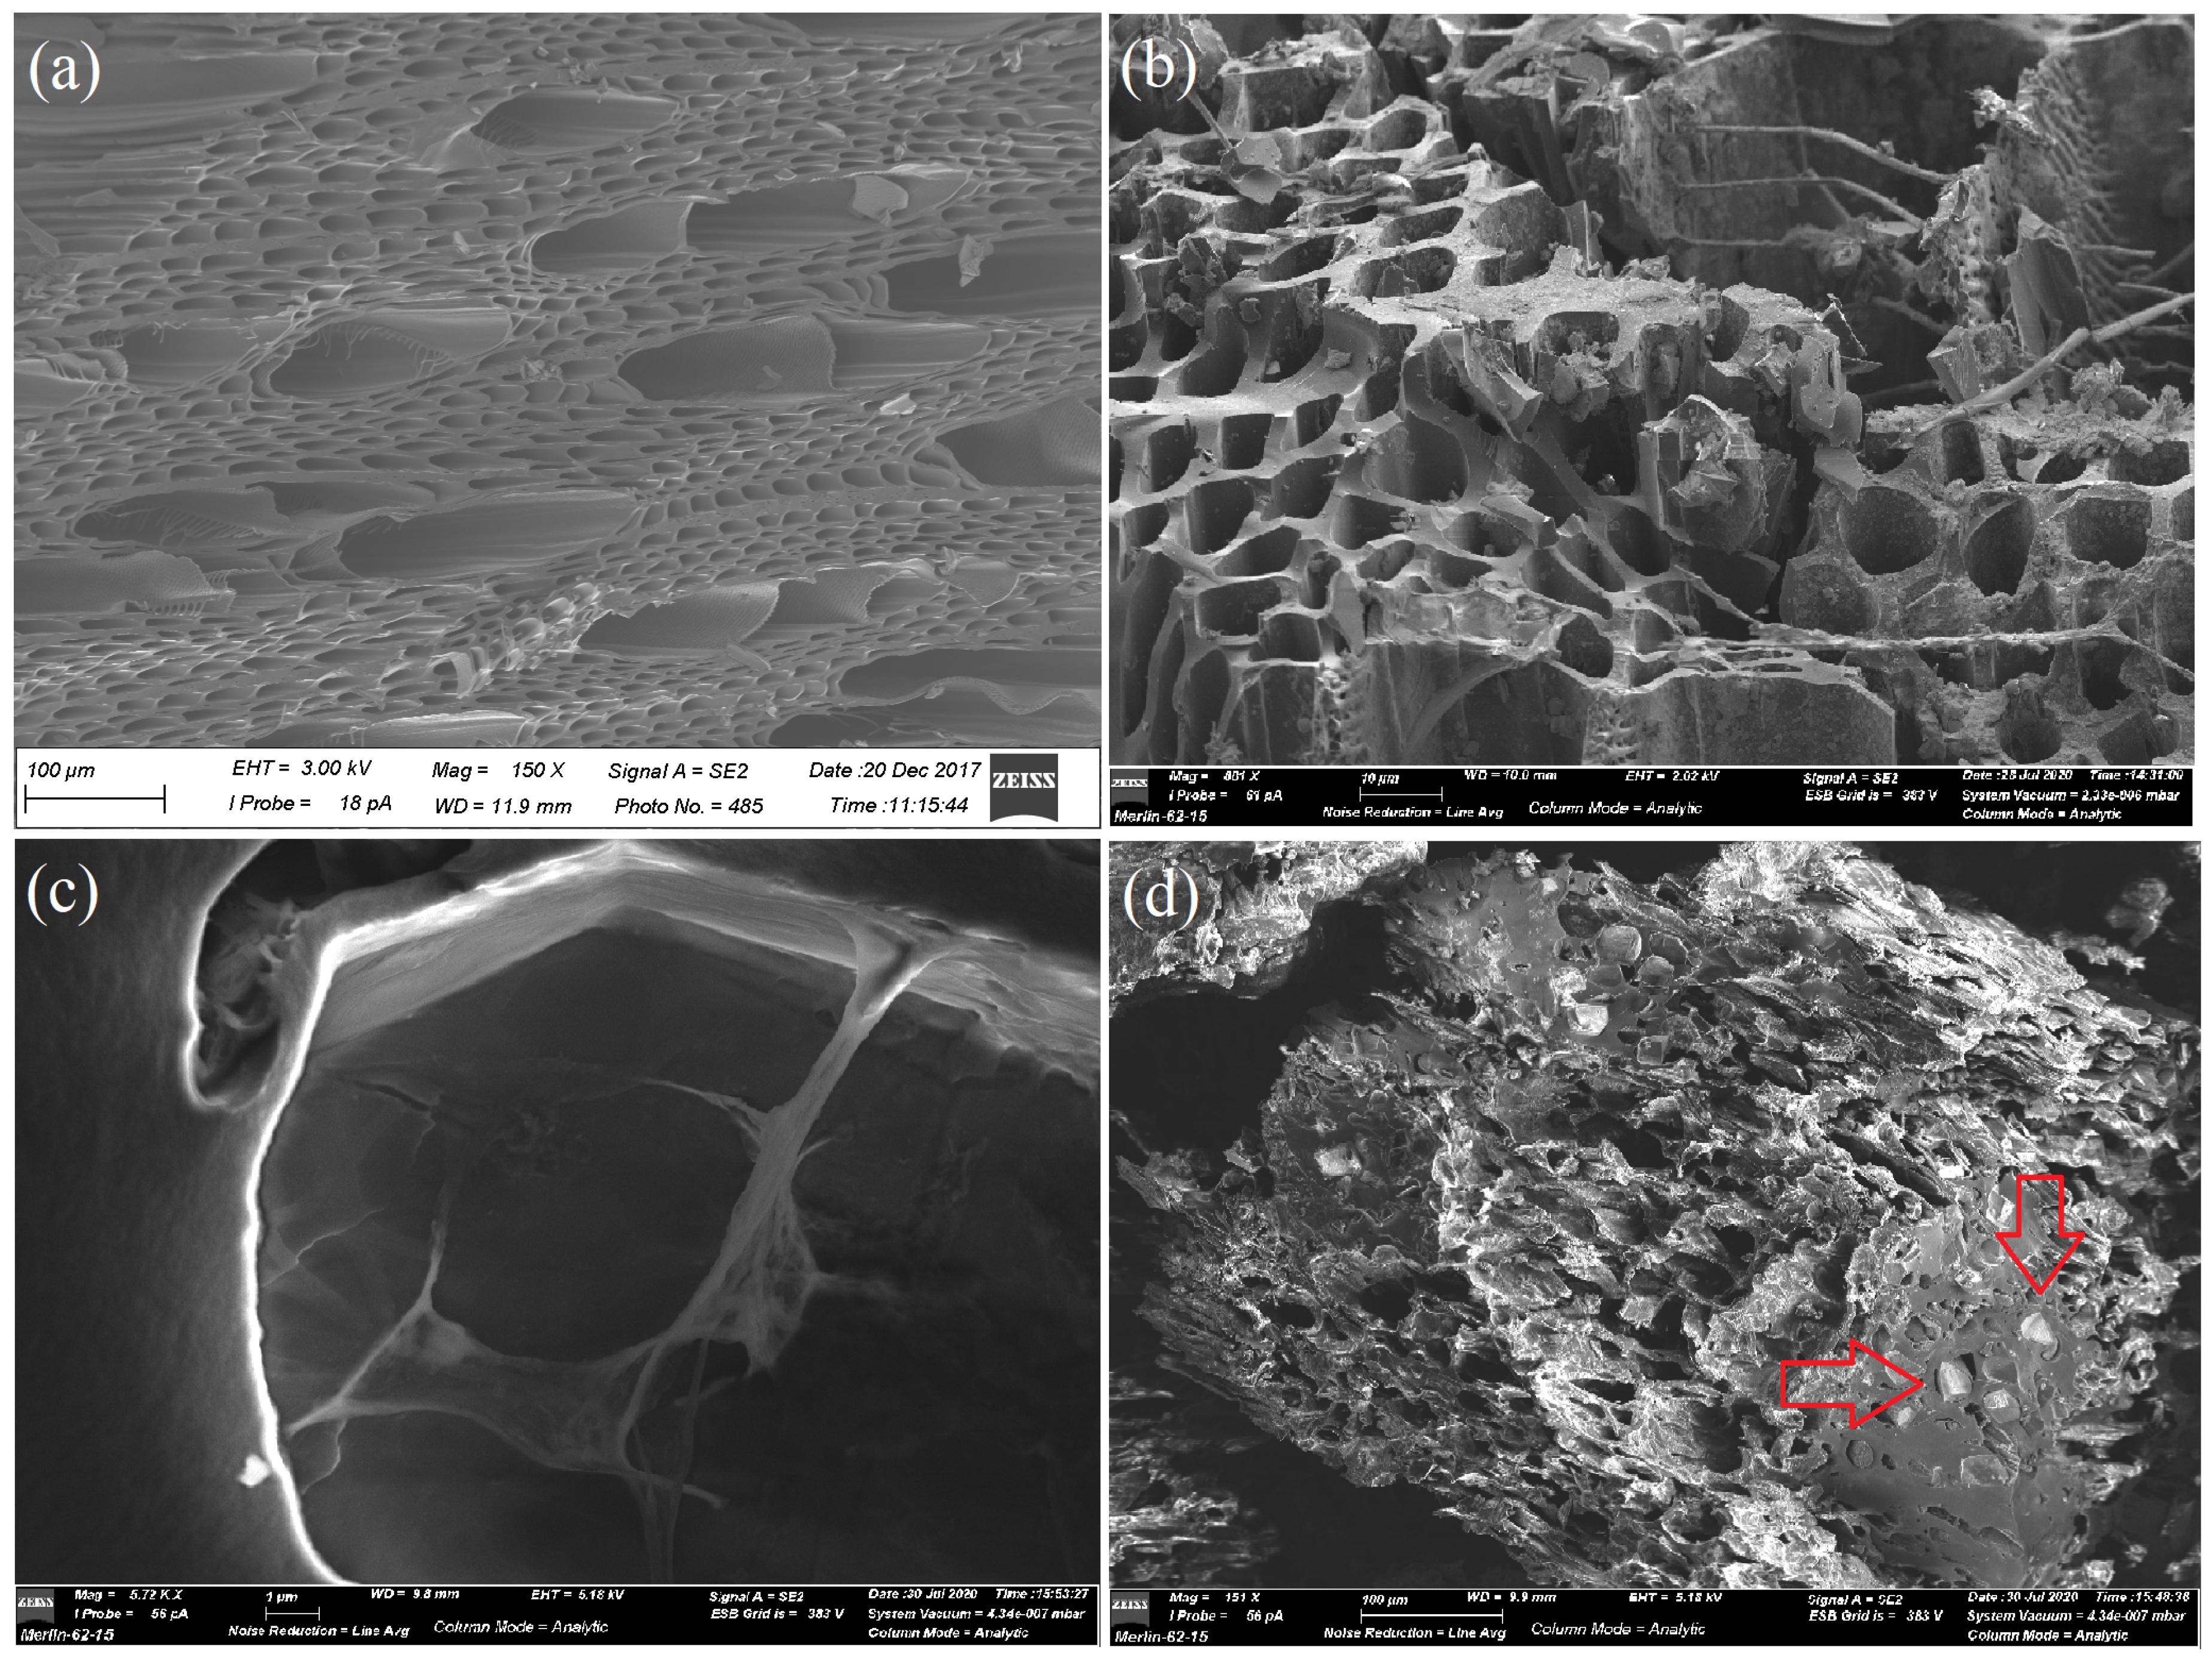
Changes in the chemical and sorption properties of biochar after being in the soil for 1 and 2 years are described in detail in the work of Bovsun et al. [
18] To visually confirm the change in the appearance of biochar, photographs were obtained using electron microscopy (
Figure 2).
After the first growing season in 2018, the biochar samples showed a slight change in the pore structure. The active fixation of organic and mineral particles is noticeable in the interstitial space. The partial loss of the biochar structure, which is clearly visible in the images, and the fixed particles in the interstitial space indicate an increase in the specific surface area of the biochar.
After the growing season of 2019, there was a partial loss of the pore space structure compared to the biochar samples after the growing season of 2018. In the samples, mineral particles of a crystalline structure were present in the pore spaces. Similar to the samples after the growing season of 2018, active fixation of organic and mineral particles inside the pore space was observed. Organic particles are presented in the form of current films.
2.3. Soil CO2 Flux Measurements
CO2 fluxes was measured in the spring–autumn period, from 7 July to 25 October 2018 and from 7 May to 25 October 2019, following the crop-growing season over the two years. CO2 flux was measured in laboratory conditions in soil samples using a Picarro G2508 laser gas analyzer (Picarro Inc., Santa Clara, CA, USA), 5 min measurement accuracy of <200 ppb for CO2.
Three intact soil cores of 78.5 cm3 were sampled (4 cm depth and 5 cm diameter) for each biochar treatment (0, 1, and 3 kg/m2) in the field. The soil samples were transported in the lab, and, immediately after that, CO2 fluxes were measured by inserting the cores in 1 dm3 glass jars provided with leads with two ports connected to the gas analyzer. Each gas analysis was made over an interval of 5 min. The same operation was repeated at each sampling date. The use of soil cores allowed to evaluate the sole contribution of heterotrophic soil respiration without the contribution of roots, which might have occurred in the field. The intact soil cores measured in the same day of sampling within a couple of hours allowed to maintain the moisture conditions close to those observed in the field. Temperature and pressure control in the experiment room was carried out by a portable weather data converter, Vaisala Weather Transmitter WXT520 (Helsinki, Finland).
The emissions were calculated according to the following equation (Equation (1)):
where
Fgas = linear flow of the test gas (CO
2) in µmol CO
2 m
−2 s
−1; ∆ [
Gas]/∆
t—the number of gas particles at time
t, expressed in µmol mol
−1 s
−1;
V—the total volume of the chamber, m
3;
A—the area of the investigated surface, m
2;
ρ—the molar density of air (mol m
−3), defined as P/RT, where
P is the air pressure, Pa;
R—the universal gas constant, equal to 8.31 Pa m
3⋅mol
−1K
−1;
T—air temperature, K.
The data used for the analysis of the CO2 flux were tested for reliability on the basis of the R2 coefficient. Where R2 was below 0.96. Data were reanalyzed manually and the data interval suitable for data analysis was resampled.
The air pressure and temperature indicators required for calculating emissions were determined simultaneously with the concentration measurement in the laboratory using a portable weather transducer, Vaisala Weather Transmitter WXT520 (Vaisala, Helsinki, Finland).
3. Results and Discussion
As the results of this study showed, a decrease in the CO2 flux occurred when applying biochar. However, the results also showed different trends over the two growing seasons.
The effect of introducing biochar into the soil on greenhouse gas fluxes is ambiguous in the scientific literature. Good results are shown for reducing the CH
4 flux in biochar-enhanced soils that are heavy in grain size composition [
23,
24]. The CO
2 flux in many studies did not have significant changes when biochar was introduced into the soil.
Nevertheless, a significant decrease in CO
2 emissions by 43%, in comparison with the control, when using 0.5% biochar on silt loam soil, is shown in the work of Mukherjee et al. [
25].
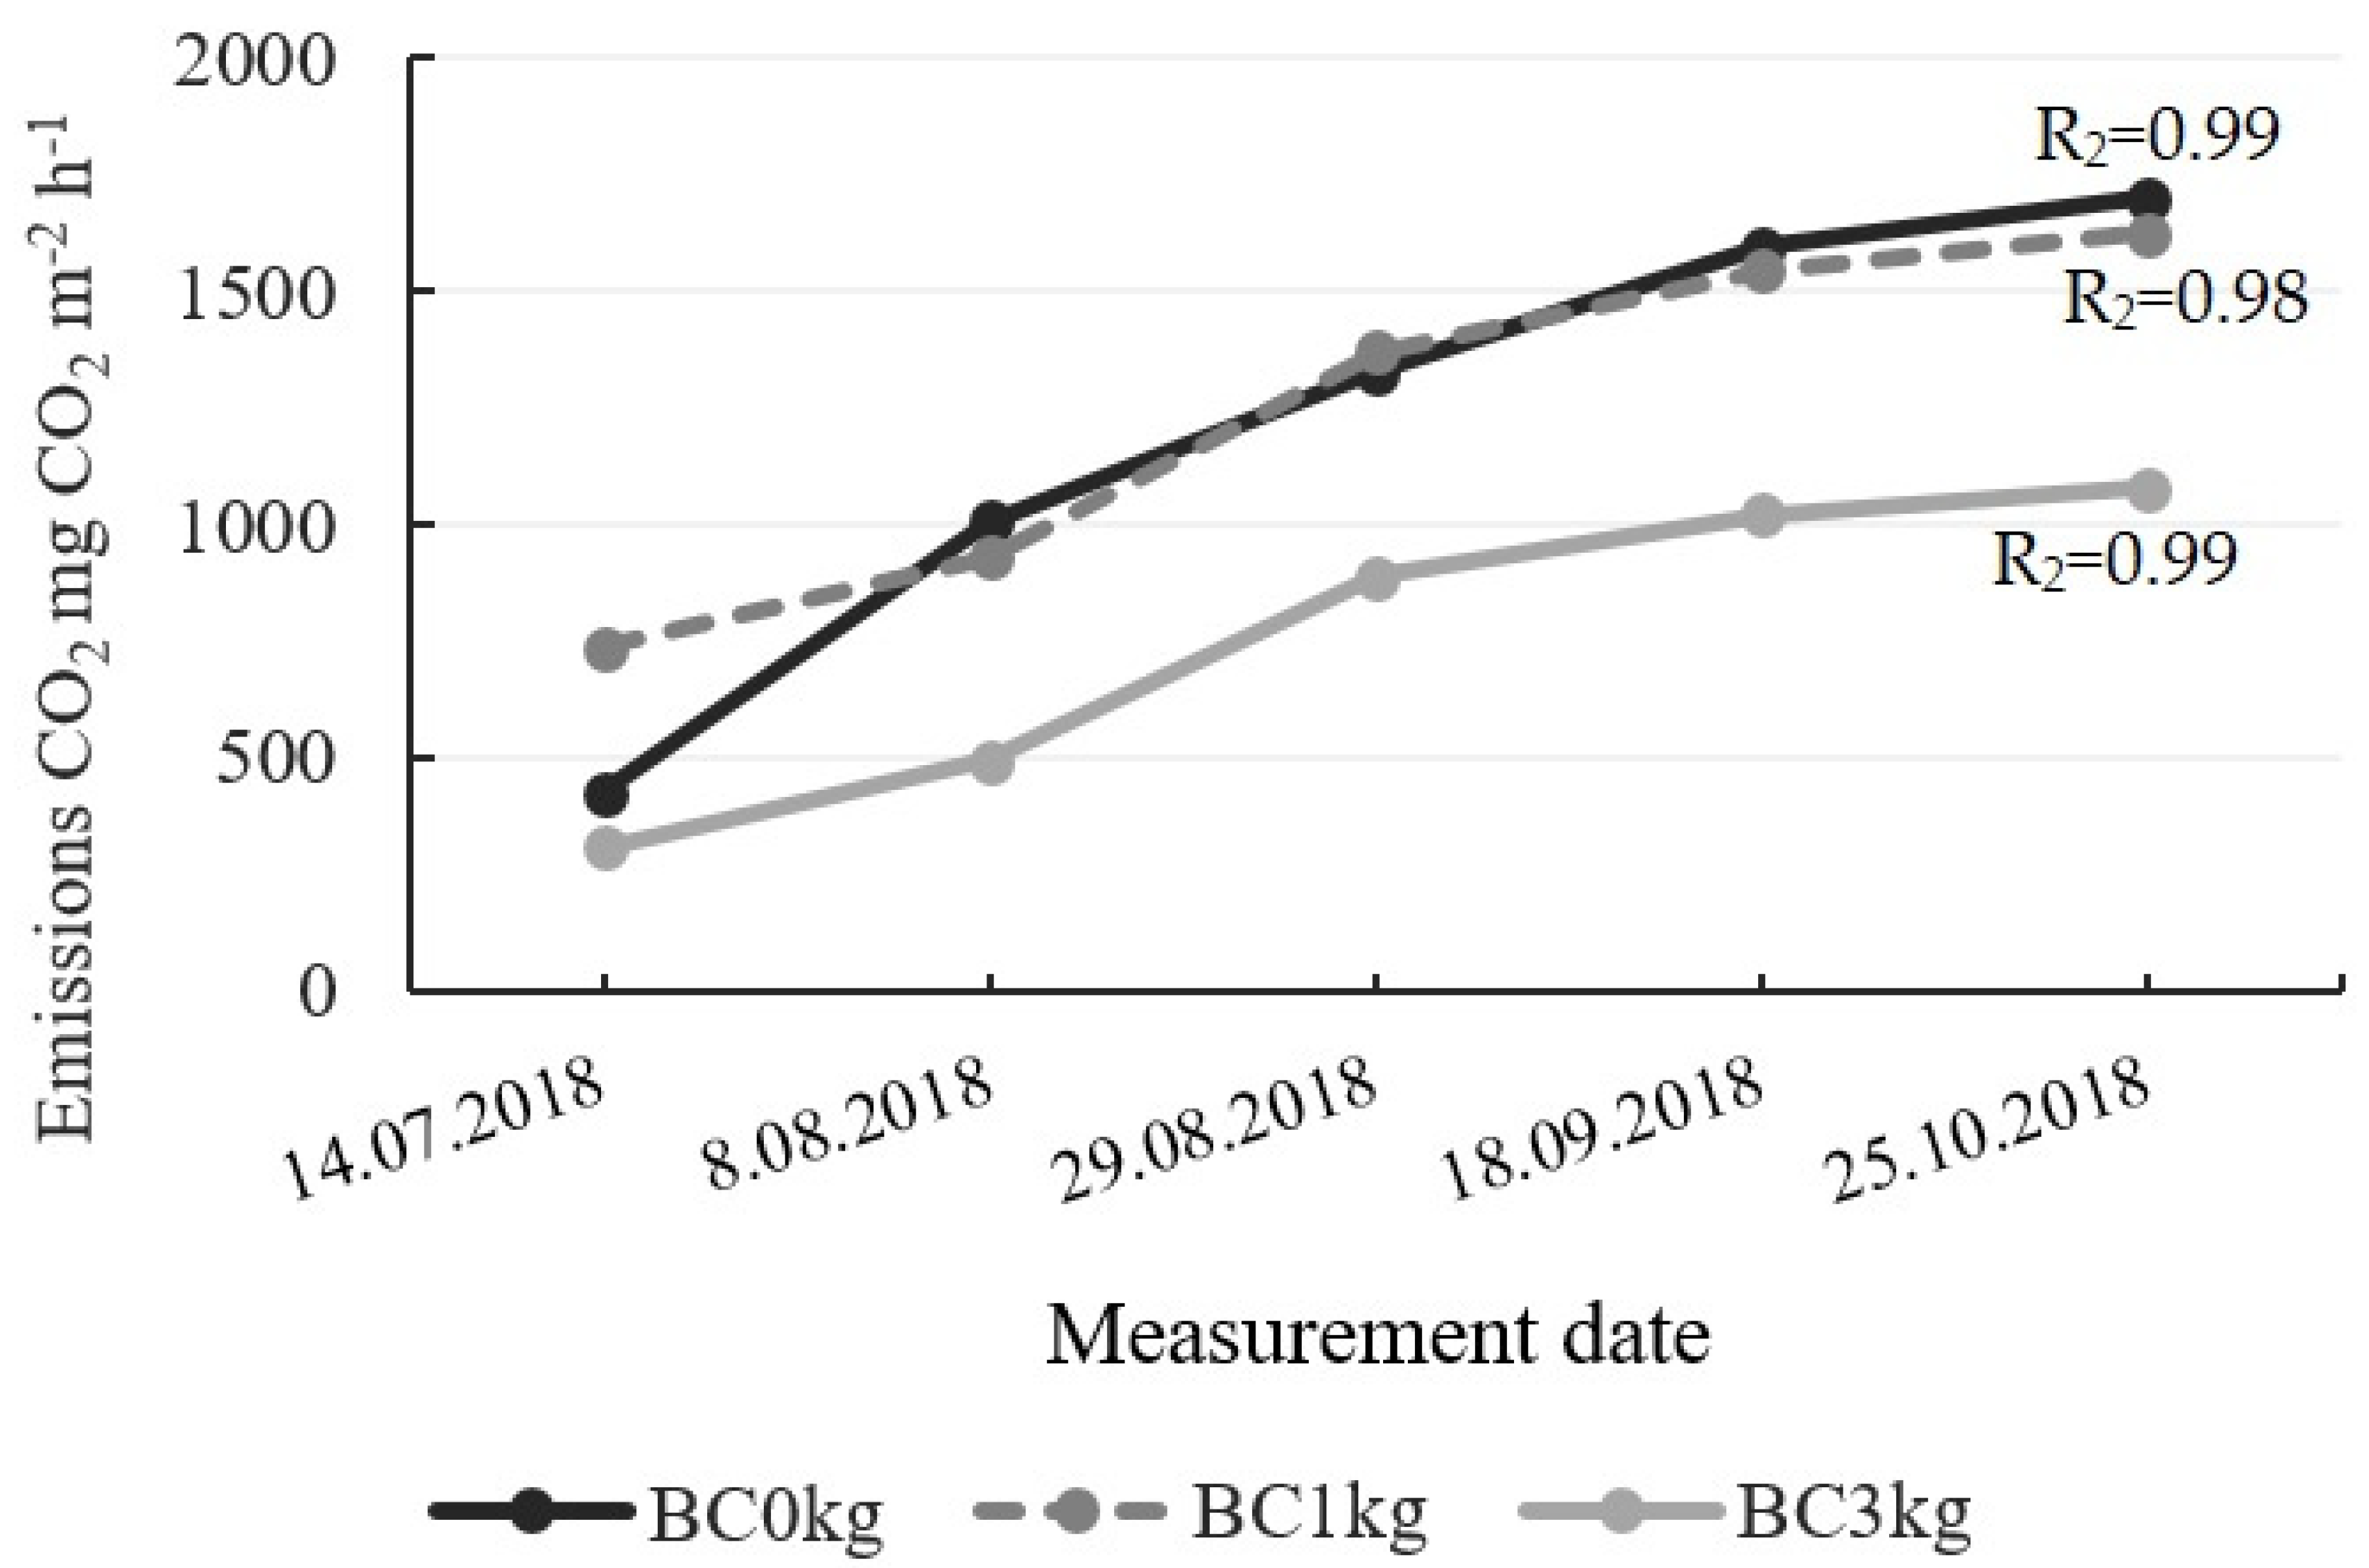
The cumulative CO
2 flux data for the growing season of 2018 showed a decrease in the CO
2 flow one month after biochar application to the soil (
Figure 3), which was in the order of 27.6% for the soil treated with 3 kg/m
2. A marked decrease in the CO
2 flux continued throughout the growing season. By the end of the growing season, the cumulative CO
2 flux in the area with a biochar application dose of 3 kg/m
2 was 1078.6 CO
2 mg m
−2 h
−1, which was 28.2% lower than the cumulative flow at the non-biochar site (1701.9 CO
2 mg m
−2 h
−1). When applying 1 kg/m
2 of biochar, the cumulative CO
2 flux was insignificant at 8.2% compared to the site without biochar and amounted to 1624.6 CO
2 mg m
−2 h
−1. In general, it is noticeable that, with an increase in the dose of biochar application, the decrease in the cumulative CO
2 flow increases.
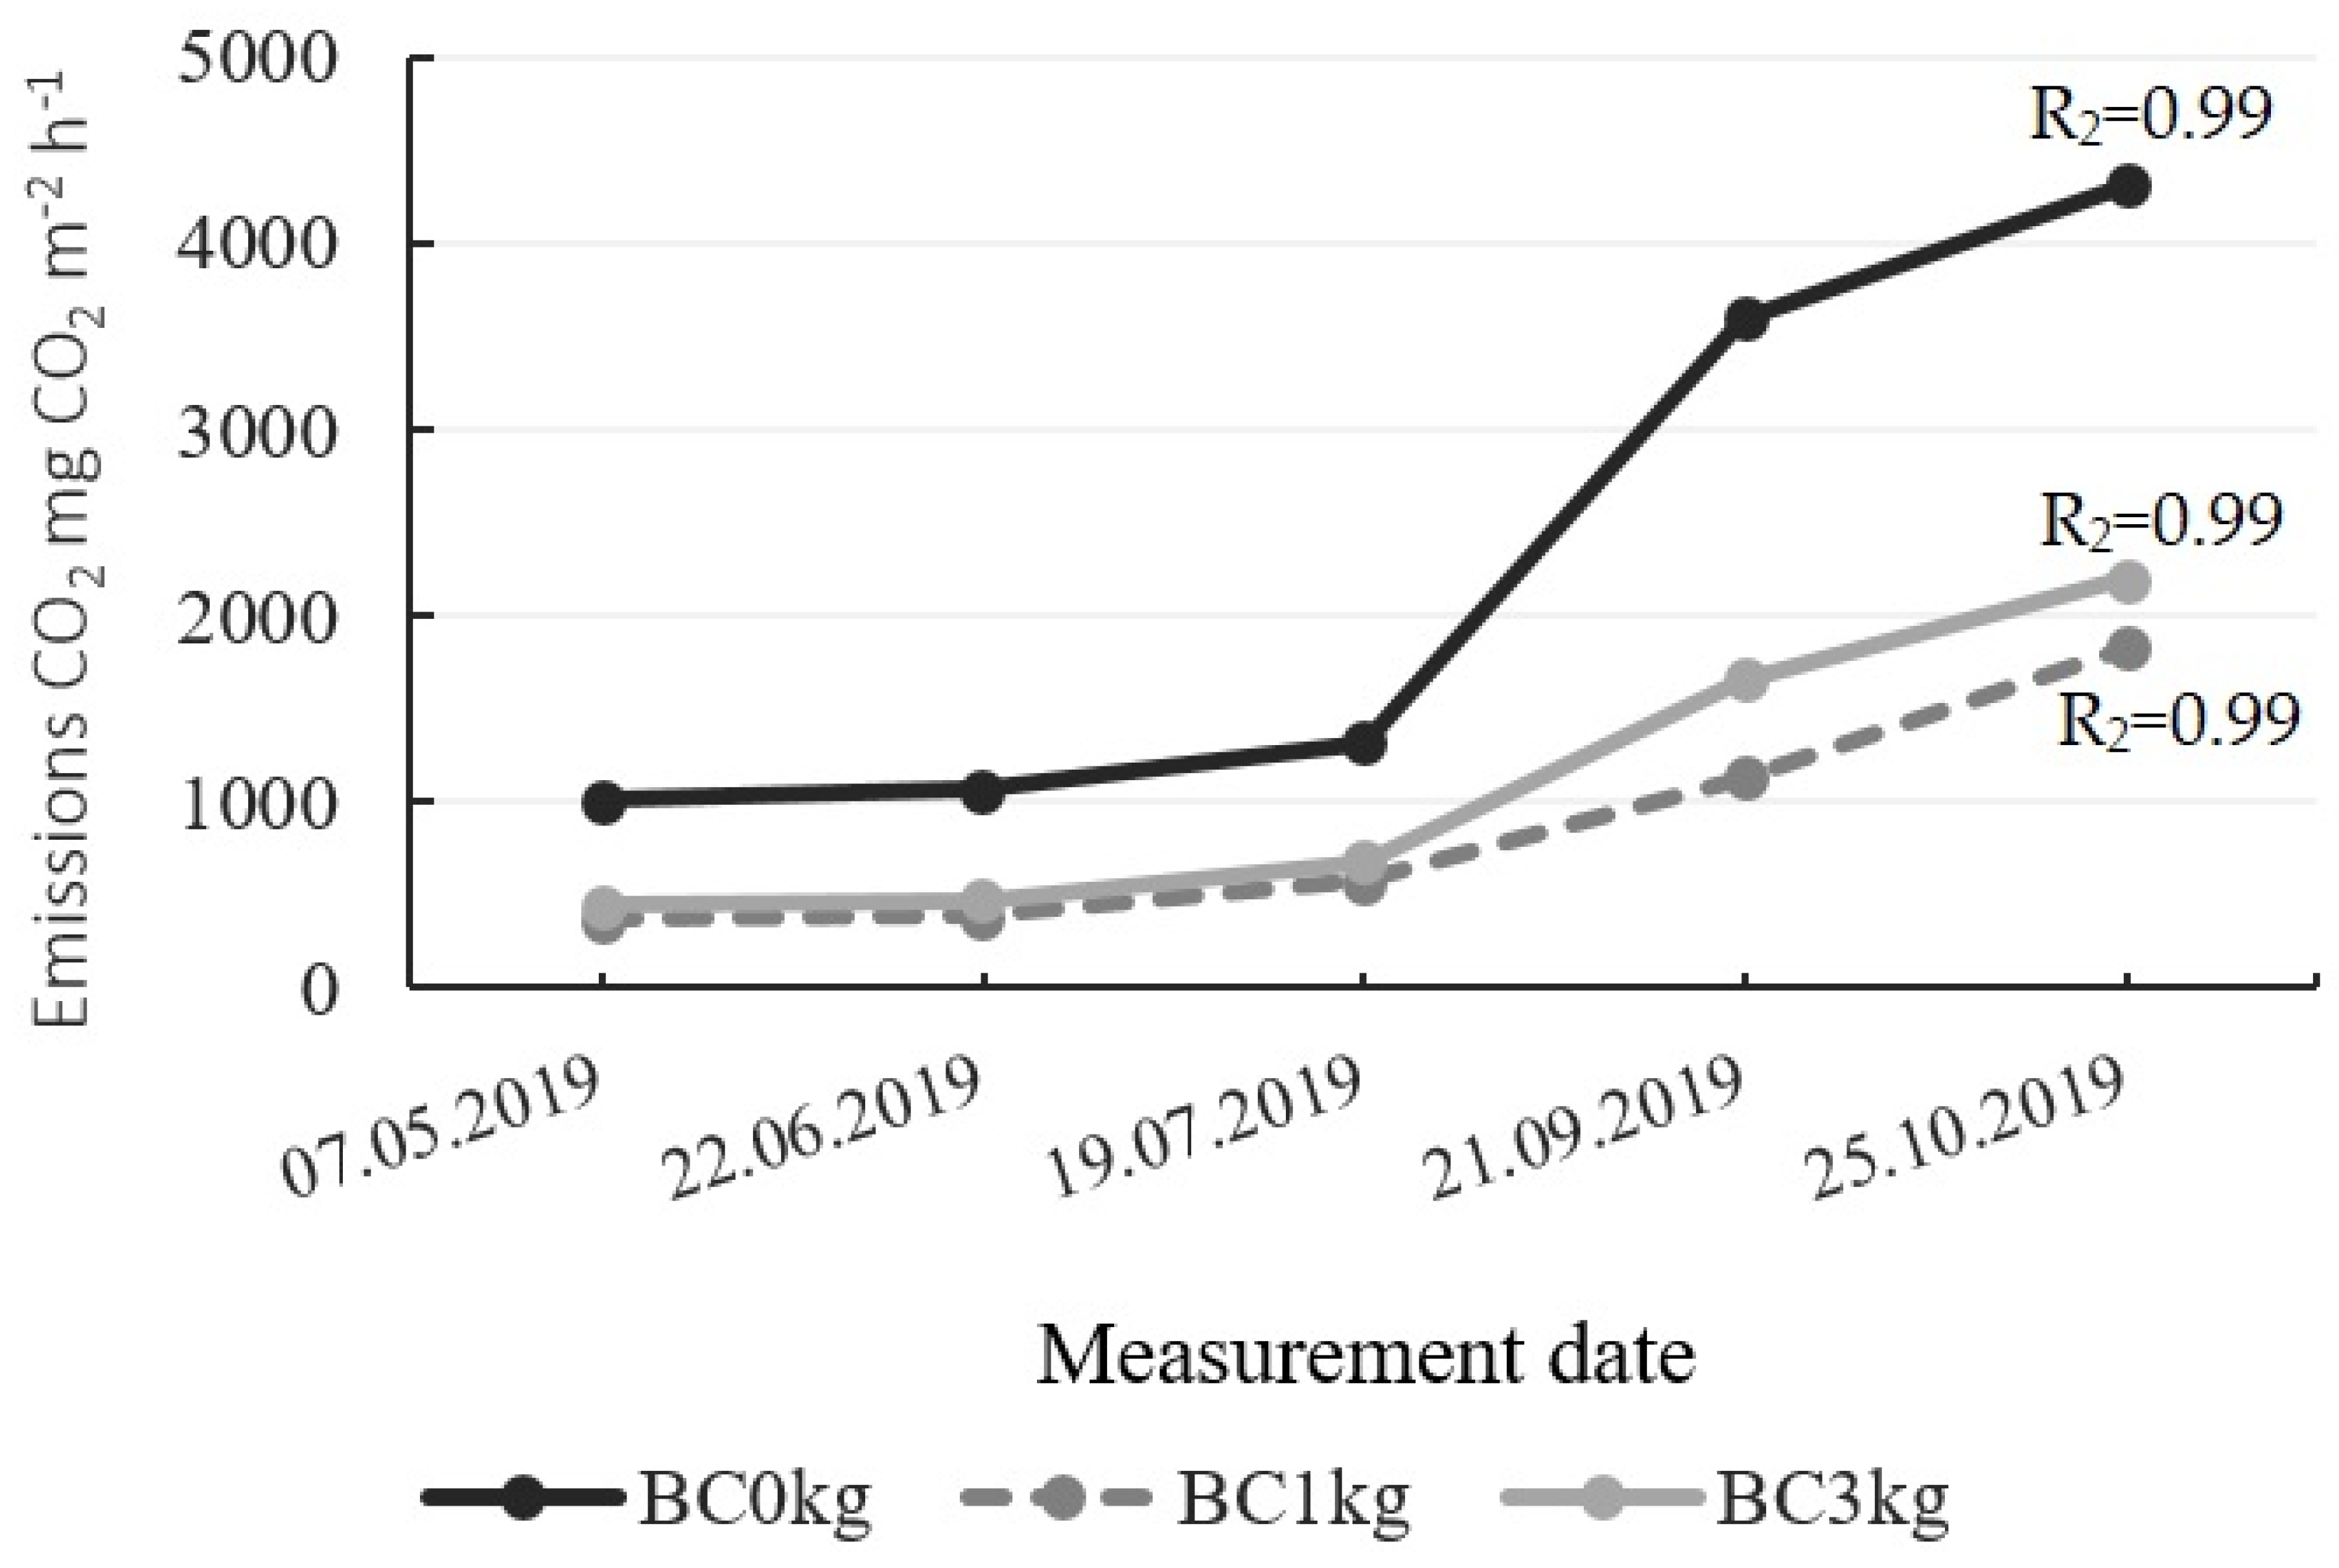
The cumulative CO
2 flow data for the 2019 growing season also showed a significant decrease in the CO
2 flow both at the beginning and at the end of the growing season (
Figure 4). At the beginning of the growing season, the application of biochar in doses of 1 kg/m
2 and 3 kg/m
2 led to a decrease in the CO
2 flow by 63.6% and 56.2%, respectively, compared to the site without the introduction of biochar. By the end of the growing season, the cumulative CO
2 flow at the biochar application dose of 1 kg/m
2 was 1828.7 CO
2 mg m
−2 h
−1, which was 57.7% lower than the cumulative flow at the site without biochar application (4318.2 CO
2 mg m
−2 h
−1). At the site with a biochar application dose of 3 kg/m
2, the cumulative CO
2 flux was 2200.2 CO
2 mg m
−2 h
−1, which was 49% lower than the cumulative flux at the site without biochar application. Despite the fact that there is a significant decrease in the CO
2 flow when applying biochar during the growing season of 2019, these decreases are different from the results shown for the growing season of 2018. First, the value of the cumulative CO
2 flow at the control site in soybean cultivation is more than twice the value of the cumulative CO
2 flow in cabbage cultivation. This fact can be explained by an increase in microbiological activity caused by the presence of a much larger number of root hairs in soybeans, around which a favorable environment for the vital activity of soil microorganisms is created. Secondly, as mentioned above, the growing season of 2019 was abnormally wet. Only in August 2019, the amount of precipitation was comparable to the average annual precipitation during the growing season. Such moistening could lead to unpredictable results in all soil indicators, possibly increasing the resulting numbers.
Granulometric composition in soil have poor water-air characteristics. We study that biochar has a good pore structure and good sorption properties. Therefore, we assume that the decrease in the CO2 flux was associated with an improvement in soil water-air conditions during the introduction of biochar. The improvement of soil water-air conditions should have led to an increase in the activity of soil microorganisms, and therefore to an increase in the amount of CO2 emissions from the soil released during the respiration of microorganisms. Nevertheless, according to the obtained data on the cumulative CO2 flow during the two growing seasons, two assumptions can be made. The first is that the introduction into the soil with a heavy granulometric composition improves the water-air conditions of the soil and increases the microbiological activity, but the increase in microbiological activity leads to a significant increase in the rate of carbon fixation in the soil mass or the composition of plant material. Second, the introduction of biochar improves the water-air properties, but there is no significant increase in microbiological activity. Then, in this case, the reduction of the CO2 flow is possible due to the removal of carbon by water runoff or its fixation on the surface of the pores of the biochar.
We suggested that a reduction in the CO
2 flux due to carbon fixation in the soil mass or plant biomass, when applying biochar, is more plausible. It is known that, under optimal environmental conditions, carbon balance is maintained in the soil, that is, there is a cycle. Based on this, it is logical to assume that, when the carbon content decreases in one part of the cycle, it increases in the other. Thus, when the CO
2 flow decreases, the carbon contained in the carbon dioxide molecule must either remain in the soil as soil organic matter, the biomass of soil microorganisms, or in the soil pore space, or pass into the biomass of plants. For example, an increase in the yield of corn and wheat by 28% and 13%, respectively, compared with the control, was revealed in the study of Salar F. Abriz et al. [
26]. The introduction of 2% biochar increased the yield of purple peristochetum (
Pennisetum Pur-pureum Schumach) by 61% and by 82% with the introduction of 4% biochar compared with the control [
27].
As mentioned above, during the growing season of 2018, white cabbage was grown in the studied areas. As a result of comparing the biomass of cabbage and the cumulative CO
2 flow, it was concluded that, when the cumulative CO
2 flow decreases, the plant biomass increases (
Table 1). For example, in the area without biochar, where the maximum value of the cumulative CO
2 flow was recorded, the lowest value was both the total biomass of cabbage from the site and the average biomass of one unit. At the site with a dose of 3 kg/m
2 of biochar, the lowest value of the cumulative CO
2 flux corresponded to the highest value of the cabbage biomass.
According to the data for the growing season of 2019, despite the fact that the introduction of biochar reduced the cumulative CO2 flow, no correlation was found between the soybean biomass and the cumulative CO2 flow. There was no significant difference in the soybean biomass when applying different doses of biochar. Probably, the lack of correlations is associated with abnormally wet conditions during this growing season.


 ,
, 


