
Cow Manure Application Cuts Chemical Phosphorus Fertilizer Need in Silage Rice in Japan

Abstract
:1. Introduction
2. Materials and Methods
2.1. Study Site
2.2. Experimental Design
2.3. Crop Management, Growth Check, and Sampling
2.4. Chemical Analysis
2.5. Calculation of PPB
2.6. Statistical Analysis
3. Results
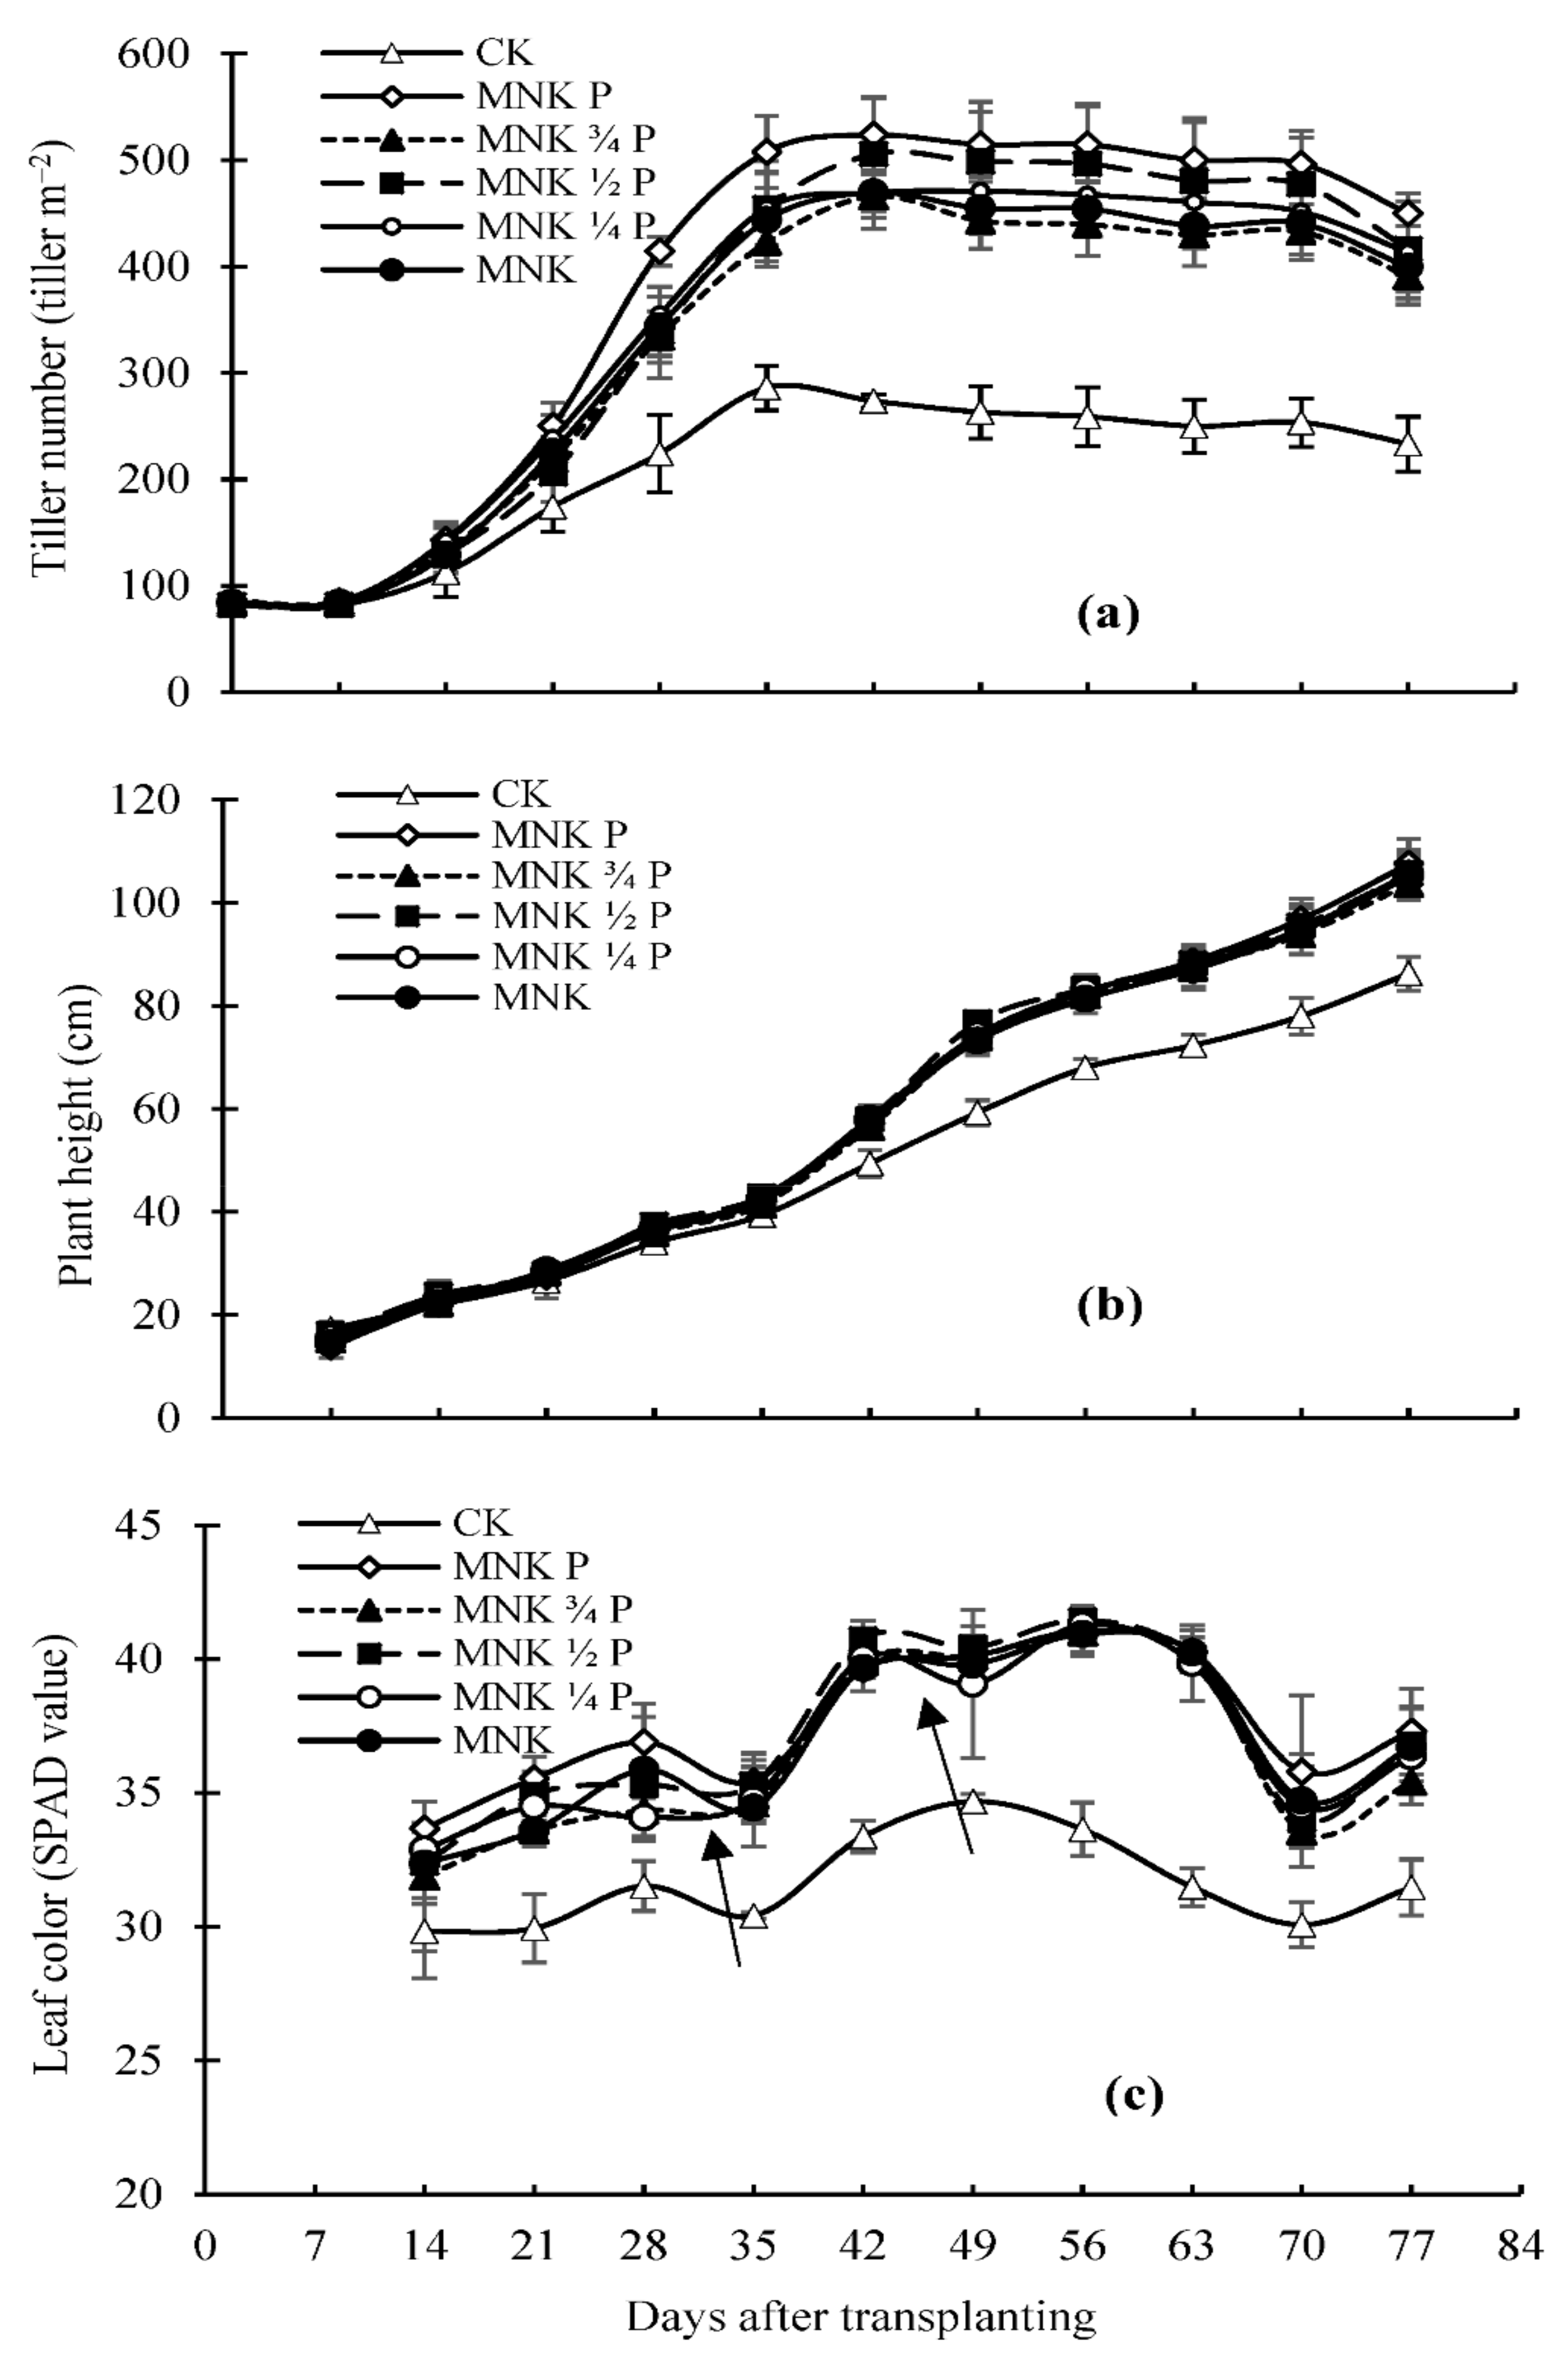
3.1. Rice Growth
3.2. Yield Components, Grain Yield, and Straw Yield
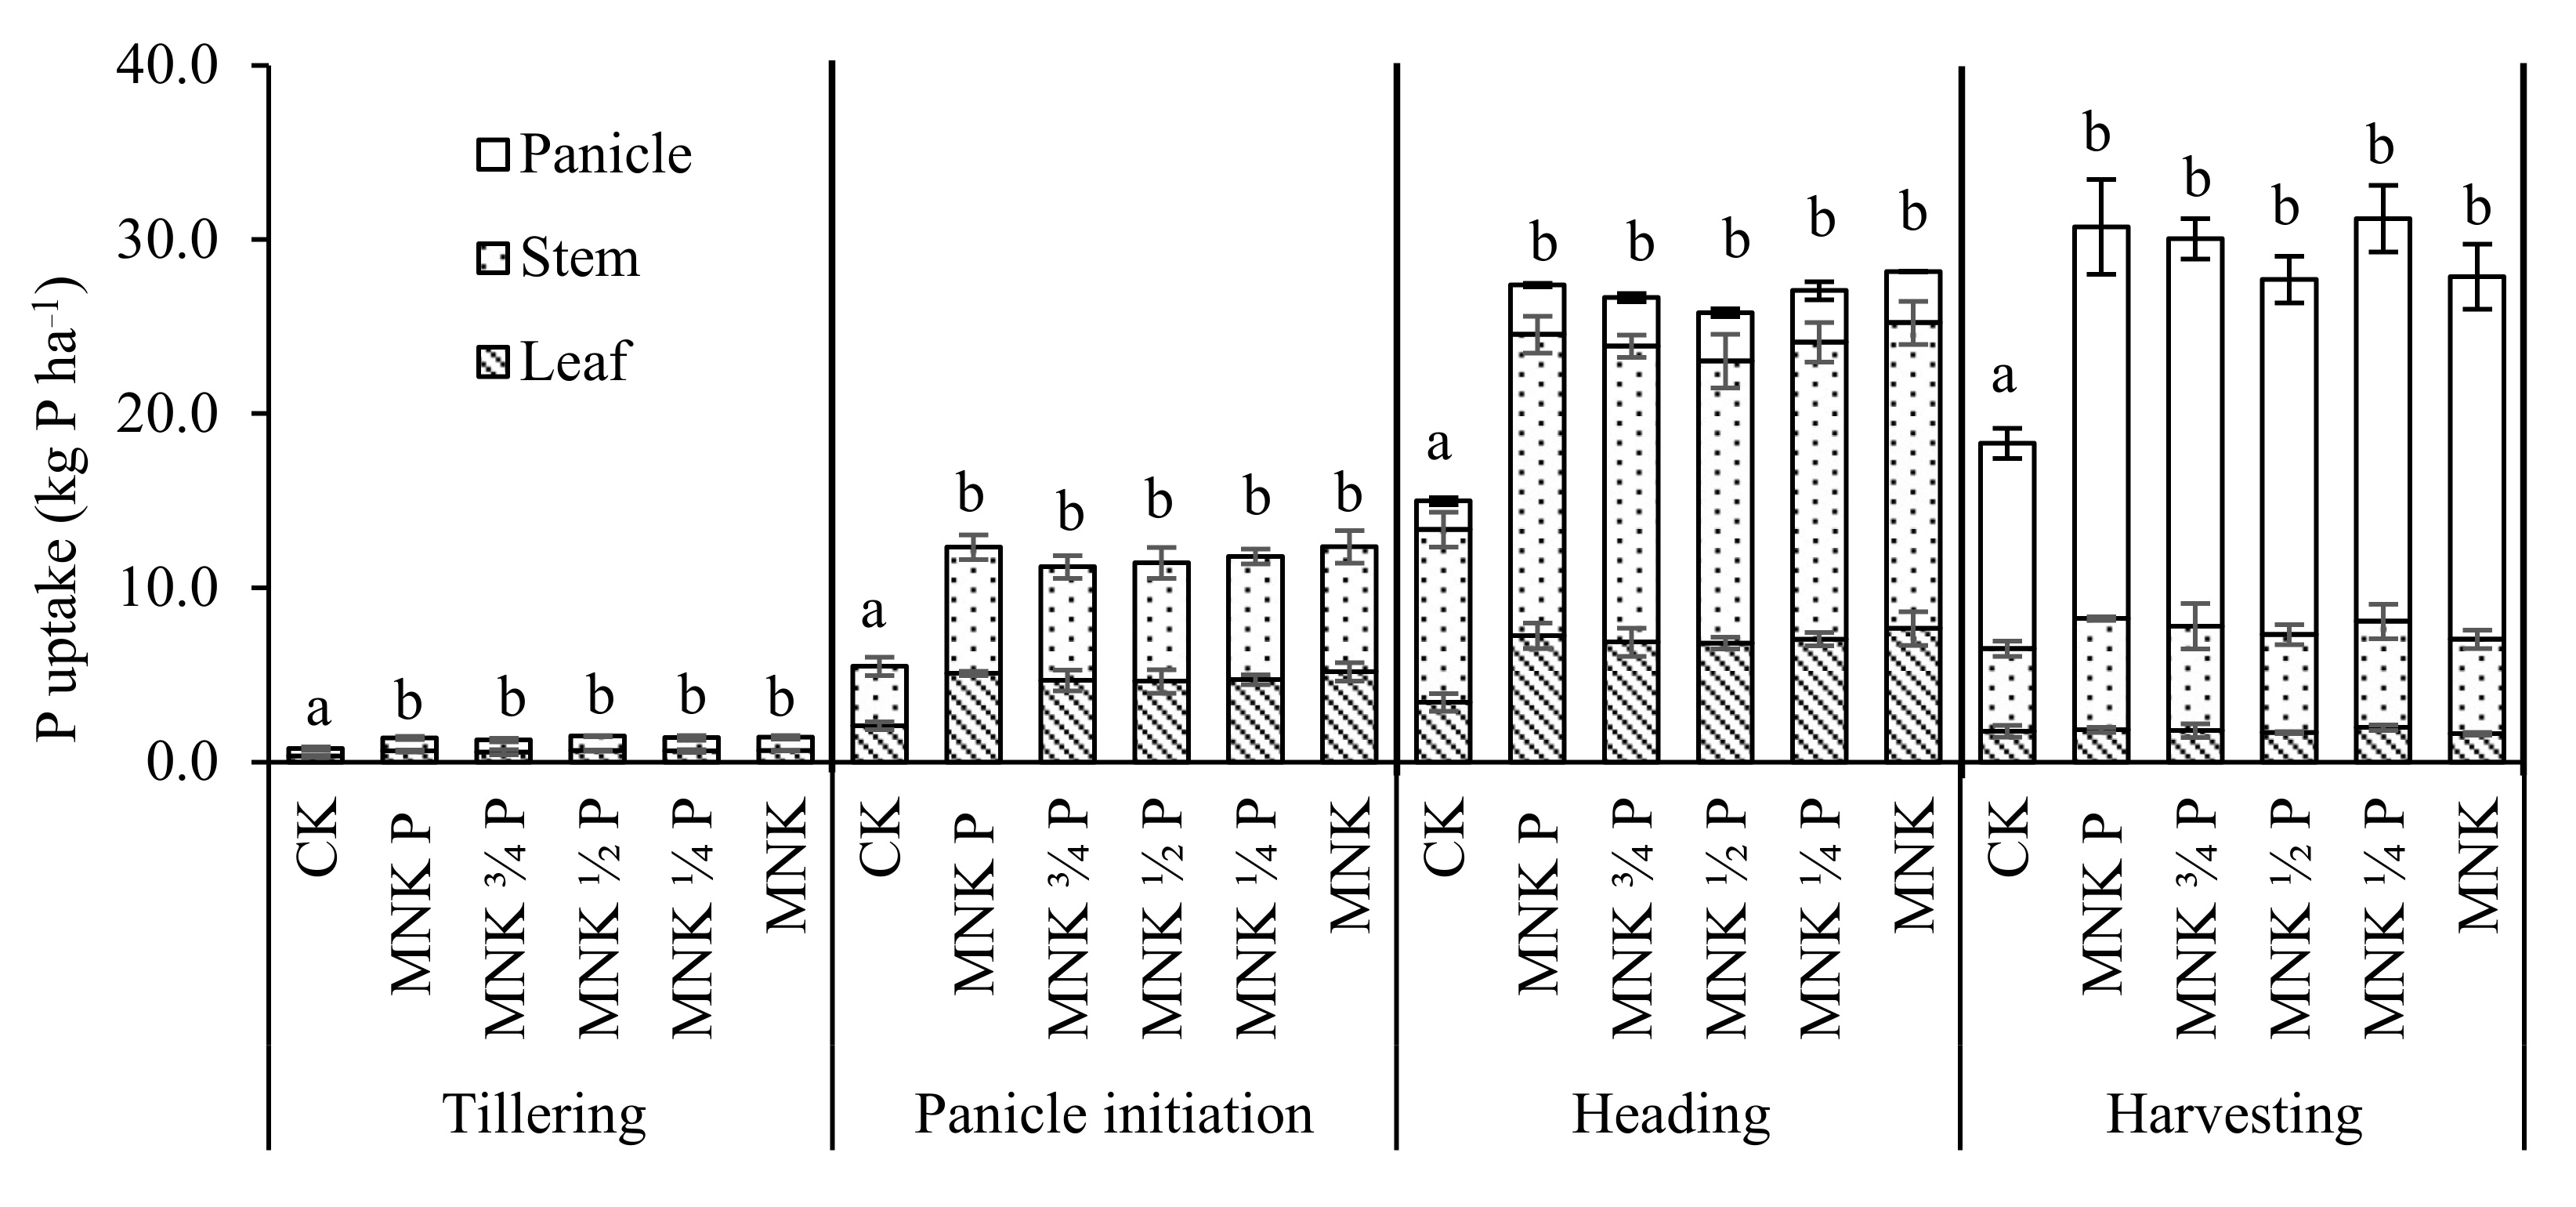
3.3. Plant P Uptake
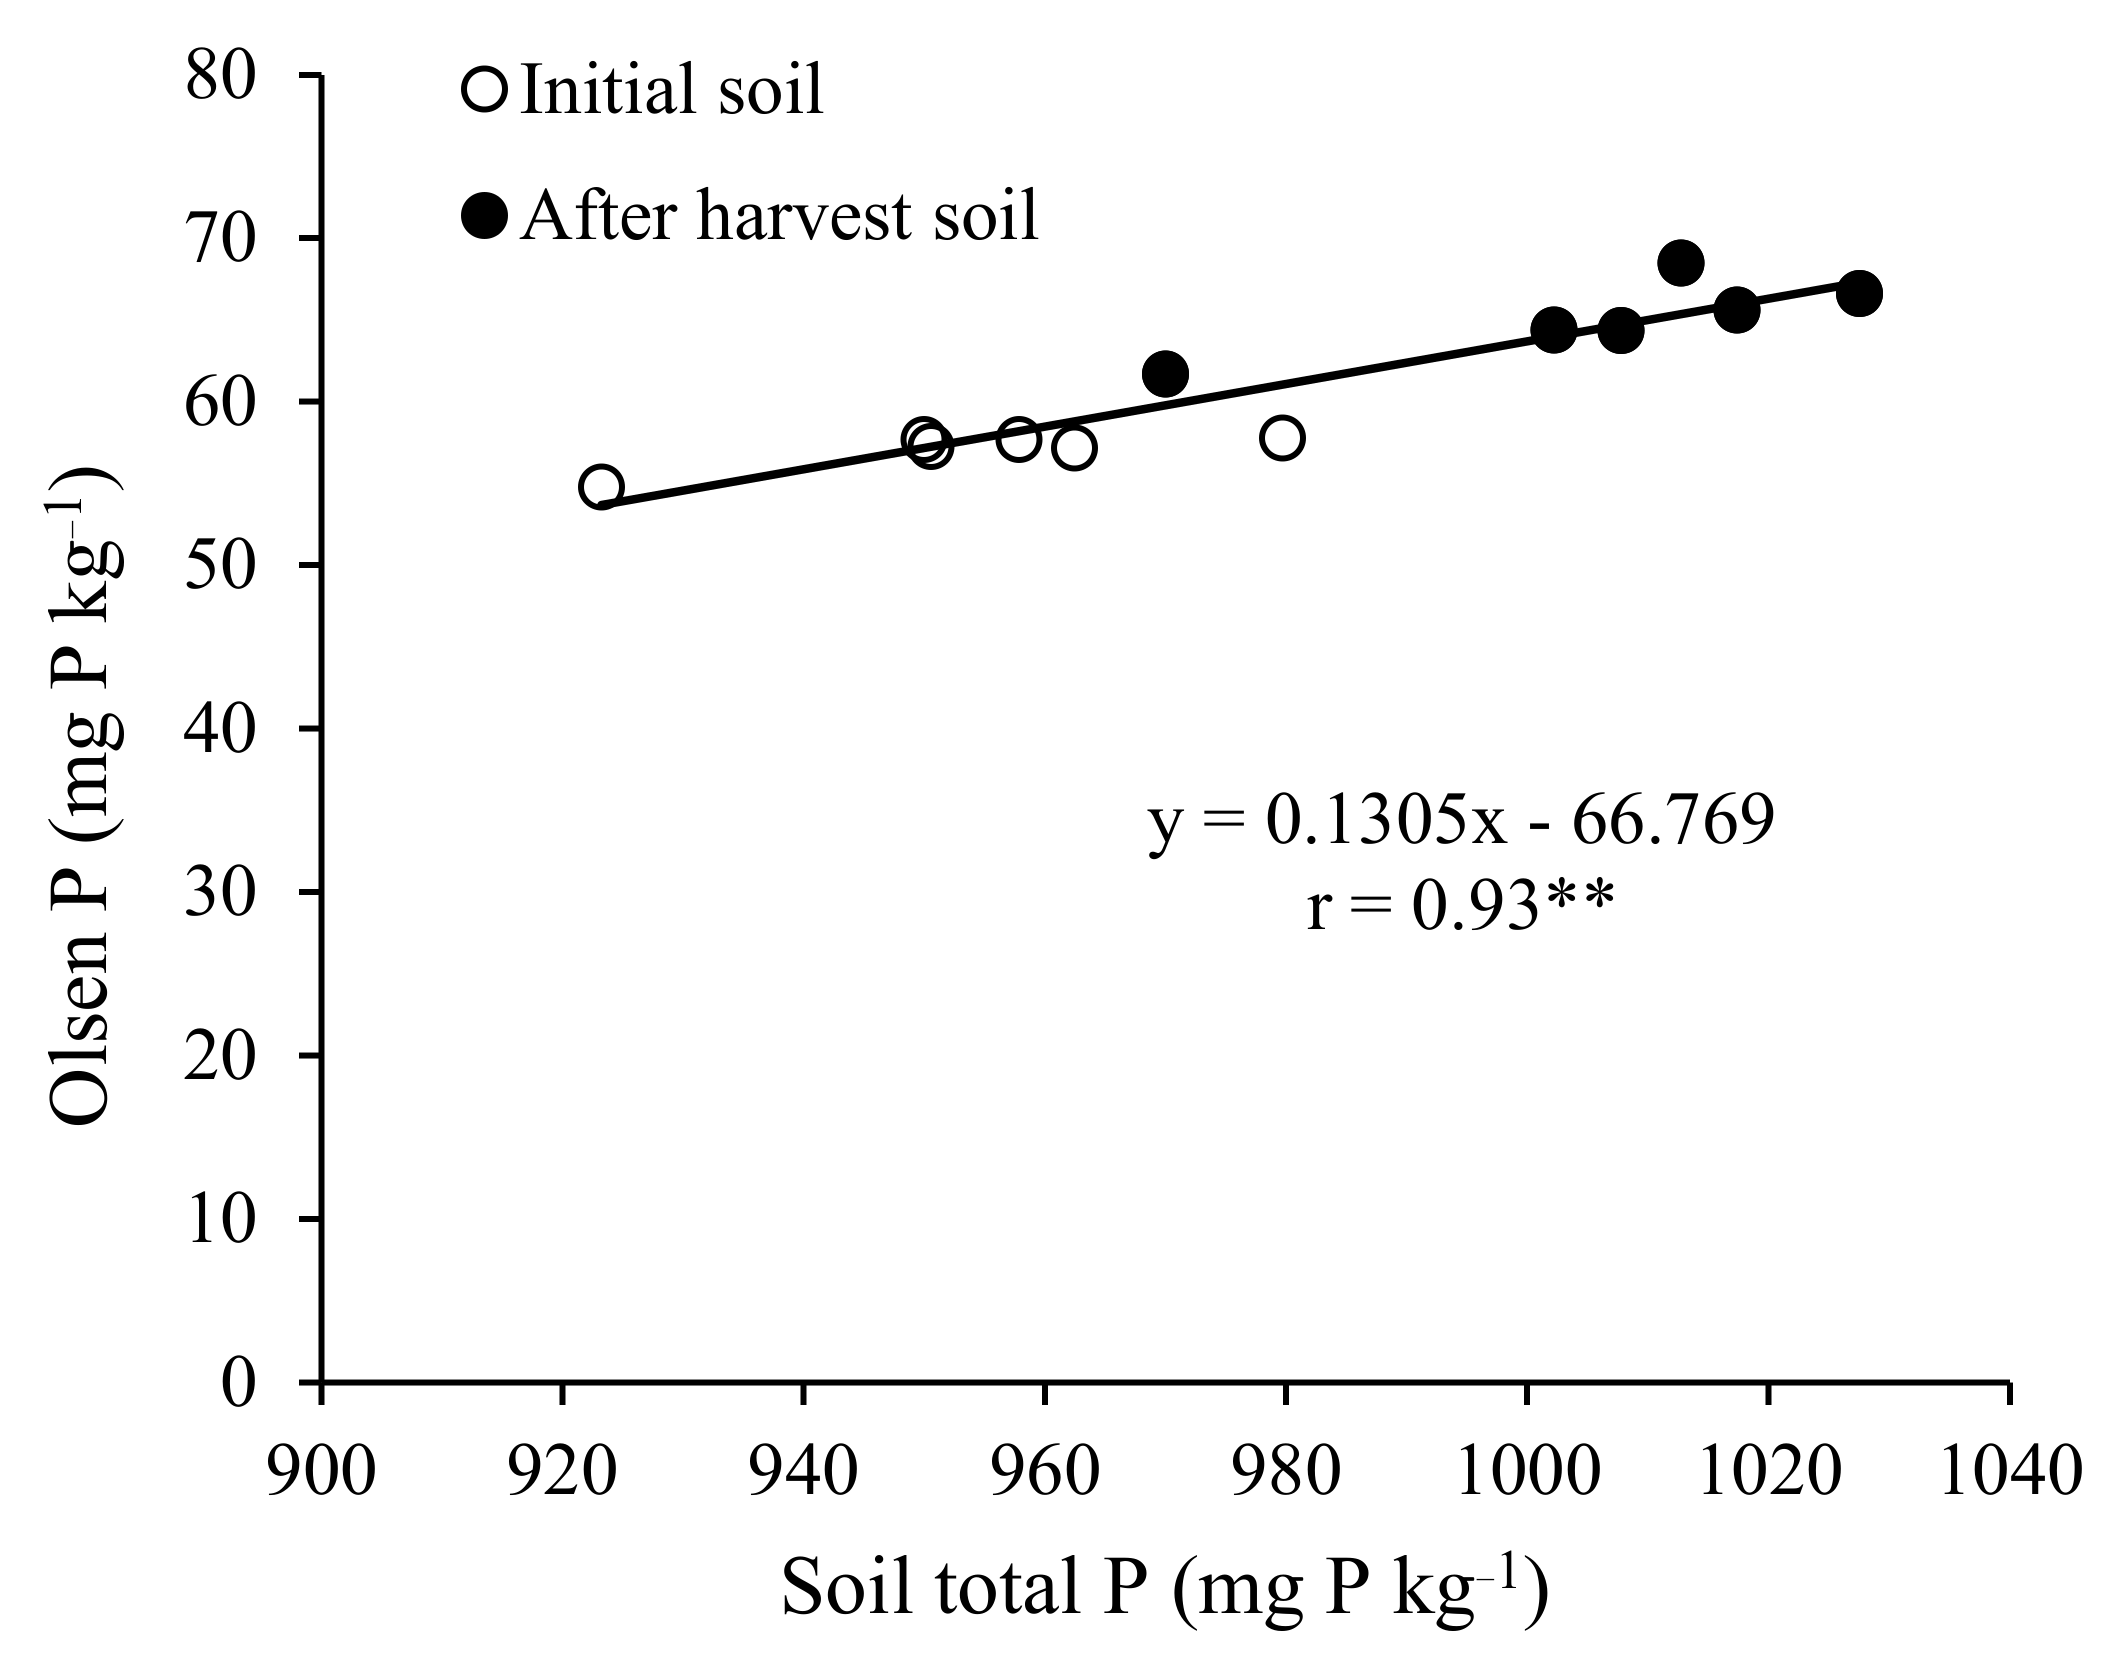
3.4. Olsen P and Soil Total P
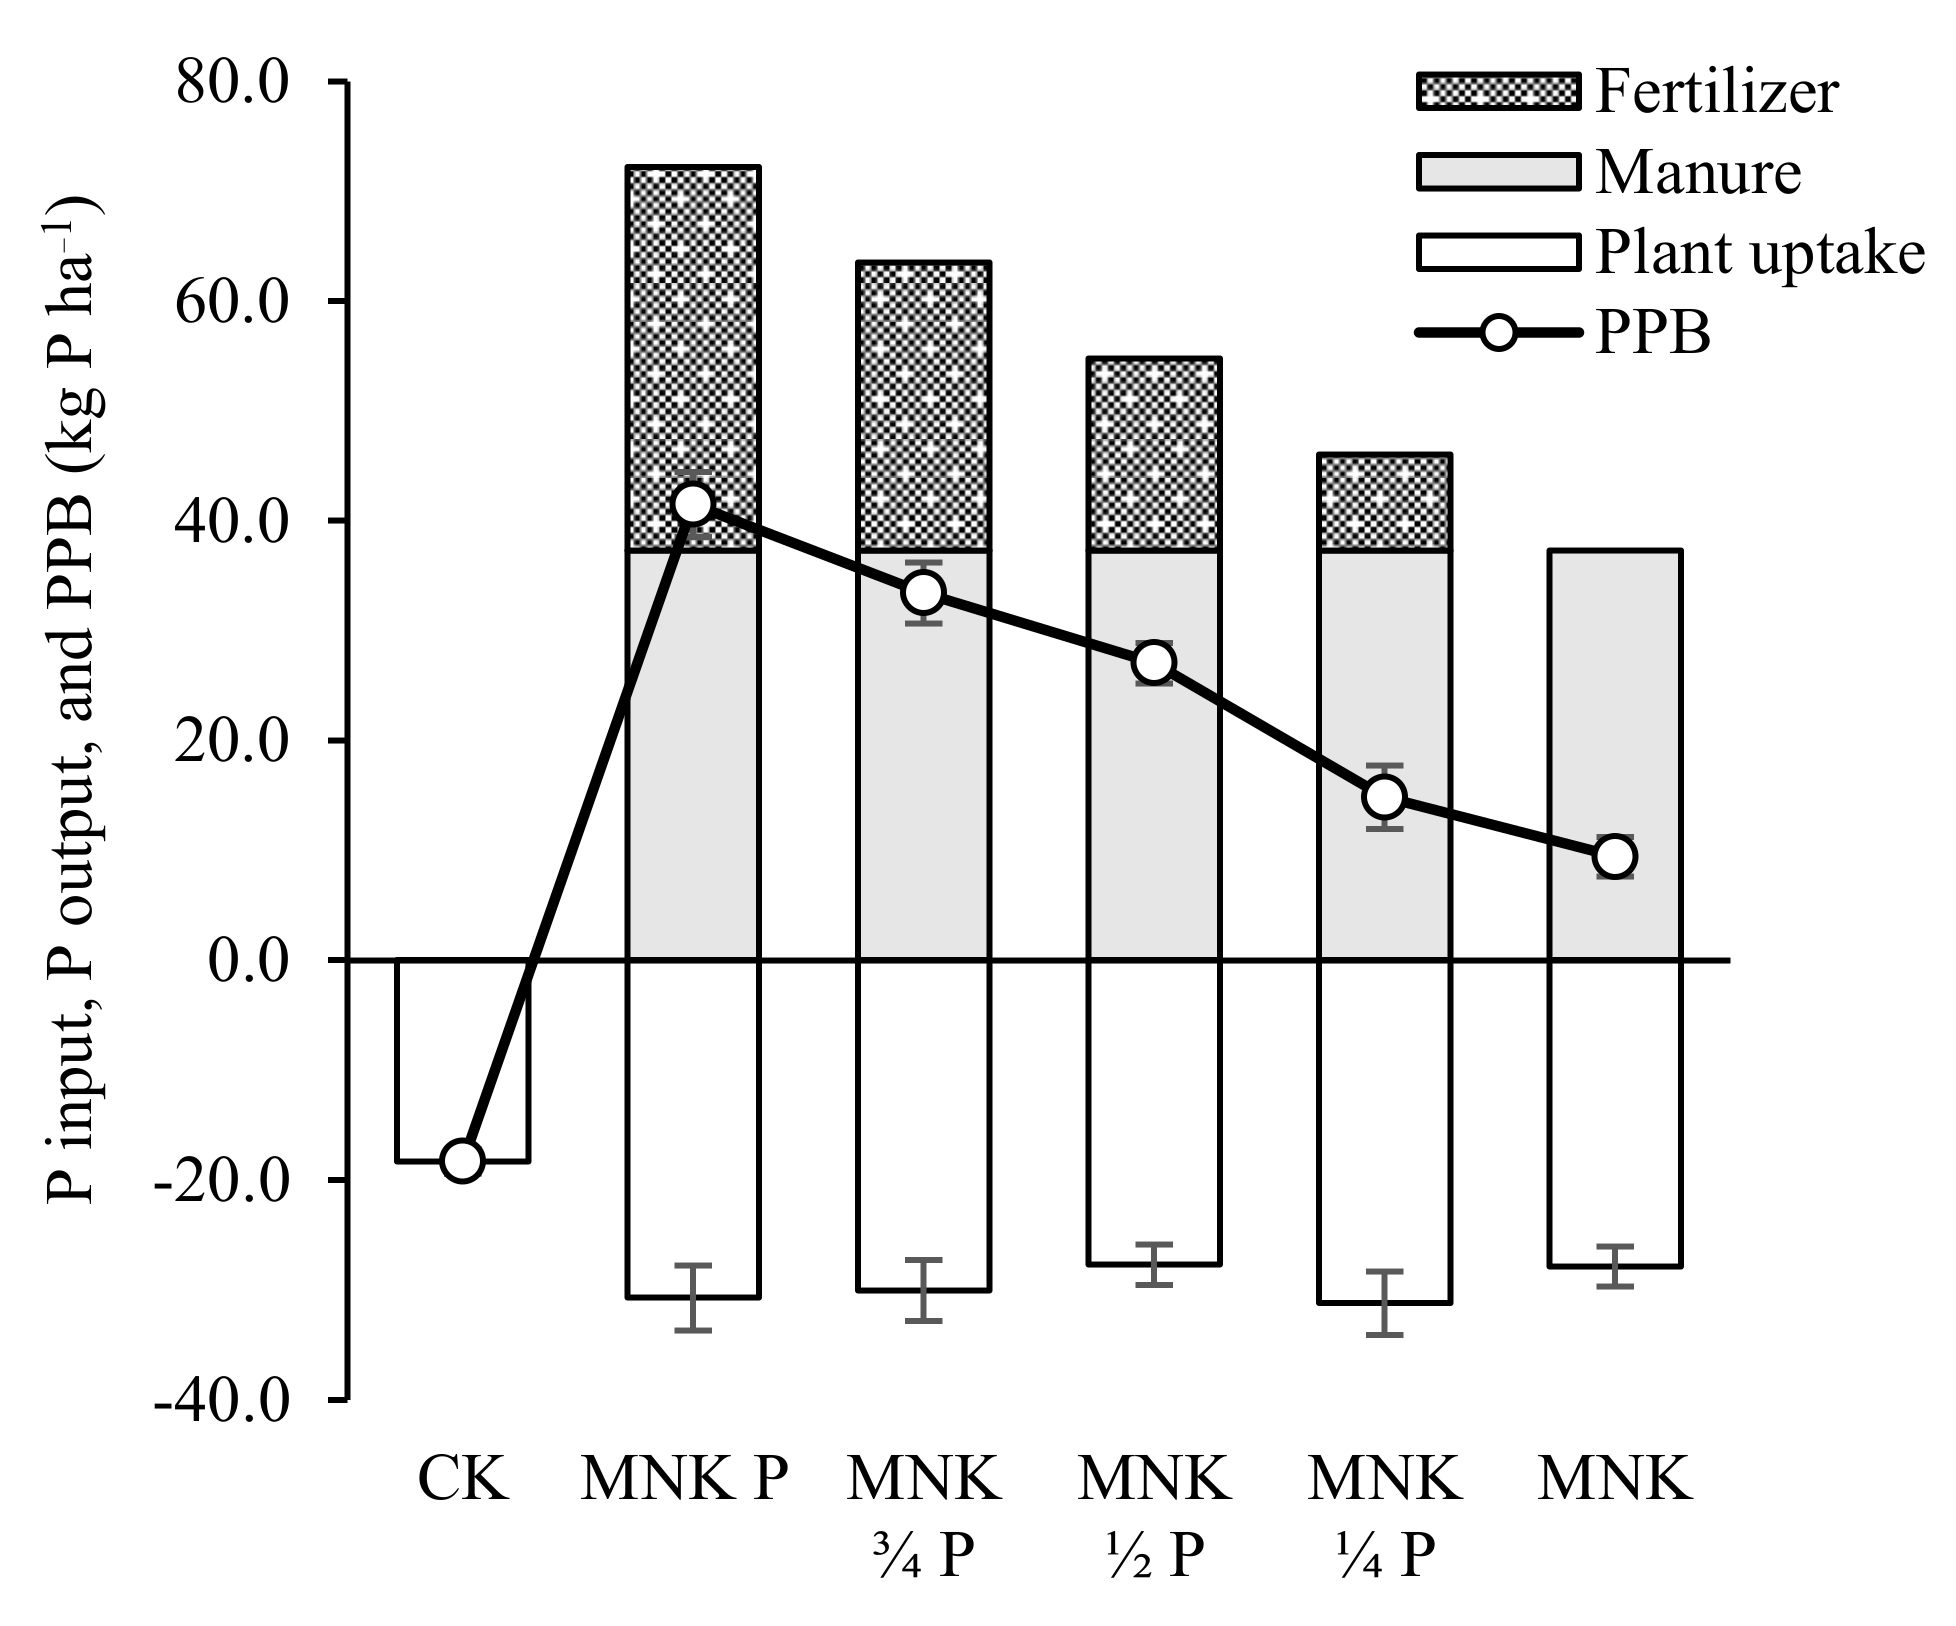
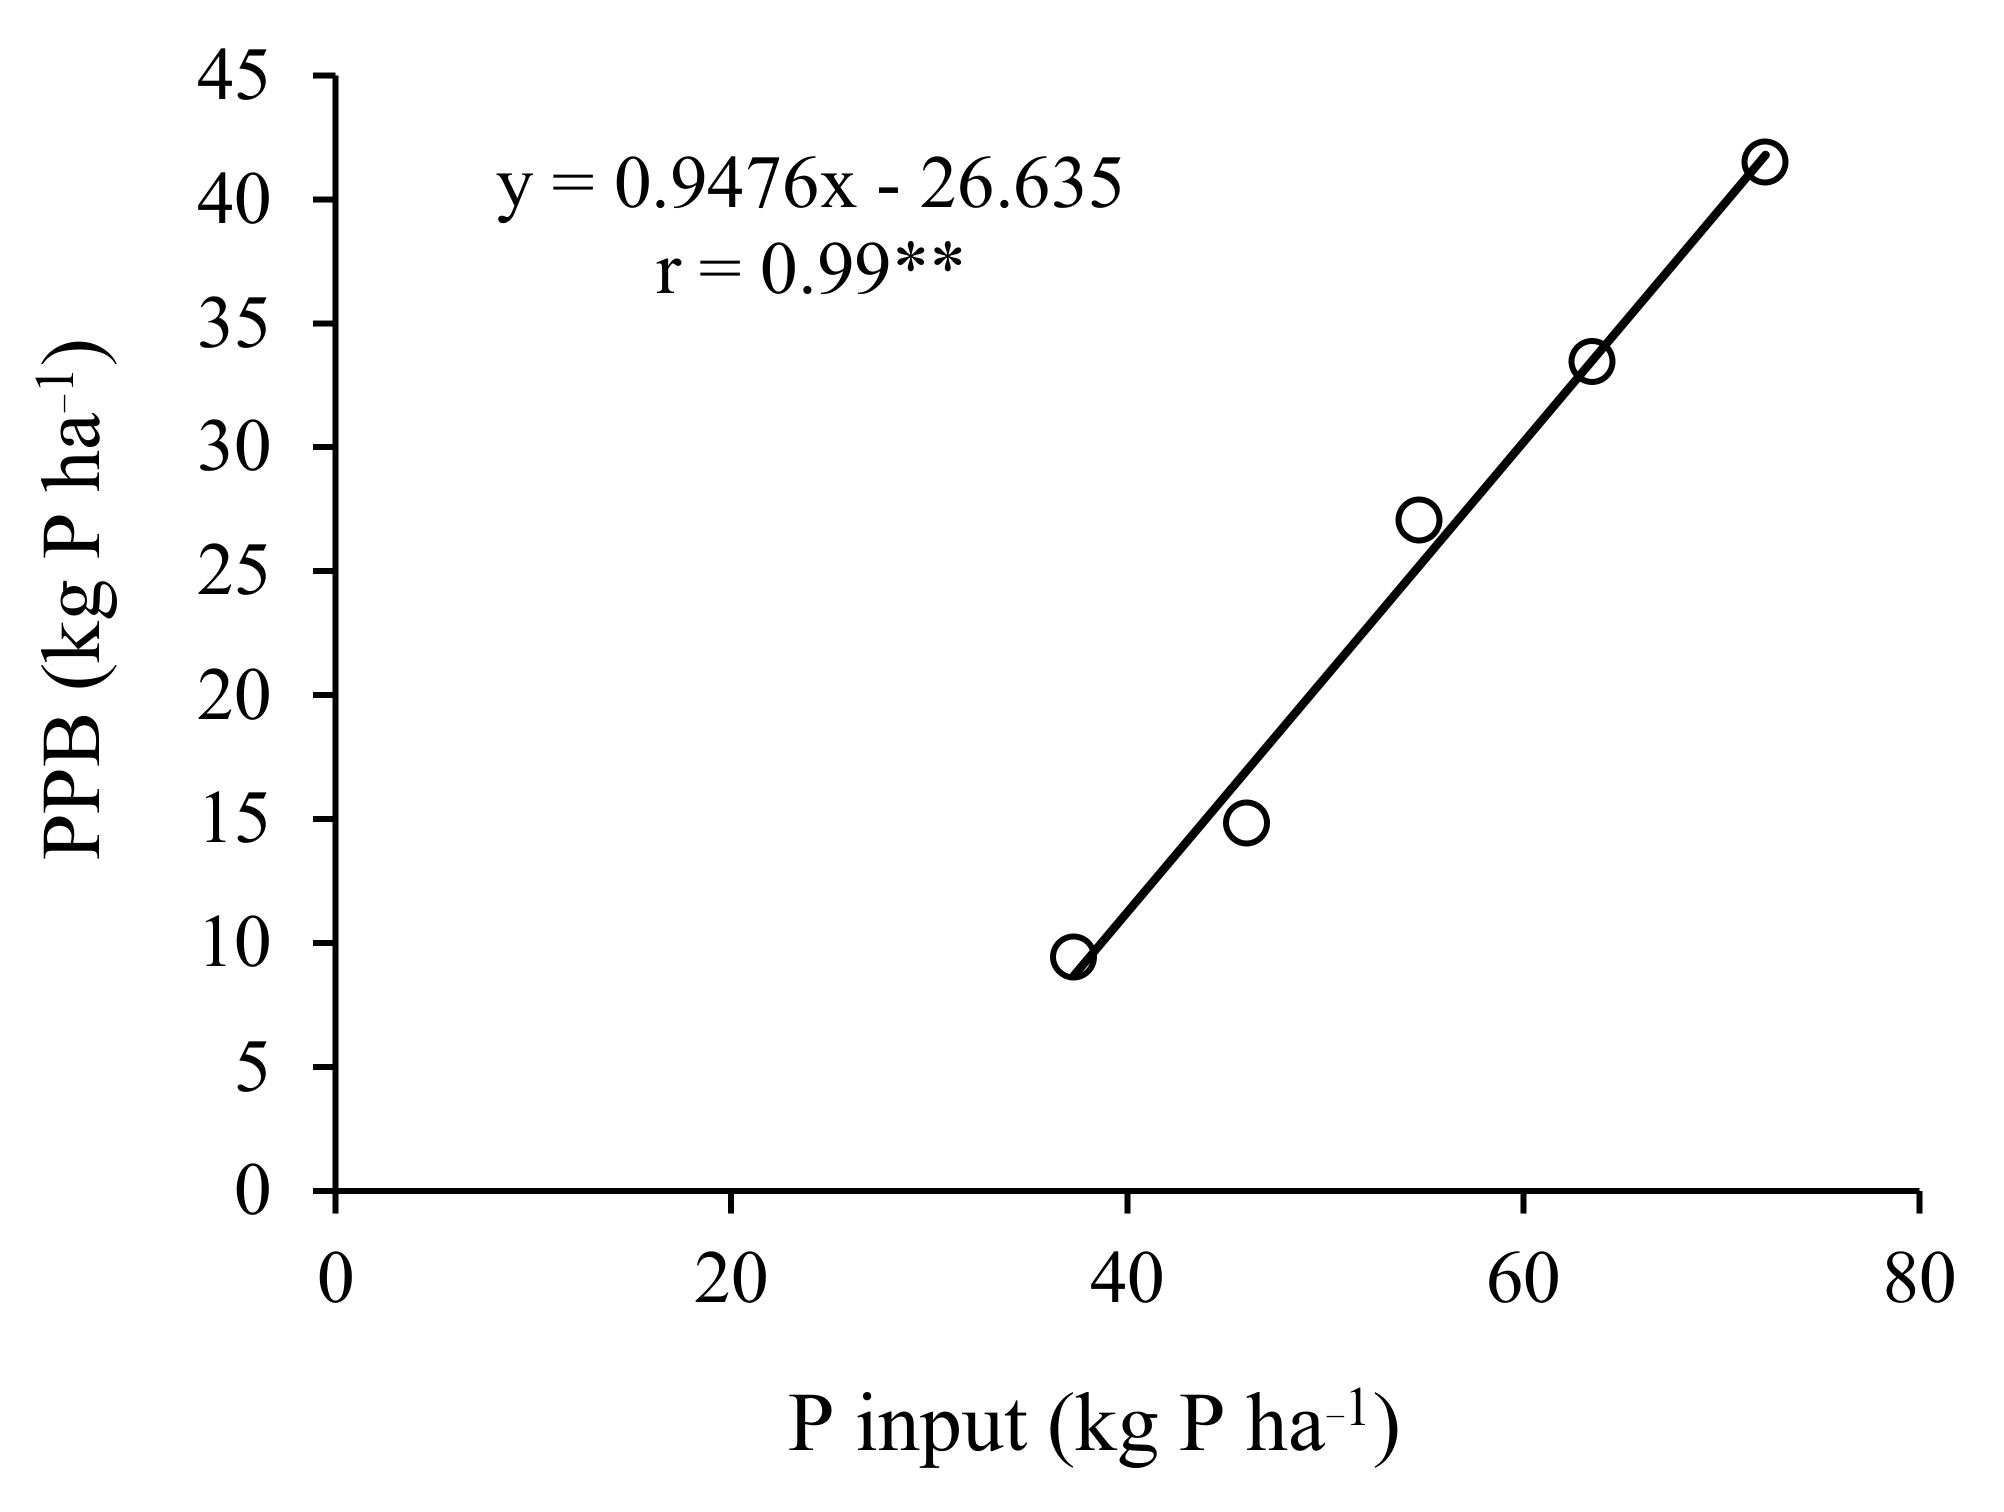
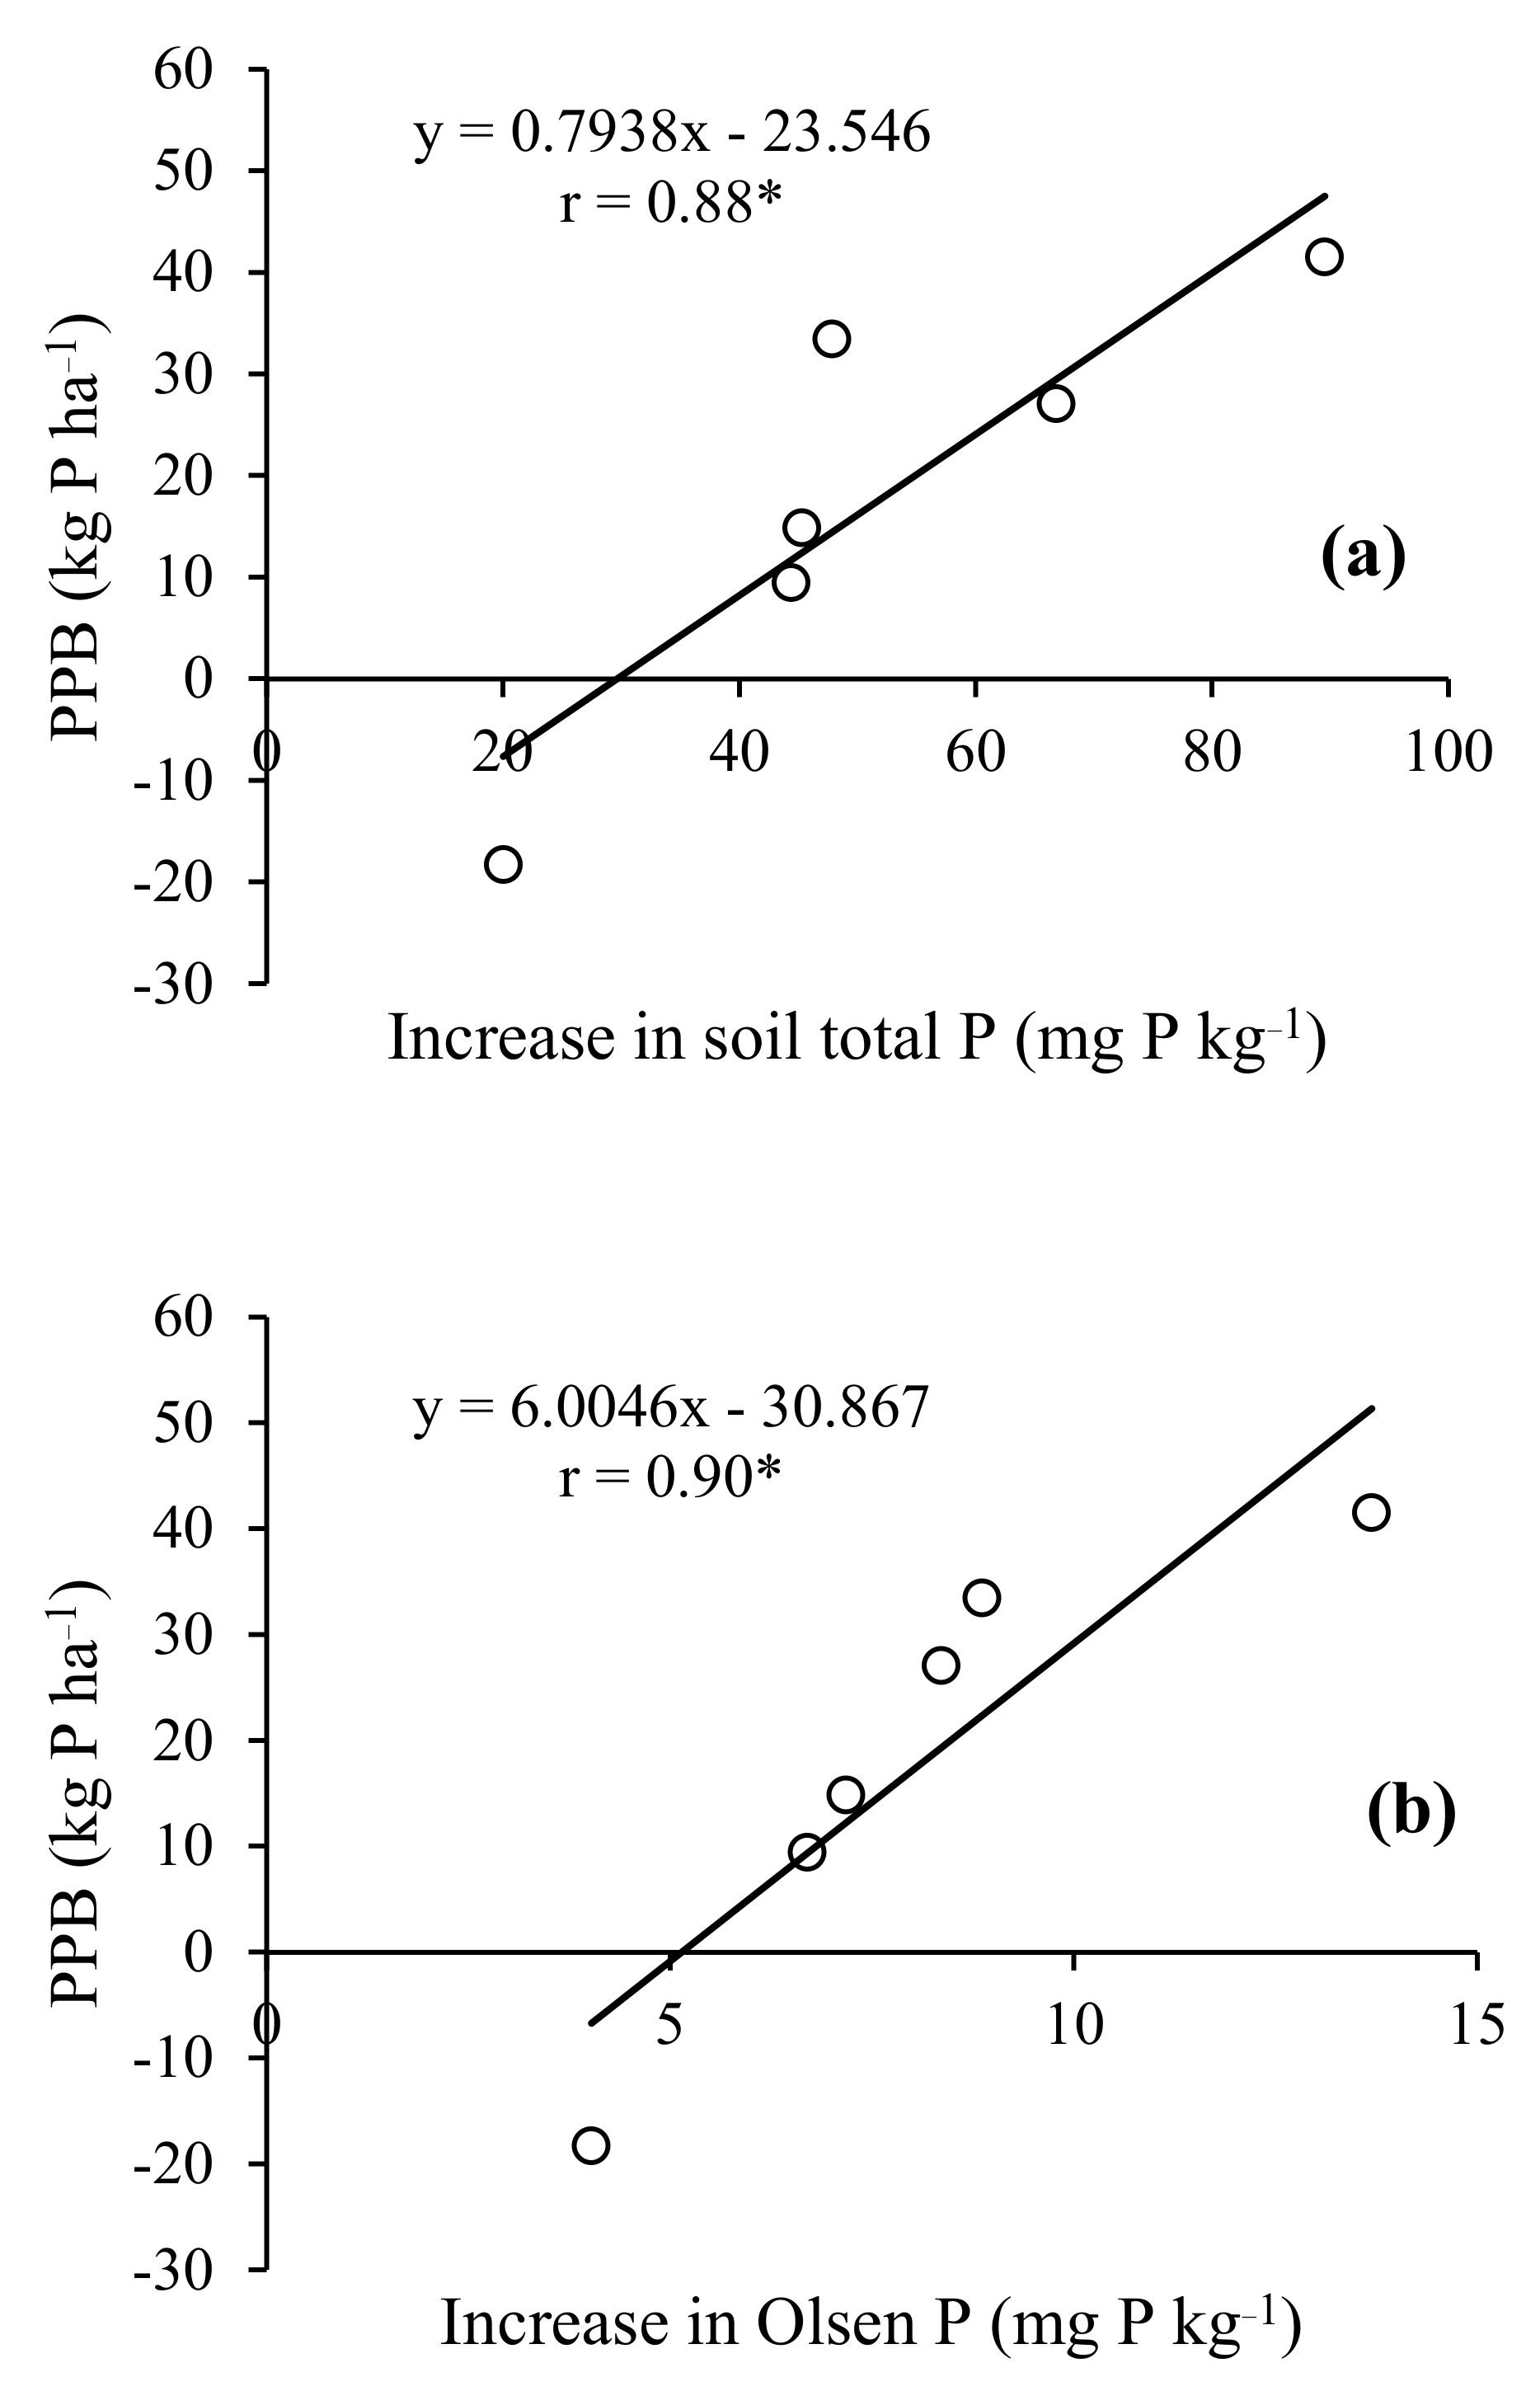
3.5. PPB
4. Discussion
5. Conclusions
Author Contributions
Funding
Institutional Review Board Statement
Informed Consent Statement
Conflicts of Interest
References
- Vitousek, P.M.; Porder, S.; Houlton, B.Z.; Chadwick, O.A. Terrestrial phosphorus limitation: Mechanisms, implications, and nitrogen-phosphorus interactions. Ecol. Appl. 2010, 20, 5–15. [Google Scholar] [CrossRef] [PubMed] [Green Version]
- Withers, P.J.A.; Sylvester-Bradley, R.; Jones, D.L.; Healey, J.R.; Talboys, P.J. Feed the crop not the soil: Rethinking phosphorus management in the food chain. Environ. Sci. Technol. 2014, 48, 6523–6530. [Google Scholar] [CrossRef] [Green Version]
- Nishio, M. Recent trends of chemical fertilizer consumption in Japan. Jpn. J. Soil Sci. Plant Nutr. 2002, 73, 219–225. (In Japanese) [Google Scholar]
- Mishima, S.; Itahashi, S.; Kimura, R.; Inoue, T. Trends of phosphate fertilizer demand and phosphate balance in farmland soils in Japan. Soil Sci. Plant Nutr. 2003, 49, 39–45. [Google Scholar] [CrossRef] [Green Version]
- Dobermann, A.; Gassman, K.G.; Cruz, P.C.; Adviento, M.A.A.; Pampolino, M.F. Fertilizer inputs, nutrient balance and soil nutrient supplying power in intensive, irrigated rice systems. III. Phosphorus. Nutr. Cycl. Agroecosyst. 1996, 46, 111–125. [Google Scholar] [CrossRef]
- Goto, E.; Miura, S.; Nomura, M.; Inatsu, O. The present condition of chemical properties of paddy soils in Hokkaido. Jpn. J. Soil Sci. Plant Nutr. 2003, 74, 475–483. (In Japanese) [Google Scholar]
- Obara, H.; Nakai, M. Available phosphate of arable lands in Japan. Changes of soil Characteristics in Japanese arable lands (II). Jpn. J. Soil Sci. Plant Nutr. 2004, 75, 59–67, (In Japanese with English Summary). [Google Scholar]
- U.S. Geological Survey. Mineral Commodity Summaries 2012; USGS: Washington, DC, USA, 2012; pp. 118–119. [Google Scholar]
- FAO (Food and Agriculture Organization of the United Nations). Statistical Databases. Available online: http://www.fao.org/faostat/en/#data/RFN (accessed on 10 March 2020).
- Gasparatos, D.; Massas, I.; Godelitsas, A. Fe-Mn concretions and nodules formation in redoximorphic soils and their role on soil phosphorus dynamics: Current knowledge and gaps. Catena 2019, 182, 104106. [Google Scholar] [CrossRef]
- Khem, B.; Hirai, Y.; Yamakawa, T.; Mori, Y.; Inoue, E.; Okayasu, T.; Mitsuoka, M. Effects of different application methods of fertilizer and manure on soil chemical properties and yield in whole crop rice cultivation. Soil Sci. Plant Nutr. 2018, 64, 406–414. [Google Scholar] [CrossRef]
- Nguyen, T.T.; Sasaki, Y.; Kakuda, K.; Fujii, H. Comparison of paddy soil fertility under conventional rice straw application versus cow dung compost application in mixed crop–livestock systems in a cold temperate region of Japan. Soil Sci. Plant Nutr. 2020, 66, 106–115. [Google Scholar] [CrossRef]
- Zhang, H.M.; Wang, B.R.; Xu, M.G.; Fan, T.L. Crop yield and soil responses to long-term fertilization on a red soil in southern China. Pedosphere 2009, 19, 199–207. [Google Scholar] [CrossRef]
- Duan, Y.; Xu, M.; Wang, B.; Yang, X.; Huang, S.; Gao, S. Long-term evaluation of manure application on maize yield and nitrogen use efficiency in China. Soil Sci. Soc. Am. J. 2011, 75, 1562–1573. [Google Scholar] [CrossRef]
- Xin, X.L.; Qin, S.W.; Zhang, J.B.; Zhu, A.N.; Zhang, C.Z. Dynamics of phosphorus in Fluvo-aquic soil under long-term fertilization. J. Plant Nutr. Fertil. 2015, 21, 1514–1521. (In Chinese) [Google Scholar]
- Khan SU, T.; Iqbal, A.; Fahad, S. Growth and productivity response of hybrid rice to application of animal manures, plant residues and phosphorus. Front. Plant Sci. 2016, 7, 1440. [Google Scholar]
- Xin, X.; Qin, S.; Zhang, J.; Zhu, A.; Yang, W.; Zhang, X. Yield, phosphorus use efficiency and balance response to substituting long-term chemical fertilizer use with organic manure in a wheat-maize system. Field Crops Res. 2017, 208, 27–33. [Google Scholar] [CrossRef]
- Ohashi, K. Dynamics of phosphate in cultivated soils. Shiga Prefect Agric. Exp. Stn. 1989, 16, 93. (In Japanese) [Google Scholar]
- Zhao, B.Q.; Li, X.Y.; Li, X.P.; Shi, X.J.; Huang, S.M.; Wang, B.R.; Zhu, P.; Yang, X.Y.; Liu, H.; Chen, Y.; et al. Long-term fertilizer experiment network in China: Crop yields and soil nutrient trends. Agron. J. 2010, 102, 216–230. [Google Scholar] [CrossRef]
- Qaswar, M.; Jing, H.; Ahmed, W.; Dongchu, L.; Shujun, L.; Lu, Z.; Cai, A.; Lisheng, L.; Yongmei, X.; Jusheng, G.; et al. Yield sustainability, soil organic carbon sequestration and nutrients balance under long-term combined application of manure and inorganic fertilizers in acidic paddy soil. Soil Tillage Res. 2020, 198, 104569. [Google Scholar] [CrossRef]
- FAO (Food and Agriculture Organization of the United Nations). Statistical Databases. Available online: http://www.fao.org/faostat/en/#data/QC (accessed on 10 March 2020).
- Kato, H. Development of rice varieties for whole crop silage (WCS) in Japan. JARQ 2008, 42, 231–236. [Google Scholar] [CrossRef] [Green Version]
- Ozawa, W.; Yoshida, N. Forage Rice Cultivation and Usage (Shiryoyoumei No Saibai to Riyou); Soshisha Press: Tokyo, Japan, 2009. (In Japanese) [Google Scholar]
- Matsushita, K.; Iida, S.; Ideta, O.; Sunohara, Y.; Maeda, H.; Tamura, Y.; Kouno, S.; Takakuwa, M. ‘Tachisuzuka’, a new rice cultivar with high straw yield and high sugar content for whole-crop silage use. Breed Sci. 2011, 61, 86–92. [Google Scholar] [CrossRef] [Green Version]
- Japan Meteorological Agency. Japan Meteorological Agency Database. Available online: http://www.data.jma.go.jp/obd/stats/etrn/index.php (accessed on 17 July 2021). In Japanese.
- National Agriculture and Food Research Organization. Japan Soil Inventory, Soil Map. Available online: https://soil-inventory.dc.affrc.go.jp/figure.html (accessed on 20 November 2020).
- Obara, H.; Ohkura, T.; Takata, Y.; Kohyama, K.; Maejima, Y.; Hamazaki, T. Comprehensive soil classification system of Japan First Approximation. Bull. Natl. Inst. Agro Environ. Sci. 2011, 29, 1–73. [Google Scholar] [CrossRef] [Green Version]
- Yamaguchi, M. Breeding of High Yield Rice and a New Rice Cultivar [FUKUHIBIKI]. Tohoku Natl. Agric. Exp. Stat. 1993, 36, 105–109. (In Japanese) [Google Scholar]
- Fukushima, A. Yield potential of high-yield rice varieties in the Tohoku region of Japan. JARQ 2012, 46, 199–204. [Google Scholar] [CrossRef] [Green Version]
- Morita, M.; Ishikawa, M.; Yoshida, N.; Horiguchi, K.; Takahashi, T. Influence of ammonium sulfate fertilizer recovered through ammonia-collecting equipment on growth on yield of forage rice. Jpn. J. Grassl. Sci. 2012, 58, 166–172, (In Japanese with English Summary). [Google Scholar]
- Secretariat of the Convention on Biological Diversity. Sustaining Life on Earth: How the Convention on Biological Diversity Promotes Nature and Human Well-Being; UNEP: Nairobi, Kenya, 2000. [Google Scholar]
- Lu, R.K. Analytical Methods of Soil Agricultural Chemistry; China Agricultural Science and Technology Press: Beijing, China, 2000. [Google Scholar]
- Gomez, K.A. Techniques for Field Experiments with Rice; International Rice Research Institute: Los Baños, Philippines, 1972. [Google Scholar]
- Olsen, S.R.; Watanabe, F.S.; Cosper, H.R.; Larson, W.E.; Nelson, L.B. Residual phosphorus availability in long-time rotations on calcareous soils. Soil Sci. 1954, 78, 141–152. [Google Scholar] [CrossRef]
- Murphy, J.; Riley, J.P. A modified single solution method for the determination of phosphate in natural waters. Anal. Chim. Acta 1962, 27, 31–36. [Google Scholar] [CrossRef]
- Bremner, J.M. Inorganic Forms of Nitrogen. In Methods of Soil Analysis; Part 2. Chemical and Microbiological Properties; Black, C.A., Evans, D.D., Ensminger, L.E., White, J.L., Clark, E.F., Eds.; American Society of Agronomy: Madison, WI, USA, 1965; pp. 1179–1237. [Google Scholar]
- Harada, Y. Cation and Anion Exchange Capacity of Soil Background and Methods. Jpn. J. Soil Sci. Plant Nutr. 1984, 55, 273–283. (In Japanese) [Google Scholar]
- Kamewada, K. Chapter V. 1 pH. In Methods of Soil Environment Analysis; Editorial Board of Methods of Soil Environment Analysis, Ed.; Hakuyasha: Tokyo, Japan, 1997; pp. 195–197. (In Japanese) [Google Scholar]
- Gasparatos, D.; Haidouti, C. A comparison of wet oxidation methods for determination of total phosphorus in soils. J. Plant Nutr. Soil Sci. 2001, 164, 435–439. [Google Scholar] [CrossRef]
- Kuo, S. Chapter 32: Phosphorus. In Methods of Soil Analysis; Part 3. Chemical Methods; Sparks, D.L., Ed.; SSSA Book Series No. 5. Soil Science Society of America, American Society of Agronomy: Madison, WI, USA, 1996; pp. 869–919. [Google Scholar]
- Mizuno, N.; Minami, M. The Use of H2SO4-H2O2 for the Destruction of Plants Matter as Preliminary to Determination of N, K, Mg, Ca, Fe, Mn. Jpn. J. Soil Sci. Plant Nutr. 1980, 51, 418–420. (In Japanese) [Google Scholar]
- Oenema, O.; Kros, H.; Vries, W. Approaches and uncertainties in nutrient budgets: Implications for nutrient management and environmental policies. Eur. J. Agron. 2003, 20, 3–16. [Google Scholar] [CrossRef]
- Nanzyo, M. Progress and prospect of the research on paddy soil management under various rice growing system. 1. Progress in nutrient behavior and management research on paddy soil (2) Phosphorus. Jpn. J. Soil Sci. Plant Nutr. 1996, 67, 317–321. (In Japanese) [Google Scholar]
- Kyuma, K. Paddy Soil Science; Kyoto University Press: Kyoto, Japan; Trans Pacific Press: Melbourne, Australia, 2004. [Google Scholar]
- Maruyama, T.; Hashimoto, I.; Murashima, K.; Takimoto, H. Evaluation of N and P mass balance in paddy rice culture along Kahokugata Lake, Japan, to assess potential lake pollution. Paddy Water Environ. 2008, 6, 355–362. [Google Scholar] [CrossRef]
- Hasegawa, K. Studies on the behavior and balance of nitrogen in paddy field near the lake and its influence on environment especially on the water quality. Spec. Res. Rep. Shiga Agric. Exp. Stn. 1992, 17, 1–164, (In Japanese with English Summary). [Google Scholar]
- Mallarino, A.P.; Blackmer, A.M. Comparison of methods for determining critical concentrations of soil test phosphorus for corn. Agron. J. 1992, 84, 850–856. [Google Scholar] [CrossRef] [Green Version]
- Saleque, M.A.; Abedin, M.J.; Panaullah, G.M.; Bhuiyan, N.I. Yield and phosphorus efficiency of some lowland rice varieties at different levels of soil-available phosphorus. Commun. Soil Sci. Plant Anal. 1998, 29, 2905–2916. [Google Scholar] [CrossRef]
- Bado, B.V.; De Vries, M.E.; Haefele, S.M.; Marco, M.C.S.; Ndiaye, M.K. Critical limit of extractable phosphorous in a Gleysol for rice production in the Senegal river valley of West Africa. Commun. Soil Sci. Plant Anal. 2007, 39, 202–206. [Google Scholar] [CrossRef]
- Zhang, W.F.; Ma, W.Q.; Ji, Y.X.; Fan, M.S.; Oenema, O.; Zhang, F.S. Efficiency, economics, and environmental implications of phosphorus resource use and the fertilizer industry in China. Nutr. Cycl. Agroecosyst. 2008, 80, 131–144. [Google Scholar] [CrossRef] [Green Version]
- Bai, Z.; Li, H.; Yang, X.; Zhou, B.; Shi, X.; Wang, B.; Li, D.; Shen, J.; Chen, Q.; Qin, W.; et al. The critical soil P levels for crop yield, soil fertility and environmental safety in different soil types. Plant Soil 2013, 372, 27–37. [Google Scholar] [CrossRef]
- Nagumo, T.; Tajima, S.; Chikushi, S.; Yamashita, A. Phosphorus balance and soil phosphorus status in paddy rice fields with various fertilizer practices. Plant Prod. Sci. 2013, 16, 69–76. [Google Scholar] [CrossRef]
- Lee, C.H.; Park, C.Y.; Park, K.D.; Jeon, W.T.; Kim, P.J. Long-term effects of fertilization on the forms and availability of soil phosphorus in rice paddy. Chemosphere 2004, 56, 299–304. [Google Scholar] [CrossRef] [PubMed]
- Shen, J.; Li, R.; Zhang, F.; Fan, J.; Tang, C.; Rengel, Z. Crop yields, soil fertility and phosphorus fractions in response to long-term fertilization under the rice monoculture system on a calcareous soil. Field Crops Res. 2004, 86, 225–238. [Google Scholar] [CrossRef]
- Ministry of Agriculture, Forestry and Fisheries (MAFF). Agriculture, Forestry and Fisheries to See in the Statistics and Graph, Basic Data. Available online: https://www.maff.go.jp/j/tokei/kekka_gaiyou/sakumotu/sakkyou_kome/suiriku/r2/menseki/index.html (accessed on 12 January 2021). In Japanese.


| Treatments | Yield Components | Grain Yield * kg ha−1 | Straw Yield ** kg ha−1 | |||
|---|---|---|---|---|---|---|
| Panicles (No./m2) | Grain (No./Panicle) | Unfilled Grain (%) | 1000-Grain wt * (g) | |||
| CK | 216 ± 5 a | 80.1 ± 8.3 a | 10.7 ± 1.7 a | 25.0 ± 0.1 b | 4207 ± 403 a | 5210 ± 89 a |
| MNK P | 389 ± 23 b | 97.0 ± 3.0 a | 15.3 ± 3.3 a | 23.6 ± 0.2 a | 7569 ± 548 b | 8024 ± 437 b |
| MNK ¾ P | 370 ± 5 b | 95.6 ± 2.1 a | 15.5 ± 2.7 a | 23.4 ± 0.5 a | 7477 ± 122 b | 7888 ± 122 b |
| MNK ½ P | 373 ± 31 b | 108.6 ± 4.1 b | 20.9 ± 5.4 b | 23.6 ± 0.2 a | 7139 ± 537 b | 7672 ± 435 b |
| MNK ¼ P | 378 ± 11 b | 103.1 ± 9.8 b | 17.9 ± 1.9 a | 23.4 ± 0.1 a | 7678 ± 185 b | 8137 ± 202 b |
| MNK | 384 ± 27 b | 98.9 ± 6.7 b | 18.2 ± 3.3 a | 23.5 ± 0.4 a | 7640 ± 405 b | 8081 ± 639 b |
| Treatments | Olsen P (mg P kg−1) | Total P (mg P kg−1) | ||||||||
|---|---|---|---|---|---|---|---|---|---|---|
| Initial A | 2 WAT | 4 WAT | 6 WAT | 8 WAT | After Harvest B | (B-A) | Initial C | After Harvest D | (D-C) | |
| CK | 57.7 ± 1.0 a | 50.3 ± 3.6 a | 48.6 ± 1.5 a | 54.9 ± 2.4 a | 53.2 ± 2.8 a | 61.7 ± 2.9 a | 4.0 ± 2.0 a | 950 ± 18 a | 970 ± 8 a | 20.0 ± 19.2 a |
| MNK P | 54.8 ± 3.4 a | 52.8 ± 3.4 a | 55.2 ± 5.1 a | 62.1 ± 5.9 a | 61.5 ± 4.4 a | 68.5 ± 6.6 a | 13.7 ± 3.3 b | 923 ± 16 a | 1013 ± 41 a | 89.5 ± 50.7 a |
| MNK ¾ P | 57.8 ± 1.9 a | 59.0 ± 4.8 a | 55.8 ± 0.5 a | 62.6 ± 7.0 a | 61.9 ± 4.0 a | 66.6 ± 2.0 a | 8.9 ± 2.5 ab | 980 ± 41 a | 1028 ± 35 a | 47.9 ± 6.8 a |
| MNK ½ P | 57.2 ± 3.6 a | 54.7 ± 4.3 a | 53.8 ± 2.5 a | 58.1 ± 1.0 a | 55.1 ± 3.1 a | 65.6 ± 5.0 a | 8.4 ± 4.5 ab | 951 ± 51 a | 1017 ± 10 a | 66.8 ± 59.1 a |
| MNK ¼ P | 57.2 ± 4.0 a | 55.1 ± 5.1 a | 51.7 ± 3.4 a | 55.4 ± 3.0 a | 60.1 ± 0.4 a | 64.3 ± 4.6 a | 7.2 ± 0.9 ab | 963 ± 11 a | 1008 ± 48 a | 45.3 ± 51.9 a |
| MNK | 57.7 ± 2.6 a | 51.6 ± 1.7 a | 53.0 ± 1.9 a | 57.9 ± 2.0 a | 57.0 ± 3.6 a | 64.4 ± 1.3 a | 6.7 ± 3.7 ab | 958 ± 24 a | 1002 ± 13 a | 44.4 ± 25.2 a |
Publisher’s Note: MDPI stays neutral with regard to jurisdictional claims in published maps and institutional affiliations. |
© 2021 by the authors. Licensee MDPI, Basel, Switzerland. This article is an open access article distributed under the terms and conditions of the Creative Commons Attribution (CC BY) license (https://creativecommons.org/licenses/by/4.0/).
Share and Cite
Nguyen, T.T.; Sasaki, Y.; Katahira, M.; Singh, D. Cow Manure Application Cuts Chemical Phosphorus Fertilizer Need in Silage Rice in Japan. Agronomy 2021, 11, 1483. https://doi.org/10.3390/agronomy11081483
Nguyen TT, Sasaki Y, Katahira M, Singh D. Cow Manure Application Cuts Chemical Phosphorus Fertilizer Need in Silage Rice in Japan. Agronomy. 2021; 11(8):1483. https://doi.org/10.3390/agronomy11081483
Chicago/Turabian StyleNguyen, Thanh Tung, Yuka Sasaki, Mitsuhiko Katahira, and Dhirendranath Singh. 2021. "Cow Manure Application Cuts Chemical Phosphorus Fertilizer Need in Silage Rice in Japan" Agronomy 11, no. 8: 1483. https://doi.org/10.3390/agronomy11081483