Article

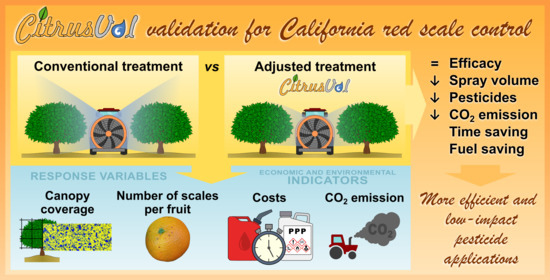
Volume Rate Adjustment for Pesticide Applications against Aonidiella aurantii in Citrus: Validation of CitrusVol in the Growers’ Practice

1
Centro de Agroingeniería, Instituto Valenciano de Investigaciones Agrarias (IVIA), CV-315, km 10.7, 46113 Moncada, Spain
2
Centro de Protección Vegetal y Biotecnología, Instituto Valenciano de Investigaciones Agrarias (IVIA), CV-315, km 10.7, 46113 Moncada, Spain
*
Author to whom correspondence should be addressed.
Agronomy 2021, 11(7), 1350; https://doi.org/10.3390/agronomy11071350
Submission received: 17 May 2021 / Revised: 24 June 2021 / Accepted: 29 June 2021 / Published: 30 June 2021
(This article belongs to the Special Issue Citrus Production and Protection from Pests and Diseases)

Abstract

:
Aonidiella aurantii is one of the most damaging armored scales in citrus crops worldwide. To control this pest, high water volume rates are conventionally used. In order to rationalize the pesticide applications in citrus, IVIA developed CitrusVol, a tool that recommends the optimal volume rate based on the vegetation, the pest or disease and the active ingredient. In this study the objectives were: (i) validate CitrusVol as a tool to adjust the spray volume to control A. aurantii and (ii) quantify its environmental and economical advantages. For this, the spray volume adjusted with CitrusVol was compared with the one conventionally used by farmers in 18 applications in seven orchards during two years. The following parameters were evaluated: (i) spray distribution in the canopy, (ii) A. aurantii males trapped per day, and (iii) number of scales per fruit at harvest. CitrusVol reduced the spray volume and the amount of pesticide by 35% on average. Despite this reduction, a satisfactory spray distribution was achieved, and the volume was found to control the pest in a comparable way to the conventional volume. Moreover, CitrusVol saved per application and on average 31.25 h/100 ha of spray operating time, 241.83 L/100 ha of fuel consumption and consequently, the reduction of emissions of CO2 was 631.18 kg/100 ha. Therefore, CitrusVol allows for efficient, low-input and low-impact pesticide applications.

Graphical Abstract

1. Introduction

California red scale Aonidiella aurantii (Maskell) (Hemiptera: Diaspididae) is one of the most damaging armored scale insects in worldwide citrus growing and is considered a key pest in the Mediterranean region [1,2]. A. aurantii feeds on plant tissues and settles in all the organs of citrus canopies: fruit, leaves, twigs and branches. The main damage is aesthetic because the presence of scales in fruit downgrades its value for fresh consumption. Moreover, it can cause chlorotic spots, defoliation, fruit fall and drying of branches when population density is very high [3,4,5,6,7].
A. aurantii has several generations per year that are generally monitored using sticky traps to collect males during their flights. In the Mediterranean basin, the number of generations varies between three and four depending on temperature [8,9]. First instar nymphs, also known as crawlers, of the different generations infest citrus fruit between May and September settling down in small depressions of fruit skin [10,11]. Once settled, nymphs develop a wax scale that covers their body. Female scales molt twice before they reach the adult stage [7,12]. After several molts, male scales become winged adults that only live about six hours [6].
Nowadays, there are different strategies to manage A. aurantii in citrus that include augmentative biological control using the parasitic wasp Aphytis melinus Howard (Hymenoptera: Aphelinidae) [13]; conservation biological control of this parasitoid as well as generalist predators [14,15]; and mating disruption [16,17]. Despite the development of these environmentally friendly strategies, insecticides are still used to manage A. aurantii when population densities are very high. Chemical control of A. aurantii has several problems because it has developed resistance to some active ingredients and its scale protects the insect even from insecticides [18,19]. The most sensitive instar to insecticides is the first nymphal instar. Therefore, plant protection product (PPP) applications should be made when the proportion of this stage is maximum if the economical threshold has been exceeded. This usually occurs three-four times per year in the Mediterranean basin. The first and second maximums of crawlers at the end of May and end of July and beginning of August are generally more homogenous [11].
Since A. aurantii inhabits the inner part of citrus trees and overwinter in wood parts, high water volume rates are conventionally used to reach these areas of the tree and control the scale. However, several works have demonstrated that the volume of water sprayed per unit ground area (L/ha) can be reduced without compromising the efficacy of the treatment not only against A. aurantii [20,21,22,23], but also against other insect pests [20,24,25], mites [26,27,28], and fungal and bacterial diseases [29,30]. This reduction of water volume is important because it reduces the risk of drift and runoff and, therefore, the risk of insecticide contamination in non-target organisms of different trophic levels. For example, neonicotinoids occur in 93% of organic soils and crops that had not been treated with neonicotinoids for the last 10 years [31]. Moreover, the reduction of water volume also reduces the risk for human health, including farmers, bystanders and consumers. Currently there is a social and political commitment to reduce these risks, as stated in the European Green Deal [32].
This scenario is boosting strategies to improve the pesticide application through the adequate configuration and calibration of sprayers, implementation of drift reducing technologies, and utilization of optimal volume rate adjustment (OVRA) tools. These tools recommend a spray water volume for pesticide applications adjusted based on different parameters, such as: canopy characteristics, sprayer and active ingredient among others. In recent years, several tools for specific crops have been developed: “Apple Tree-row-volume Spraying Rate Calculator” for apples [33], “Dosage Adapté” for pome and stone fruits [34] and for vineyard [35], “Dosaviña” for vineyard [36], “CitrusVol” for citrus [37], “Dosaolivar” for olive trees [38], and more generic ones for three-dimensional crops such as “Dosa3D” [39]. In addition to reducing the environmental impact of insecticide applications, the use of OVRA tools results in economic benefit to farmers. Reducing the spray volume entails a lower use of pesticides and a lower number of refills of the sprayer tank and, therefore, a reduction in operating time and fuel consumption [37].
CitrusVol is an OVRA tool that recommends a spray volume (L/ha) according to the characteristics of the vegetation (canopy volume, planting pattern, vegetation density and pruning level), the target pest or disease and the active ingredient, for applications with airblast sprayers in adult citrus orchards. This tool calculates the minimum spray volume necessary to obtain the maximum efficacy, based on previous efficacy models determined under laboratory conditions [40,41]. CitrusVol has been validated to control the two-spotted spider mite Tetranychus urticae Koch (Acari: Tetranychidae) in the field [28]. This tool is freely available on its website (www.citrusvol.com).
The main objective of the current study was to validate the CitrusVol OVRA tool to control A. aurantii in citrus trees under field conditions. For this purpose, the spray distribution on the canopy and the efficacy of spray volume adjusted with CitrusVol was compared with the spray volume conventionally used by farmers in seven clementine orchards and during two consecutive years. Moreover, environmental and economical advantages due to the use of CitrusVol were quantified.

2. Materials and Methods

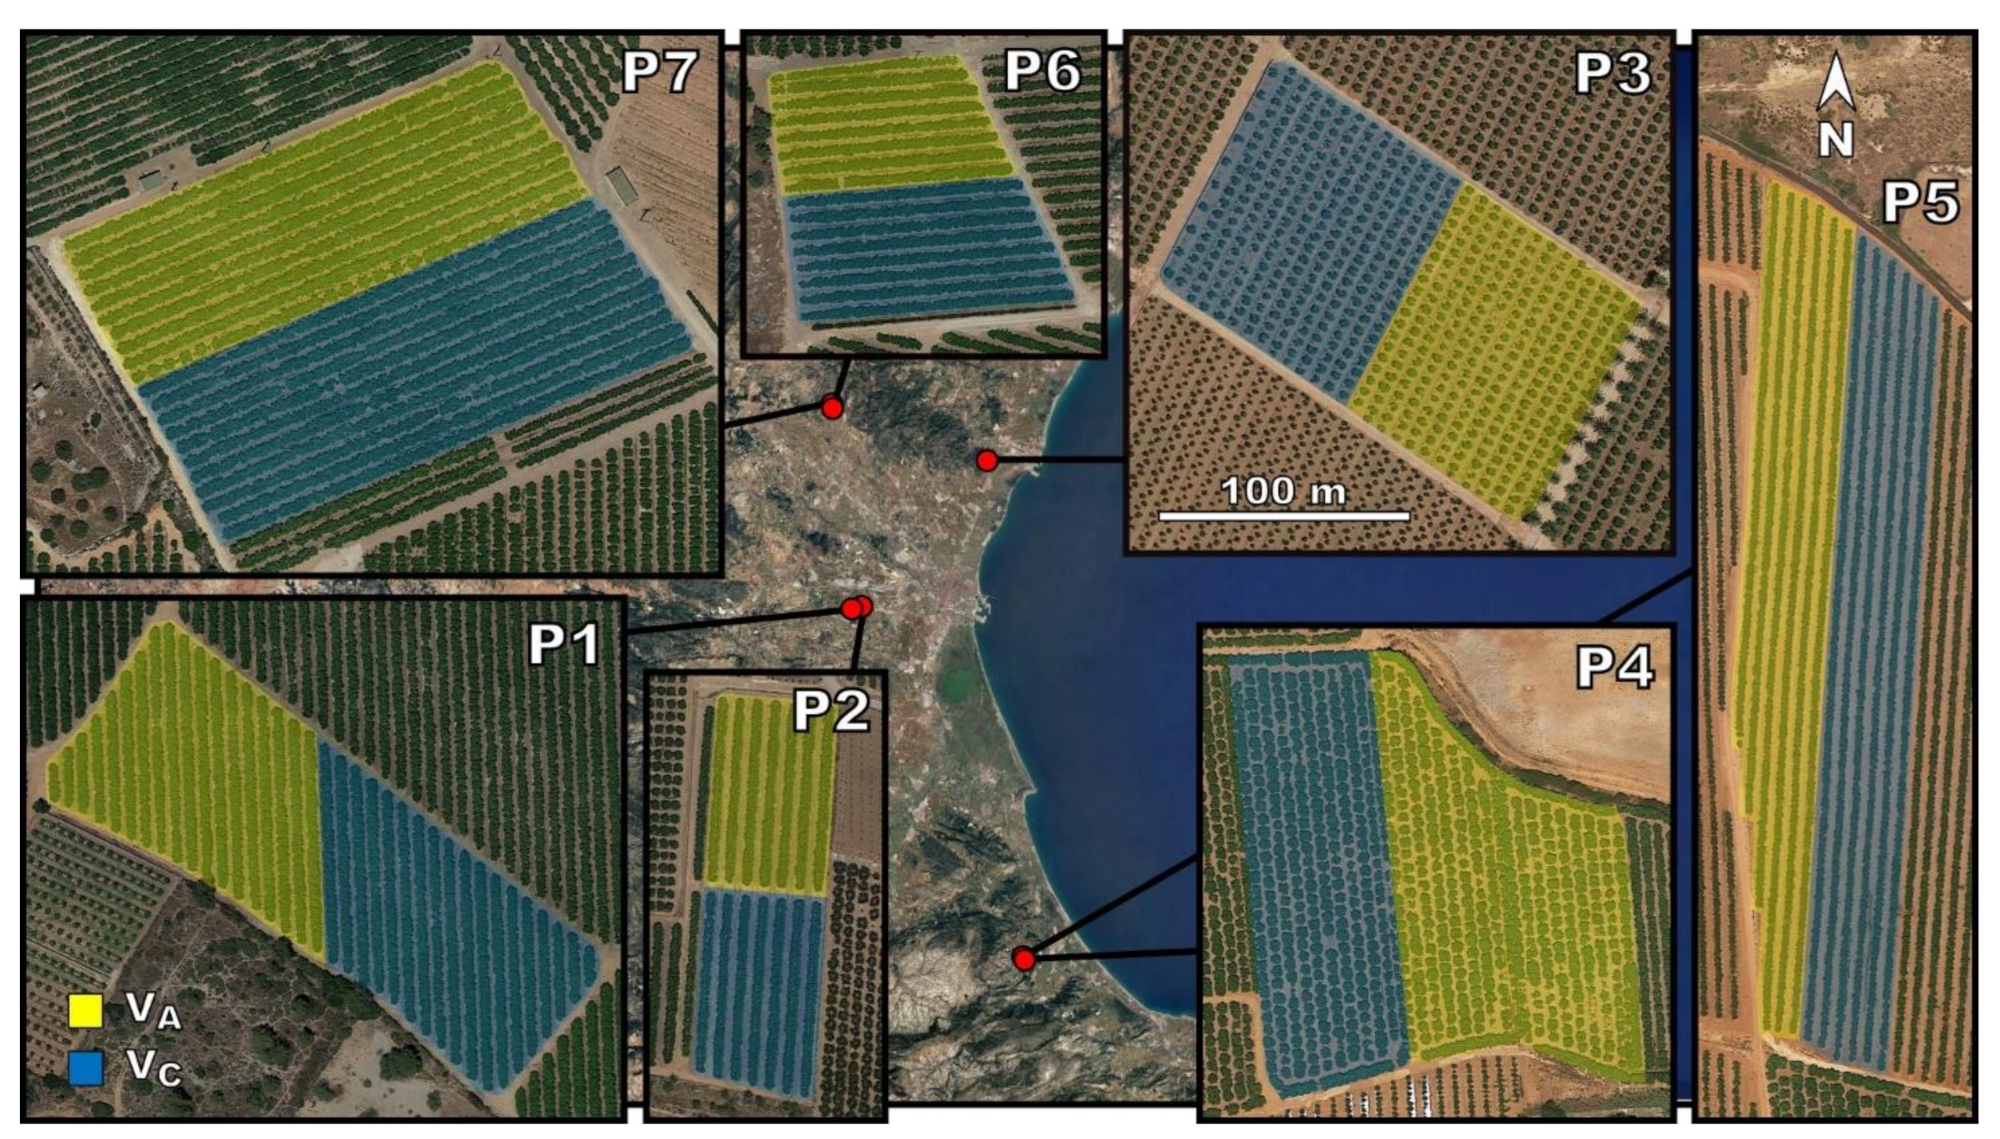
2.1. Experimental Plots

Field trials were conducted in seven commercial clementine orchards (Citrus clementina Hort. ex Tan.) of two varieties: “Oronules” (plot P2) and “Clemenules” (the other six plots); during two years (2016 and 2017). Plots were located in Valencia province (eastern Spain) (Figure 1). Canopy dimensions, vegetation density and other characteristics of the experimental plots are shown in Table 1.

2.2. Experimental Design

The studied independent variable was the spray volume, with two levels: (i) conventional volume (VC), which is the spray volume commonly used by the technicians of the orchards; and (ii) adjusted volume (VA), which is the spray volume recommended by CitrusVol tool based on tree characteristics, target pest and active ingredient. Each plot was divided in two blocks of similar size (between 0.4 and 1.35 ha, depending on the plot (Figure 1)). In each block, a different spray volume was applied, VC or VA. The response variables were: (i) spray distribution in the canopy, (ii) A. aurantii males trapped per day, and (iii) number of scales per fruit at harvest.
In the seven experimental plots (P1–P7) and throughout the two years (2016 and 2017), a total of 18 applications against A. aurantii were carried out.

2.3. Sprayers and Spray Applications

The airblast sprayers and the nozzles used to apply the PPPs in the different plots are shown in Table 2.
The application parameters were selected by the technicians of the orchards, considering the good agricultural practices [42]: working pressure, forward speed, air flow rate, trademark and model of nozzles. In all cases cone spray nozzles were used as it is recommended for citrus (Table 2). These parameters were used for both treatments (VA and VC) (Table 3).
Prior to the spray applications, all the sprayers were calibrated (forward speed, air flow rate, working pressure and the nozzle flow rate). The conventional volume (VC) was calculated based on the results of the calibration of the sprayer and its set up used by the technician in each orchard (Table 3).
The adjusted volume (VA) to be used in each application (Table 3) was calculated using the CitrusVol tool. For this, the following characteristics were selected:
  • Foliar density: Medium;
  • Pruning level: Normal, Severe or Without pruning (based on Table 1);
  • Pest/disease: Armored scales (California red scale, oleander scale…);
  • Product: the active ingredient used in each case (see Table A1 of Appendix A).
VA resulted always lower than VC, therefore, the reduction of the spray volume between VC and VA was achieved following two steps; first, the spray cloud was adjusted to the canopy shape of the orchard, by orienting or even closing the unnecessary nozzles, in order to reduce both drift (top nozzles) and losses to the soil (bottom nozzles). Secondly, some nozzles with lower nominal flow rate (same trademark and model but different orifice diameter) were selected to get the adjusted volume. Therefore, part of the reduction of the spray volume was due to the decrease of the number of working nozzles. The other part, due to the reduction of the diameter of the nozzle, was attempted to be the minimum possible (Table 3).
PPPs were selected by the technicians and were applied at the label concentration. The same product and concentration were used for both treatments (VA and VC) in each application (Table A1 (Appendix A)).
The technicians decided the timing for each application based on accumulated degree-days with a development threshold temperature of 11.7 °C. Figure A1 (Appendix A) shows the accumulated degree-days in the seven plots, the treatment thresholds for the first, second and third generation, and the application dates for each plot and both years.
Weather conditions during spray applications are shown in Table A2 (Appendix A).

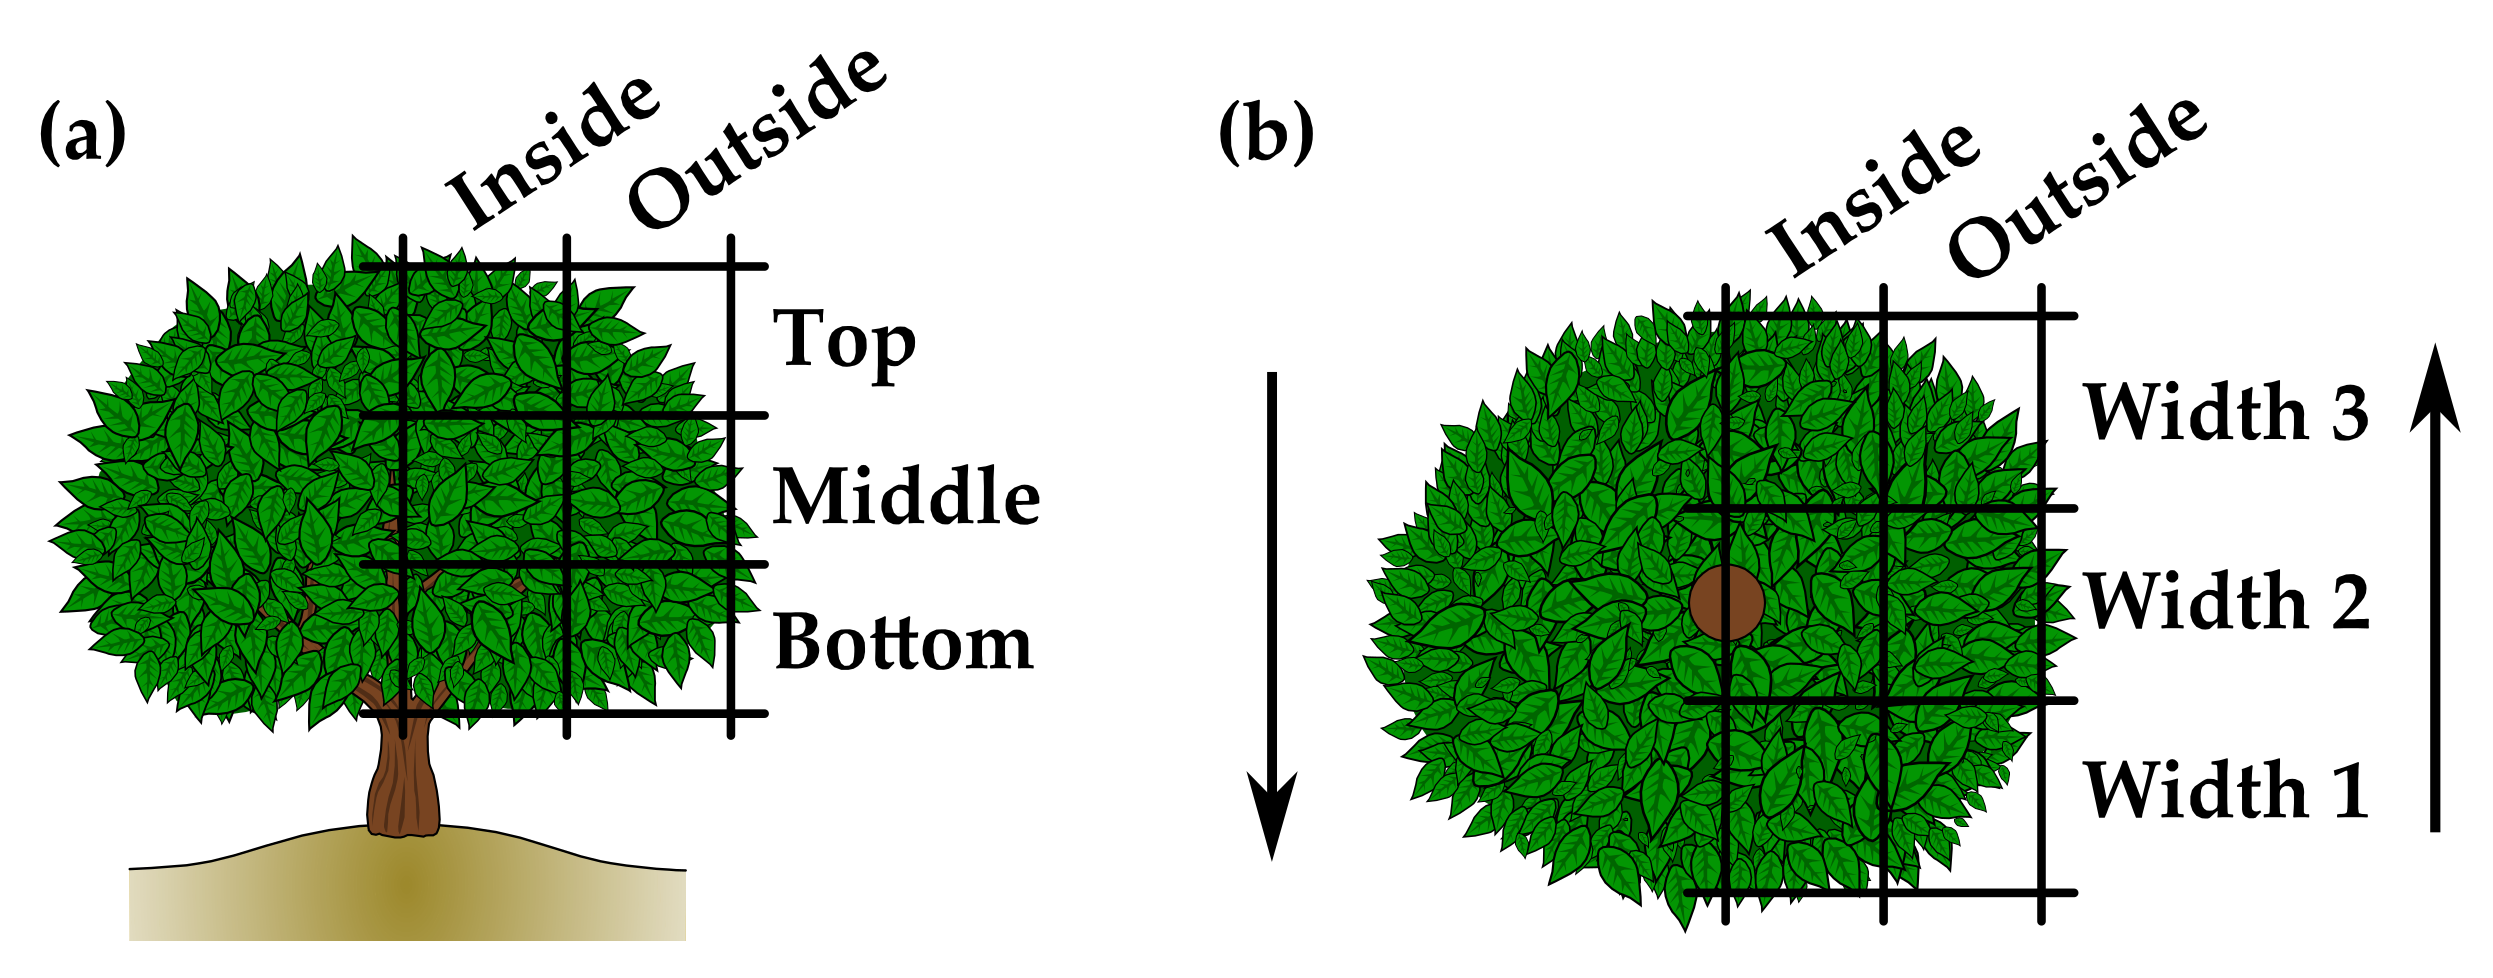
2.4. Effects on Spray Distribution on the Canopy

The effect of spray volume on spray distribution in different zones of the vegetation (height, width, depth and side of the leaf) was estimated through the percentage of coverage on water sensitive papers (WSPs) of 76 mm × 26 mm (Syngenta International AG, Basel, Switzerland).
Coverage (%) was evaluated once per plot and year. In plot P6 in 2017, no applications were carried out, therefore, a total of 13 coverage evaluations were performed. Estimation was conducted in three randomly selected trees per block (VA and VC). Before spraying, 72 WSPs per tree were placed in the 18 quadrants in which the canopy was divided (combination of three heights, three widths and two depths; Figure 2). In Plot P3, there were only 12 quadrants, because only two heights were considered due to the small size of the canopies and the severe pruning. In each canopy quadrant, four WSPs were randomly stapled: two on the upperside of the leaves and two on the underside.
After the spray application and once the WSPs had dried, they were collected. Once in the laboratory, they were photographed with a Canon EOS 700D digital camera (Canon Inc., Tokyo, Japan) under steady light conditions. A digital image of 900 × 350 pixels was generated for each WSP and it was analysed using self-developed software based on Food-Color Inspector [43] to obtain the percentage of coverage. Previously, the program was trained to designate blue range colours of the images as impacted drops and yellow and green range colours as background. Then, the program counted the number of pixels assigned as drops and calculated the percentage they represented respect to the total pixels.
The meteorological conditions during the coverage evaluations are shown in Table A2 (Appendix A).

2.5. Effects on Control of A. aurantii

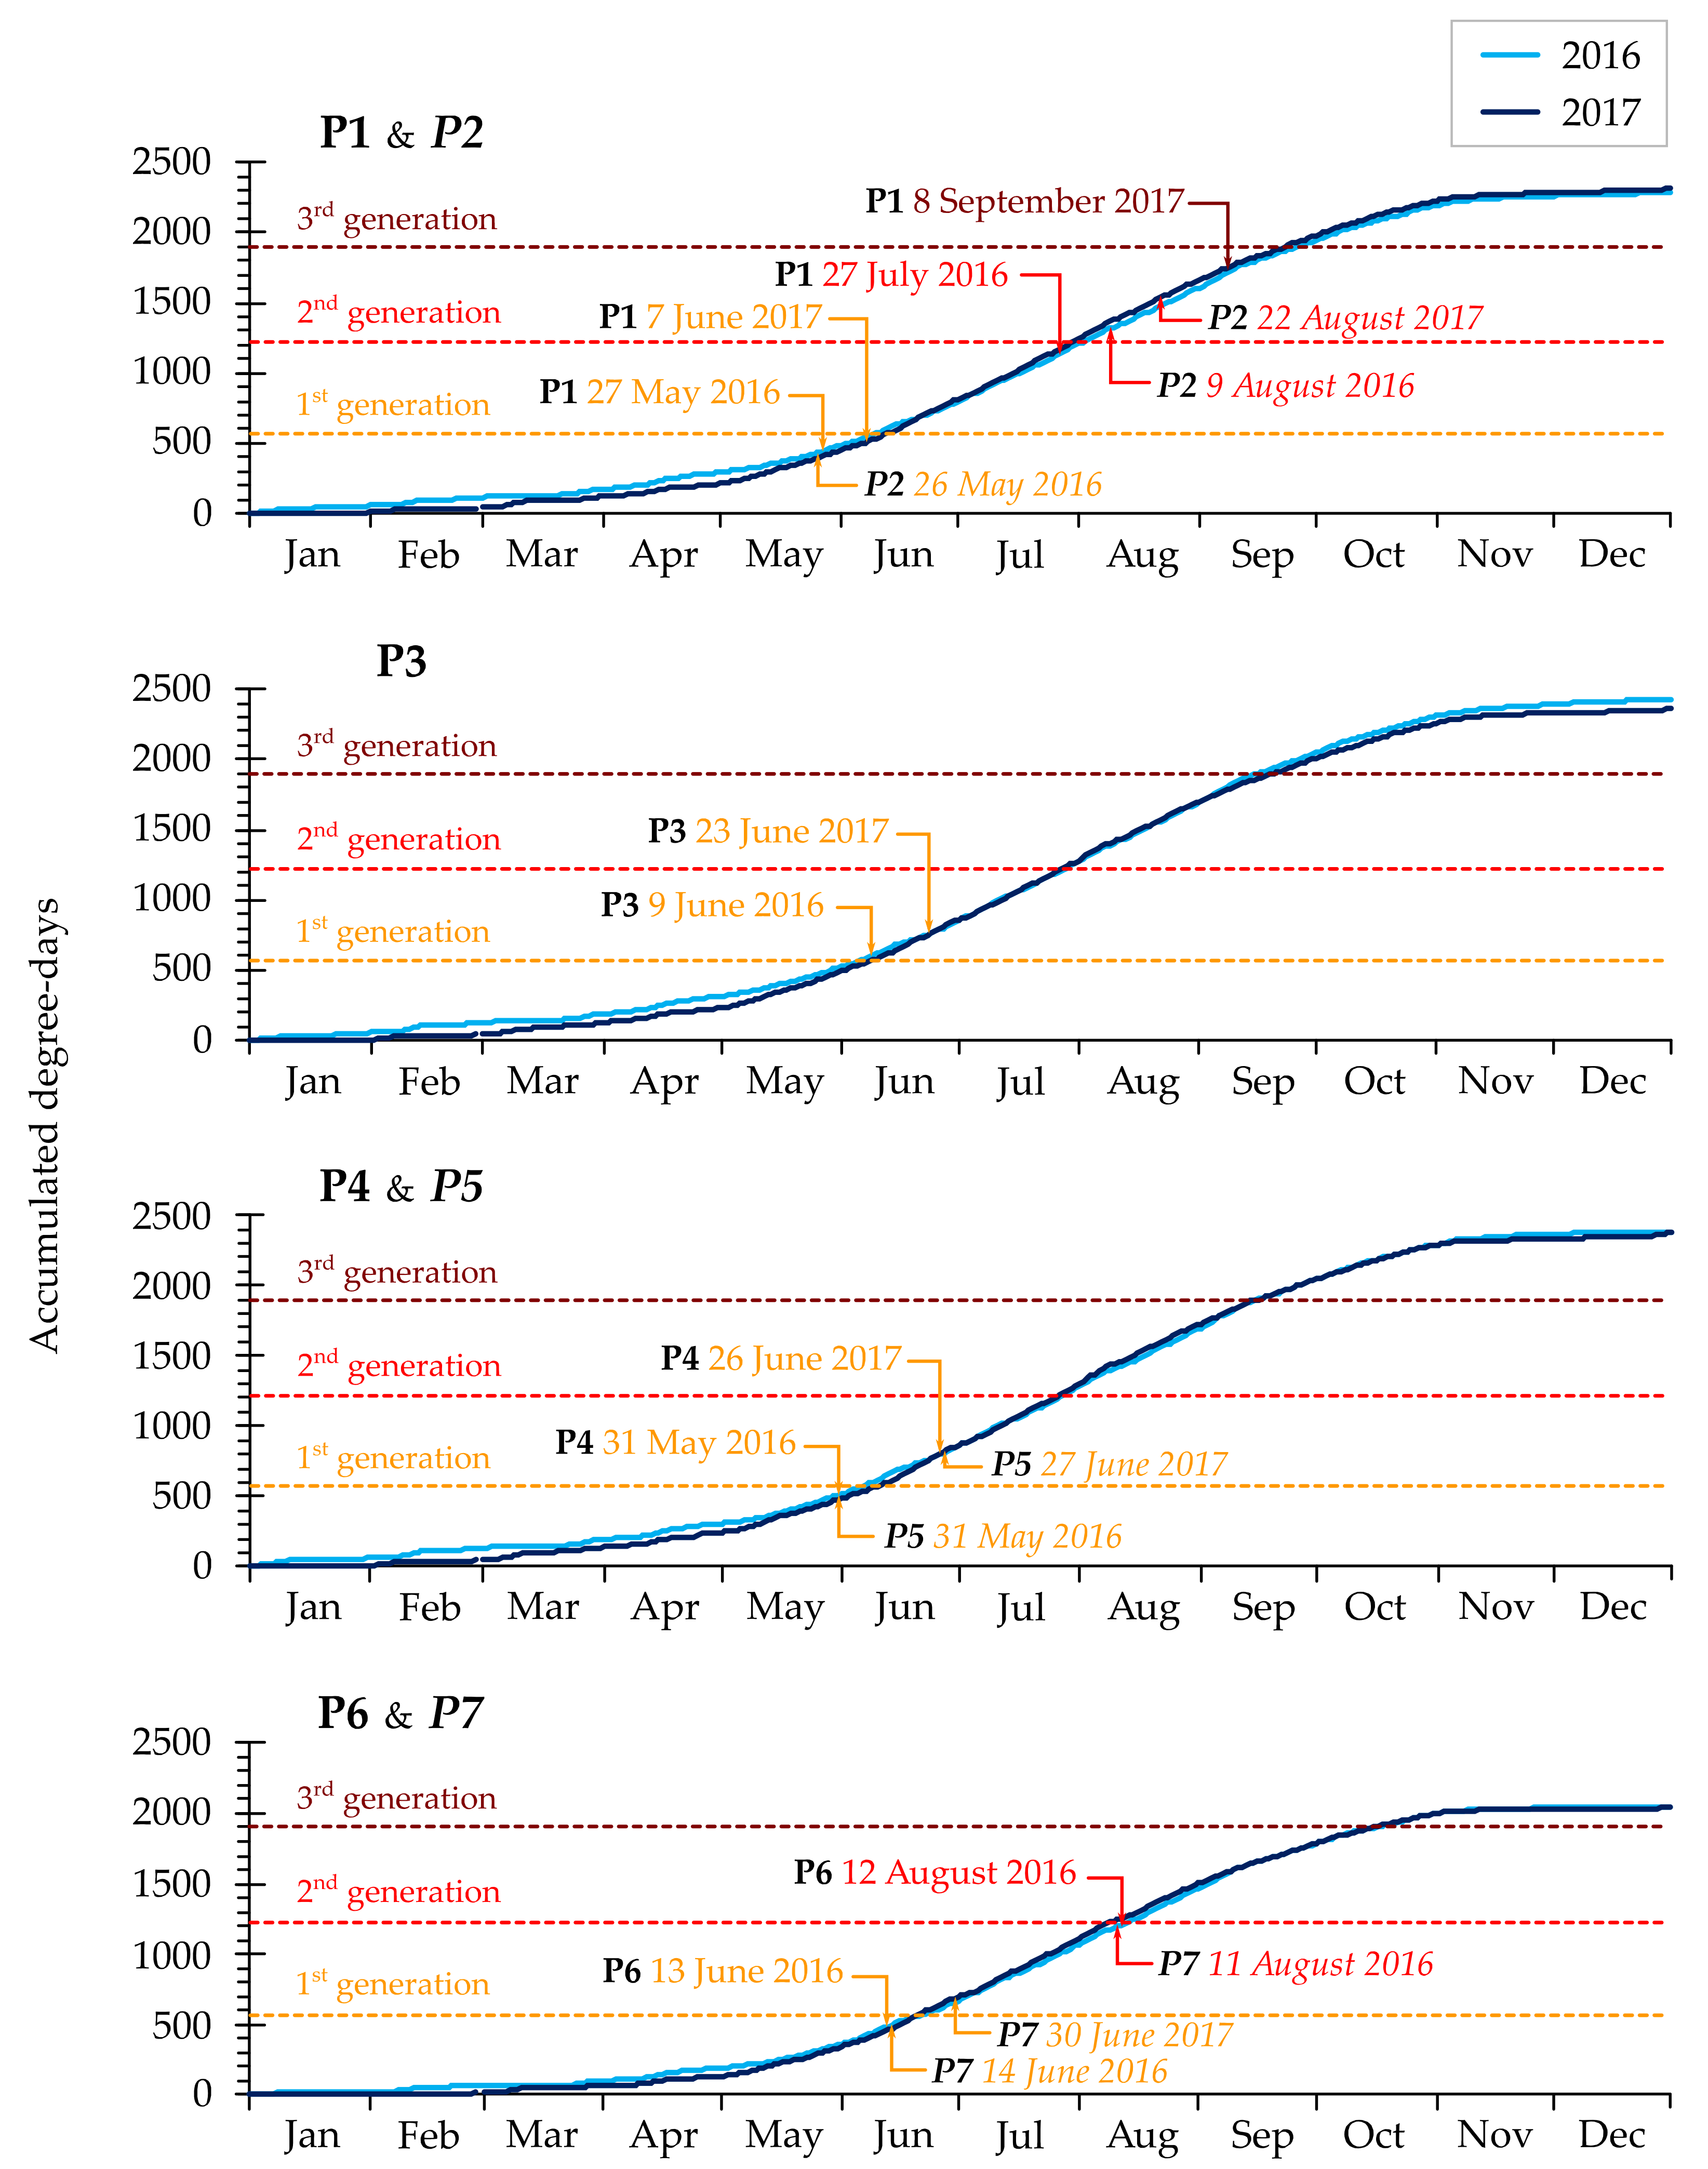
2.5.1. Monitoring of A. aurantii Male Flight

The male flight monitoring is used to check the number of generations of A. aurantii per year and in this work it was used to study the seasonal trend of A. aurantii in each block and evaluate the applicability of this parameter to study the differences between the two applied volume rates.
It was determined using pheromone dispensers that attract males (product code: PH-057-1RR; Russell IPM Ltd., Deeside, Flintshire, UK). The lure was placed in the center of a white paper adhesive plate protected inside a delta trap (Koppert BV, Berkel en Rodenrijs, The Netherlands). Five traps were uniformly distributed in each treatment block of the plot, and each trap was placed at a medium height inside canopies. The sticky traps were changed fortnightly (and before the PPP applications) between April and October, and the lures were renewed every forty or fifty days. The number of A. aurantii males, within an area of 18 cm × 16 cm, was counted in the laboratory using a stereo microscope. Then, based on the number of days the trap had been exposed in the field, the number of A. aurantii males per day was calculated.

2.5.2. Number of A. aurantii per Fruit

At harvest, 10 trees per block were randomly selected per plot and year. In each tree, 40 fruits evenly distributed in the four cardinal directions (north, south, east and west) and in from inside and outside of the canopy were sampled. In the plots where the tree row formed a hedge (all plots except P3 and P4), with the canopy of adjacent trees touching one another, all the fruits on the tree faces in contact with adjacent trees were considered fruits of the inside of the canopy. In each fruit, the number of A. aurantii scales was counted.
Furthermore, in Spain, the economic threshold for the first generation of A. aurantii is 2% of infested fruit in the previous season. Infested fruit is considered to have more than three scales per fruit [44]. Therefore, percentage of cull fruit due to California red scale was calculated for each treatment and orchard.

2.6. Economic and Environmental Advantages with CitrusVol

For each plot, the average transit time of the equipment from the center of the plot to the water fill point was measured. On the other hand, the filling time of various tanks in various plots was measured, and an average value of 9.92 · 10−5 h per liter of tank was obtained. Therefore, the tank refill time (h), including filling time and equipment transit time to and from the water sources, was calculated for each plot and equipment used.
Subsequently, depending on the spray volume applied in each treatment (VC and VA) and the capacity of the tank of the sprayer used, the number of tanks necessary to carry out each spray application per unit area was estimated (rounding up to the nearest integer). Then the time savings of tank refill per unit area due to the use of the adjusted volume was calculated. Economic and environmental savings were calculated from these values.
The cost saving due to the service of PPP application with operator (which includes the operator working time and the use of the sprayer, not including the cost of the PPP) was calculated considering an average cost of 33 €/h for the service [45].
The savings in fuel was calculated assuming an average tractor consumption during refill of 10.5 L/h [46] and average price of gasoil B of 0.821 €/L [47].
The reduction of CO2 emissions was calculated from the reduction of fuel consumptions and knowing that 1 L of diesel fuel consumption produces a CO2 emission of 2.61 kg [48].

2.7. Data Analysis

A one-way analysis of variance (ANOVA) was carried out to study the effect of spray volume on coverage in each of the 12 canopy zones (combination of three heights, two depths and two leaf sides) considering the 13 coverage evaluations together. For that, coverage in each canopy zone was calculated as the average of the three widths per tree, and the mean coverage of the three replicates per evaluation, corresponding to the three trees per block was used.
Furthermore, a one-way ANOVA was done to study the effect of spray volume on coverage for each of the 13 evaluations (combination of plot and year), and per depth (inside/outside). In this way the results can be compared with the number of scales per fruit that were measured in the two depths.
In all analyses, the homogeneity of the variances was verified by the Levene test and the normality was checked by normal probability plot of the residuals. The Fisher’s least significant difference (LSD) test was applied to study the mean differences.
The effect of spray volume on the number of scales per fruit for each depth and year, considering the plots as repetitions, was analyzed using a nonparametric Kruskal-Wallis test because the assumption of normality was not fulfilled. Moreover, a descriptive analysis in each plot and year, and per depth, was performed.
The confidence level considered in all the statistical analyses was 95%.

3. Results

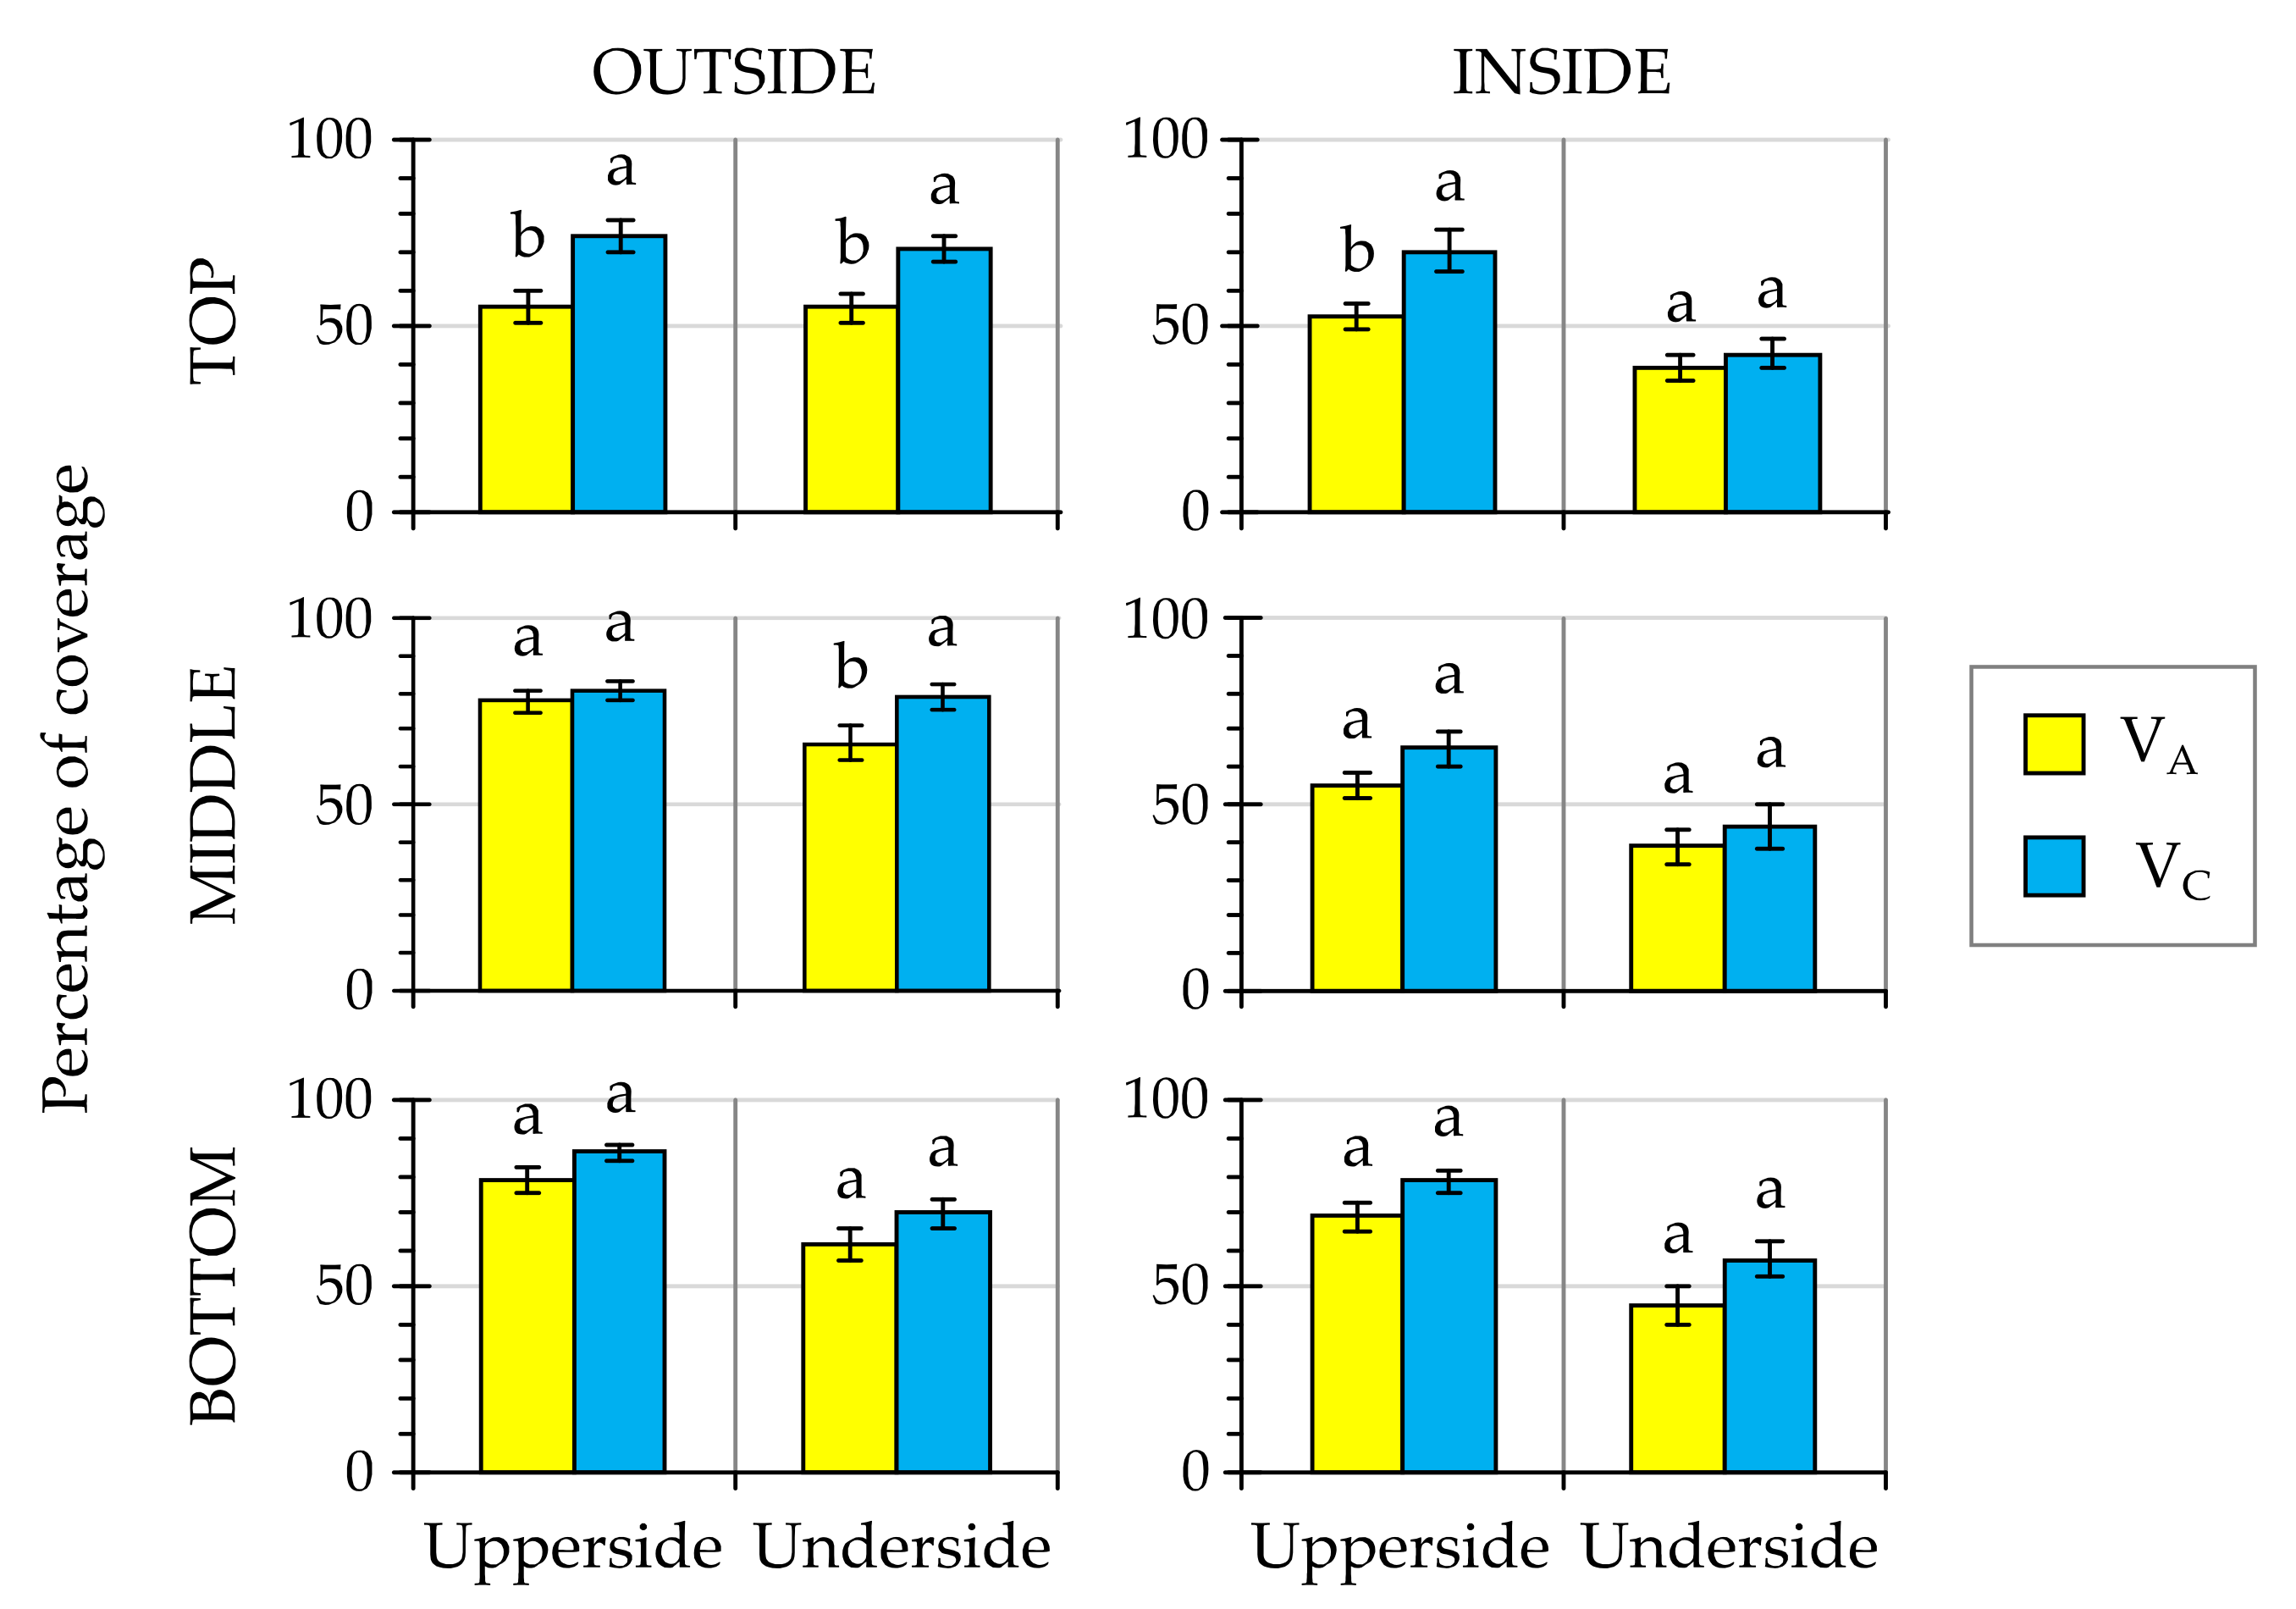
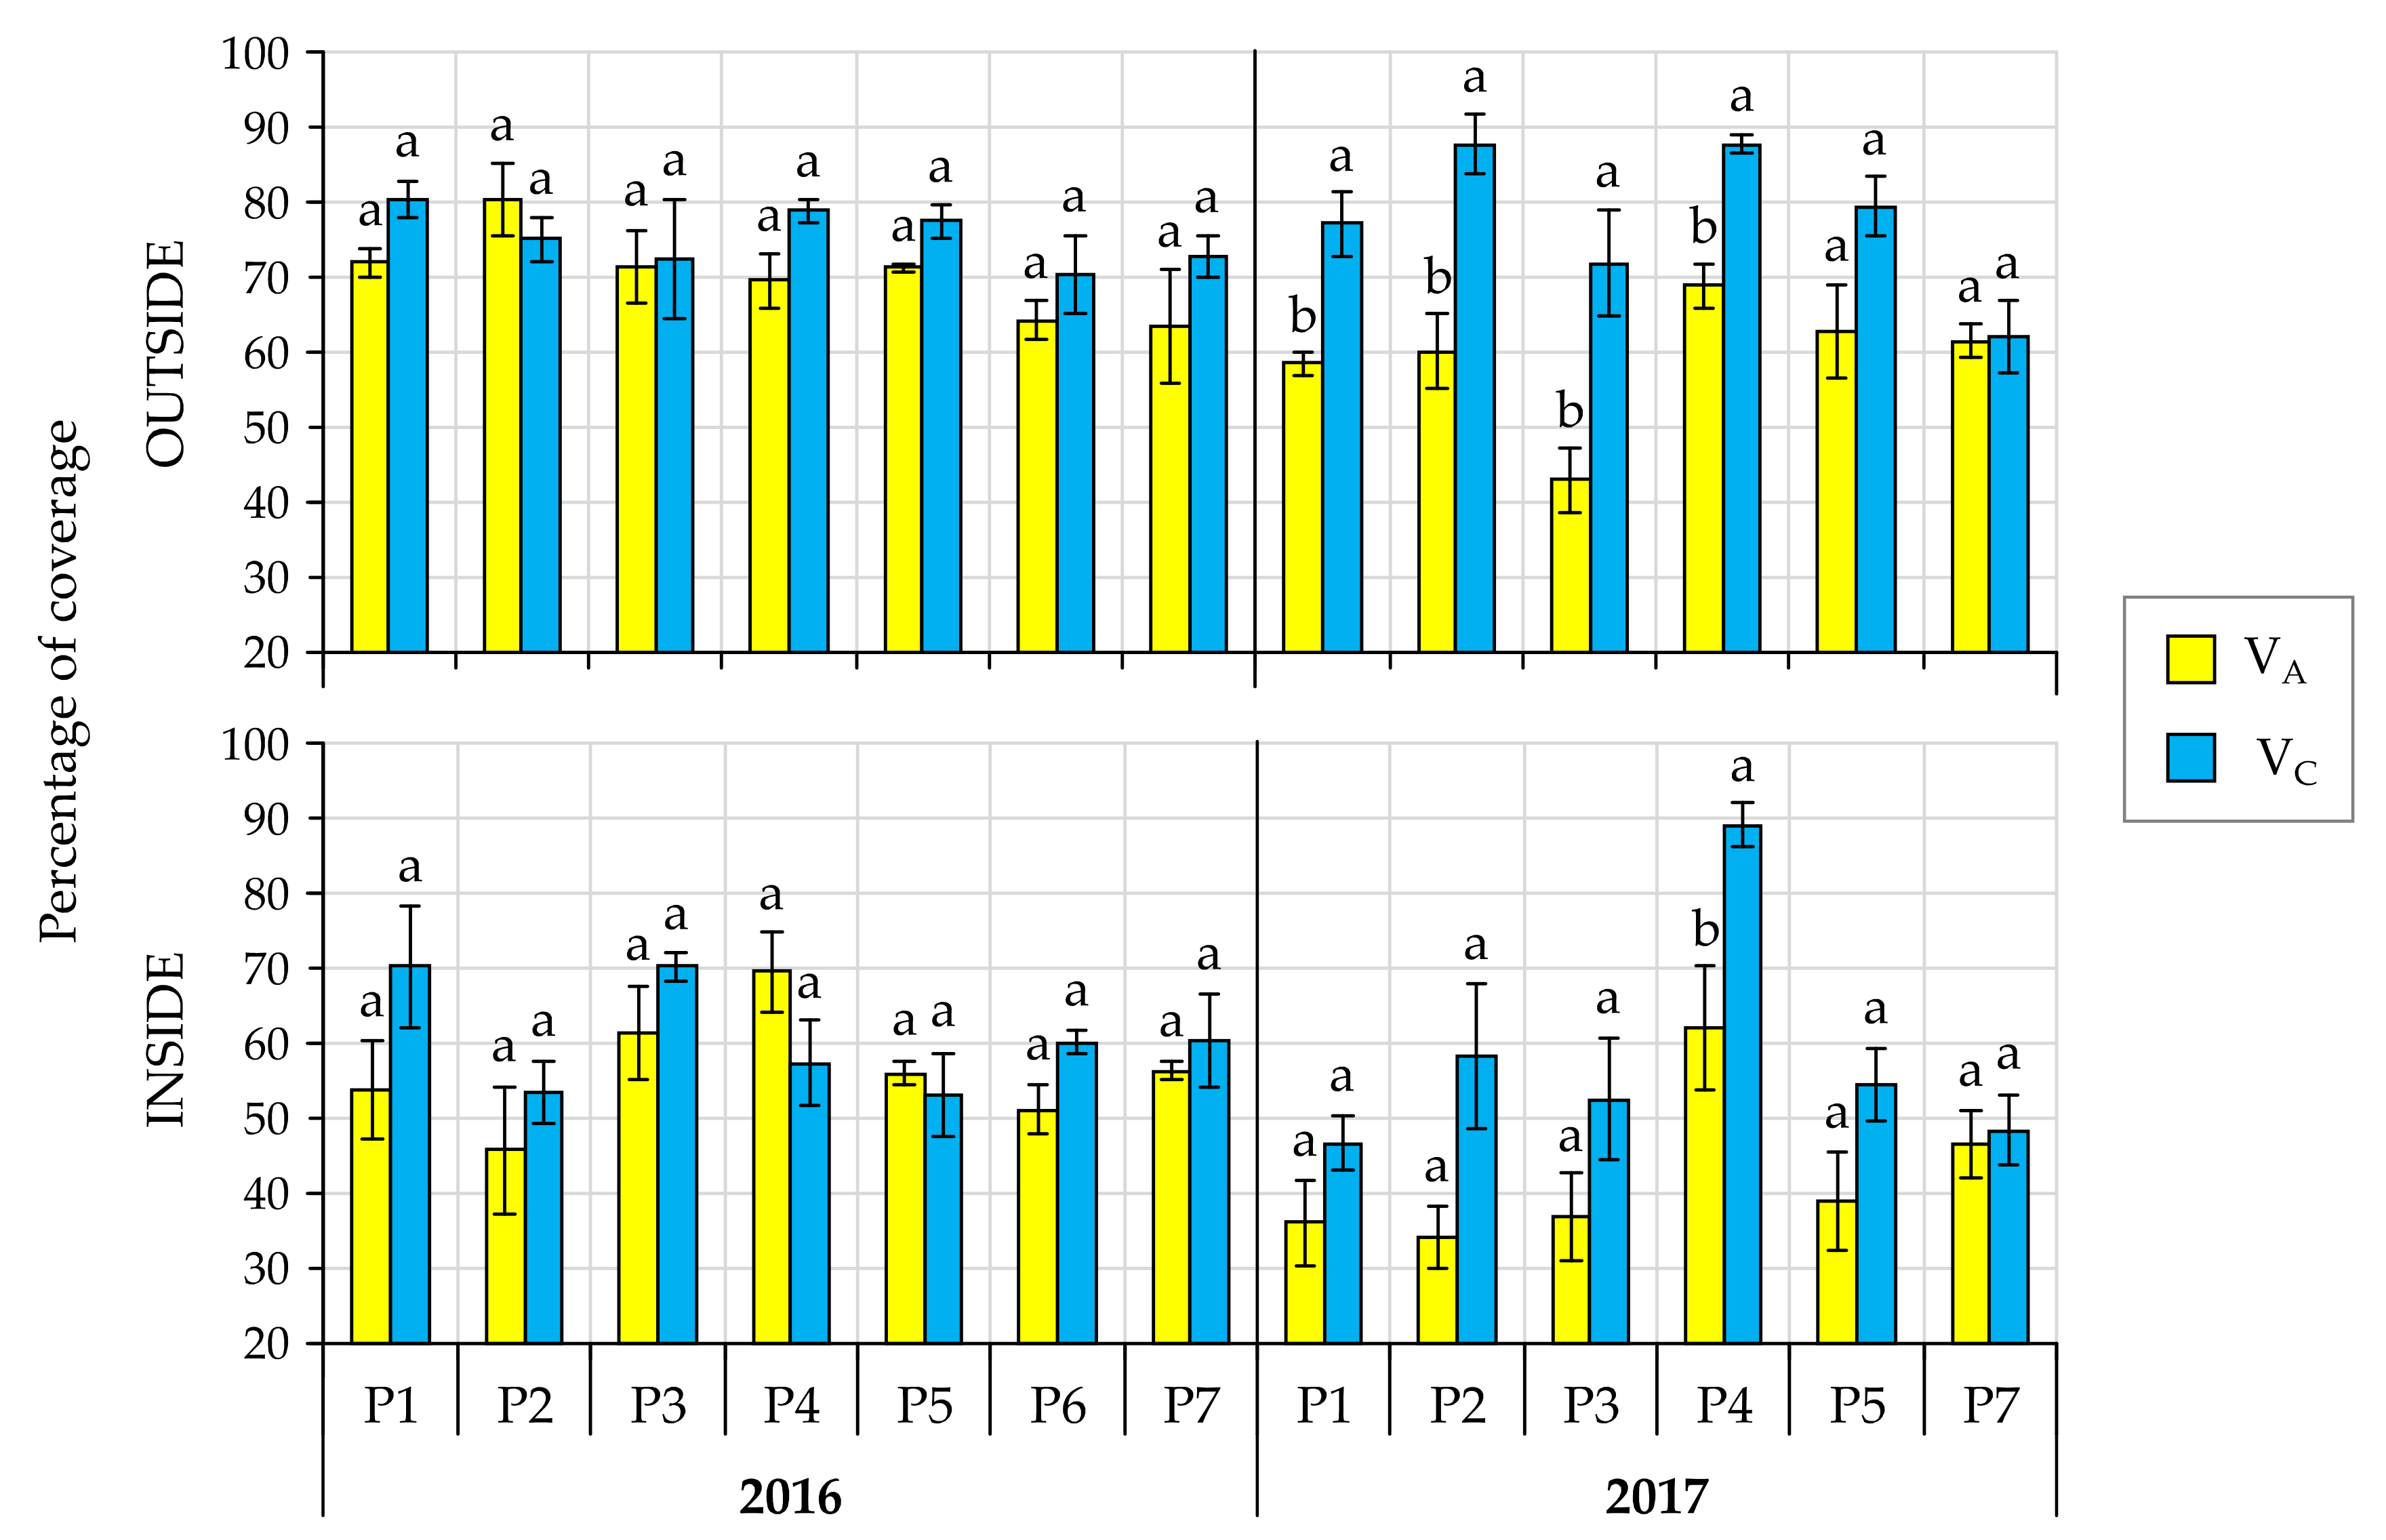
3.1. Effects on Spray Distribution on the Canopy

When the percentage of coverage was compared between spray volumes in 12 canopy zones considering the average result of the 13 evaluations, the coverage was not significantly different between the conventional volume (VC) and the adjusted volume (VA) (p > 0.05) except in four zones of the canopy, three of them in the top, where coverage was significantly higher for VC than for VA (Figure 3) (top-outside-upperside (F = 9.09; df = 1, 25; p = 0.006), top-outside-underside (F = 9.92; df = 1, 25; p = 0.0043), top-inside-upperside (F = 6.61; df = 1, 25; p = 0.0168) and middle-outside-underside (F = 4.59; df = 1, 21; p = 0.0447)). Nevertheless, the average coverage values for both volumes were higher than 30%. Regardless the spray volume used, the coverage was higher on the outside of the canopy than on the inside, at the three canopy heights and on both sides of the leaves. On the outside of the canopy, the medium height was the one that got the highest coverage, while on the inside, the bottom height was the zone with the highest coverage. The upperside of the leaves had higher coverage than the underside, at both depths, although this difference was more pronounced inside the canopy.
In the analysis of the effect of spray volume on coverage for each of the 13 applications using the three trees per plot as replicate, the results, differentiating by canopy depth, showed that the differences on coverage between VC and VA were not significant in most of the cases except in four cases (Figure 4) where higher coverage was obtained with VC: P1 2017 outside (F = 16.58; df = 1, 5; p = 0.0152), P2 2017 outside (F = 19.16; df = 1, 5; p = 0.0119), P3 2017 outside (F = 12.03; df = 1, 5; p = 0.0256) and P4 2017 outside (F = 33.95; df = 1, 5; p = 0.0043) and inside (F = 9.59; df = 1, 5; p = 0.0364).

3.2. Effects on Control of A. aurantii

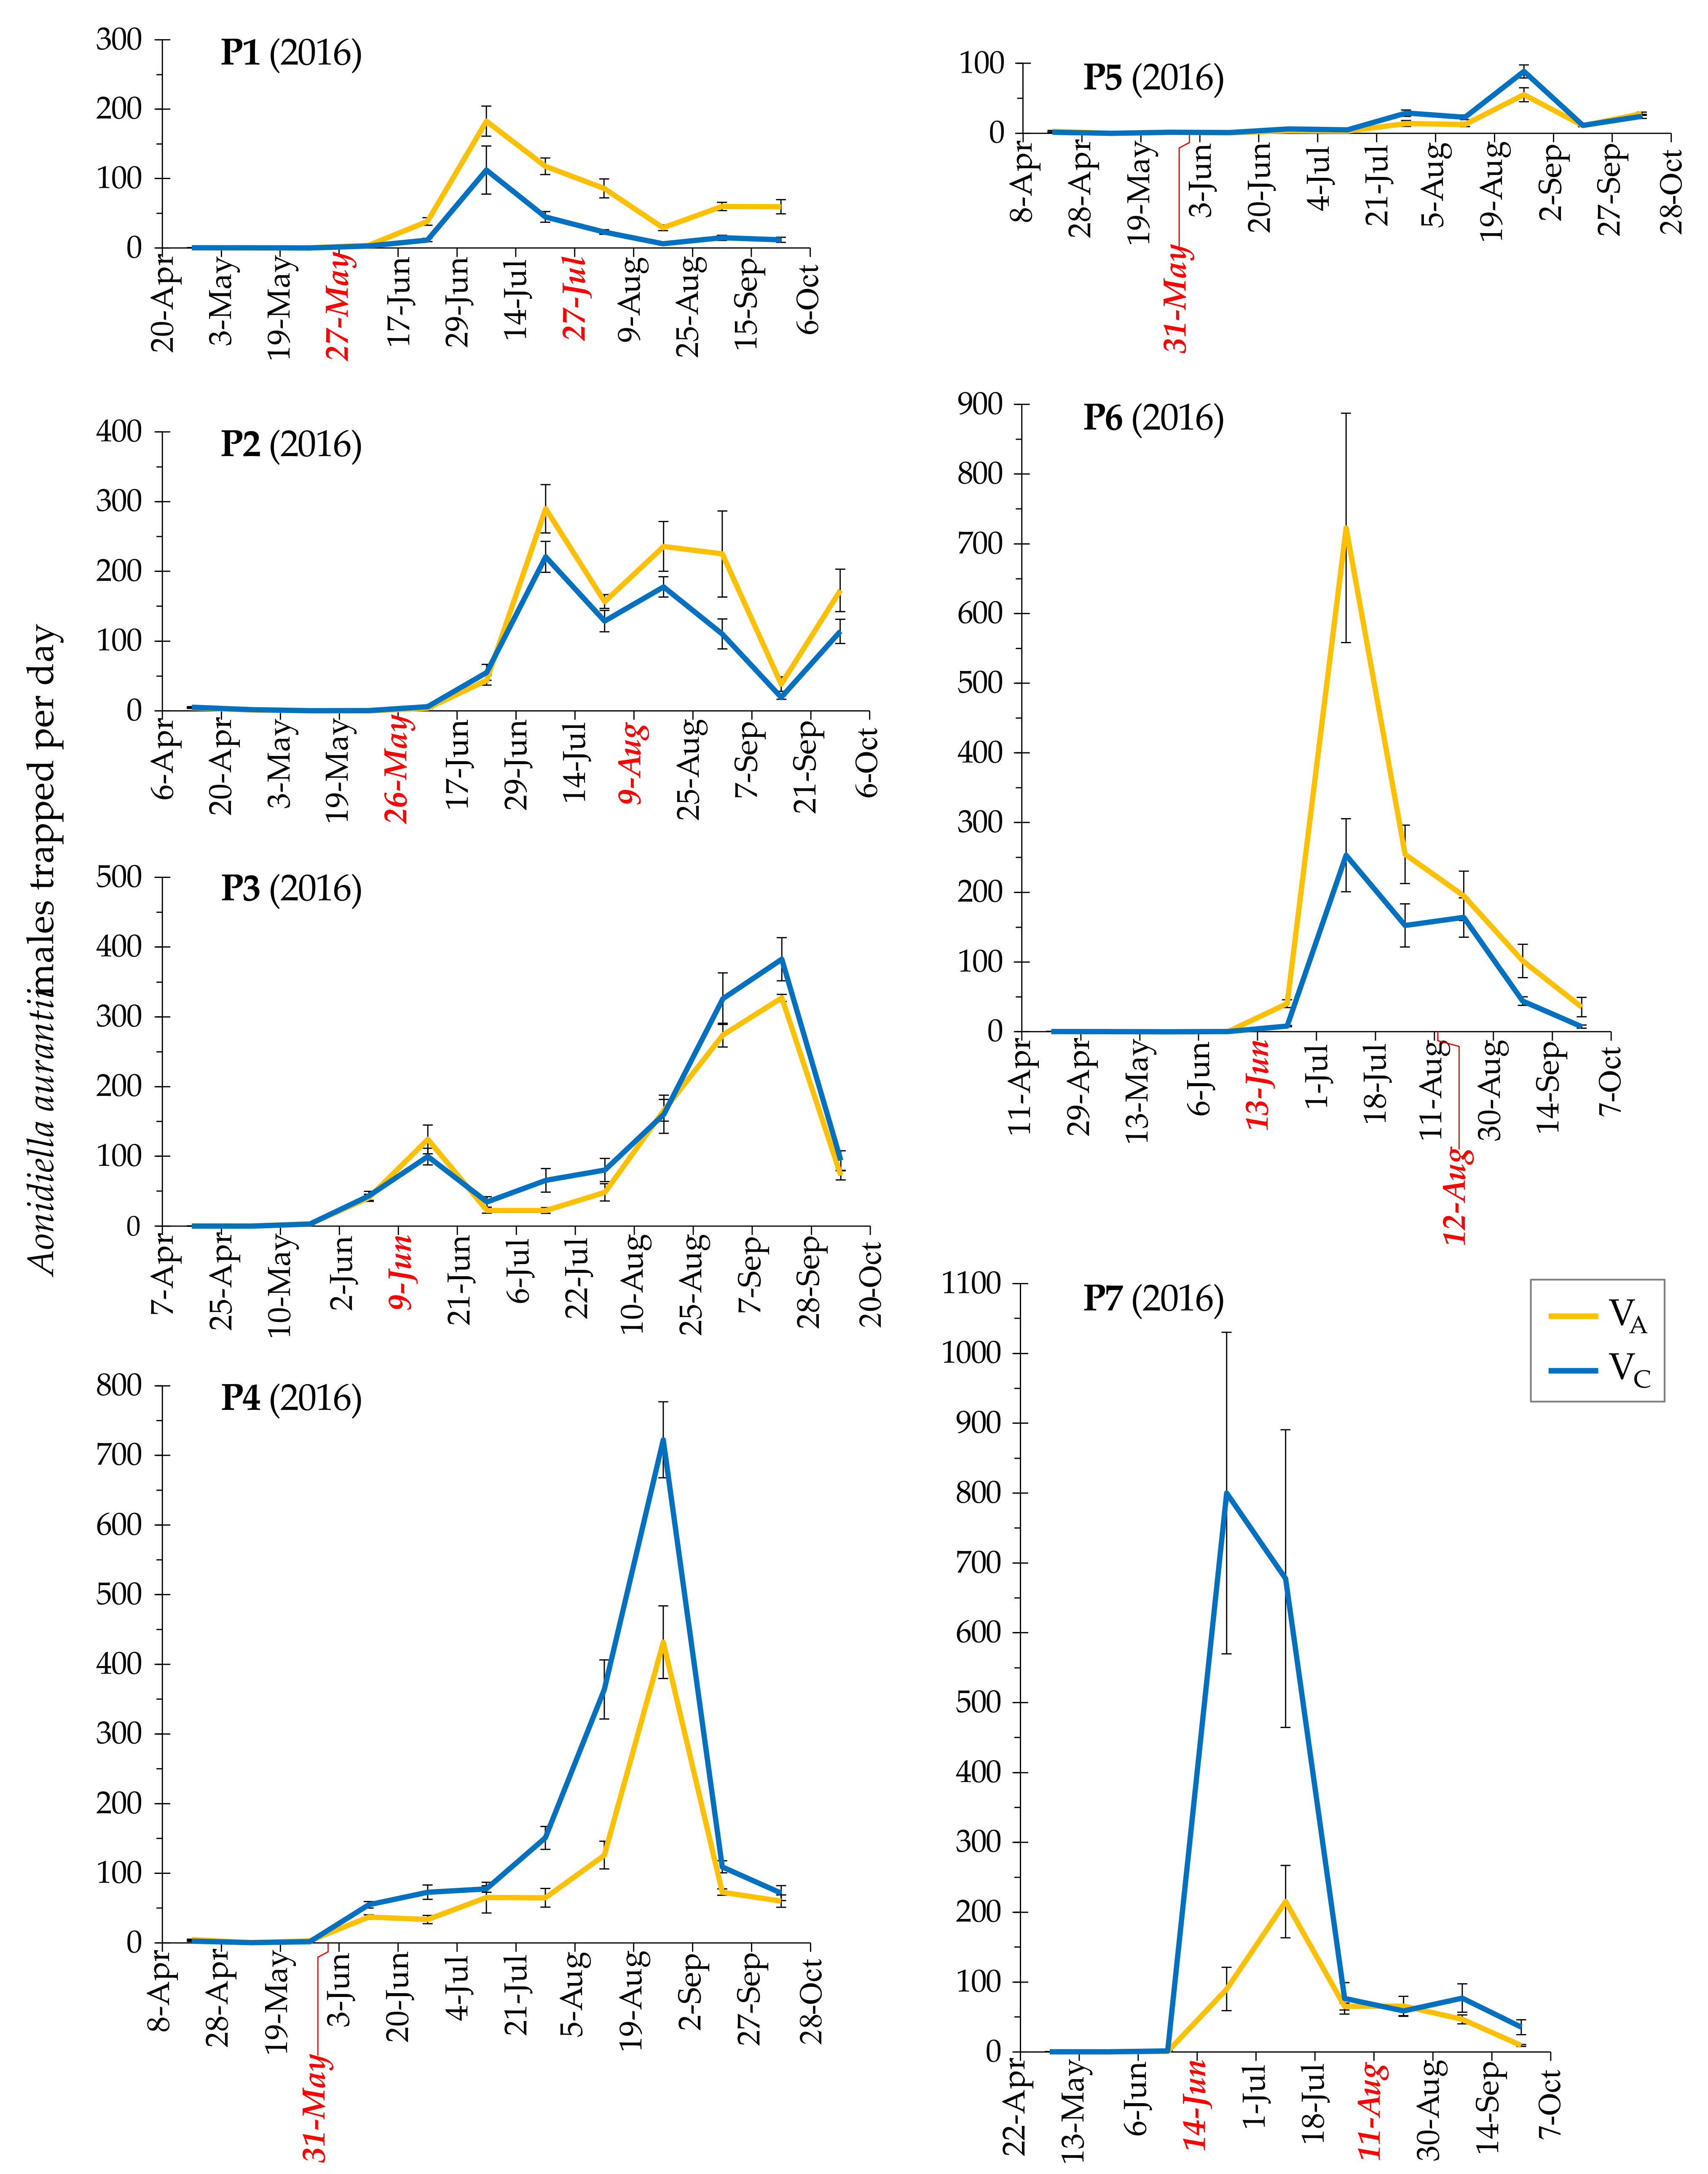
3.2.1. Monitoring of A. aurantii Male Flight

The number of A. aurantii males caught with pheromone traps per day in each plot in 2016 was very low between April and May in all the blocks (Figure 5). The number of A. aurantii males began to increase in June. The highest mean number of males trapped was 800.15, and it was obtained in the block treated with VC in plot P7 between June 14 and July 1. After the summer, the number of males began to decrease in most of the plots. When comparing between treatments, there was not a clear trend, while the density of A. aurantii males was similar for both VC and VA in some orchards (P3 and P5), others had higher densities in some blocks indistinctively of the treatment. Therefore, this parameter was not considered useful to determine differences between different spray volumes and in 2017 the traps were not evaluated.

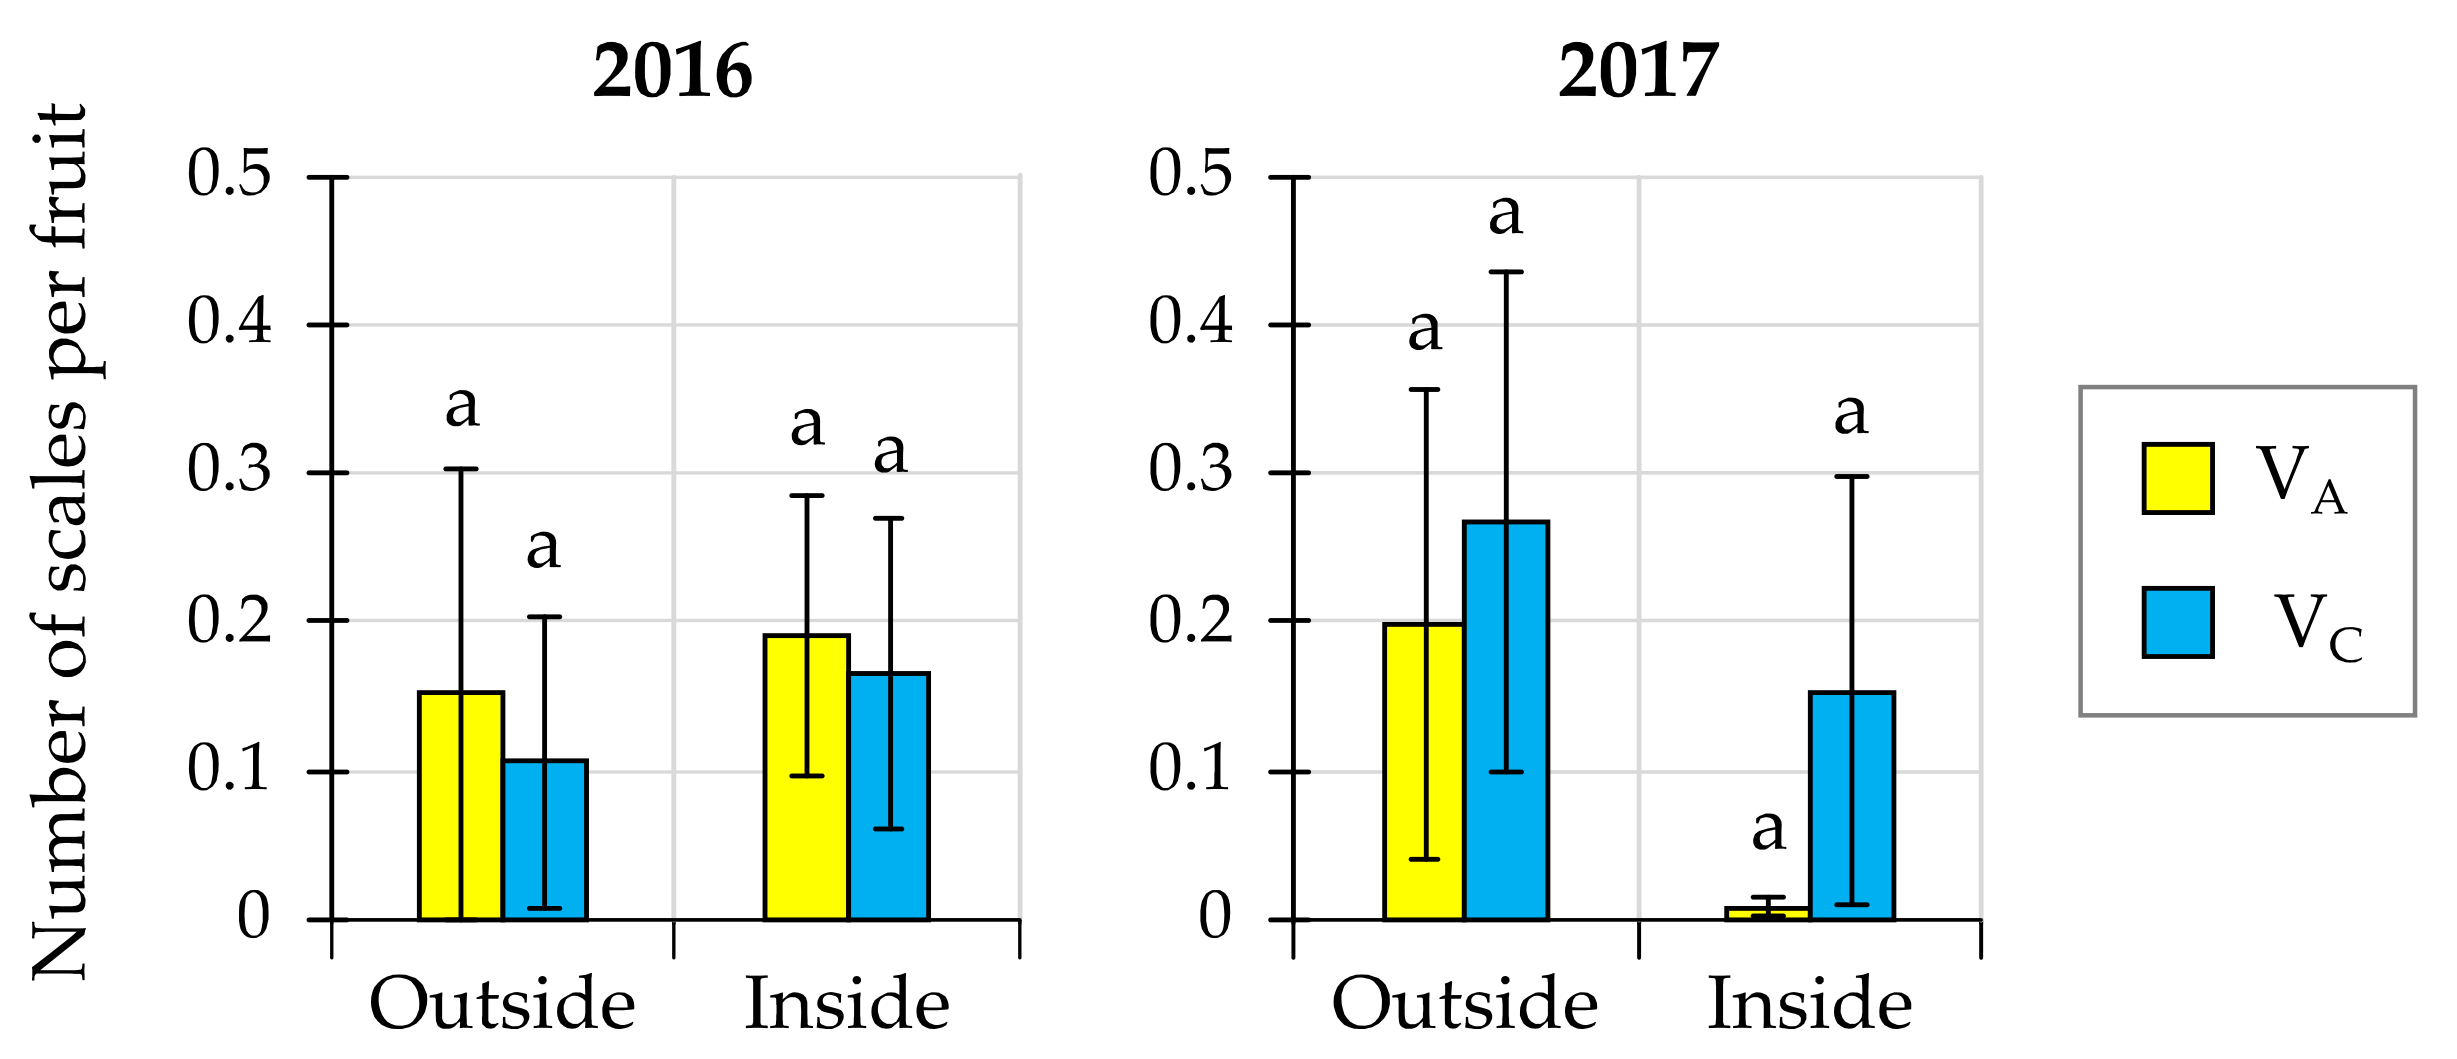
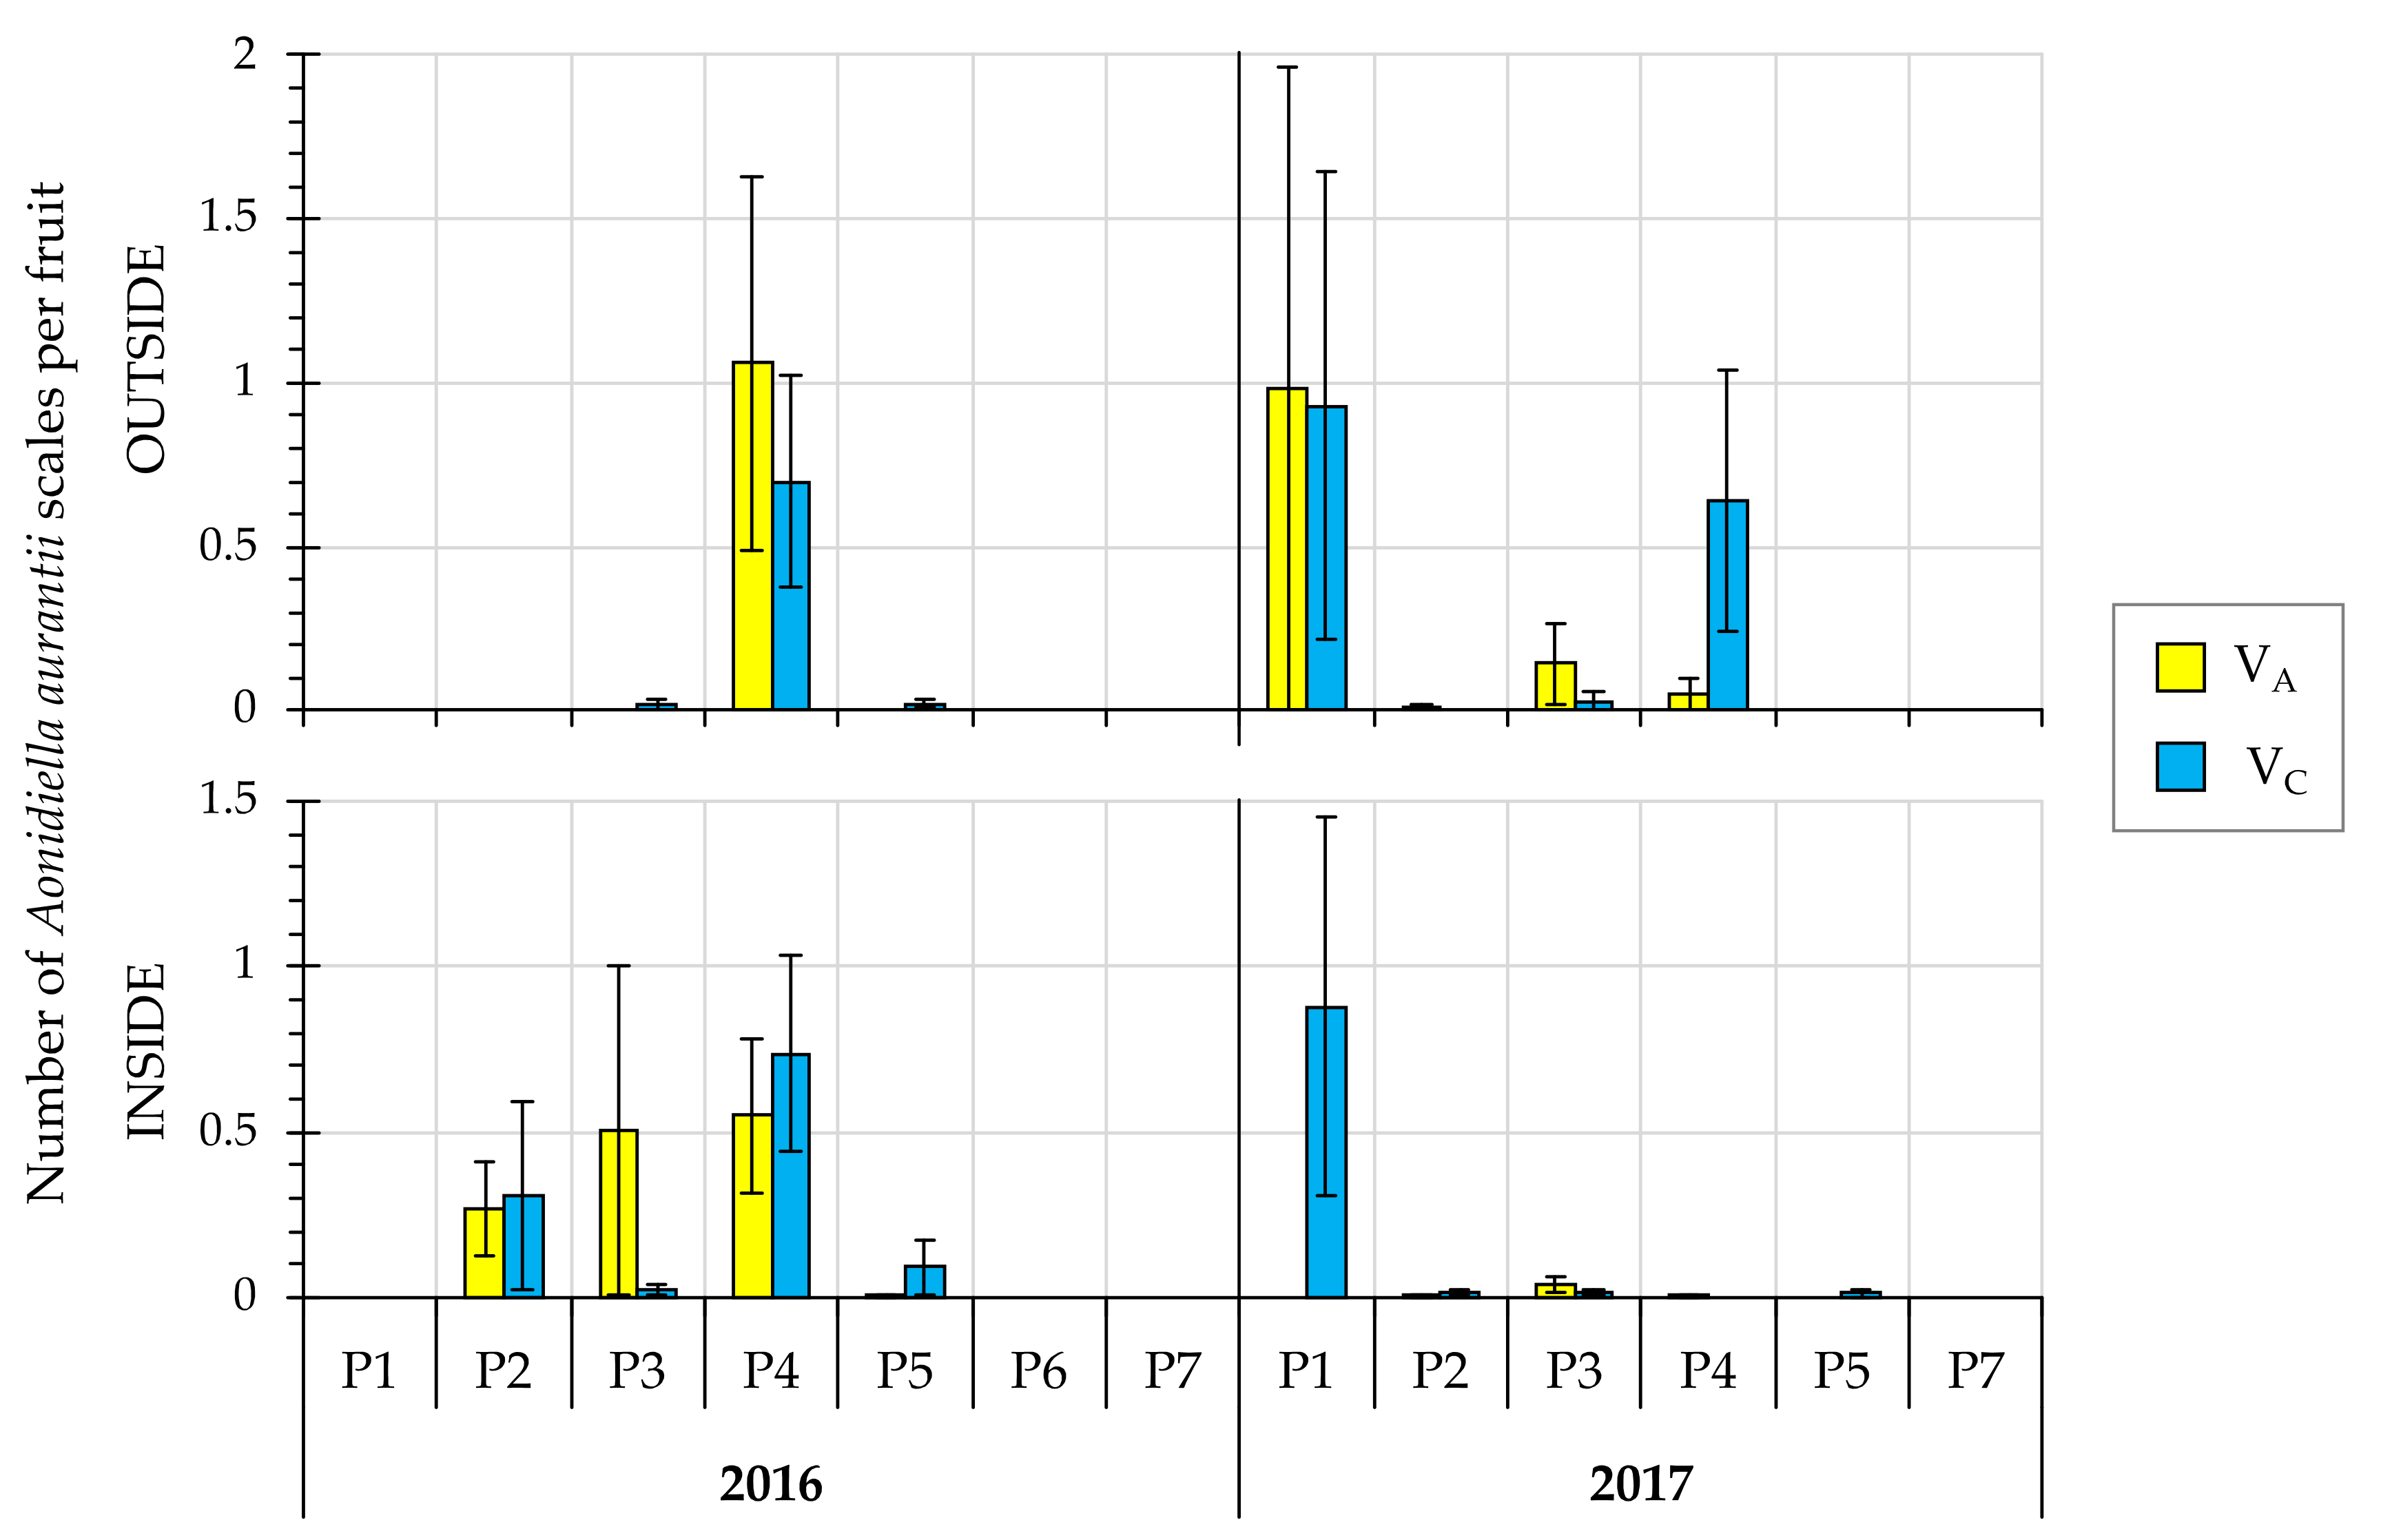
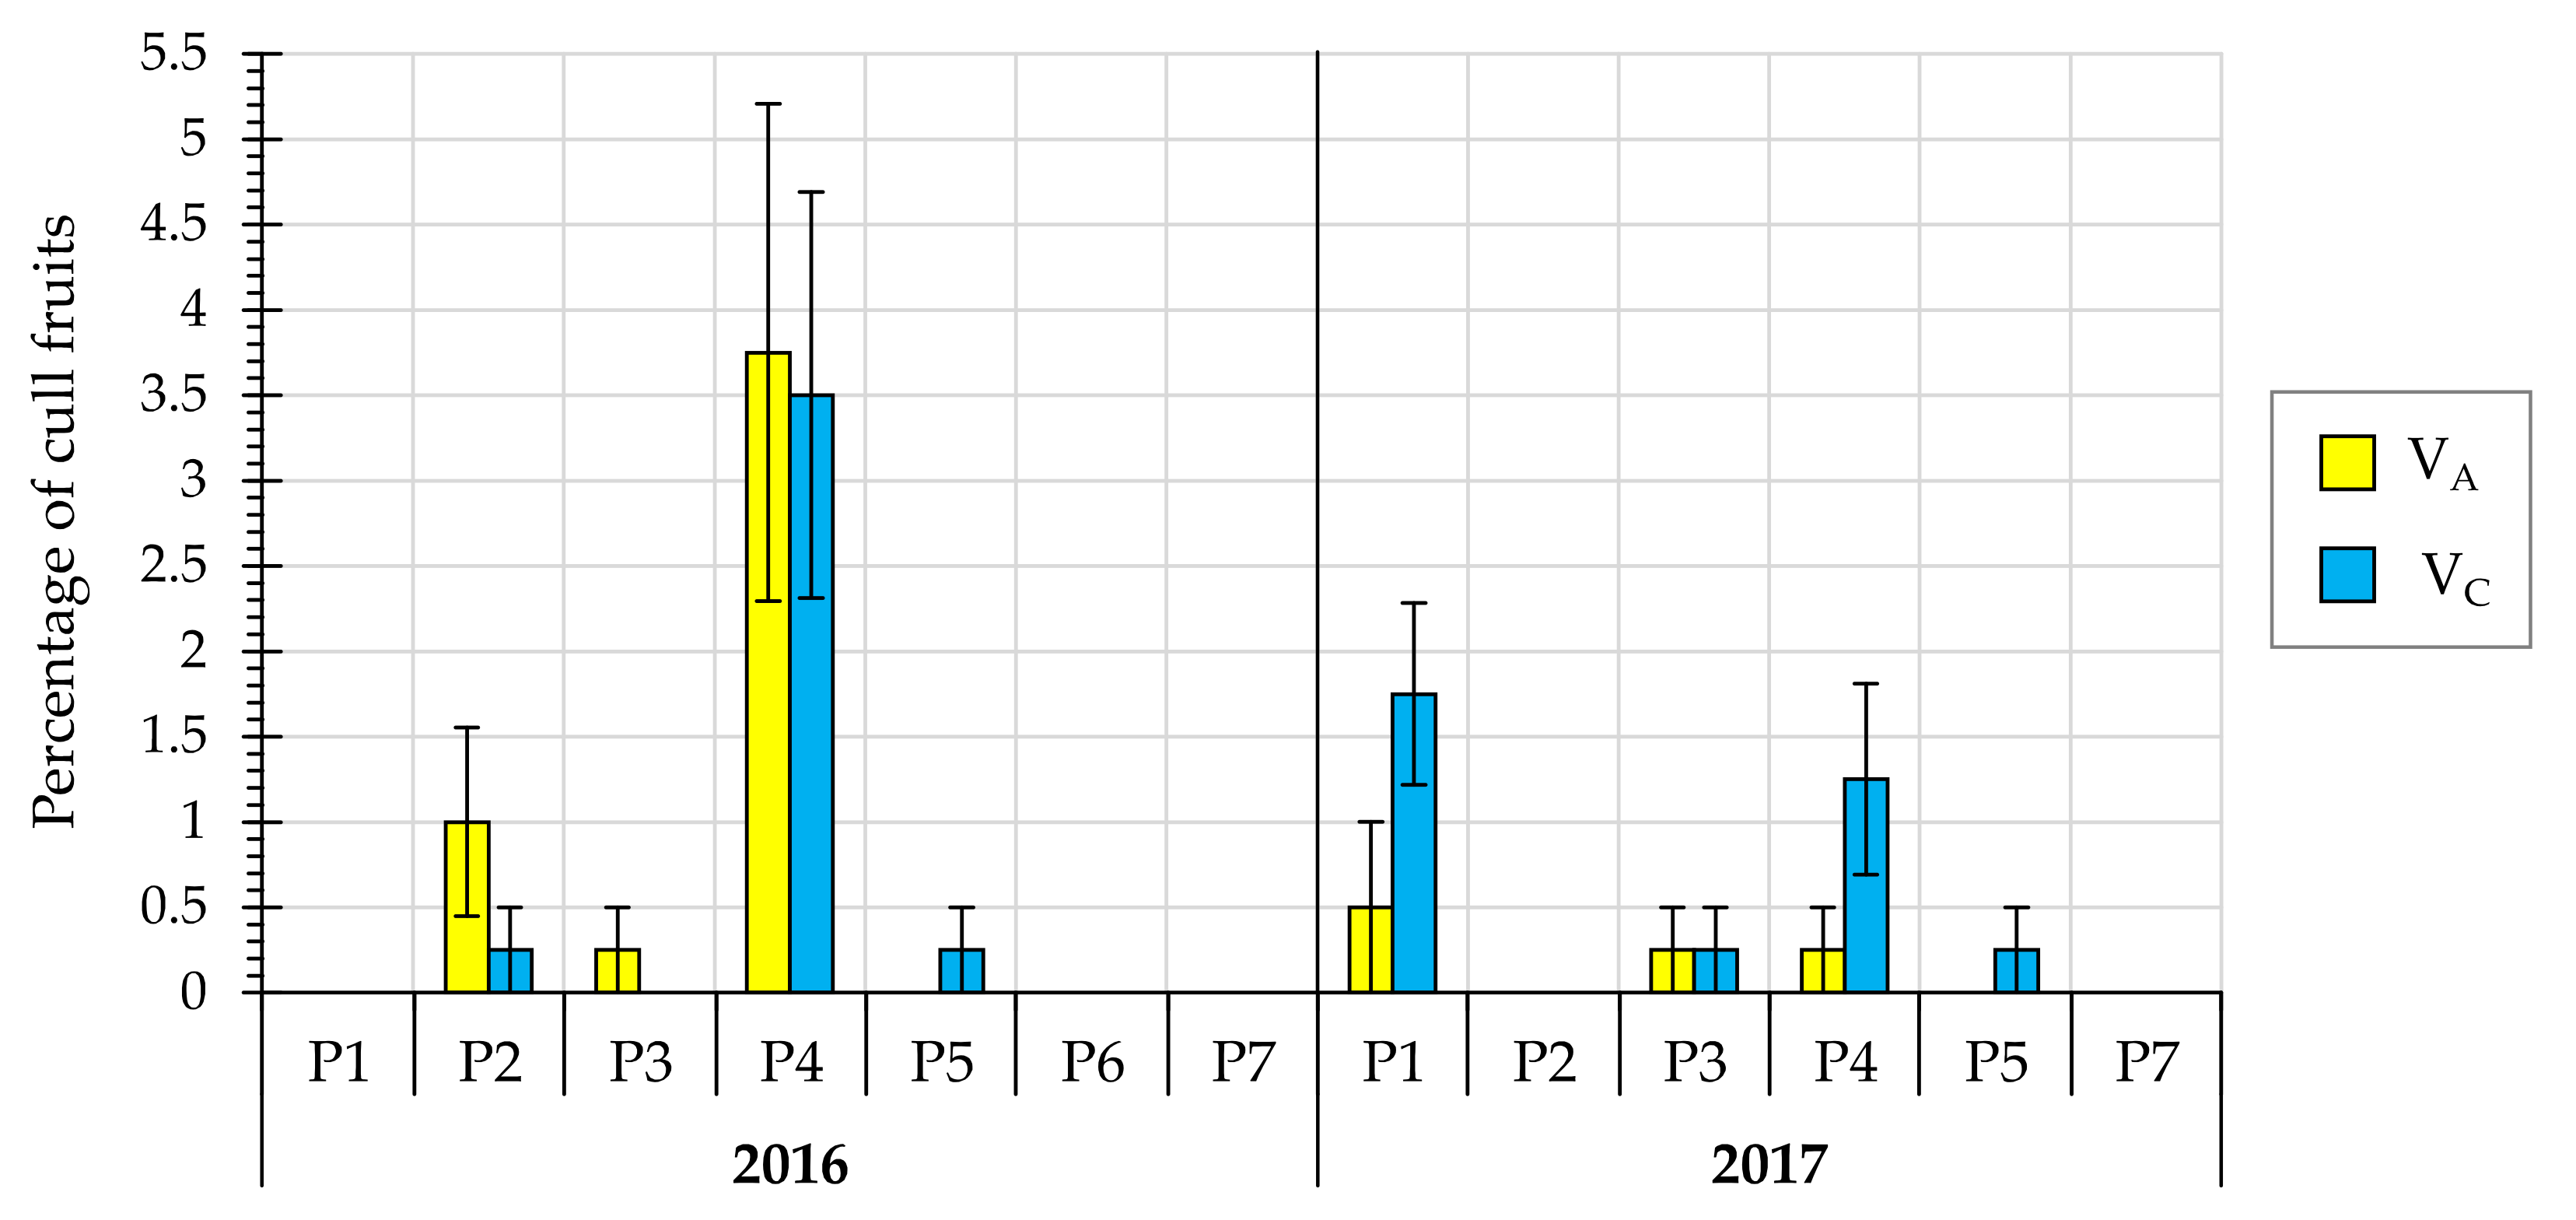
3.2.2. Number of A. aurantii per Fruit

The mean number of A. aurantii scales per fruit at harvest, considering the plots as repetitions, was similar in trees treated with the adjusted or conventional volume in both depths of the canopy and in both years (Kruskal-Wallis test, 2016: outside: p = 0.38, inside: p = 1; 2017: outside: p = 0.74, inside: p = 0.32) (Figure 6).
In all orchards and in both years, the mean number of scales per fruit for both spray volumes was very low (Figure 7).
Furthermore, in all orchards and in both years, the percentage of cull fruit with more than three A. aurantii scales per fruit was in general similar for both spray volumes (Figure 8).

3.3. Economic and Environmental Advantages with CitrusVol

The time savings of tank refill for each spray application for 1, 10 and 100 hectares are shown in Table 4. Application time decreased when the volume was adjusted with CitrusVol and these differences were higher when the treated surface increased. For an area of 1 ha, the range of time saving per PPP application using CitrusVol in the plots tested was between 0 and 1.17 h, and on average 0.34 h. Meanwhile, for an area of 10 ha, the use of CitrusVol would save between 0.42 and 9.77 h, and on average 3.12 h, and for an area of 100 ha, the use of CitrusVol would save between 5.42 and 97.36 h, and on average 31.25 h (Table 4).
The cost savings per spray application due to, in the one hand, the reduction of PPP application service, and on the other hand, the reduction of fuel consumption, and also the CO2 emissions reduction are shown in Table 5. Regarding the cost savings of PPP application service using CitrusVol in the plots tested, for an area of 1 ha, the range was between 0 and 30.46 €, and on average 8.44 €; for an area of 10 ha, the use of CitrusVol would save between 11.01 and 253.82 €, and on average 75.91 €; and for an area of 100 ha, the use of CitrusVol would save between 143.11 and 2582.02 €, and on average 760.05 €. Regarding the savings of fuel consumption and its cost, for an area of 1 ha, the range was between 0 and 9.69 L (2.69 L on average) that suppose a cost of 0 and 7.96 €, and on average 2.21 €; for an area of 10 ha, the use of CitrusVol would save between 3.50 and 80.76 L (24.15 L on average) that suppose a cost of 2.88 and 66.30 €, and on average 19.83 €; and for an area of 100 ha, the use of CitrusVol would save between 45.53 and 804.37 L (241.83 L on average) that suppose a cost of 37.38 and 660.39 €, and on average 198.55 €. Finally, regarding the reduction of CO2 emissions, for an area of 1 ha, the range was between 0 and 25.29 kg CO2, and on average 7.01 kg CO2; for an area of 10 ha, the use of CitrusVol would reduce the emission of between 9.14 and 210.78 kg CO2, and on average 63.04 kg CO2; and for an area of 100 ha, the use of CitrusVol would reduce between 118.85 and 2099.41 kg CO2 emitted to the environment, and on average 631.18 kg CO2 (Table 5).
Furthermore, it has to be taken into account that the percentage of reduction of cost of PPP and of reduction of direct emissions of PPP to the environment are the same reduction percentage of water volume, that is, between 11.62% and 74.08%, with an average of 35.02%, because PPPs are mixed based on concentration.

4. Discussion

The use of CitrusVol reduced the spray volume used to control A. aurantii by between 11.62% and 74.08% with an average of 35.02%. This reduction of volume implied a reduction in the coverage in some parts of the tree canopy mainly in the top but it was enough to control the number of A. aurantii scales per fruit at harvest outside and inside the canopy. These results are in line with previous studies where the reduction of spray volume up to optimal volume, did not decrease the effectiveness of the application against A. aurantii [20,21,22,23,49] and other citrus pests such as citrus mealybug Planococcus citri Risso [20], citricola scale Coccus pseudomagnoliarum (Kuwana) [24], Asian citrus psyllid Diaphorina citri Kuwayama and citrus leafminer Phyllocnistis citrella Stainton [25], and citrus rust mite Phyllocoptruta oleivora (Ashmead) [26,27]. The mean number of scales per fruit was very low in most of the cases, in spite of the number of males trapped per day, which showed maximum values between 100 and 800. These values, in Spanish conditions, indicate that the density of A. aurantii population was not low. Therefore, the low number of scales per fruit at harvest was likely due to the high efficacy of both conventional and adjusted volume.
The efficacy of an application depends on how the PPP is distributed on the tree, rather than on the amount of water volume applied itself [24]. It is acknowledged that the spray volume play an important role on the distribution of the spray on the canopy but increasing the spray volume does not always imply better results in terms of efficacy. Once the efficacy limit is reached, increasing spray volumes and coverage is meaningless. Therefore, the most important is to get a minimum coverage in the area of the canopy where the target pest is located, increasing the efficiency of the applications. In the case of A. aurantii applications must reach the inner part of the tree, and the minimum coverage to be achieved depends on the PPP and the pest stage, and in general terms, it should be between 20–40% [21]. In this study, the reduction of the spray volume did not greatly affected the distribution, because it was observed that, regardless the spray volume used (conventional or adjusted), a satisfactory spray distribution was achieved, and in both cases it followed the common pattern got with air blast sprayers in citrus: less coverage on the top and inside the canopy and on the underside of leaves, which is the surface least exposed to the application [50,51,52]. The reduction of spray volume only produced differences in the top of the canopy, but it is important to highlight that in all cases the minimum coverage necessary to control the pest was achieved, which will support the results obtained in the efficacy evaluations.
The male flight monitoring, although it is used to monitor the number of generations of A. aurantii per year, was not useful to determine potential differences between treatments in our study. No clear trend was observed in 2016 and, therefore, this method was not used in the following year.
In Spain, as in other countries of the southern European Union regulatory zone (including Bulgaria, Cyprus, France, Greece, Italy, Malta and Portugal), the dose expression in PPP instructions labels for three-dimensional crops such as citrus, is mainly expressed as concentration (%, rate/hL) and/or as the maximum dose of product per hectare in each application [53,54]. Consequently, a reduction of the spray water volume results in a reduction of applied dose of pesticide per unit area because concentration is constant. Therefore, the use of concentration, as dose expression, together with the CitrusVol tool allows for increasing effectiveness of the PPP use in citrus.
Moreover, the cut down on spray volume rate is likely to reduce drift, leaching and run-off, and therefore to reduce PPP losses to the environment (atmosphere, soil and groundwater) [37,55]. As it has been shown, CitrusVol would allow an average reduction of 35% of PPP emissions to the environment. Moreover, the reduction on tractor use time due to the use of CitrusVol may decrease CO2 emissions in 7.01 kg CO2/application for 1 ha, 63.04 kg CO2/application for 10 ha and 631.18 kg CO2/application for 100 ha on average.
Together with the environmental advantages of CitrusVol, its use also represents economical advantages, because it likely reduces the use of PPP and fuel, and the working hours, due to the lowering of tank refills [37]. Time savings per spray application against A. aurantii may reach 0.34 h/application for 1 ha, 3.12 h/application for 10 ha and 31.25 h/application for 100 ha on average, which would imply that the cost of the PPP application service is reduced by 8.44 €/application for 1 ha, 75.91 €/application for 10 ha and 760.05 €/application for 100 ha on average. Time savings would imply also a reduction in fuel cost, which could be reduced by 2.21 €/application for 1 ha, 19.83 €/application for 10 ha and 198.55 €/application for 100 ha. The percentage of reduction of cost of PPP would be 35% on average. Since the cost of PPP applications, including PPP cost, PPP application service and fuel consumption, account for 10% of the production costs in mandarin crops in the Valencian Community (Spain) [56], farmers would increase the profitability of their farms using CitrusVol.
In conclusion, as it was demonstrated in real citrus production conditions, CitrusVol is a useful tool supporting the growers to adjust the spray volume rate for PPP applications against A. aurantii in citrus. Such adjustment allows for significant reduction of PPP use, saving on time, labour and fuel, as well as decreasing CO2 emission during the crop protection practices.

Author Contributions

Conceptualization, C.G., A.T. and P.C.; methodology, C.G., A.T. and P.C.; validation, A.F., C.G., A.T. and P.C.; formal analysis, A.F., C.G., A.T. and P.C.; investigation, A.F.; resources, A.T. and P.C.; data curation, A.F.; writing—original draft preparation, A.F.; writing—review and editing, C.G., A.T. and P.C.; visualization, A.F.; supervision, P.C.; project administration, P.C.; funding acquisition, A.T. and P.C. All authors have read and agreed to the published version of the manuscript.

Funding

This research was funded by IVIA (internal project numbers 51422 and 51918) and by the contribution of LIFE financial instrument of the EU (PERFECT LIFE project: Pesticide Reduction using Friendly and Environmentally Controlled Technologies; ref. LIFE17/ENV/ES/000205) cofunded by the European Regional Development Fund (ERDF). It also was funded by the project of the Operative Group “Technological advances for modernization and sustainability in citrus production (GO CITRUSTECH)” cofunded by the Agricultural European of Rural Developing–EAFRD (80%) and the Ministry of Agriculture, Fisheries, and Food (20%). A. Fonte was beneficiary of an employment contract as a part of the National Youth Guarantee System of Spain financed by the European Social Fund (ESF) and the Youth Employment Initiative (YEI).

Institutional Review Board Statement

Not applicable.

Informed Consent Statement

Not applicable.

Data Availability Statement

The data presented in this study are available on request from the corresponding author.

Acknowledgments

The authors would like to thank Agrimarba S.A., Fontestad S.A., Peiró Camaró S.L. and Revacitrus S.L. for the use of their citrus orchards and sprayer equipment; and P. Bru, I. Carrillo, J. Catalán and G. Mateu from IVIA, for their support in the field work.

Conflicts of Interest

The authors declare no conflict of interest. The funders had no role in the design of the study; in the collection, analyses, or interpretation of data; in the writing of the manuscript, or in the decision to publish the results.

Appendix A

Table A1. Active ingredients of the plant protection products (PPPs) used in the spray applications against Aonidiella aurantii.
PlotApplication DateCommercial PPPActive Ingredient
P127 May 2016Dursban 48Chlorpyrifos
PromexPyriproxyfen
27 July 2016Movento 150 O-TeqSpirotetramat
7 June 2017Dursban 48Chlorpyrifos
8 September 2017Reldan EChlorpyrifos-methyl
P226 May 2016Dursban 48Chlorpyrifos
PromexPyriproxyfen
9 August 2016Movento 150 O-TeqSpirotetramat
22 August 2017Movento 150 O-TeqSpirotetramat
P39 June 2016Movento 150 O-TeqSpirotetramat
23 June 2017Movento 150 O-TeqSpirotetramat
P431 May 2016Movento GoldSpirotetramat
26 June 2017Movento GoldSpirotetramat
P531 May 2016Clorifos 48 ECChlorpyrifos
Atominal 10 ECPyriproxyfen
27 June 2017Movento GoldSpirotetramat
P613 June 2016Dursban 48Chlorpyrifos
Juvinal 10 ECPyriproxyfen
12 August 2016Movento 150 O-TeqSpirotetramat
P714 June 2016Dursban 48Chlorpyrifos
Juvinal 10 ECPyriproxyfen
11 August 2016Movento 150 O-TeqSpirotetramat
30 June 2017Movento 150 O-TeqSpirotetramat
Figure A1. Accumulated degree-days (ADD) in the seven plots (P1–P7) during 2016 and 2017. The application dates are indicated for each plot and each year. The treatment threshold for the first generation is indicated in orange (at 570 ADD), in red for the second generation (1220 ADD) and in maroon for the third (1900 ADD). Lower development threshold temperature for Aonidiella aurantii = 11.7 °C. The temperature data were obtained from the weather stations of the Spanish SIAR (“Servicio de Información Agroclimática para el Regadío”, Agroclimatic Information Service for Irrigation) network [57].
Agronomy 11 01350 g0a1
Table A2. Meteorological conditions 1 during the spray applications and coverage evaluations: temperature, relative humidity, solar irradiance, wind speed, wind direction and precipitation 2.
PlotCoverage
Evaluation
PPP
Application
DateTemperature
(°C)
Relative Humidity
(%)
Solar Irradiance
(W/m2)
Wind Speed
(m/s)
Wind Direction
VCVAVCVAVCVAVCVAVCVA
P127 May 2016232457597318931.112.50SE-SE
27 July 2016252763673374740.561.39NW-N-NEN
7 June 2017232162815902081.670.28NENW-SE
8 September 201724227989265890.560.56N-ENW-W-SE
P226 May 2016222266688116091.941.94EE
9 August 2016312826316904991.391.11SESE
22 August 2017282452645463101.110.28SEW
P39 June 2016262658589027211.941.67E-SEE
23 June 2017292750507123531.390.28SESE-E
P431 May 2016242458416969661.392.22NE-EE
26 June 2017243077542418460.281.67SE-EE-NE-N
P531 May 2016232442417489101.671.67EE
27 June 2017303050556043950.561.39SE-EE-NE
19 September 2017251951886942091.390.56E-NESE-E
P613 June 2016333227299098281.391.11S-SEW-SW
12 August 2016232272793232360.560.56SWW-S
P714 June 2016282745419167242.221.39SE-ES-SE
11 August 2016222569544517700.831.11SW-SS-SE
30 June 2017262122328634842.220.83WSW-NW
4 August 2017272955402954380.561.11SE-N-SWE-SE-S
1 The meteorological conditions were taken from the weather stations of the Spanish SIAR (“Servicio de Información Agroclimática para el Regadío”, Agroclimatic Information Service for Irrigation) network [57]. 2 The precipitation was 0 mm in all cases, except in the application of 26 June 2017 in plot P4 for VA treatment, where it was 0.02 mm. VC: conventional volume; VA: adjusted volume; PPP: plant protection product.

References

  1. Tena, A.; Garcia-Marí, F. Current situation of citrus pests and diseases in the Mediterranean basin. IOBC Bull. 2011, 62, 365–368. [Google Scholar]
  2. Urbaneja, A.; Grout, T.G.; Gravena, S.; Wu, F.; Cen, Y.; Stansly, P.A. Citrus pests in a global world. In The Genus Citrus; Talón, M., Caruso, M., Gmitter, F.G., Jr., Eds.; Elsevier: Amsterdam, The Netherlands; Woodhead Publishing: Sawston, UK, 2020; pp. 333–348. [Google Scholar]
  3. Walker, G.P.; Richards, C.B.; Jones, W.G.; Aitken, D.C.G. Toxicity of five insecticides used to control California red scale (Homoptera: Diaspididae) against susceptible red scale strains. J. Econ. Entomol. 1991, 84, 17–24. [Google Scholar] [CrossRef]
  4. Alfaro, F.; Cuenca, F.J.; Esquiva, M. Problemática actual del piojo rojo de California en la Comunidad Valenciana. Comunidad Valencia. Agrar. 2003, 13, 21–28. (In Spanish) [Google Scholar]
  5. Vanaclocha, P.; Urbaneja, A.; Verdú, M.J. Mortalidad natural del piojo rojo de California, Aonidiella aurantii, en cítricos de la Comunidad Valenciana y sus parasitoides asociados. Bol. San. Veg. Plagas 2009, 35, 59–71. (In Spanish) [Google Scholar]
  6. Grafton-Cardwell, E.E.; Faber, B.A.; Haviland, D.R.; Kallsen, C.E.; Morse, J.G.; O’Connell, N.V.; Phillips, P.A.; Adaskaveg, J.E.; Becker, J.O.; Lovatt, C.J.; et al. UC IPM Pest Management Guidelines Citrus; University of California, Division of Agriculture and Natural Resources: Oakland, CA, USA, 2019; Available online: http://ipm.ucanr.edu/PMG/selectnewpest.citrus.html (accessed on 7 April 2021).
  7. CABI. Aonidiella aurantii. In Invasive Species Compendium; CAB International: Wallingford, UK, 2021; Available online: https://www.cabi.org/isc/datasheet/5849 (accessed on 7 April 2021).
  8. Garcia-Marí, F. Biología y control del “poll roig” de California en los cítricos valencianos. Phytoma España 2003, 153, 120–123. (In Spanish) [Google Scholar]
  9. Campos-Rivela, J.M.; Martínez-Ferrer, M.T.; Fibla-Queralt, J.M. Population dynamics and seasonal trend of California red scale (Aonidiella aurantii Maskell) in citrus in Northern Spain. Span. J. Agric. Res. 2012, 10, 198–208. [Google Scholar] [CrossRef] [Green Version]
  10. Rodrigo, M.E.; Garcia-Marí, F.; Rodríguez-Reina, J.M.; Olmeda, T. Colonization of growing fruit by the armored scales Lepidosaphes beckii, Parlatoria pergandii and Aonidiella aurantii (Hom., Diaspididae). J. Appl. Entomol. 2004, 128, 569–575. [Google Scholar] [CrossRef]
  11. MAGRAMA (Ministerio de Agricultura, Alimentación y Medio Ambiente). Gestión Integrada de Plagas de Cítricos; Centro de Publicaciones del MAGRAMA: Madrid, Spain, 2014; p. 159. (In Spanish) [Google Scholar]
  12. Forster, L.D.; Luck, R.F.; Grafton-Cardwell, E.E. Life Stages of California Red Scale and Its Parasitoids; University of California, Division of Agriculture and Natural Resources: Oakland, CA, USA, 1995. [Google Scholar]
  13. Moreno, D.S.; Luck, R.F. Augmentative releases of Aphytis melinus (Hymenoptera: Aphelinidae) to suppress California redscale (Homoptera: Diaspididae) in southern California lemon orchards. J. Econ. Entomol. 1992, 85, 1112–1119. [Google Scholar] [CrossRef]
  14. Tena, A.; Pekas, A.; Cano, D.; Wäckers, F.L.; Urbaneja, A. Sugar provisioning maximizes the biocontrol service of parasitoids. J. Appl. Ecol. 2015, 52, 795–804. [Google Scholar] [CrossRef]
  15. Bouvet, J.P.R.; Urbaneja, A.; Pérez-Hedo, M.; Monzó, C. Contribution of predation to the biological control of a key herbivorous pest in citrus agroecosystems. J. Anim. Ecol. 2019, 88, 915–926. [Google Scholar] [CrossRef]
  16. Vacas, S.; Alfaro, C.; Navarro-Llopis, V.; Primo, J. The first account of the mating disruption technique for the control of California red scale, Aonidiella aurantii Maskell (Homoptera: Diaspididae) using new biodegradable dispensers. Bull. Entomol. Res. 2009, 99, 415–423. [Google Scholar] [CrossRef]
  17. Vacas, S.; Alfaro, C.; Navarro-Llopis, V.; Primo, J. Mating disruption of California red scale, Aonidiella aurantii Maskell (Homoptera: Diaspididae), using biodegradable mesoporous pheromone dispensers. Pest Manag. Sci. 2010, 66, 745–751. [Google Scholar] [CrossRef]
  18. Levitin, E.; Cohen, E. The involvement of acetylcholinesterase in resistance of the California red scale Aonidiella aurantii to organophosphorus pesticides. Entomol. Exp. Appl. 1998, 88, 115–121. [Google Scholar] [CrossRef]
  19. Grafton-Cardwell, E.E.; Ouyang, Y.; Striggow, R.A.; Christiansen, J.A.; Black, C.S. Role of esterase enzymes in monitoring for resistance of California red scale, Aonidiella aurantii (Homoptera: Diaspididae), to organophosphate and carbamate insecticides. J. Econ. Entomol. 2004, 97, 606–613. [Google Scholar] [CrossRef]
  20. Cunningham, G.P.; Harden, J. Sprayers to reduce spray volumes in mature citrus trees. Crop Prot. 1999, 18, 275–281. [Google Scholar] [CrossRef]
  21. Garcerá, C. Racionalización de las Aplicaciones de Productos Fitosanitarios para el Control de Aonidiella aurantii Maskell (Hemiptera: Diaspididae) en Cítricos. Ph.D. Thesis, Universitat Politècnica de València, Valencia, Spain, 30 July 2013. (In Spanish). [Google Scholar]
  22. Garcerá, C.; Ouyang, Y.; Scott, S.; Moltó, E.; Grafton-Cardwell, E.E. Effects of spirotetramat on California red scale, Aonidiella aurantii (Homoptera: Diaspididae), and its parasitoid, Aphytis melinus (Hymenopera: Aphelinidae). J. Econ. Entomol. 2013, 105, 2126–2134. [Google Scholar] [CrossRef] [PubMed] [Green Version]
  23. Garcerá, C.; Moltó, E.; Chueca, P. Factors influencing the efficacy of two organophosphate insecticides in controlling California red scale, Aonidiella aurantii (Maskell). A basis for reducing spray application volume in Mediterranean conditions. Pest Manag. Sci. 2014, 70, 28–38. [Google Scholar] [CrossRef]
  24. Chueca, P.; Grafton-Cardwell, E.E.; Moltó, E. Influence of spray equipment and water volume on coverage of citrus and control of citricola scale, Coccus pseudomagnoliarum (Hemiptera: Coccidae) with mineral oil. J. Econ. Entomol. 2009, 102, 296–303. [Google Scholar] [CrossRef]
  25. Stansly, P.A.; Qureshi, J.A.; Kostyk, B.C. Effect of spray volume and sprayer type on efficacy of insecticides for control of Asian citrus psyllid and citrus leafminer on oranges: 2010. Arthrop. Manag. Tests 2011, 36, D16. [Google Scholar] [CrossRef]
  26. Salyani, M.; McCoy, C.W.; Hedden, S.L. Spray volume effects on deposition and citrus rust mite control. In Pesticide Formulations and Application Systems; Hovde, D., Beestman, G., Eds.; ASTM International: West Conshohocken, PA, USA, 1989; Volume 8, pp. 254–263. [Google Scholar]
  27. McCoy, C.W.; Lye, B.H.; Salyani, M. Spray volume and acaricide rate effects on the control of the citrus rust mite. Proc. Fla. State Hort. Soc. 1989, 102, 36–40. [Google Scholar]
  28. Fonte, A.; Garcerá, C.; Tena, A.; Chueca, P. CitrusVol Validation for the Adjustment of Spray Volume in Treatments Against Tetranychus urticae in Clementines. Agronomy 2020, 10, 32. [Google Scholar] [CrossRef] [Green Version]
  29. Silva Junior, G.J.; Scapin, M.S.; Silva, F.P.; Silva, A.R.P.; Behlau, F.; Ramos, H.H. Spray volume and fungicide rates for citrus black spot control based on tree canopy volume. Crop Prot. 2016, 85, 38–45. [Google Scholar] [CrossRef]
  30. Scapin, M.S.; Behlau, F.; Scandelai, L.H.M.; Fernandes, R.S.; Silva Junior, G.J.; Ramos, H.H. Tree-row-volume-based sprays of copper bactericide for control of citrus canker. Crop Prot. 2015, 77, 119–126. [Google Scholar] [CrossRef]
  31. Humann-Guilleminot, S.; Binkowski, Ł.J.; Jenni, L.; Hilke, G.; Glauser, G.; Helfenstein, F. A nationwide survey of neonicotinoid insecticides in agricultural land with implications for agrienvironment schemes. J. Appl. Ecol. 2019, 56, 1502–1514. [Google Scholar] [CrossRef]
  32. EU. European Green Deal. 2021. Available online: https://ec.europa.eu/info/strategy/priorities-2019-2024/european-green-deal (accessed on 7 April 2021).
  33. Byers, R.E. Tree-row-volume spraying rate calculator for apples. HortScience 1987, 22, 506–507. [Google Scholar]
  34. Siegfried, W.; Holliger, E.; Raisigl, U. Eine neue methode zur bestimmung der brühe- und präparatemenge im obstbau. Schweiz. Z. Obs. Weinbau 1995, 6, 144–147. (In German) [Google Scholar]
  35. Viret, O.; Siegfried, W.; Wohlhauser, R.; Raisigl, U. Dosage des fongicides en fonction du volume foliaire de la vigne. Revue Suisse Vitic. Arboric. Hortic. 2005, 37, 59–62. (In French) [Google Scholar]
  36. Gil, E.; Campos, J.; Ortega, P.; Llop, P.; Gras, A.; Armengol, E.; Salcedo, R.; Gallart, M. DOSAVIÑA: Tool to calculate the optimal volume rate and pesticide amount in vineyard spray applications based on a modified leaf wall area method. Comput. Electron. Agric. 2019, 160, 117–130. [Google Scholar] [CrossRef]
  37. Garcerá, C.; Fonte, A.; Moltó, E.; Chueca, P. Sustainable use of pesticide applications in citrus: A support tool for volume rate adjustment. Int. J. Environ. Res. Public Health 2017, 14, 715. [Google Scholar] [CrossRef] [PubMed] [Green Version]
  38. Miranda-Fuentes, A.; Godoy-Nieto, A.; Gamarra-Diezma, J.L.; Rodríguez-Lizana, A.; González-Sánchez, E.J.; Lara del Río, F.; Bejarano-Cabanás, J.M.; Román-Vázquez, J.; Blanco-Roldán, G.L.; Gil-Ribes, J.A. New developments to help farmers correctly dosing pesticides in olive orchards. In Proceedings of the SuproFruit 2019—the 15th Workshop on Spray Application and Precision Technology in Fruit Growing, West Malling, UK, 16–18 July 2019; Available online: https://www.emr.ac.uk/wp-content/uploads/2019/07/26-Miranda.pdf (accessed on 7 April 2021).
  39. Planas, S.; Roman, C.; Sanz, R.; Rosell, J.R. A proposal for dose expression & dose adjustment in the EU-Southern Zone—DOSA3D system. In Proceedings of the EPPO Workshop on Harmonized Dose Expression for the Zonal Evaluation of Plant Protection Products in High Growing Crops, Vienna, Austria, 18–20 October 2016. [Google Scholar]
  40. Garcerá, C.; Moltó, E.; Chueca, P. Effect of spray volume of two organophosphate pesticides on coverage and mortality of Aonidiella aurantii Maskell. Crop Prot. 2011, 30, 693–697. [Google Scholar] [CrossRef]
  41. Garcerá, C.; Moltó, E.; Zarzo, M.; Chueca, P. Modelling the spray deposition and efficacy of two mineral oil-based products for the control of California red scale, Aonidiella aurantii (Maskell). Crop Prot. 2012, 31, 78–84. [Google Scholar] [CrossRef]
  42. Chueca, P.; Garcerá, C.; Moltó, E. CitrusVol, Racionalización de los Tratamientos Fitosanitarios en Cítricos; IVIA: Valencia, Spain, 2021; Available online: https://citrusvol.com (accessed on 7 April 2021). (In Spanish)
  43. Albert, F.; Aleixos, N.; Blasco, J.; Cubero, S. Food Color Inspector. 2013. Available online: http://www.cofilab.com/registered-software/ (accessed on 7 April 2021).
  44. DOGV (Diari Oficial de la Generalitat Valenciana). RESOLUCIÓN de 12 de Marzo de 2017 del Director General de Agricultura, Ganadería y Pesca, por la que Se Establecen las Normas para la Producción Integrada en Cítricos, en el Ámbito de la Comunitat Valenciana; Conselleria de Agricultura, Medio Ambiente, Cambio Climático y Desarrollo Rural: Valencia, Spain, 2017; pp. 18275–18301. (In Spanish) [Google Scholar]
  45. Fernández, M.A. Instituto Valenciano de Investigaciones Agrarias; Personal Communication: Valencia, Spain, 2021. [Google Scholar]
  46. MAPA (Ministerio de Agricultura, Pesca y Alimentación). Plataforma de Conocimiento para el Medio Rural y Pesquero—Observatorio de Tecnologías Probadas—Maquinaria Agrícola—Atomizadores (Pulverizadores Hidroneumáticos)—Costes. Available online: https://www.mapa.gob.es/es/ministerio/servicios/informacion/Atomizador_tcm30-58257.xls (accessed on 18 June 2021). (In Spanish).
  47. GEOPORTAL (Geoportal de Hidrocarburos). Available online: https://geoportalgasolineras.es (accessed on 18 June 2021).
  48. Generalitat de Catalunya. Guía Práctica para el Cálculo de Emisiones de Gases de Efecto Invernadero (GEI). Versión 2011; Generalitat de Catalunya, Comisión Interdepartamental del Cambio Climático: Barcelona, Spain, 2011; p. 66. (In Spanish) [Google Scholar]
  49. Grafton-Cardwell, E.E.; Reagan, C. California red scale insecticide efficacy trial, 2007. Arthropod Manag. Tests 2009, 34, D3. [Google Scholar] [CrossRef]
  50. Derksen, R.C.; Zhu, H.; Fox, R.D.; Brazee, R.D.; Krause, C.R. Coverage and drift produced by air induction and conventional hydraulic nozzles used for orchard applications. Trans. ASABE 2007, 50, 1493–1501. [Google Scholar] [CrossRef]
  51. Jamar, L.; Mostade, O.; Huyghebaert, B.; Pigeon, O.; Lateur, M. Comparative performance of recycling tunnel and conventional sprayers using standard and drift-mitigating nozzles in dwarf apple orchards. Crop Prot. 2010, 29, 561–566. [Google Scholar] [CrossRef]
  52. Garcerá, C.; Román, C.; Moltó, E.; Abad, R.; Insa, J.A.; Torrent, X.; Planas, S.; Chueca, P. Comparison between standard and drift reducing nozzles for pesticide application in citrus: Part II. Effects on canopy spray distribution, control efficacy of Aonidiella aurantii (Maskell), beneficial parasitoids and pesticide residues on fruit. Crop Prot. 2017, 94, 83–96. [Google Scholar] [CrossRef] [Green Version]
  53. EU. Regulation (EC) No 1107/2009 of the European Parliament and of the Council of 21 October 2009 Concerning the Placing of Plant Protection Products on the Market and Repealing Council Directives 79/117/EEC and 91/414/EEC; Official Journal of the European Union, European Commission: Brussels, Belgium, 2009; Available online: https://eur-lex.europa.eu/eli/reg/2009/1107/2019-07-15 (accessed on 7 April 2021).
  54. Mironet, V. Compilation Questionnaires “Dose expression”. Southern zone: France, Spain, Portugal, Greece, Italy and Croatia. Presented at EPPO Workshop on Harmonized Dose Expression for the Zonal Evaluation of Plant Protection Products in High Growing Crops, Vienna, Austria, 18–20 October 2016; Available online: https://www.eppo.int/MEETINGS/2016_meetings/wk_dose_expression (accessed on 17 June 2021).
  55. Cunningham, G.P.; Harden, J. Reducing spray volumes applied to mature citrus trees. Crop Prot. 1998, 17, 289–292. [Google Scholar] [CrossRef]
  56. Mateu, G.; Caballero, P.; Torregrosa, A.; Segura, B.; Juste, F.; Chueca, P. Análisis de la influencia de las operaciones de cultivo sobre los costes de producción en la citricultura de la Comunidad Valenciana. Levante Agrícola Rev. Int. Cítricos 2018, 440, 60–64. (In Spanish) [Google Scholar]
  57. SIAR (Sistema de Información Agroclimática para el Regadío de la Conselleria Valenciana d’Agricultura, Pesca, Alimentació i Aigua y el Ministerio de Agricultura, Pesca y Alimentación). Available online: http://riegos.ivia.es/ (accessed on 7 April 2021). (In Spanish).
Figure 1. Location and maps of the seven experimental plots (P1–P7). The VC (conventional volume) block is blue shaded and the VA (adjusted volume) block is yellow shaded. Date of satellite images: 5 July 2016; source: Google Earth Pro 7.3.2. Geographic coordinates: P1 (39°26′32″ N, 0°33′23″ W), P2 (39°26′43″ N, 0°32′18″ W), P3 (39°39′14″ N, 0°18′26″ W), P4 (38°56′46″ N, 0°14′15″ W), P5 (38°56′56″ N, 0°14′32″ W), P6 (39°43′43″ N, 0°35′28″ W) and P7 (39°43′58″ N, 0°35′33″ W).
Agronomy 11 01350 g001
Figure 2. Quadrants of the canopy where water sensitive papers were placed. (a) Side view across the row and (b) top view of a standard citrus tree. Arrows indicate the forward direction of the airblast sprayer.
Agronomy 11 01350 g002
Figure 3. Spray coverage (%) (mean value with standard error bar) obtained on the upperside and underside of leaves at three heights (top, middle, bottom) of the outside and inside parts of clementine tree canopies after application of conventional (VC) and adjusted (VA) volume rates considering the 13 evaluations in the orchards on seven locations over the years 2016 and 2017. Different letters above the bars within each height × depth × leaf side combination indicate significant differences (LSD test, p < 0.05).
Agronomy 11 01350 g003
Figure 4. Spray coverage (%) (mean value with standard error bar) obtained on the outside and inside parts of clementine tree canopies after application of conventional (VC) and adjusted (VA) volume rates in each orchard on different locations (P1–P7) over the years 2016 and 2017. Different letters above the bars for each coverage evaluation indicate significant differences (LSD test, p < 0.05).
Agronomy 11 01350 g004
Figure 5. Number of Aonidiella aurantii males trapped on sticky traps per day (mean value with standard error bar) for each treatment (VA: adjusted volume, VC: conventional volume) and for the seven plots (P1–P7) between April and October 2016. The x-axis shows the dates the traps were placed/removed. Dates in red indicate spray applications against A. aurantii.
Agronomy 11 01350 g005
Figure 6. Number of Aonidiella aurantii scales per fruit (mean value with standard error bar) at two depths of the canopy (outside, inside), for both treatments (VA: adjusted volume, VC: conventional volume) and two years (2016 and 2017) considering the plots (P1–P7) as repetitions. Different letters above the bars indicate significant differences (Kruskal-Wallis test, p < 0.05).
Agronomy 11 01350 g006
Figure 7. Number of Aonidiella aurantii scales per fruit (mean value with standard error bar) at two depths of the canopy (outside, inside), in function of the treatment (VA: adjusted volume, VC: conventional volume), for each plot (P1–P7) and year (2016 and 2017).
Agronomy 11 01350 g007
Figure 8. Cull fruit (%) with more than three Aonidiella aurantii scales per fruit (mean value with standard error bar), in function of the treatment (VA: adjusted volume, VC: conventional volume), for each plot (P1–P7) and year (2016 and 2017).
Agronomy 11 01350 g008
Table 1. Characteristics of the experimental plots: area, planting pattern, vegetation density, canopy dimensions, canopy volume, TRV (tree row volume) and pruning level.
PlotArea (ha)Planting Pattern 1 (m)Vegetation Density 2 (m2/m3)YearCanopy Dimensions 3 (m)Canopy Volume 4 (m3)TRV 5 (m3/ha)Pruning Level
P11.66 × 313.5620162.51 × 4.33 × 3.0817.5318,114Normal
20172.60 × 4.03 × 3.0516.7317,463
P20.87 × 211.5620162.12 × 4.26 × 2.3010.8812,902Normal
20172.04 × 3.70 × 2.198.6610,783
P31.76.5 × 510.3620162.15 × 3.39 × 3.3412.7511,213Severe
20171.93 × 3.10 × 3.169.909205
P425.5 × 514.5520162.38 × 4.28 × 4.5724.3718,521Normal
20172.19 × 4.17 × 4.4020.9916,604
P52.26 × 213.4620161.99 × 2.93 × 1.965.989718Without pruning
20172.08 × 2.85 × 2.106.509880Normal
P616.5 × 2.515.0920162.47 × 3.90 × 2.6013.1114,820Normal
P72.76.5 × 3.517.9420162.45 × 4.84 × 3.7022.9718,243Severe
20172.43 × 4.74 × 3.7222.4917,720Normal
1 Row spacing × tree spacing. 2 Area of leaves per unit of canopy volume calculated considering the two sides of the leaves and following the methodology of Fonte et al. [28]. 3 Canopy height × diameter across the row × diameter along the row, measured with the methodology indicated in Fonte et al. [28]. 4 Calculated considering citrus canopy as an ellipsoid according to the equation: canopy volume (m3) = π/6 × canopy height (m) × diameter across the row (m) × diameter along the row (m). 5 Tree Row Volume, calculated with the equation: TRV (m3/ha) = canopy height (m) × diameter of the canopy across the row (m) × 10,000/row spacing (m).
Table 2. Airblast sprayers used in the applications.
PlotYearAirblast SprayerTank Capacity (L)Number of NozzlesTrademark and Model of NozzlesType of FanFan Diameter (cm)Air-Jet Emission System
P1 & P22016 & 2017Ilemo-Hardi
Arrow XF90
150038Hardi 1553Axial92Circular
P32016 & 2017Mañez y Lozano Twister200030Albuz TVIAxial92Triangular
P4 & P52016Marisan Duplex Tornado200036Albuz AMTDouble (axial and inverted)90Circular
2017Fede Futur100026TeeJet Disc-CoreAxial90Circular
P6 & P72016 & 2017Fede Futur300026Hardi 1553Axial90Circular
Table 3. Operative characteristics of spray applications.
PlotApplication DateWorking Pressure (bar)Forward Speed (km/h)Air Flow Rate (m3/h)Number of Open NozzlesWater Volume (L/ha)Spray Volume Reduction and PPP Saving (%)
VCVAVCVA
P127 May 201681.3255,34238304905325533.64
27 July 201681.3255,34238304905325533.64
7 June 201781.3274,89438304899348728.82
8 September 201781.3274,89438304899315335.64
P226 May 201681.3255,34238284204280033.40
9 August 201681.3255,34238284204280033.40
22 August 201781.3274,89438304199207050.70
P39 June 2016131.75101,24826183264229429.72
23 June 2017132.0146,46726183395146156.97
P431 May 201691.9254,82834147311301158.82
26 June 2017101.9669,38526184262299829.66
P531 May 201691.9254,82834186702173774.08
27 June 2017101.9669,38524163674181150.71
P613 June 201681.5389,26826223201253520.81
12 August 201681.4889,26826223318262820.80
P714 June 201681.5389,26826263468306511.62
11 August 201681.4889,26826263595317711.63
30 June 2017101.4282,64426263932329016.33
VC: conventional volume; VA: adjusted volume. PPP: plant protection product.
Table 4. Tank refill time for each equipment and orchard, and time savings of tank refill with CitrusVol for each spray application for 1, 10 and 100 hectares.
PlotApplication DateWater
Volume (L/ha)
Sprayer Tank Capacity
(L)
Tank Refill Time 1
(h)
Number of Tanks/haTime Savings of Tank Refill
(h/ha)
Number of Tanks/10 haTime Savings of Tank Refill
(h/10 ha)
Number of Tanks/100 haTime Savings of Tank Refill
(h/100 ha)
VCVAVCVAVCVAVCVA
P127 May 20164905325515000.27430.2733222.9632721729.58
27 July 201649053255430.2733222.9632721729.58
7 June 201748993487430.2733242.4232723325.28
8 September 201748993153430.2733222.9632721131.20
P226 May 20164204280015000.30320.3029192.9828118728.02
9 August 201642042800320.3029192.9828118728.02
22 August 201741992070320.3028144.1728013842.33
P39 June 20163264229420000.34220.0017121.6816411516.51
23 June 201733951461210.341783.031707432.34
P431 May 20167311301120000.35420.7037167.3336615175.06
26 June 20174262299810000.25530.5043303.2542730031.74
P531 May 20166702173720000.39411.173499.773368797.36
27 June 20173674181110000.29420.5837195.2536818254.27
P613 June 20163201253530000.46210.461190.931078510.19
12 August 201633182628210.461291.391118810.65
P714 June 20163468306530000.42220.0012110.421161035.42
11 August 201635953177220.0012110.421201065.84
30 June 201739323290220.0014111.251321109.17
1 Including filling time and equipment transit time to and from the water sources. VC: conventional volume; VA: adjusted volume.
Table 5. Economic and environmental advantages per each orchard with CitrusVol for each spray application for 1, 10 and 100 hectares.
PlotApplication DateCost Savings of PPP Application Service 1
(€/ha)
Cost Savings of Fuel Consumption
(€/ha)
CO2 Emission Reduction of Diesel B
(kg CO2/ha)
Cost Savings of PPP Application Service 1
(€/10 ha)
Cost Savings of Fuel Consumption
(€/10 ha)
CO2 Emission Reduction of Diesel B
(kg CO2/10 ha)
Cost Savings of PPP Application Service 1
(€/100 ha)
Cost Savings of Fuel Consumption
(€/100 ha)
CO2 Emission Reduction of Diesel B
(kg CO2/100 ha)
P127 May 20166.121.605.0967.3717.6055.95673.70175.99559.48
27 July 20166.121.605.0967.3717.6055.95673.70175.99559.48
7 June 20176.121.605.0955.1214.4045.78575.71150.39478.10
8 September 20176.121.605.0967.3717.6055.95710.45185.59590.00
P226 May 20167.091.855.8970.8818.5258.86666.29174.05553.32
9 August 20167.091.855.8970.8818.5258.86666.29174.05553.32
22 August 20177.091.855.8999.2325.9282.411006.52262.93835.87
P39 June 20160.000.000.0041.8410.9334.75410.06107.12340.53
23 June 20178.372.196.9575.3219.6762.55803.38209.86667.17
P431 May 201617.544.5814.57184.1948.12152.961885.79492.621566.06
26 June 201711.002.879.1371.4718.6759.35698.20182.39579.83
P531 May 201630.467.9625.29253.8266.30210.782528.02660.392099.41
27 June 201713.763.5911.43123.8332.35102.831279.54334.251062.60
P613 June 201612.533.2710.4025.066.5520.81275.6372.00228.90
12 August 201612.533.2710.4037.599.8231.21288.1675.27239.30
P714 June 20160.000.000.0011.012.889.14143.1137.38118.85
11 August 20160.000.000.0011.012.889.14154.1240.26127.99
30 June 20170.000.000.0033.038.6327.43242.1863.27201.12
1 Not including the PPP reduction cost. PPP: plant protection product.
Publisher’s Note: MDPI stays neutral with regard to jurisdictional claims in published maps and institutional affiliations.

