
Long-Term Zinc Fertilization in Calcareous Soils Improves Wheat (Triticum aestivum L.) Productivity and Soil Zinc Status in the Rice–Wheat Cropping System

 ,
,  ,
,  , and
, and 
Abstract
:1. Introduction
2. Materials and Methods
2.1. Study Site
2.2. Experimental Treatments and Design
2.3. Experimental Procedures
2.4. Plant Sample Collection and Chemical Analysis
2.5. Zn Nutrient Analysis
2.6. Extraction of Soil Zn Fractions
- (a)
- Water-soluble and exchangeable zinc (WS+EX-Zn): 20 mL of 1N NH4OAc at pH adjusted to 7.0.
- (b)
- Complexed zinc (COM-Zn): 20 mL of 0.05 M Cu acetate (Cu(OAc)2).
- (c)
- Organically bound zinc (ORG-Zn): 20 mL of 1% sodium pyrophosphate (Na4P2O4).
- (d)
- Carbonate and amorphous oxide bound zinc (AMO-Zn): 20 mL of 0.1 M HCl.
- (e)
- Crystalline oxide bound zinc (CRY-Zn): 40 mL of 0.3 M sodium-citrate (C6H5Na3O7) and 5 mL of 0.1 M sodium bicarbonate (NaHCO3).
- (f)
- Total zinc (TOT-Zn): the total zinc content in soil was determined using atomic absorption spectrophotometer in the digest obtained by digesting soil samples on a hot plate with a 3:1 mixture of HCl and HNO3 [30].
- (g)
- Residual zinc (RES-Zn): the residual zinc content was determined by subtracting all forms of Zn extracted from the total Zn content.
2.7. Experimental Data Analysis
3. Results
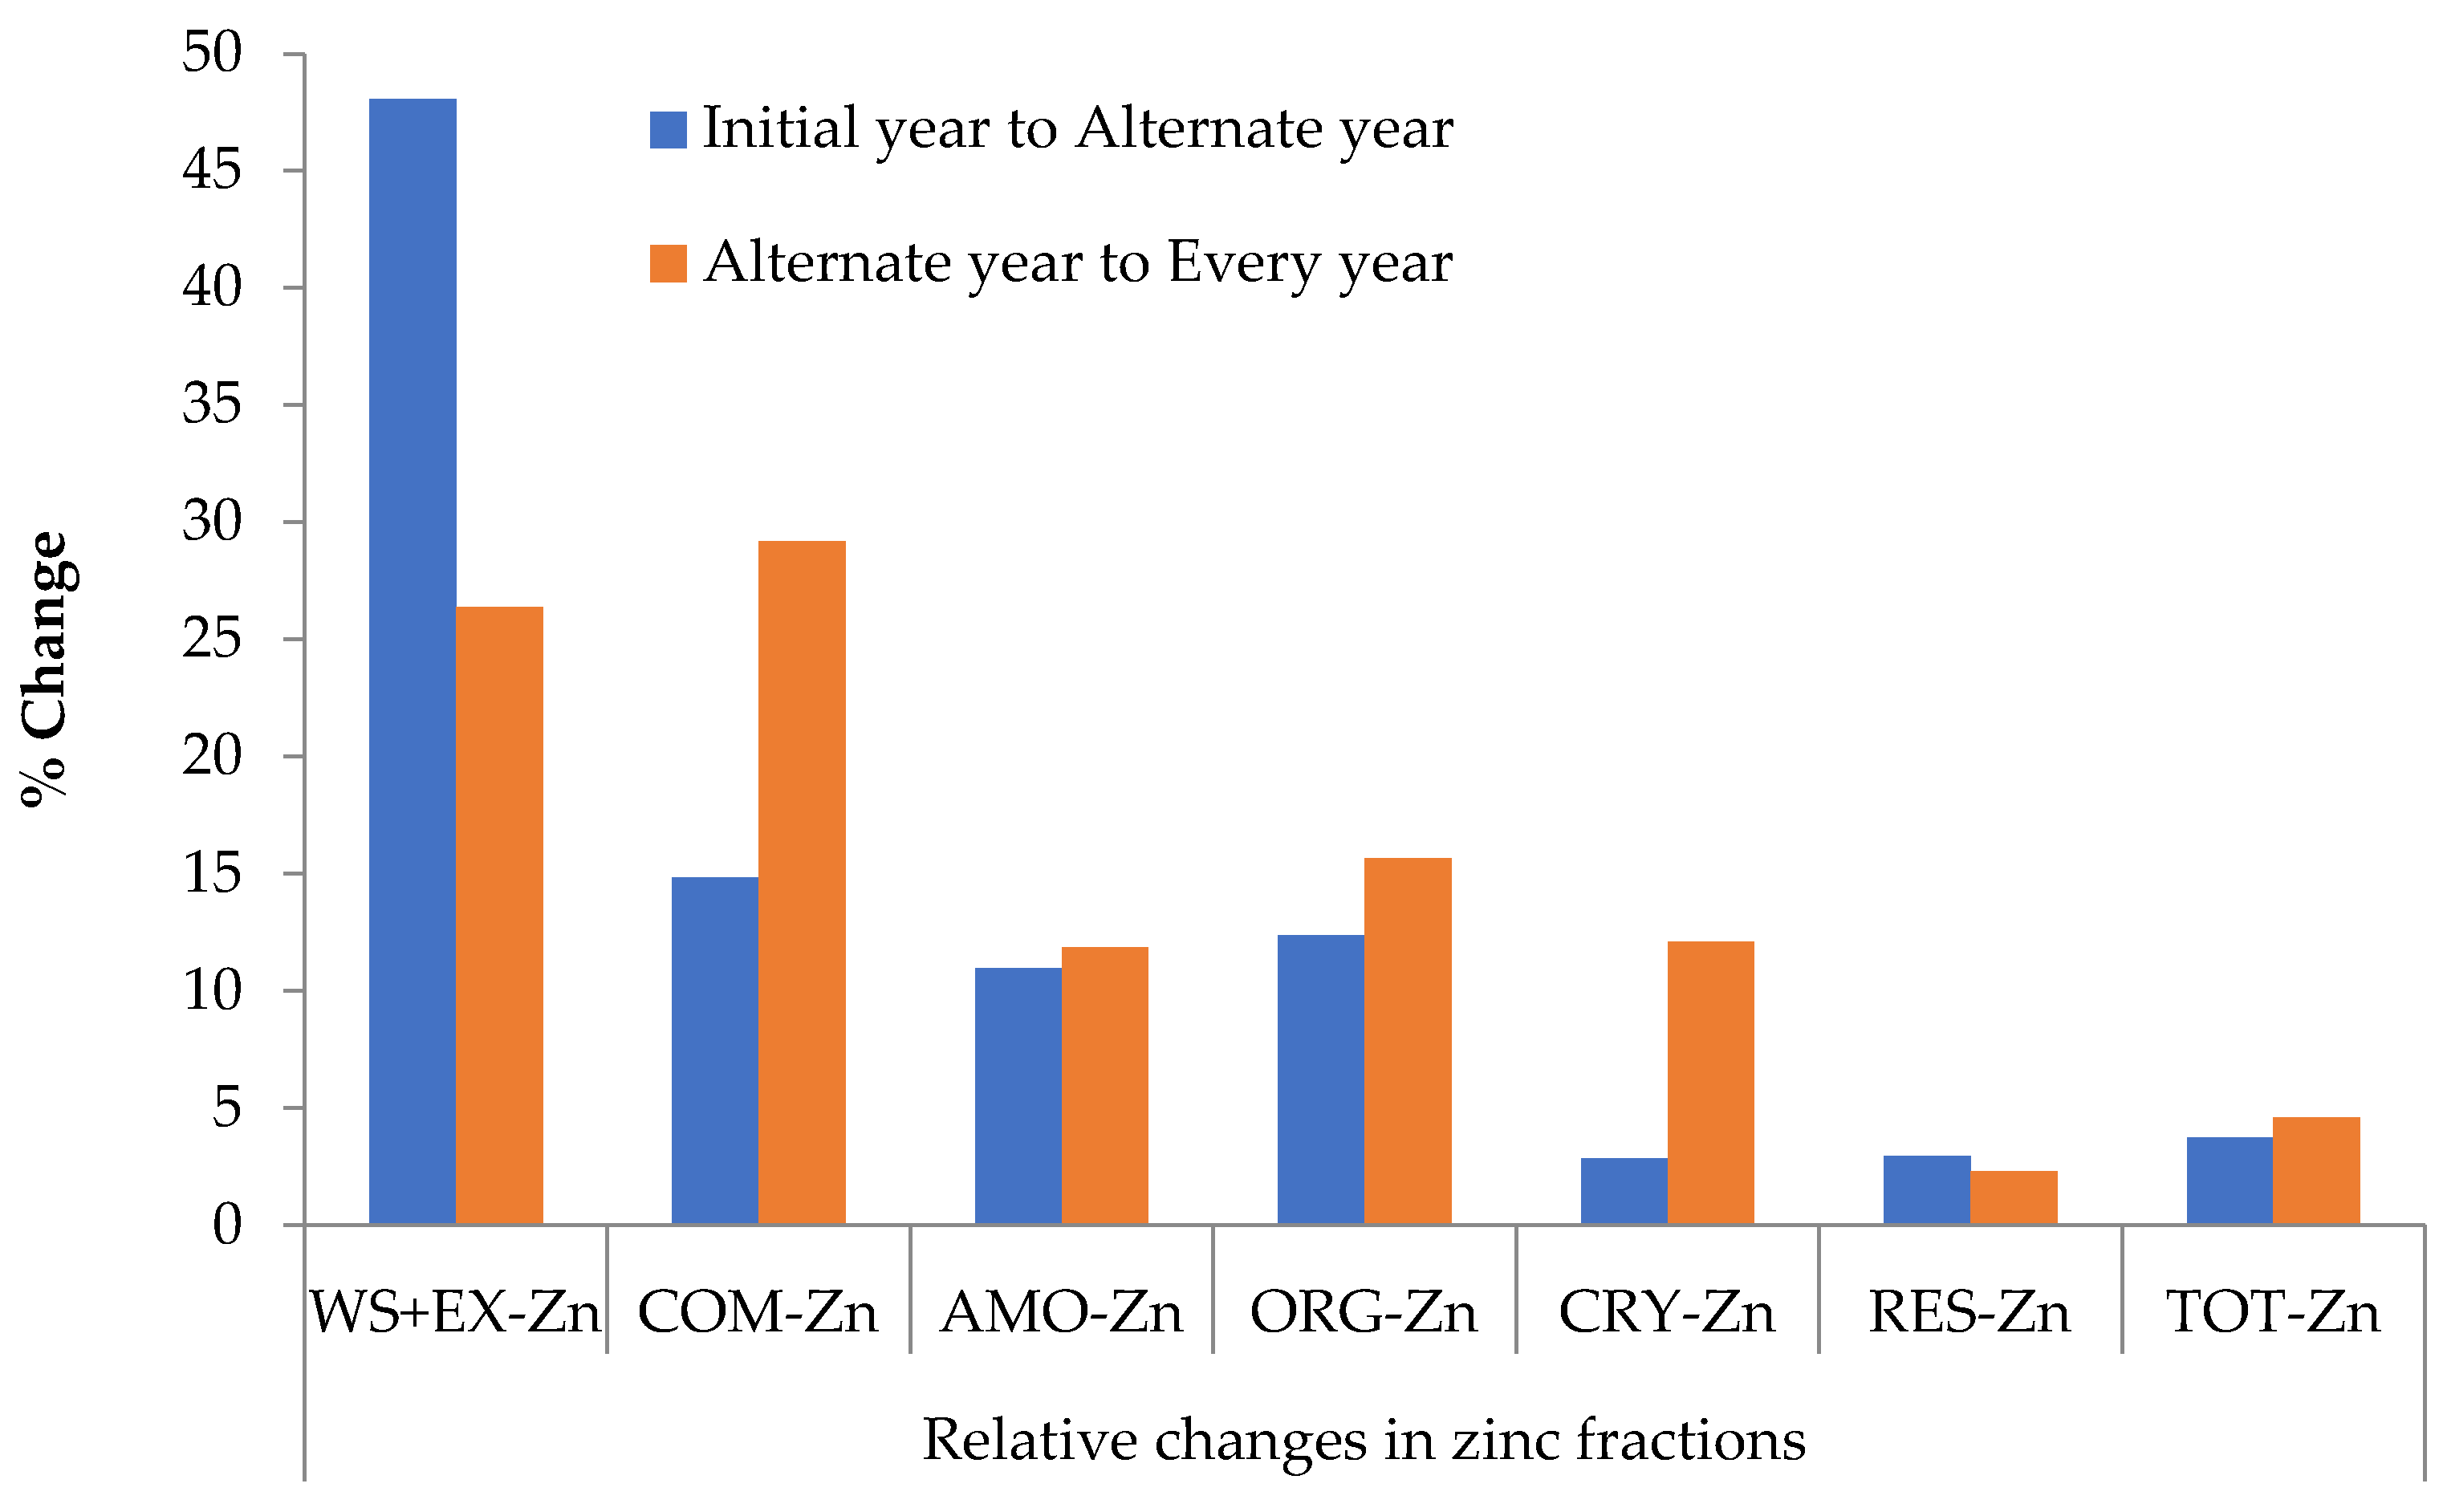
3.1. Soil Zn Pools
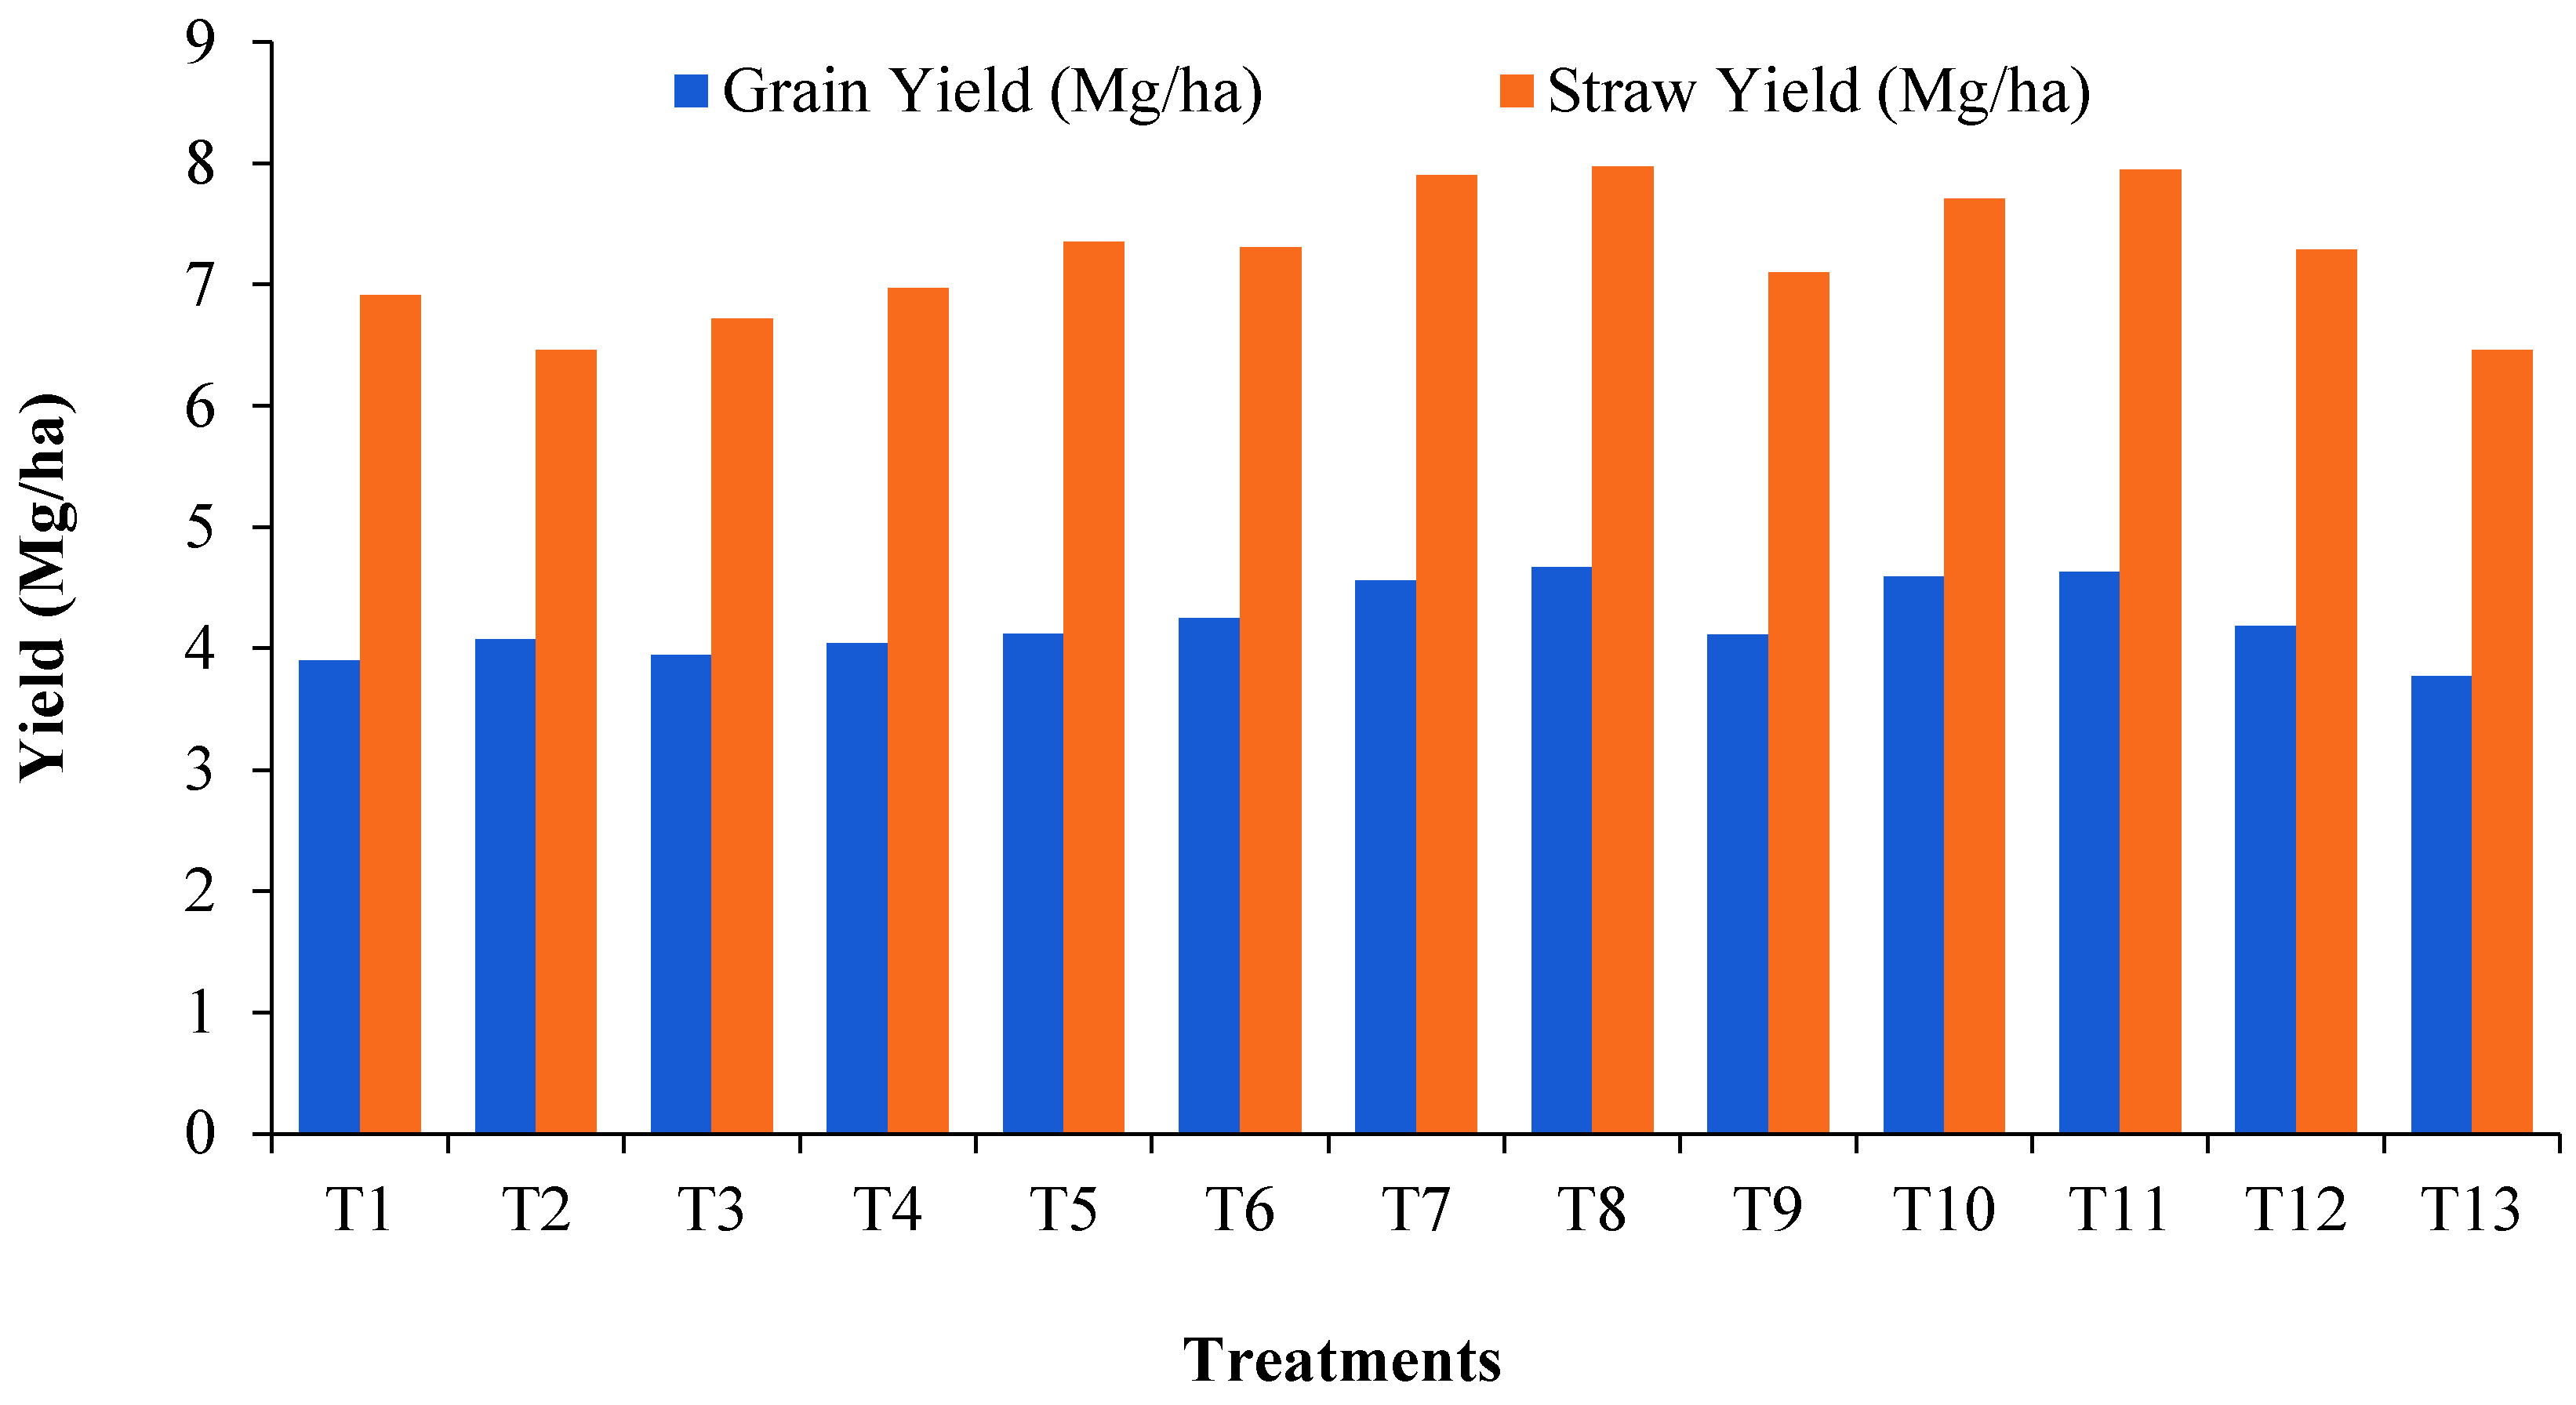
3.2. Wheat Yield
3.3. Zn Uptake by Wheat
3.4. The Relationship among Different Forms of Zn, Wheat Crop Yield and Zinc Uptake
4. Discussion
5. Conclusions
Supplementary Materials
Author Contributions
Funding
Institutional Review Board Statement
Informed Consent Statement
Acknowledgments
Conflicts of Interest
Ethical Statement
References
- FAO/WHO. Human vitamin and mineral requirements. No. 32. In Report of a Joint FAO/IAEA/WHO Expert Consultation; Corporate Document Repository; FAO/WHO: Rome, Italy, 1996. [Google Scholar]
- Cakmak, I.; Kalayci, M.; Ekiz, H.; Braun, H.J.; Kilincand, Y.; Yilmaz, A. Zinc deficiency as a practical problem in plant and human nutrition in Turkey: A NATO-science for stability project. Field Crop Res. 1999, 60, 175–188. [Google Scholar] [CrossRef] [Green Version]
- Dhillon, B.S.; Kataria, P.; Dhillon, P.K. National food security vis-à-vis sustainability of agriculture in high crop productivity regions. Curr. Sci. 2010, 98, 33–36. [Google Scholar]
- Kar, S.; Pramanick, B.; Brahmachari, K.; Saha, G.; Mahapatra, B.S.; Saha, A.; Kumar, A. Exploring the best tillage option in rice based diversified cropping systems in alluvial soil of eastern India. Soil Tillage Res. 2021, 205, 104761. [Google Scholar] [CrossRef]
- Shivay, Y.S.; Kumar, D.; Prasad, R. Effect of zinc enriched urea on productivity, zinc uptake and efficiency of an aromatic rice–wheat cropping system. Nutr. Cycl. Agroecosyst. 2008, 81, 229–243. [Google Scholar] [CrossRef]
- Sakal, R.; Singh, A.P.; Singh, B.P.; Sinha, R.B.; Jhaand, S.N.; Singh, S.P. Distribution of available micronutrient cations in calcareous soils as related to certain soil properties. J. Ind. Soc. Soil Sci. 1985, 33, 672–675. [Google Scholar]
- Brennan, R.F. Residual value of zinc fertilizer for production of wheat. Aust. J. Exp. Agric. 2001, 41, 541–547. [Google Scholar] [CrossRef]
- Saeed, M.; Fox, R.L. Relation between suspension pH and zinc solubility in acid and calcareous soils. Soil Sci. 1977, 124, 199–204. [Google Scholar] [CrossRef]
- Noulas, C.; Tziouvalekas, M.; Karyotis, T. Zinc in soils, water and food crops. J. Trace Elements Med. Biol. 2018, 49, 252–260. [Google Scholar] [CrossRef]
- Jalali, M.; Khanlari, Z.V. Cadmium availability in calcareous soils of agricultural lands in Hamadun, western Iran. Soil Sediment Contamin. 2008, 17, 256–268. [Google Scholar] [CrossRef]
- Recena, R.; García-López, A.M.; Delgado, A. Zinc uptake by plants as affected by fertilization with Zn sulfate, phosphorus availability, and soil properties. Agronomy 2021, 11, 390. [Google Scholar] [CrossRef]
- Raja, E.M.; Iyengar, B.R.V. Chemical pools of zinc in some soils as influenced by sources of applied zinc. J. Ind. Soc. Soil Sci. 1986, 34, 98–105. [Google Scholar]
- Liu, Y.M.; Liu, D.Y.; Zhao, Q.Y.; Zhang, W.; Chen, X.X.; Xu, S.J.; Zou, C.Q. Zinc fractions in soils and uptake in winter wheat as affected by repeated applications of zinc fertilizer. Soil Tillage Res. 2020, 200, 104612. [Google Scholar] [CrossRef]
- Norouzi, M.; Khoshgoftarmanesh, A.H.; Afyuni, M. Zinc fractions in soil and uptake by wheat as affected by different preceding crops. Soil Sci. Plant Nutr. 2014, 60, 670–678. [Google Scholar] [CrossRef] [Green Version]
- Fageria, N.K. Influence of dry matter and length of roots on growth of five field crops at varying soil zinc and copper levels. J. Plant Nutr. 2004, 27, 1517–1523. [Google Scholar] [CrossRef]
- Epstein, E.; Bloom, A.J. Mineral Nutrition of Plants: Principles and Perspectives, 5th ed.; Sinauer Associates, Inc. Publishers: Sunderland, MA, USA, 2005. [Google Scholar]
- Chen, X.P.; Zhang, Y.Q.; Tong, Y.P.; Xue, Y.F.; Liu, D.Y.; Zhang, W.; Deng, Y.; Meng, Q.F.; Yue, S.C.; Yan, P.; et al. Harvesting more grain zinc of wheat for human health. Sci. Rep. 2017, 7, 7016. [Google Scholar] [CrossRef] [PubMed] [Green Version]
- Tisdale, S.L.; Nelson, W.L.; Beaton, J.L. Soil Fertility and Fertilizers, 5th ed.; Pearson Education: Upper Saddle River, NJ, USA, 1993. [Google Scholar]
- Page, A.L.; Miller, R.H.; Kenay, D.R. Methods of Soil Analysis, Part 2; Soil Science Society of America: Madison, WI, USA, 1982. [Google Scholar]
- Jackson, M.L. Soil Chemical Analysis; Prentice Hall of India Pvt. Ltd.: New Delhi, India, 1973; p. 498. [Google Scholar]
- Walkley, A.; Black, C.A. An examination of a method for determining soil organic matter and a proposed modification of the chromic acid titration method. Soil Sci. 1934, 37, 29–38. [Google Scholar] [CrossRef]
- Black, C.A.; Evans, D.D.; White, J.L.; Ensminger, L.E.; Clark, F.E. Methods of Soil Analysis: Part 2; American Society of Agronomy: Madison, WI, USA, 1965. [Google Scholar]
- Subbiah, B.V.; Asija, G.L. A rapid procedure for the estimation of available nitrogen in soils. Curr. Sci. 1956, 25, 259–260. [Google Scholar]
- Olsen, S.R.; Cole, C.V.; Watanabe, F.S.; Dean, L.A. Estimation of Available Phosphorus in Soils by Extraction with Sodium Bicarbonate; U.S. Government Printing Office: Washington, DC, USA, 1954. [Google Scholar]
- Chapman, H.D.; Pratt, P.F. Methods of Analysis for Soils, Plants, and Waters; University of California: Riverside, CA, USA, 1961. [Google Scholar]
- Tabatabai, M.A. Sulfur. In Methods of Soil Analysis, Part 3: Chemical Methods; Soil Science Society of Americabook Series No. 5; Sparks, D.L., Ed.; SSSA and ASA: Madison, WI, USA, 1996; pp. 921–960. [Google Scholar]
- Berger, K.C.; Truog, E. Boron determination in soils and plants. Ind. Eng. Chem. Anal. Ed. 1939, 11, 540–545. [Google Scholar] [CrossRef]
- Lindsay, W.L.; Norvell, W.A. Development of DTPA soil test for zinc, iron, manganese and copper. Soil Sci. Soc. Am. J. 1978, 42, 421–428. [Google Scholar] [CrossRef]
- Tandon, H.L.S. Methods of Analysis of Soils, Plants, Waters, Fertilizers and Organic Manures, 2nd ed.; Fertilizer Development and Consultation Organization: New Delhi, India, 2005; p. 204+xii. [Google Scholar]
- Nieuwenhuize, J.; Poley-Vos, C.H.; van-den Akker, A.H.; van-Delft, W. Comparison of microwave and conventional extraction techniques for the determination of metals in soils, sediment and sludge samples by atomic spectrometry. Analyst 1991, 116, 347–351. [Google Scholar] [CrossRef]
- Cocharan, W.G.; Cox, G.M. Experimental designs, 2nd ed.; John Wiley and Sons: New York, NY, USA, 1957; p. 611. [Google Scholar]
- Singh, B.; Singhand, M.; Dang, Y.P. Distribution of forms of zinc in some soils of Haryana. J. Ind. Soc. Sci. 1987, 35, 217–224. [Google Scholar]
- Boguta, P.; Sokołowska, Z. Zinc binding to fulvic acids: Assessing the impact of pH, metal concentrations and chemical properties of fulvic acids on the mechanism and stability of formed soluble complexes. Molecules 2020, 25, 1297. [Google Scholar] [CrossRef] [PubMed] [Green Version]
- Dhaliwal, S.S.; Naresh, R.K.; Mandal, A.; Singh, R.; Dhaliwal, M.K. Dynamics and transformations of micronutrients in agricultural soils as influenced by organic matter build-up: A review. Environ. Sustain. Indicators. 2019, 1–2, 100007. [Google Scholar] [CrossRef]
- Alloway, B.J. Heavy Metals in Soils: Trace Metals and Metalloids in Soils and Their Bioavailability. In Environmental Pollution 22; Alloway, B.J., Ed.; Springer: Dordrecht, The Netherlands, 2013. [Google Scholar]
- Rolka, E.; Żołnowski, A.C.; Sadowska, M.M. Assessment of heavy metal content in soils adjacent to the DK16-route in Olsztyn (North-Eastern Poland). Pol. J. Environ. Stud. 2020, 29. [Google Scholar] [CrossRef]
- Liu, H.; Zhao, P.; Qin, S.; Nie, Z. Chemical Fractions and Availability of Zinc in Winter Wheat Soil in Response to Nitrogen and Zinc Combinations. Front. Plant. Sci. 2018, 9, 1489. [Google Scholar] [CrossRef]
- Xiang, H.F.; Tangand, H.A.; Ying, Q.H. Transformation and distribution of forms of zinc in acid, neutral and calcareous soils of China. Geoderma 1995, 66, 121–135. [Google Scholar] [CrossRef]
- Arafat, Y.; Shafi, M.; Khan, M.A.; Adnan, M.; Basir, A.; Rahman, I.; Arshad, M.; Khan, A.; Saleem, N.; Romman, M.; et al. Yield response of wheat cultivars to zinc application rates and methods. Pure Appl. Biol. 2016, 5, 1260–1270. [Google Scholar] [CrossRef]
- Firdous, S.; Agarwal, B.K.; Chhabra, V. Zinc-fertilization effects on wheat yield and yield components. J. Pharma. Phytochem. 2018, 7, 3497–3499. [Google Scholar]
- Zulfiqar, U.; Hussain, S.; Ishfaq, M.; Matloob, A.; Ali, N.; Ahmad, M.; Alyemeni, M.N.; Ahmad, P. Zinc-induced effects on productivity, zinc use efficiency, and grain biofortification of bread wheat under different tillage permutations. Agronomy 2020, 10, 1566. [Google Scholar] [CrossRef]


| Particulars | Values | Analysis Methods | Nutrient Level |
|---|---|---|---|
| Texture | Sandy loam (sand 55%; silt 35%; clay 10%) | International Pipette method; Page et al. [19] | - |
| pH (1:2-soil: water) | 8.52 | Jackson [20] | - |
| EC (dS/m) (1:2 soil: water) | 0.98 | Jackson [20] | - |
| Organic carbon (%) | 0.51 | Walkley and Black [21] | Medium |
| Free CaCO3 (%) | 34.3 | Black et al. [22] | - |
| Available N (kg ha−1) | 246 | Subbiah and Asija [23] | Low |
| Available P (kg ha−1) | 9.5 | Olsen et al. [24] | Low |
| Available K (kg ha−1) | 199 | Chapman and Prat [25] | Medium |
| Available S (mg kg−1) | 12.6 | Tabatabai [26] | Medium |
| Available B (mg kg−1) | 0.52 | Berger and Trough [27] | Medium |
| Available Zn (mg kg−1) | 0.67 | Lindsay and Norvell [28] | Medium |
| Available Cu (mg kg−1) | 2.47 | Lindsay and Norvell [28] | High |
| Available Fe (mg kg−1) | 16.3 | Lindsay and Norvell [28] | High |
| Available Mn (mg kg−1) | 4.65 | Lindsay and Norvell [28] | Medium |
| Interpretation | As per values of initial soil (0–15 cm) physical and chemical properties, organic matter (%), K, S, B, Zn and Mn were found in medium level, available N and P were low, and Cu and Fe were in higher level [29]. | ||
| Treatment | WS+EX-Zn | COM-Zn | AMO-Zn | ORG-Zn | CRY-Zn | RES-Zn | TOT-Zn |
|---|---|---|---|---|---|---|---|
| T1 | 0.115 hi | 0.82 i | 0.32 i | 1.74 h | 2.74 efg | 24.26 d | 29.98 de |
| T2 | 0.116 hi | 0.83 hi | 0.32 i | 1.79 h | 2.65 fg | 24.49 cd | 30.03 de |
| T3 | 0.124 h | 0.85 hi | 0.38 ef | 1.92 f | 2.75 efg | 24.70 cd | 30.70 de |
| T4 | 0.188 f | 0.87 gh | 0.35 g | 1.99 f | 2.79 def | 24.62 cd | 30.67 de |
| T5 | 0.136 g | 0.86 hi | 0.32 hi | 1.81 gh | 2.64 g | 24.94 bcd | 30.53 de |
| T6 | 0.204 e | 0.91 fg | 0.39 e | 1.98 f | 2.92 cd | 24.87 bcd | 31.20 cd |
| T7 | 0.220 d | 0.97 e | 0.39 de | 2.01 ef | 2.81 de | 25.13 bcd | 31.47 cd |
| T8 | 0.244 c | 1.13 d | 0.42 c | 2.56 c | 3.05 bc | 26.00 ab | 32.70 bc |
| T9 | 0.180 f | 0.92 ef | 0.37 f | 1.92 f | 3.08 b | 24.65 cd | 31.14 cd |
| T10 | 0.252 bc | 1.26 c | 0.43 bc | 2.42 d | 3.16 ab | 25.60 bc | 32.61 bc |
| T11 | 0.288 a | 1.38 b | 0.44 b | 2.59 bc | 3.07 b | 26.07 ab | 33.28 ab |
| T12 | 0.296 a | 1.44 a | 0.46 a | 2.75 a | 3.29 a | 26.95 a | 34.65 a |
| T13 | 0.112 i | 0.76 j | 0.30 j | 1.62 i | 2.78 defg | 24.46 cd | 29.57 e |
| SEm (±) | 0.003 | 0.02 | 0.007 | 0.04 | 0.05 | 0.42 | 0.53 |
| LSD (p ≤ 0.05) | 0.010 | 0.05 | 0.02 | 0.11 | 0.15 | 1.26 | 1.57 |
| Treatment | WS+EX-Zn | COM-Zn | AMO-Zn | ORG-Zn | CRY-Zn | RES-Zn |
|---|---|---|---|---|---|---|
| T1 | 0.38 | 2.74 | 1.07 | 5.79 | 9.14 | 81 |
| T2 | 0.39 | 2.76 | 1.07 | 5.97 | 8.83 | 82 |
| T3 | 0.40 | 2.77 | 1.24 | 6.26 | 8.96 | 81 |
| T4 | 0.61 | 2.84 | 1.14 | 6.50 | 9.10 | 80 |
| T5 | 0.45 | 2.82 | 1.05 | 5.93 | 8.06 | 82 |
| T6 | 0.65 | 2.92 | 1.25 | 6.35 | 9.36 | 80 |
| T7 | 0.70 | 3.08 | 1.24 | 6.40 | 8.93 | 80 |
| T8 | 0.75 | 3.46 | 1.28 | 7.83 | 9.33 | 80 |
| T9 | 0.58 | 2.95 | 1.19 | 6.15 | 9.89 | 79 |
| T10 | 0.77 | 3.86 | 1.32 | 7.42 | 9.69 | 79 |
| T11 | 0.87 | 4.15 | 1.32 | 7.78 | 9.23 | 78 |
| T12 | 0.85 | 4.16 | 1.33 | 7.94 | 9.49 | 78 |
| T13 | 0.38 | 2.57 | 1.01 | 5.48 | 9.40 | 83 |
| Frequency of Application | Zinc Fractions (mg kg−1) | ||||||
|---|---|---|---|---|---|---|---|
| WS+EX-Zn | COM-Zn | AMO-Zn | ORG-Zn | CRY-Zn | RES-Zn | TOT-Zn | |
| Initial year | 0.136 | 0.843 | 0.343 | 1.861 | 2.733 | 24.518 | 30.345 |
| Alternate year | 0.201 | 0.968 | 0.380 | 2.091 | 2.810 | 25.235 | 31.476 |
| Every year | 0.254 | 1.250 | 0.425 | 2.419 | 3.150 | 25.818 | 32.922 |
| Control | 0.112 | 0.760 | 0.300 | 1.620 | 2.780 | 24.460 | 29.572 |
| Treatments | Grain Yield (mg ha−1) | Straw Yield (mg ha−1) | Harvest Index (%) |
|---|---|---|---|
| T1 | 3.90 de | 6.91 bcd | 36 a |
| T2 | 4.07 cde | 6.46 d | 39 a |
| T3 | 3.94 cde | 6.72 cd | 37 a |
| T4 | 4.04 cde | 6.97 bcd | 37 a |
| T5 | 4.12 cd | 7.35 abc | 36 a |
| T6 | 4.25 bc | 7.31 abcd | 37 a |
| T7 | 4.56 ab | 7.90 a | 37 a |
| T8 | 4.67 a | 7.97 a | 37 a |
| T9 | 4.11 cd | 7.10 abcd | 37 a |
| T10 | 4.59 a | 7.71 ab | 37 a |
| T11 | 4.63 a | 7.95 a | 37 a |
| T12 | 4.18 cd | 7.29 abcd | 36 a |
| T13 | 3.77 e | 6.46 d | 37 a |
| SEm (±) | 0.11 | 0.29 | 1.2 |
| LSD (p ≤ 0.05) | 0.33 | 0.88 | ns |
| Treatments | Zn Uptake (g ha−1) | Zn Harvest Index | ||
|---|---|---|---|---|
| Grain Uptake | Straw Uptake | Total Uptake | ||
| T1 | 96.3 de | 170.7 def | 267.0 cdef | 0.36 a |
| T2 | 100.5 cde | 159.6 f | 260.1 ef | 0.39 a |
| T3 | 97.3 cde | 166.0 ef | 263.3 def | 0.37 a |
| T4 | 99.8 cde | 172.2 def | 272.0 cdef | 0.37 a |
| T5 | 101.8 cd | 181.6 bcd | 283.3 bcd | 0.36 a |
| T6 | 105.0 bc | 180.6 bcd | 285.5 bc | 0.37 a |
| T7 | 112.6 ab | 189.0 abc | 301.7 ab | 0.37 a |
| T8 | 115.4 a | 196.9 a | 312.2 a | 0.37 a |
| T9 | 101.5 cd | 175.4 cde | 276.9 cde | 0.37 a |
| T10 | 113.4 a | 190.4 ab | 303.8 ab | 0.37 a |
| T11 | 114.4 a | 196.4 a | 310.7 a | 0.37 a |
| T12 | 103.3 cd | 180.1 bcd | 283.3 bcd | 0.36 a |
| T13 | 93.1 e | 159.6 f | 252.7 f | 0.37 a |
| SEm (±) | 2.72 | 4.51 | 7.33 | 0.01 |
| LSD (p ≤ 0.05) | 8.1 | 13.8 | 21.9 | ns |
| Parameters | WS+EX Zn | COM-Zn | AMO-Zn | ORG-Zn | CRY-Zn | RES-Zn | TOT-Zn | Grain Yield | Zn Uptake |
|---|---|---|---|---|---|---|---|---|---|
| WS+EX Zn | 1 | ||||||||
| COM-Zn | 0.929 ** | 1 | |||||||
| ORG- Zn | 0.932 ** | 0.910 ** | 1 | ||||||
| AMO- Zn | 0.936 ** | 0.960 ** | 0.938 ** | 1 | |||||
| CRY- Zn | 0.822 ** | 0.809 ** | 0.842 ** | 0.804 ** | 1 | ||||
| RES- Zn | 0.893 ** | 0.944 ** | 0.877 ** | 0.954 ** | 0.733 ** | 1 | |||
| TOT- Zn | 0.946 ** | 0.971 ** | 0.949 ** | 0.975 ** | 0.828 ** | 0.972 ** | 1 | ||
| Grain yield | 0.737 ** | 0.688 ** | 0.620 * | 0.665 * | 0.470 | 0.551 | 0.609 * | 1 | |
| Zn uptake | 0.722 ** | 0.730 ** | 0.600 * | 0.677 * | 0.440 | 0.554 | 0.636 * | 0.925 ** | 1 |
Publisher’s Note: MDPI stays neutral with regard to jurisdictional claims in published maps and institutional affiliations. |
© 2021 by the authors. Licensee MDPI, Basel, Switzerland. This article is an open access article distributed under the terms and conditions of the Creative Commons Attribution (CC BY) license (https://creativecommons.org/licenses/by/4.0/).
Share and Cite
Lakshmi, P.V.; Singh, S.K.; Pramanick, B.; Kumar, M.; Laik, R.; Kumari, A.; Shukla, A.K.; Abdel Latef, A.A.H.; Ali, O.M.; Hossain, A. Long-Term Zinc Fertilization in Calcareous Soils Improves Wheat (Triticum aestivum L.) Productivity and Soil Zinc Status in the Rice–Wheat Cropping System. Agronomy 2021, 11, 1306. https://doi.org/10.3390/agronomy11071306
Lakshmi PV, Singh SK, Pramanick B, Kumar M, Laik R, Kumari A, Shukla AK, Abdel Latef AAH, Ali OM, Hossain A. Long-Term Zinc Fertilization in Calcareous Soils Improves Wheat (Triticum aestivum L.) Productivity and Soil Zinc Status in the Rice–Wheat Cropping System. Agronomy. 2021; 11(7):1306. https://doi.org/10.3390/agronomy11071306
Chicago/Turabian StyleLakshmi, Pepakayala Vara, Santosh Kumar Singh, Biswajit Pramanick, Mukesh Kumar, Ranjan Laik, Aradhna Kumari, Arvind K. Shukla, Arafat Abdel Hamed Abdel Latef, Omar M. Ali, and Akbar Hossain. 2021. "Long-Term Zinc Fertilization in Calcareous Soils Improves Wheat (Triticum aestivum L.) Productivity and Soil Zinc Status in the Rice–Wheat Cropping System" Agronomy 11, no. 7: 1306. https://doi.org/10.3390/agronomy11071306