Article

From Traditional Food to Functional Food? Evaluation of Malvaceae Species as Novel Food Crops

1
Food Sciences Department, Faculty of Sciences and Technology, Tel Hai College, Upper Galilee 1220800, Israel
2
Department of Natural Resources, Institute of Plant Sciences, Agricultural Research Organization, Rishon LeZion 7505101, Israel
*
Author to whom correspondence should be addressed.
Agronomy 2021, 11(7), 1294; https://doi.org/10.3390/agronomy11071294
Submission received: 3 June 2021 / Revised: 21 June 2021 / Accepted: 22 June 2021 / Published: 26 June 2021
(This article belongs to the Special Issue New Crops for Arid Regions)

Abstract

:
Diversification of local food production can streamline supply chains, and ultimately increase food security. Research often focuses on improving existing crops by selection and by agro-technology rather than searching for novel crops. Plants that are traditionally eaten are interesting candidates for adaptation to commercialised agriculture. In this research, two Malvaceae species were explored as potential food crops, as the literature suggests Malvaceae exhibits valuable nutritional merits. This work examined Malva nicaeensis and Lavatera cretica, referred to as “Khubeza” (or “Hubeza”) as a generic term. The plants were experimentally cultivated in two different locations, their leaves were collected, and nutritive values compared. Khubeza leaves exhibited similar or better nutritive value to that of spinach, used here as a reference product. Thus, we conclude that “Khubeza” has potential to enhance food security, expand economic implementation, and to overall diversify agriculture, making it more resilient in the face of projected changes.

1. Introduction

Growing food demands and increasing agriculture-associated environmental pressures [1,2] are emphasizing the need for production of more food while applying sustainable practices [3]. Diversifying crops will help to break uniformity in agriculture [4,5] and will foster more sustainable agroecosystems, create more efficient supply chains, and ultimately increase food security. Novel crops in arable land diversify the agriculture ecosystems, thereby rendering it more resilient to current and future changes [6]. However, food security in drylands, which cover 14–20% of the Earth’s surface [7], poses a unique challenge, characterized by low levels of primary production [8]. Their vast area, high radiation, and accumulation of agronomic knowledge can empower significant expansion of dryland agriculture and novel use of numerous local wild plants [9]. Shelef et al. [10] showed how the use of local food reflects the challenges and principles of sustainable agriculture. Local plants are more likely to select for varieties adapted to tolerate the local environment, thus minimizing the costs of inputs, i.e., water, fertilizers, and pesticides [11]. However, research on the diversification of dryland agriculture commonly focuses on genetic selection and agro-technic improvement of existing species and practices [12] rather than searching for novel species from nature. While recruiting novel crops is a challenging strategy in many aspects, it bears high potential for significant diversification of our food systems.
Considered as the origin of many crops and practices [13], the Mediterranean area is an interesting ecosystem to explore with regards to novel crops. Many of the wild annual greens that grow wild during the rainy season are traditionally used as food [14]. Plants in Mediterranean biomes are exposed to dry and hot seasons and hence, it is likely that some of the local families or genus have relatives adapted to desert conditions. For instance, 32 species of the Malvaceae family are found in Israel, in semi-arid and arid lands. The Malvaceae family is comprised of over 4000 species, many of which are of economic and agricultural importance, such as cotton (Gossypium spp.), cacao (Theobroma cacao) and Okra (Abelmoschus esculentus). Some of the Malvaceae found in Israel have been used as traditional food for many years. Its traditional generic term, Khubeza (or Hubeza) which derives from the Arabic word “Khubez” (خُبْز), meaning bread, signifies the importance of edible Malvaceae leaves. Despite its centrality, the nutritional value and agronomic potential of the most dominant Malvaceae species in Israel, Malva nicaeensis and Lavatera cretica, have not been extensively addressed [15]. M. parviflora is another relative species, with a broad geographic distribution, including deserts [16], and is cultivated as a food crop in Egypt [17].
The literature suggests valuable nutritional merits of relative Malvaceae leaves [18]. For example, fresh or boiled M. sylvestris leaves can provide a significant nutritious additive to the diet [19], without any apparent adverse effects, even when high levels of nitrates were a concern [20]. Ben Simchon et al. [15] showed that M. nicaeensis and L. cretica can provide a good source of green leaves, with nutritional benefits similar to those of five other green leaves Cichorium endivia L., Beta vulgaris L., Rumex sp., Spinacia oleracea L., and Tetragonia tetragonioides Pall, with the latter two commonly known as spinach.
M. nicaeensis and L. cretica leaves are adapted to track the sunlight (heliotrophy) [21], and can grow rapidly in a short season of rain. A leaf blade can grow as large as 20 cm in diameter and is typically 7–14 cm in diameter. These two species often co-exist in the same space, and appear similar at first sight, especially in the early vegetative growth stages. In fact, the classification of L. cretica to a different genus is questioned [22] due to its similarity to Malva species. Traditionally, gentle leaves are preferred for harvest, and therefore the leaf morphology of M. nicaeensis makes it the first priority for use. These ruderal species are nitrophilic, prospering in nitrogen-rich habitats [23]. High levels of nitrates are dangerous for ruminants, and its safety needs to be considered when examining them for human consumption [24]. Nitrophily also suggests that the focal species may serve as catch-crops, to mitigate nitrogen leaching [25,26]. Indeed, Malva population dynamics are significantly linked to both high levels of nitrogen in the soil and the rapid depletion of these elements [27]. This work explored the agronomic properties of the two Malvaceae species in the field and analyzed the nutritional value of their leaves. Freshly cut spinach leaves of S. oleracea, and T. tetragonioides served as reference species. Developing new crops from native plants will provide more income opportunity to farmers, food variety coupled with high nutritional values for consumers, and support the sustainability of Mediterranean and dryland agro-ecosystems via diversification.

2. Materials and Methods

2.1. Focal Species, Seed Collection

Dry fruits of L. cretica and M. nicaeensis were collected from wild (not cultivated) populations at the Agricultural Research Organization (ARO), Rishon Le Zion, Israel (31°59′ N 34°49′ E), in Summer 2019. Fruits were allowed to break apart to seeds, and branches and leaves were discarded. Seeds were stored at 4 ºC for the coming Fall 2019. Malvaceae seeds are known to exhibit germination inhibition, with environmental conditions affecting this phenomenon [28]. Therefore, we used a pre-seeding chemical scarification treatment of L. cretica seeds that involved soaking them in 98% H2SO4 for 60 min before washing in water. For M. nicaeensis, sandpaper was used for gentle physical scarification.

2.2. Research Setup

Two M. nicaeensis and L. cretica cultivation experiments, each performed in two different locations (Figures S1–S3), were conducted between Fall 2019 (October) and through Spring 2020 (April), to compare the species development and establish resource for a phytochemical analysis. At the ARO location, the two species were cultivated in six blocks, with two plots per species, and two planned harvesting regimes—a single harvest at the end of growth, and multi-harvest throughout the growing season. However, since growth was limited (with only one regime performed), a single final harvesting at the end of the growth season. Consequentially, there were 12 plots per species, for an overall of 24 plots. The size of each plot was 1 m × 6.5 m. Following soil preparation, including farmyard manure fertilization, a manual seeding machine (jP-1, Terradonis, France) was used to seed four rows per plot, with 10 cm gaps between seeds, placed at a 5 mm depth (S1). Sprinkler irrigation was used only by demand during the first month of sprouting and establishment, when rain stopped for more than one week. No additional fertilization, herbicides or pesticides were applied. A smaller experiment, with 7 plots per species (S2), was conducted at Havat Hanoi (herein, H. Hanoi) (32°20′ N 34°55′ E), a botanic and educational farm near Ruppin Academic Center. Plot size was 1 m × 3.5 m and seeding was manual, with 20 cm gaps between seeds, and was performed with the assistance of the farm pupils (3rd grade, Avihayil Preliminary School). Realizing that the produced biomass in the experimental gardens may not be sufficient for a thorough phytochemical analysis, leaves were collected from wild populations of M. nicaeensis and L. cretica at the ARO campus, and near Sandala village, Emek Yizrael (32°31′ N 35°18′ E). Fresh leaves of cultivated spinach (S. oleracea, and T. tetragonioides) were also collected in Sandala, for reference. Finally, due to significantly low biomass production in the field, and after some technical issues in the preparation process, the final set of samples included 44 samples of the following resources: 22 L. cretica (12 were cultivated at the ARO farm (one sample per plot)), 5 were wild populations growing at field margins (ARO), and 5 were cultivated at H. Hanoi), 12 M. nicaeensis samples (3 cultivated at H. Hanoi, 5 wild plants from field margins at the ARO farm, and 4 samples from wild populations at Sandala), 5 S. oleracea samples and 5 T. tetragonioides samples cultivated at Sandala. Each sample comprised 1.3 ± 0.75 kg fresh leaves before drying. In Fall 2020, in an additional experiment conducted to study the impact of nitrogen (N) enrichment on Malcaveae development (Figure S4), seeds of M. nicaeensis and L. cretica were sown in a net house in a two factorial research setups: two species X two fertigation levels, normal nitrogen supply (120 ppm N—100%, equivalent to approximately 5.2 kg/ha in 50 days) and high supply (180 ppm N—150%, equivalent to approximately 8.6 kg/ha in 50 days)). The experiment was constructed using a random 5-block design. The experiment provided initial data for cultivation recommendations and no phytochemical analysis of the leaves of this initial nutrition experiment was performed.

2.3. Plant Development

Plant development was periodically assessed (every two months) throughout the growth period of the 2019–2020 experiment. The number of leaves, plant height, and leaf size, i.e., diameter of leaf blade from petiole contact point to the furthest peripheral edge, were measured from 3–5 plants per plot. After harvest, fresh biomass, and dry biomass with calculated water content, were measured. For dry weight (DW) measurement, plants were dried in paper bags, in an oven (48 h, 75 °C). At the cultivated ARO field, leaf weight and its proportion of the total shoot weight were determined.

2.4. Phytochemical Nutritive Analysis of Leaves

For phytochemical analysis, the 44 samples were freeze-dried in a lyophilizer (Gamma 2–20, Martin Christ Gefriertrocknungsanlagen GmbH, Germany). The leaves were arranged in a pile, to allow desiccation, and left to dry for at least 48 h. Whenever total desiccation was not achieved, the leaves were lyophilized for another cycle, until fully desiccated (Figure S5). The dry leaves were then weighed, grossly ground to a powder, and stored in deep freeze (−80 °C). All 44 samples were phytochemically analyzed in Summer 2020, at the Food Sciences Department, Faculty of Sciences and Technology, Tel Hai College. Each dried powder sample was analyzed for phenolic content (Section 2.4.2.), antioxidative activity (Section 2.4.3.), and ascorbic acid (Section 2.4.4.), protein (Section 2.4.5.), fibers (Section 2.4.6.), sugars (Section 2.4.7.) and minerals (Section 2.4.8.) content. In addition, various concentrations of dry Khubeza powder (S6) were used to make wheat dough (see Figures S6–S8) for examples of some potential products of Khubeza powder). For a consumer, green leaves may contain gentle leaf petioles, and the leaves are consumed fresh with 80–90% water content, which dilutes the analyzed concentrations. The green leaves are often used boiled, cooked, scalded, or fried, and heating may damage some of the phytochemical content. Therefore, the nutritional value analysis of Malvaceae dried leaves used green leaves with a similar culinary role as a comparator. For nutritional interpretation, we relate here to a “serving size”. Despite the ambiguity of this term [29], when relevant, we refer to a serving size of 1 cup, equivalent to 30 g fresh leaves, or ~5 g DW. Therefore, to transform the values from weight per g DW to weight per serving size of fresh leaves, a factor of X5 should be used.

2.4.1. Methanolic Extract Preparation

Leaf powder from each sample was subjected to alcoholic extraction using a mixture of methanol/water (60/40, v/v) at a proportion of 1:10 (sample/solvent, w/v). A homogenizer (Unidrive×1000 CAT, Ballrechten-Dottingen, Germany) was used for 1 min at 8500 rpm, followed by sonication for 5 min, at room temperature (Delta-D150, Taiwan) and the procedure was then repeated for three rounds. The mixture was then centrifuged (5804 R, Eppendorf, Germany) at 3200× g, 4 °C for 15 min and total phenolics and ascorbic acid content and antioxidant activity were determined.

2.4.2. Total Phenolic Content (TPC)

TPC was determined using the Folin–Ciocalteu assay [30] with modifications. Briefly, 100 µL of the sample extract was mixed with 1.5 mL distilled water, and then with 125 µL Folin–Ciocalteu reagent. After 5 min, the mixture was neutralized by addition of 375 µL 20% aqueous solution of sodium carbonate and 475 µL distilled water. After 10 min of equilibration, the absorbance was measured at 765 nm (G10S UV-Vis, Thermo Fisher Scientific, Madison, WI, USA). Gallic acid was used as a standard equivalent and the results were calibrated and expressed as mg gallic acid equivalent per g of sample (DW basis).

2.4.3. Ferric-Reducing Antioxidant Power (FRAP)

The ferric-reducing ability of the methanolic extracts of the dried leaves was measured using the FRAP method described by Benzie et al. [31], with slight modifications. FRAP reagent was prepared by combining 300 mM acetate buffer (pH 3.6), 10 mM 2,4,6-tripyridyl-s-triazine (TPTZ) in 40 mM HCl solution and 20 mM FeCl3 in a proportion 10:1:1 v/v/v, respectively. Afterwards, 200 µL of the extract, 200 µL distilled water and 3000 µL freshly prepared FRAP reagent were mixed and placed in a water bath at 37 °C, for 10 min. After cooling to room temperature, the absorbance was read at 595 nm. Trolox was used for calibration and the results are expressed as mg trolox equivalent per g of the sample (DW basis).

2.4.4. Ascorbic Acid Determination

Ascorbic acid content was measured using the Prussian Blue reaction [32,33], with modification. A mixture of aqueous solutions of iron (III) chloride (FeCl3, 1%) and potassium hexacyanoferrate (III) (K3Fe(CN)6, 1%) was freshly prepared in a proportion 2:1. The methanolic extract (25 µL) was transferred to 2975 µL of distilled water and 0.5 mL of the reagents mixture was added. After 10 min, the absorbance was measured at 700 nm, while a commercial standard of ascorbic acid was used for calibration. Results are expressed as mg ascorbic acid equivalent per g of the sample (DW basis).

2.4.5. Total Protein

Protein content was determined through quantification of total nitrogen, using the Kjeldahl method [34]. Briefly, a sample of 200 mg leaf powder was digested by incubating it with sulfuric acid and hydrogen peroxide in a heating block, for 90 min, at 400 °C. Then, samples were placed in a Kjeldahl distillation unit (FOSS KjeltecTM 8100, Hillerød, Denmark) and distilled for 4 min with a 38% alkali solution (50 mL). The distillate was collected in a receiver flask containing a 4% boric acid solution (25 mL) and titrated with 0.1 N HCl. A conversion factor of 6.25 was applied to convert total nitrogen to protein content, expressed as percentage of protein on dry basis [35].

2.4.6. Total Dietary Fibers

Total dietary fiber content was determined according to the enzymatic-gravimetric method of the Association of Official Analytical Chemists (AOAC, Official method 985.29), using the Total Dietary Fiber Assay Kit (TDF100A, Sigma-Aldrich).

2.4.7. Reducing Sugars Determination

Reducing sugars content was measured by the colorimetric reaction with 3,5-dinitrosalicylic acid reagent [36,37], with some modifications. Leaf powder (100 mg) was hydrolyzed by incubating it with 16 mL HCl (1M), in 70 °C, in a water bath, for 70 min. After cooling to room temperature, the pH was neutralized with an NaOH solution, the mixture was filtered into a flask and volume filled to 30 mL. Then, 200 µL of the sample mixture was added to 1.8 mL distilled water and 2 mL 3,5-dinitrosalicylic acid was added. The reaction was incubated at 95 °C, in a water bath, for 5 min, cooled to room temperature and absorbance was measured at 540 nm (G10S UV-Vis, Thermo Fisher Scientific, Madison, WI, USA). A commercial standard of D-glucose was used for calibration and results are expressed as percentage of DW.

2.4.8. Elemental Analysis and Non-Nutritive Compounds

Leaf powder (100 mg) from each sample was digested and mineralized by adding 5 mL concentrated nitric acid (65%) and then heated, in a water bath, to 100 °C, 1 h. The cooled mixture was transferred to 45 mL distilled water, vortexed and about 10 mL of the mixture were filtered (through syringe CA filter 0.45 µm) into a vial for inductively coupled plasma-optical emission spectrometry (ICP-OES) analysis. ICP-OES analysis conditions were according to the instructions provided with the Thermo Scientific IRIS Intrepid II XDL inductively coupled plasma-atomic emission spectrometer (Thermo Electron Corporation, Waltham, MA, USA). A multi-element standard solution (Multi-4 for ICP, Sigma-Aldrich) was used for calibration and results for each element (Al, Se, Fe, B, Cu, Mn, Ba, K, Mg, Ca, Na and P) are expressed as µg/g (DW basis).
NO3 concentrations were determined by using nitrate test strips (Reflectoquant Nitrate test, Merck, Germany) and a compatible reflectometer strip reader (Reflectoquant RQ flex 10, Merck, Germany). Cl concentrations were measured by using a chloridometer (Chloride Analyser 926, Sherwood Scientific Ltd., Cambridge, UK). Both NO3 and Cl samples were prepared by mixing 100 mg freeze-dried leaves and 10 mL ddH2O, and then shaking the mixture for 1 h, at 150 rpm. Subsequently, samples were allowed to settle at the bench and the liquid was tested with the nitrate test strips for NO3 and chloridometer for Cl. OA concentration were analyzed using the Gallery™ Plus discrete analyzer (Thermo Fisher Scientific, USA) with an OA kit (no. 984348, Thermo Fisher Scientific, Finland). Samples were prepared by incubating 2 g leaves with 40 mL 0.1M HCl pH ≤ 1, in a hot bath shaker, at 80 °C, for 20 min. Subsequently, the mixtures were centrifuged at 8000 rpm, for 10 min, and then filtered through a 0.45 µm filter. Before the analysis, pH was adjusted to 4.5–5.5 by addition of 1M NaOH.

2.5. Data Analysis

All data analyses were carried out using R version 4.0.2 [38]. Generally, for all the measured variables, both the assumptions of normality and homogeneity of residuals variances were first assessed by visual plotting sample quantiles against theoretical quantiles and residuals against fitted values, performing Shapiro–Wilk and Levene’s tests. If variables did not meet the above assumptions, they were tested again after applying square root and log transformations. For variables which eventually met the above assumptions, a linear model was constructed by using lm base function. Mixed models were used to take into account the experimental design in ARO site, those constructed by using lmer function of lme4 package [39]. In these cases, block considered as random factor and the focal species as a fixed factor with interactions of fertilization treatment when those tested. Subsequently, an ANOVA test, followed by Tukey HSD post-hoc test, when necessary, was performed to assess differences between treatments by using anova base function and glht function of multcomp package [40], respectively. The following variables were found to meet the above assumptions and were treated as specified above: plant height (2019–2020), leaf fresh weight (FW) (2019–2020), leaf FW (2020–2021), ascorbic acid, total dietary fibers (TDF) and reducing sugars. When the transformations did not meet normal distribution and homogeny requirements, they were treated as nonparametric. In these cases, the Wilcoxon test was performed to assess differences between two treatments by using stat_compare_means function of ggpubr package [41]. The Kruskal–Wallis test followed by Dunn post-hoc test were used to assess differences between more than two treatments by using kruskal.test base function and dunn.test function of FSA package [42], respectively. The following variables were not found to meet the above assumptions and were treated as nonparametric: plant height (2020–2021), TPC, anti-oxidative activity, total protein. The data of macro- and micro-elements as well as the non-nutritive compound variables (Table 1 and Table 2) were treated with similar statistical methods, as noted in the tables. p-value ≤ 0.05 is referred to as statistically significant. Means and standard deviation (sd) are shown.

3. Results

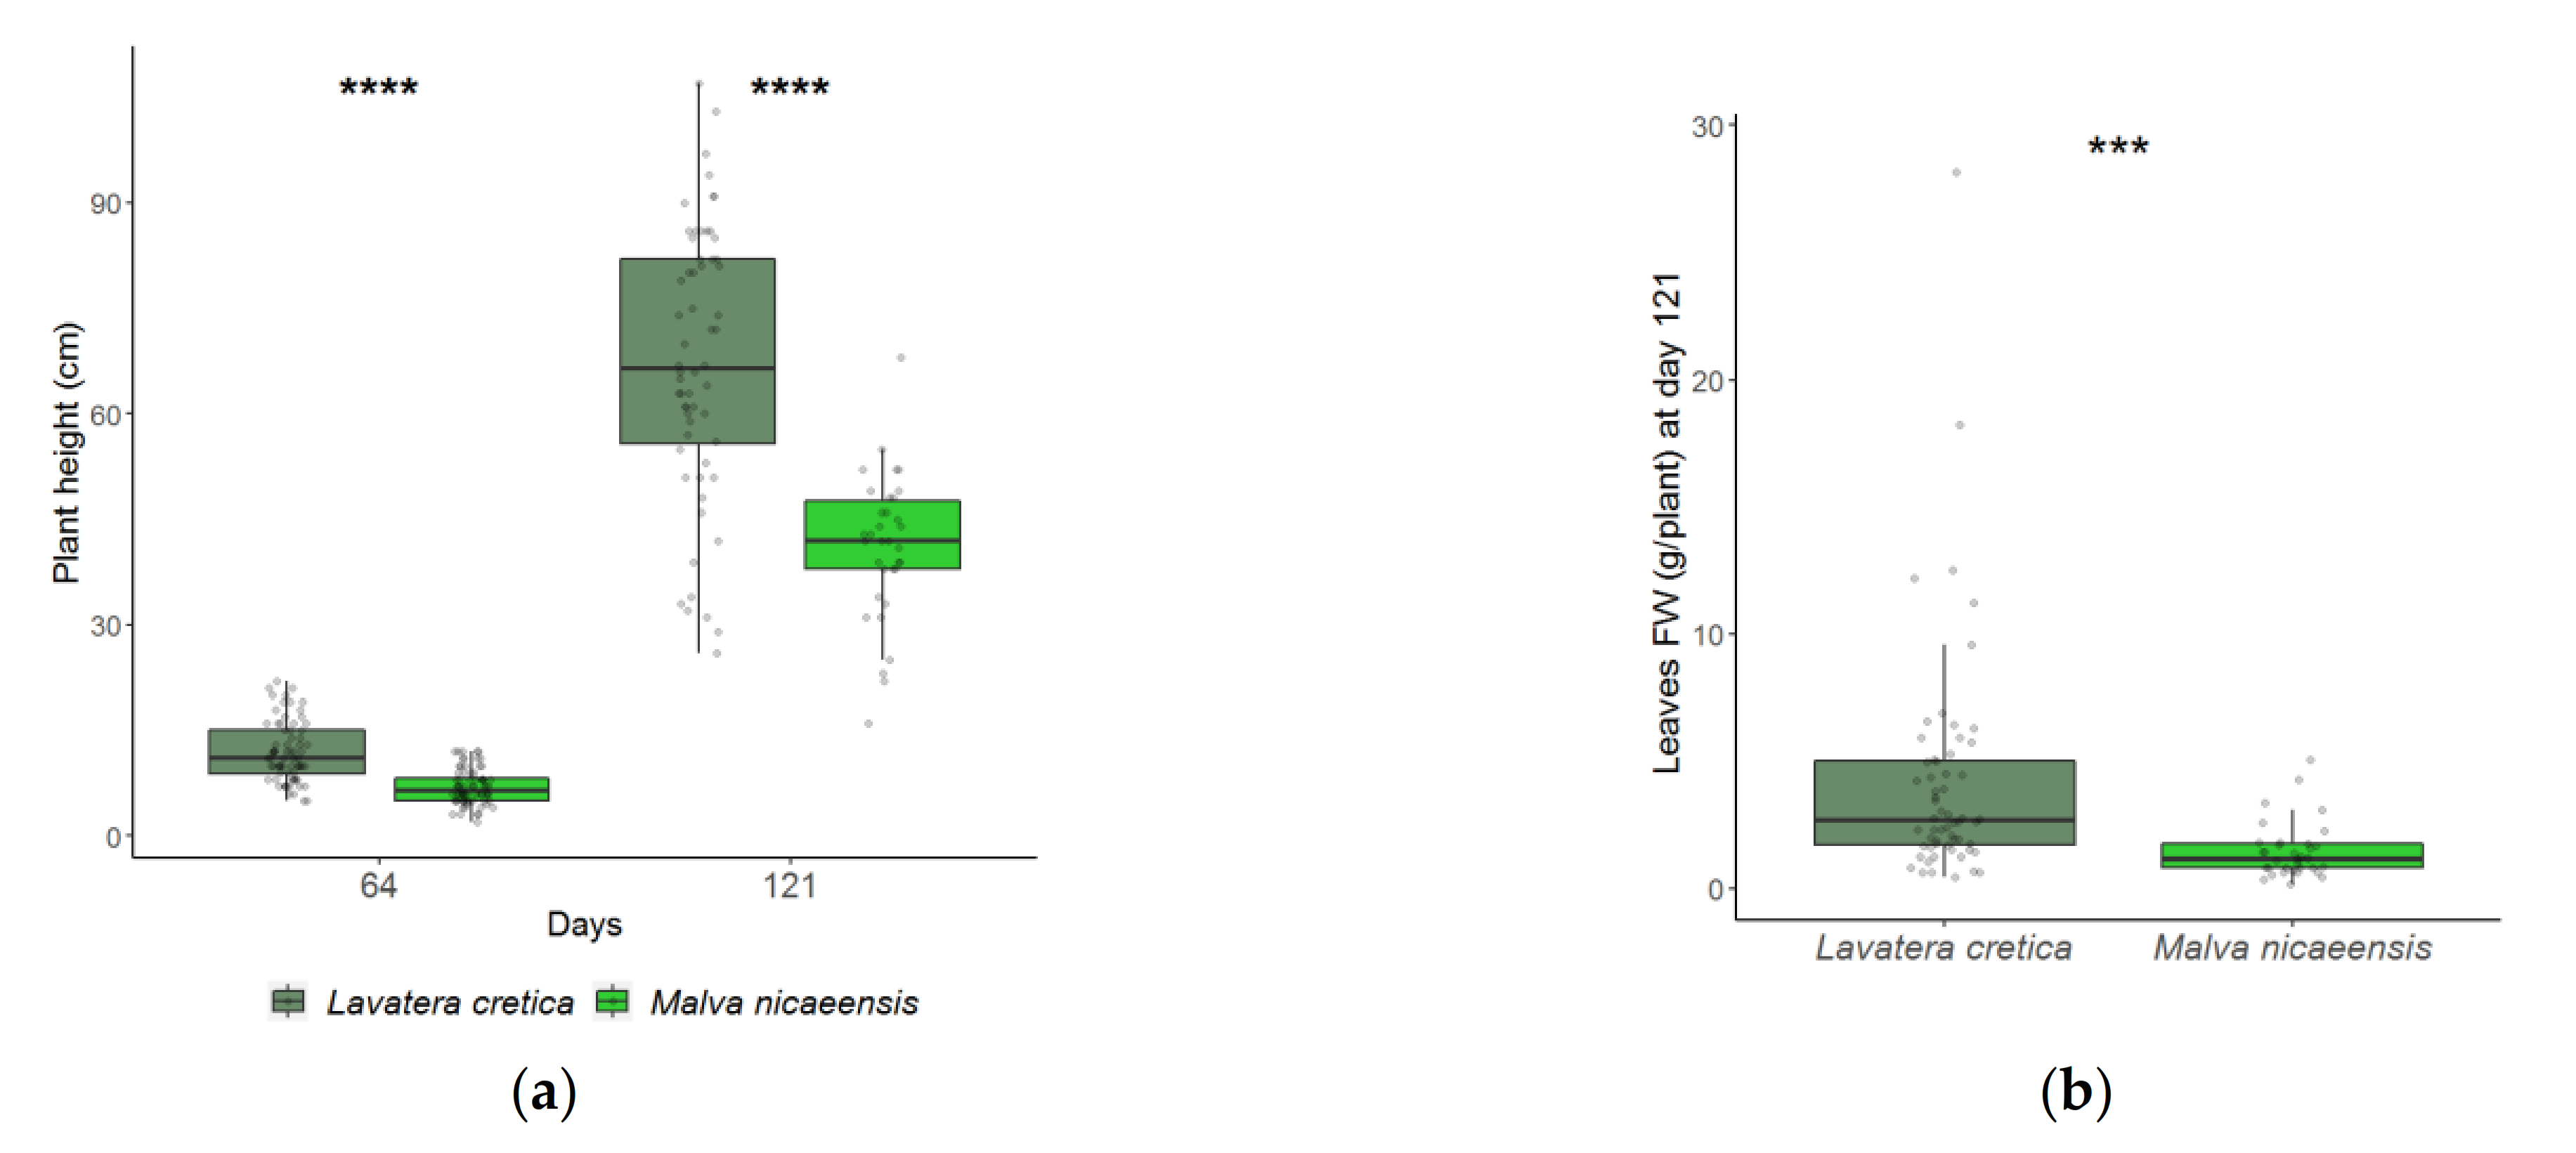
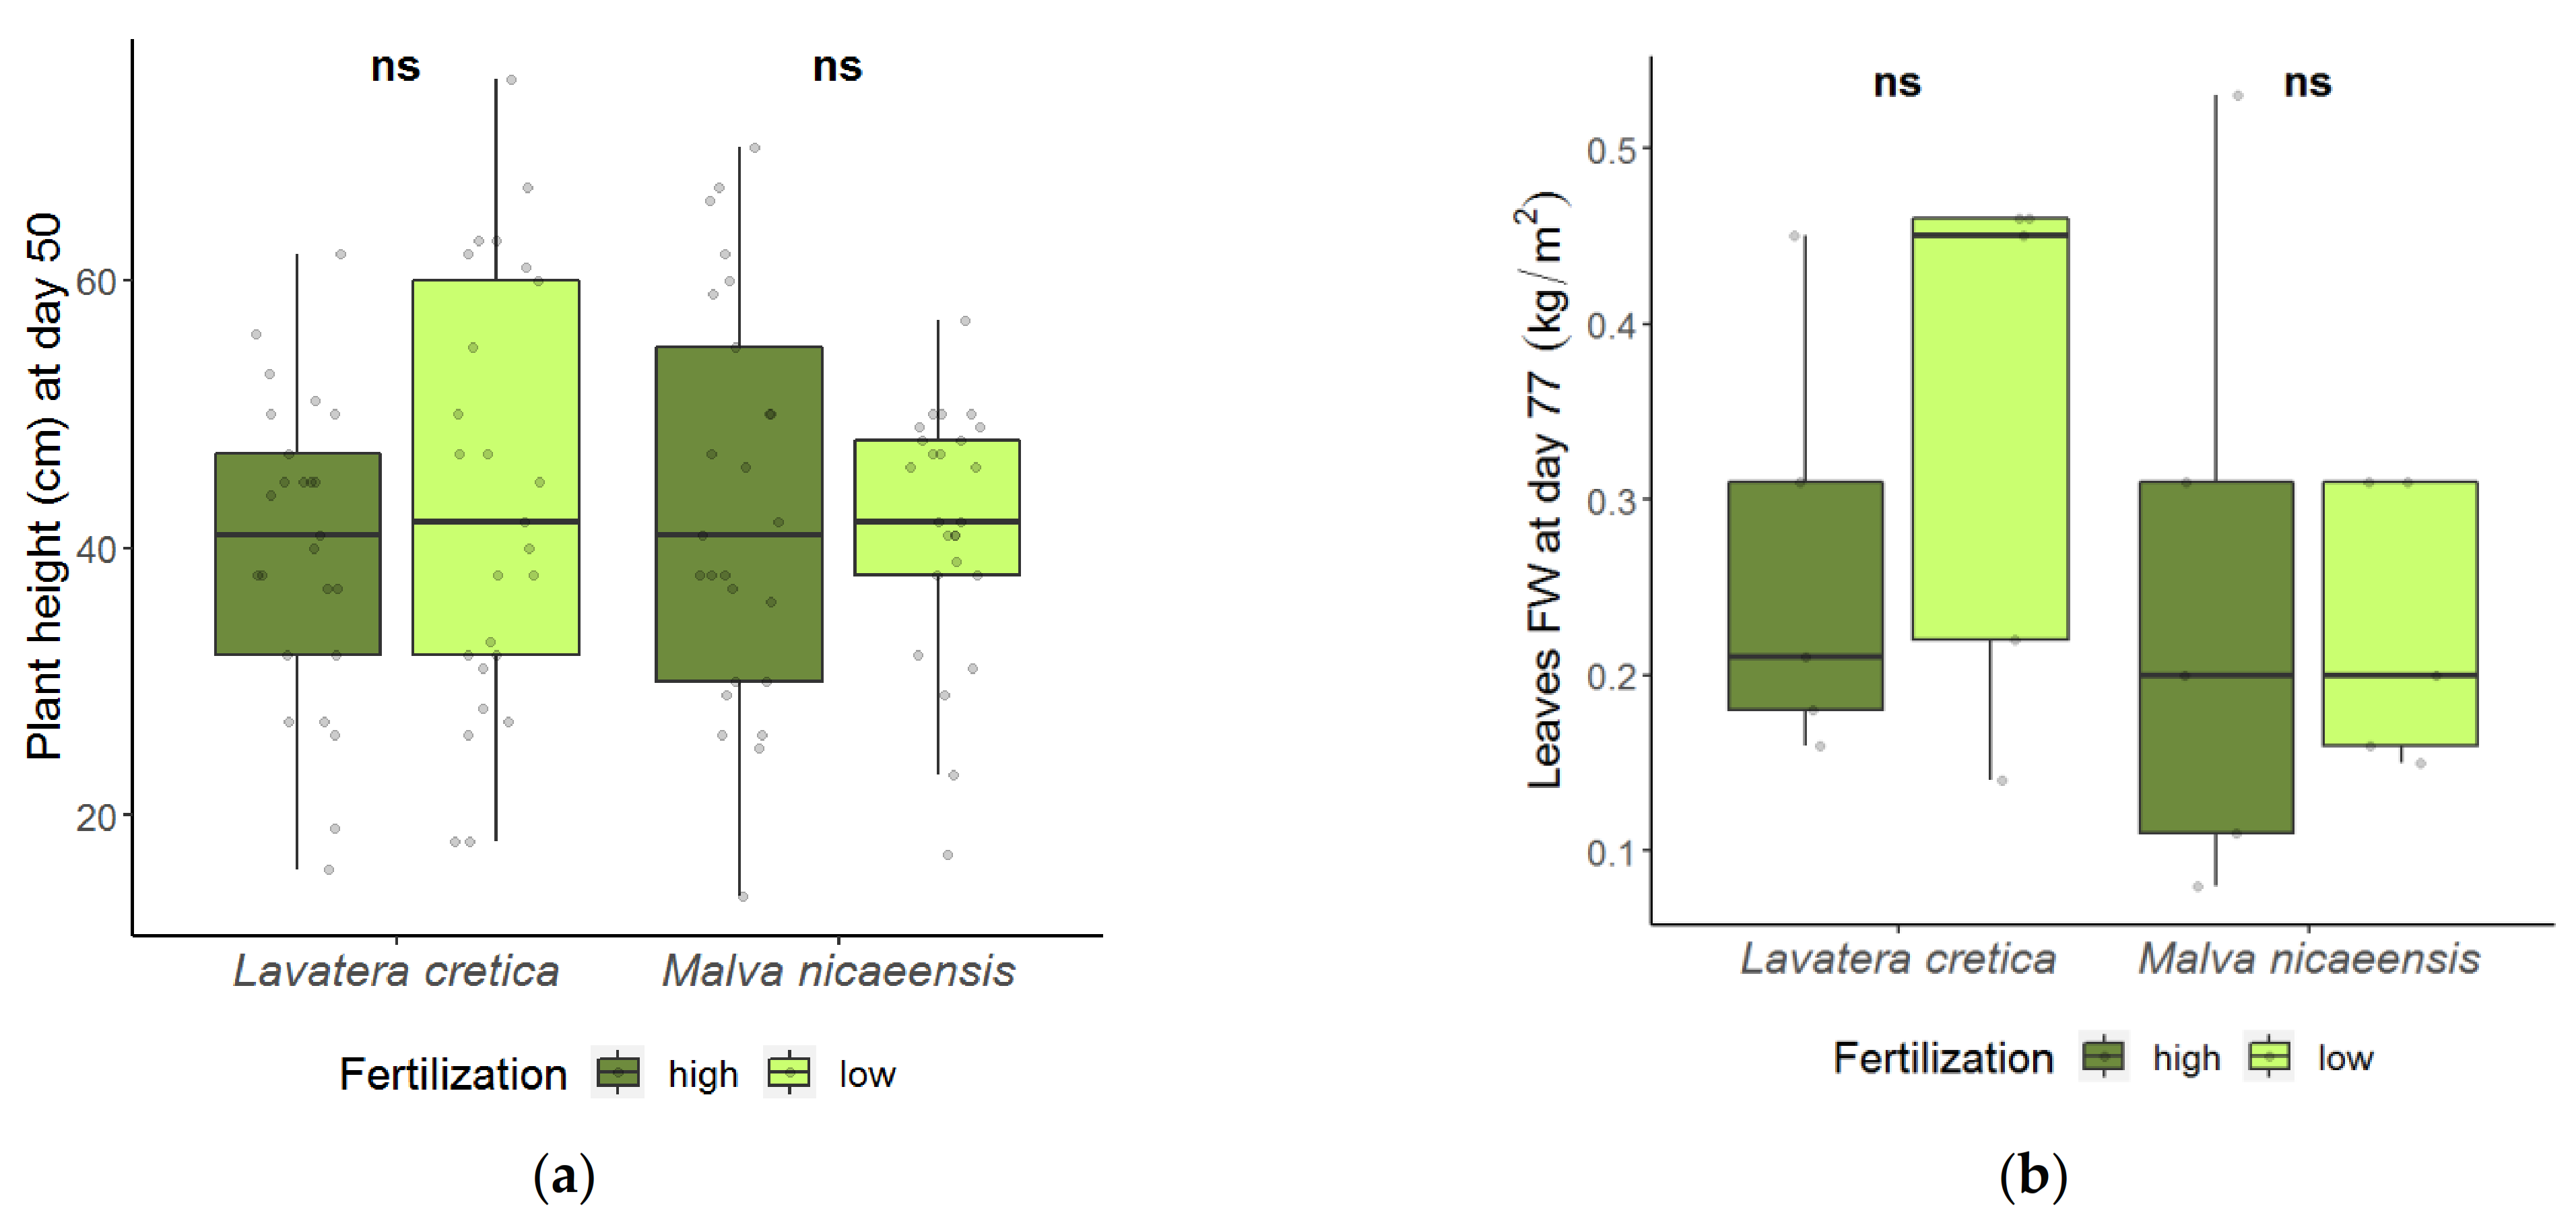
3.1. Plant Development

Our attempts to grow L. cretica and M. nicaeensis in an open field in the winter 2019–2020 season were unsuccessful at both locations (ARO and H. Hanoi cultivated fields). Germination and plant development were limited, and the green leaf yield was insufficient to perform a stand-alone sampling for phytochemical analysis (Figure 1). On average, on day 121, L. cretica plants were 63.75% taller than M. nicaeensis plants (Figure 1a). Moreover, on day 121, the DW biomass of L. cretica leaves per plant was 301.32% higher in comparison to M. nicaeensis. Finally, with less than 10 g leaves per plant (Figure 1b), and only a scant number of individual M. nicaeensis plants per plot in the two locations, we decided to pool plot yields, and add plants from feral populations of field margins.
The agronomic failure of the 2019–2020 cycle resulted in poor plant propagation and survival, and individual biomass was approximately 5 g per plant (Figure 1b). Results of the N-enrichment experiment (2020–2021) confirmed the dependency of Malvaceae on N, which subsequently showed approximately 200g per m2 higher biomass (Figure 2), which was two orders of magnitude higher than plants grown without N-enrichment (Figure 1).
Under N-enrichment, growth of M. nicaeensis was similar to that of L. cretica. With sufficient N supply, M. nicaeensis and L. cretica cultivated in the field, or in feral populations, yielded 2698 ± 1363 kg green leaf FW per hectare. An average 14 ± 7 and 21 ± 11 leaves per L. cretica and M. nicaeensis plant, respectively were measured in the cultivated field 50 days after sowing. After 57 days of growth, L. cretica and M. nicaeensis leaf weights were 63 ± 1% and 66 ± 0% of their total shoot weights, respectively. This proportion was drastically reduced within only three weeks, i.e., 77 days after sowing, when leaf weight was 13 ± 6% and only 9 ± 4%, respectively, of the total shoot weight. This apparent reduction of relative leaf weight suggests that optimal harvesting time is crucial. In addition, we also noted that multi-copiccing is feasible. The manual harvesting efficiency rate was estimated at ~2 kg fresh leaves per person per hour.

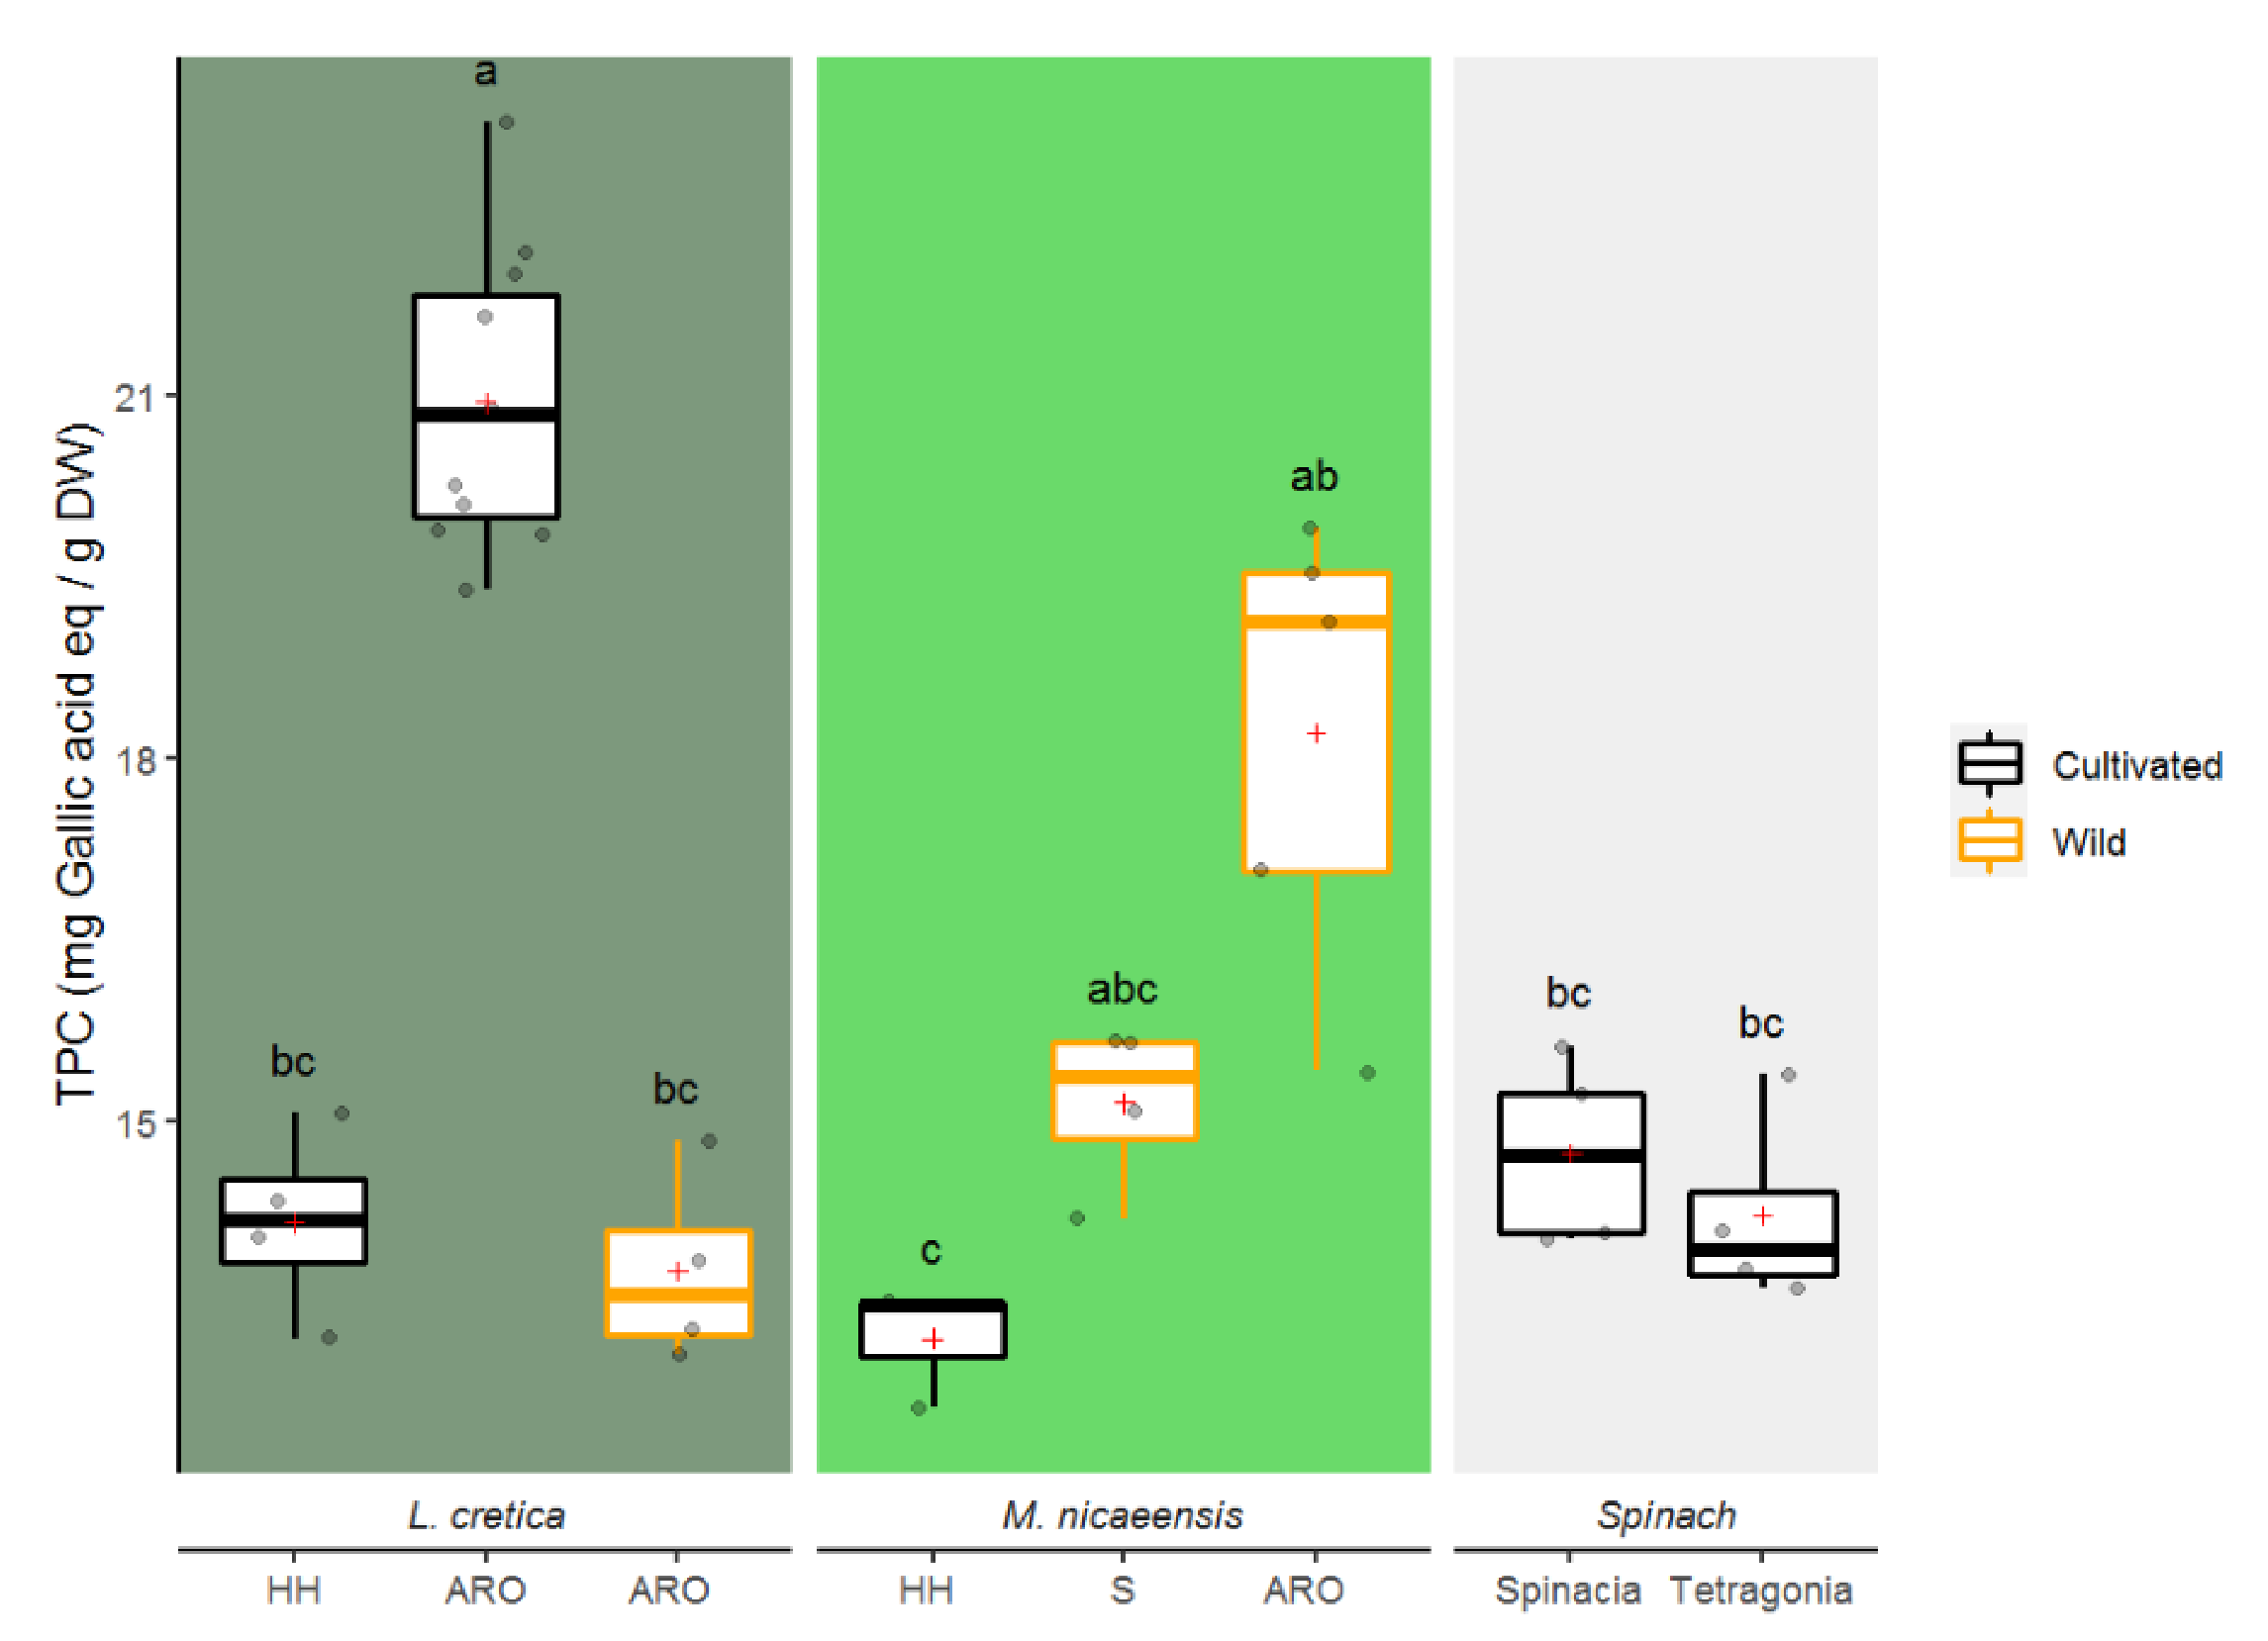
3.1.1. Total Phenolic Content

TPC was similar between the majority of Khubeza leaves and the spinach leaves, with an average value of 16.5 ± 3.2 mg gallic acid equivalent per g DW (Figure 3). The L. cretica leaves grown in the cultivated ARO field showed significantly higher TPC content as compared to cultivated Khubeza and to cultivated spinach. Wild plants of M. nicaeensis from ARO showed significantly higher TPC than cultivated M. nicaeensis.

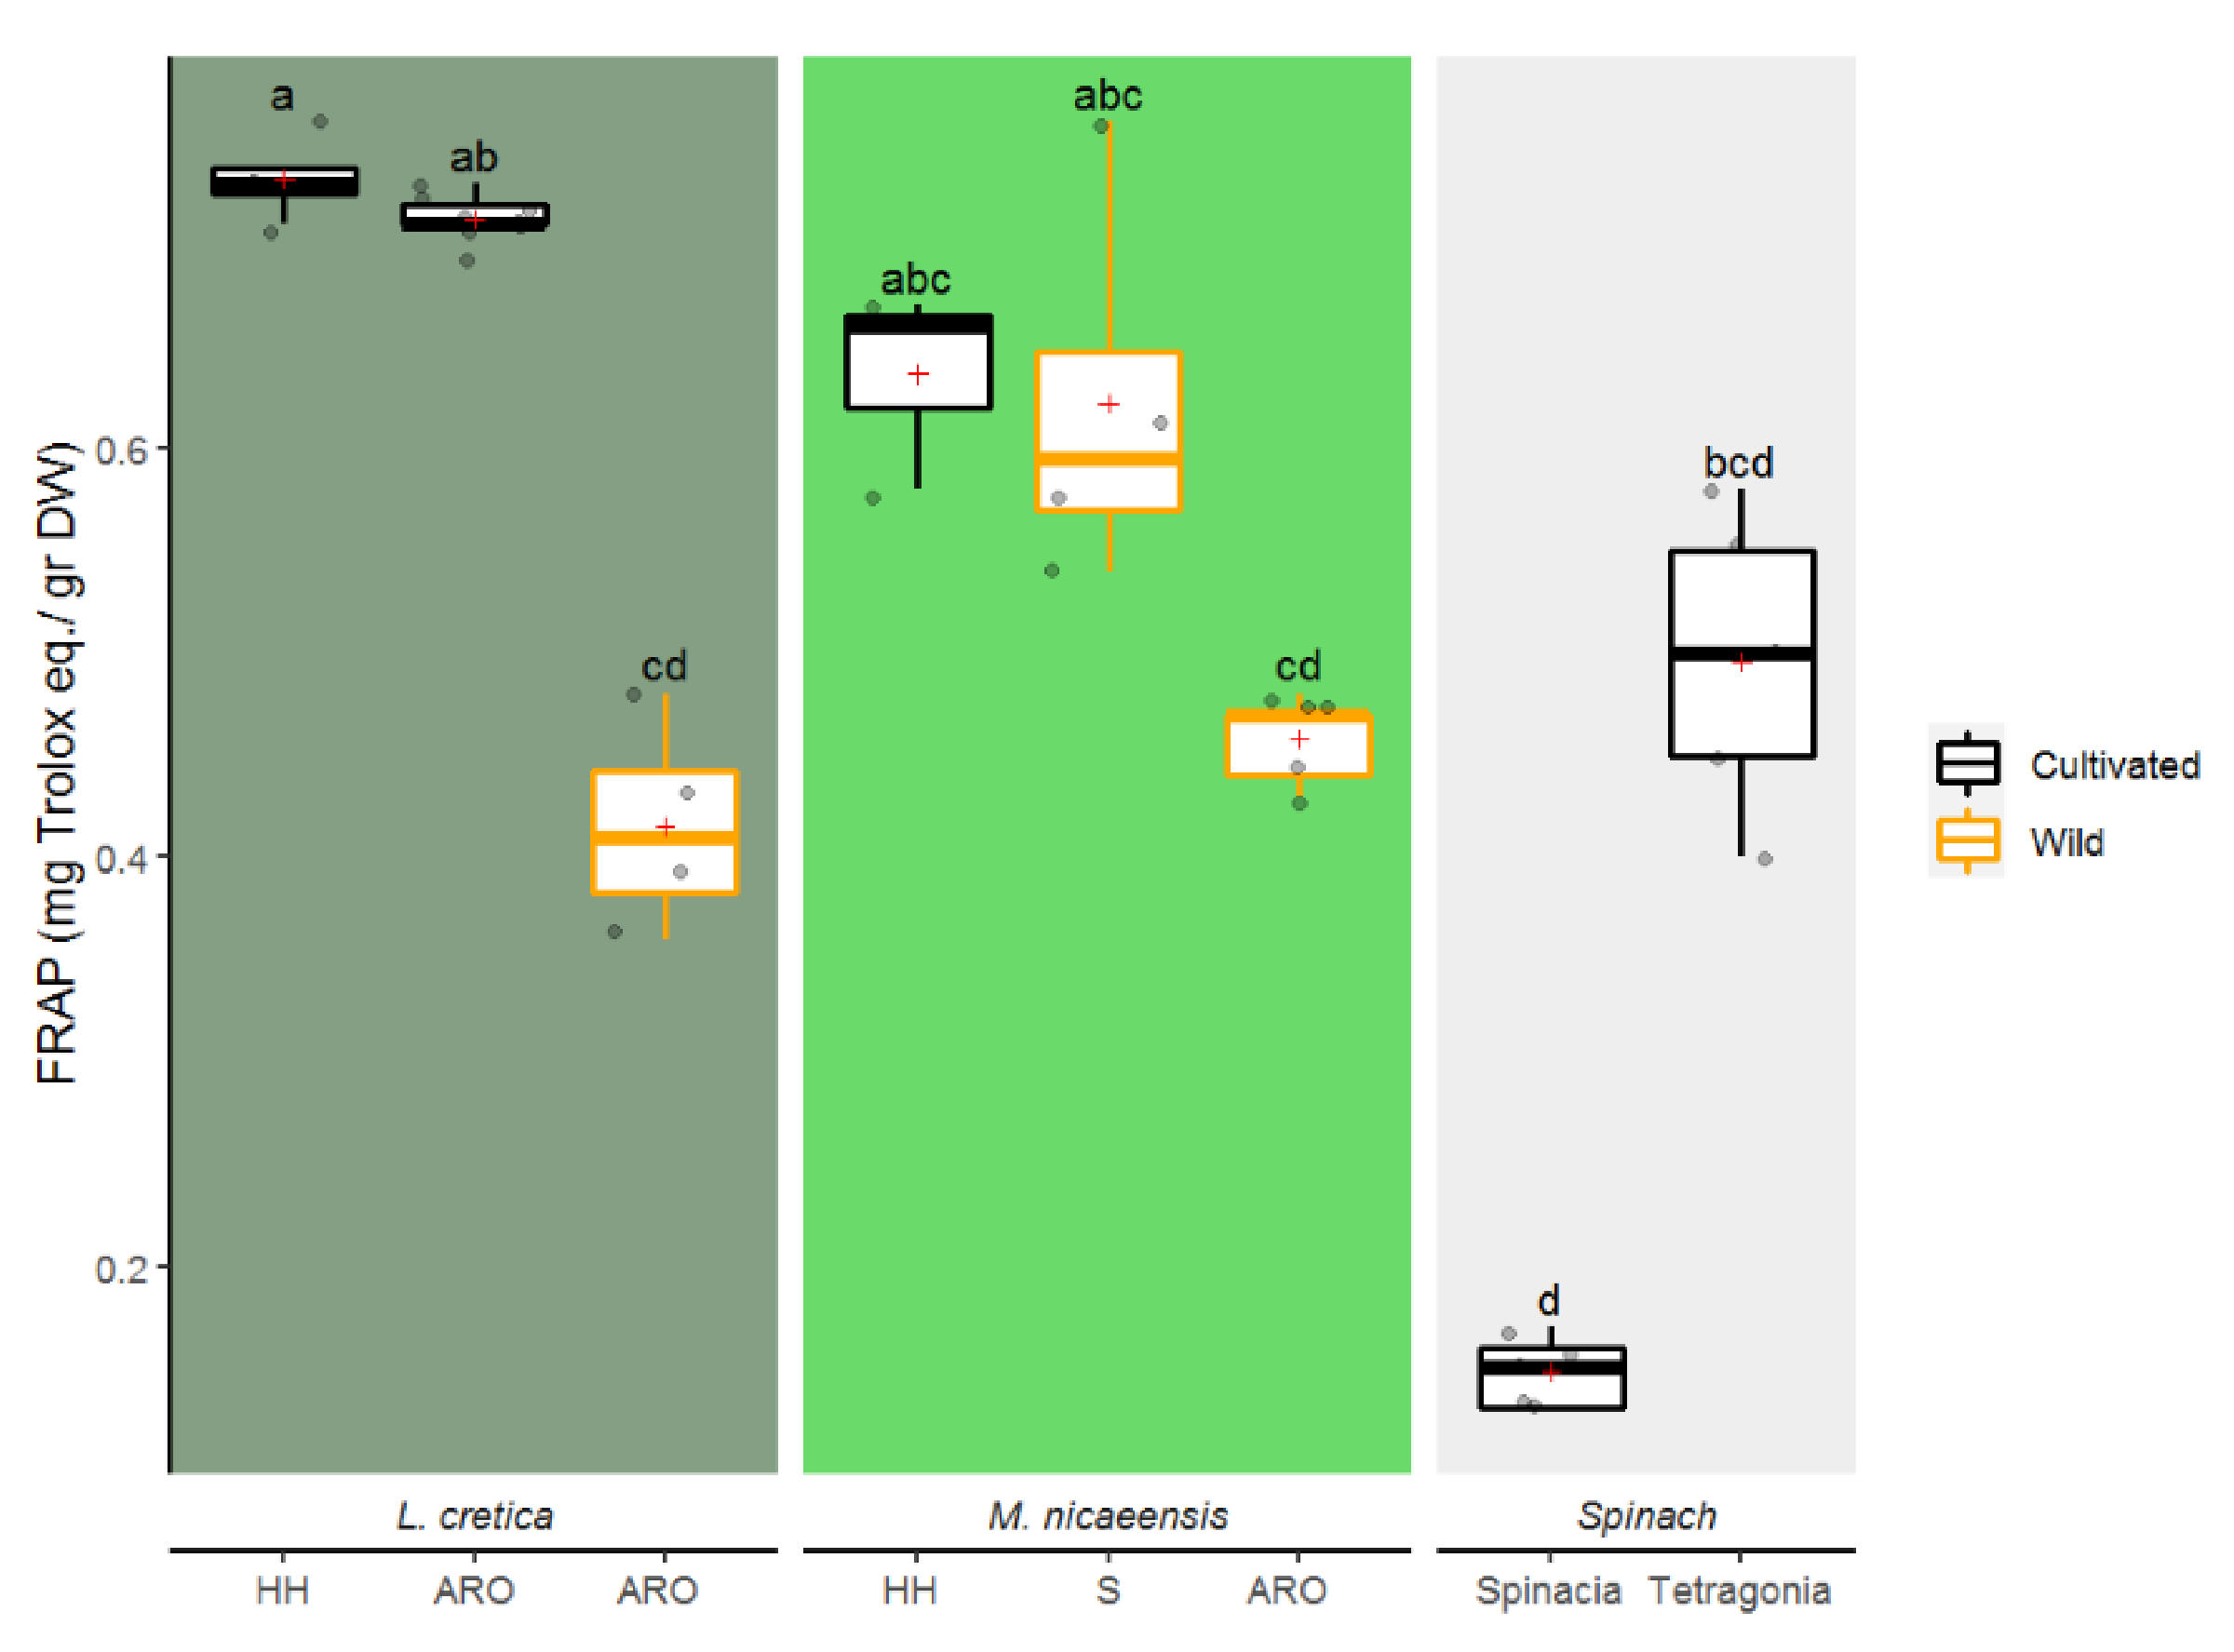
3.1.2. Antioxidative Activity

The antioxidative activity of Khubeza leaves measured 0.6 ± 0.1 FRAP (mg Trolox eq/g DW), with S. oleracea exhibiting X4.14 lower antioxidative activity in comparison to cultivated Lavatera and Malva (Figure 4). The feral population of L. cretica and M. nicaeensis showed lower oxidative activity compared to cultivated types, with significantly lower levels measured in L. cretica only (Figure 4).

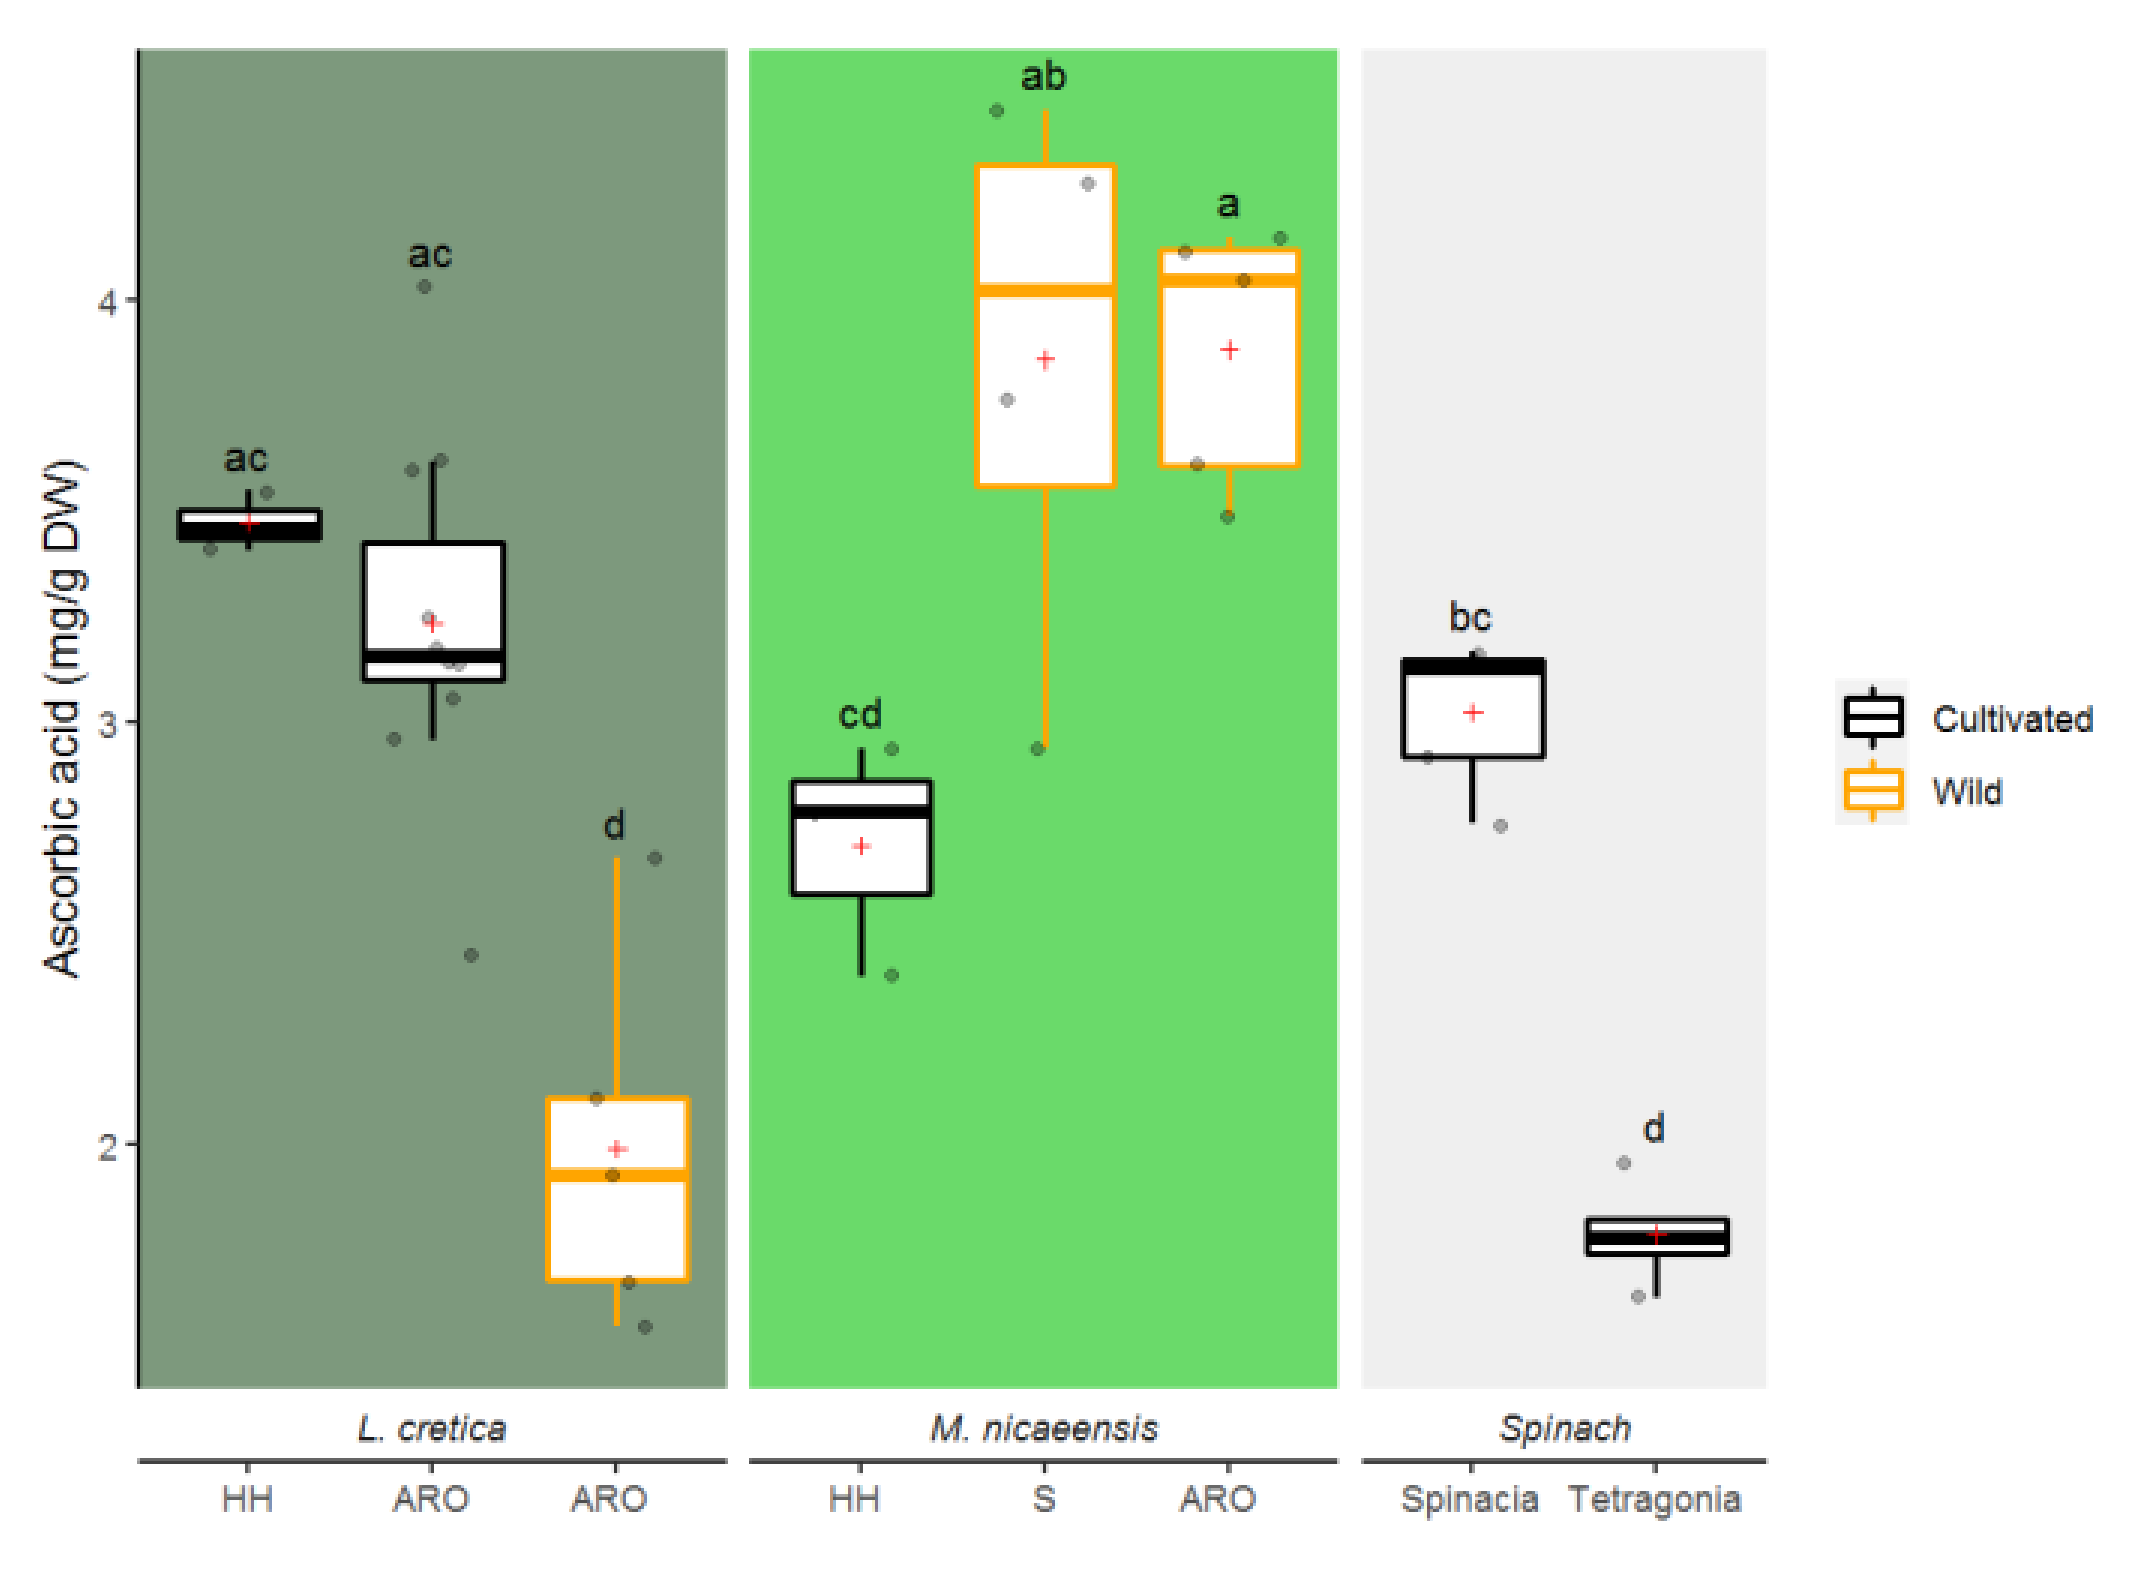
3.1.3. Ascorbic Acid

Ascorbic acid content averaged 3.1 ± 0.8 mg/g DW, equivalent to 15.4 ± 4.1 mg per serving of fresh leaves (Figure 5). The ascorbic acid content in T. tetragonioides and wild L. cretica was significantly lower in comparison to wild populations of M. nicaeensis and cultivated populations of L. cretica.

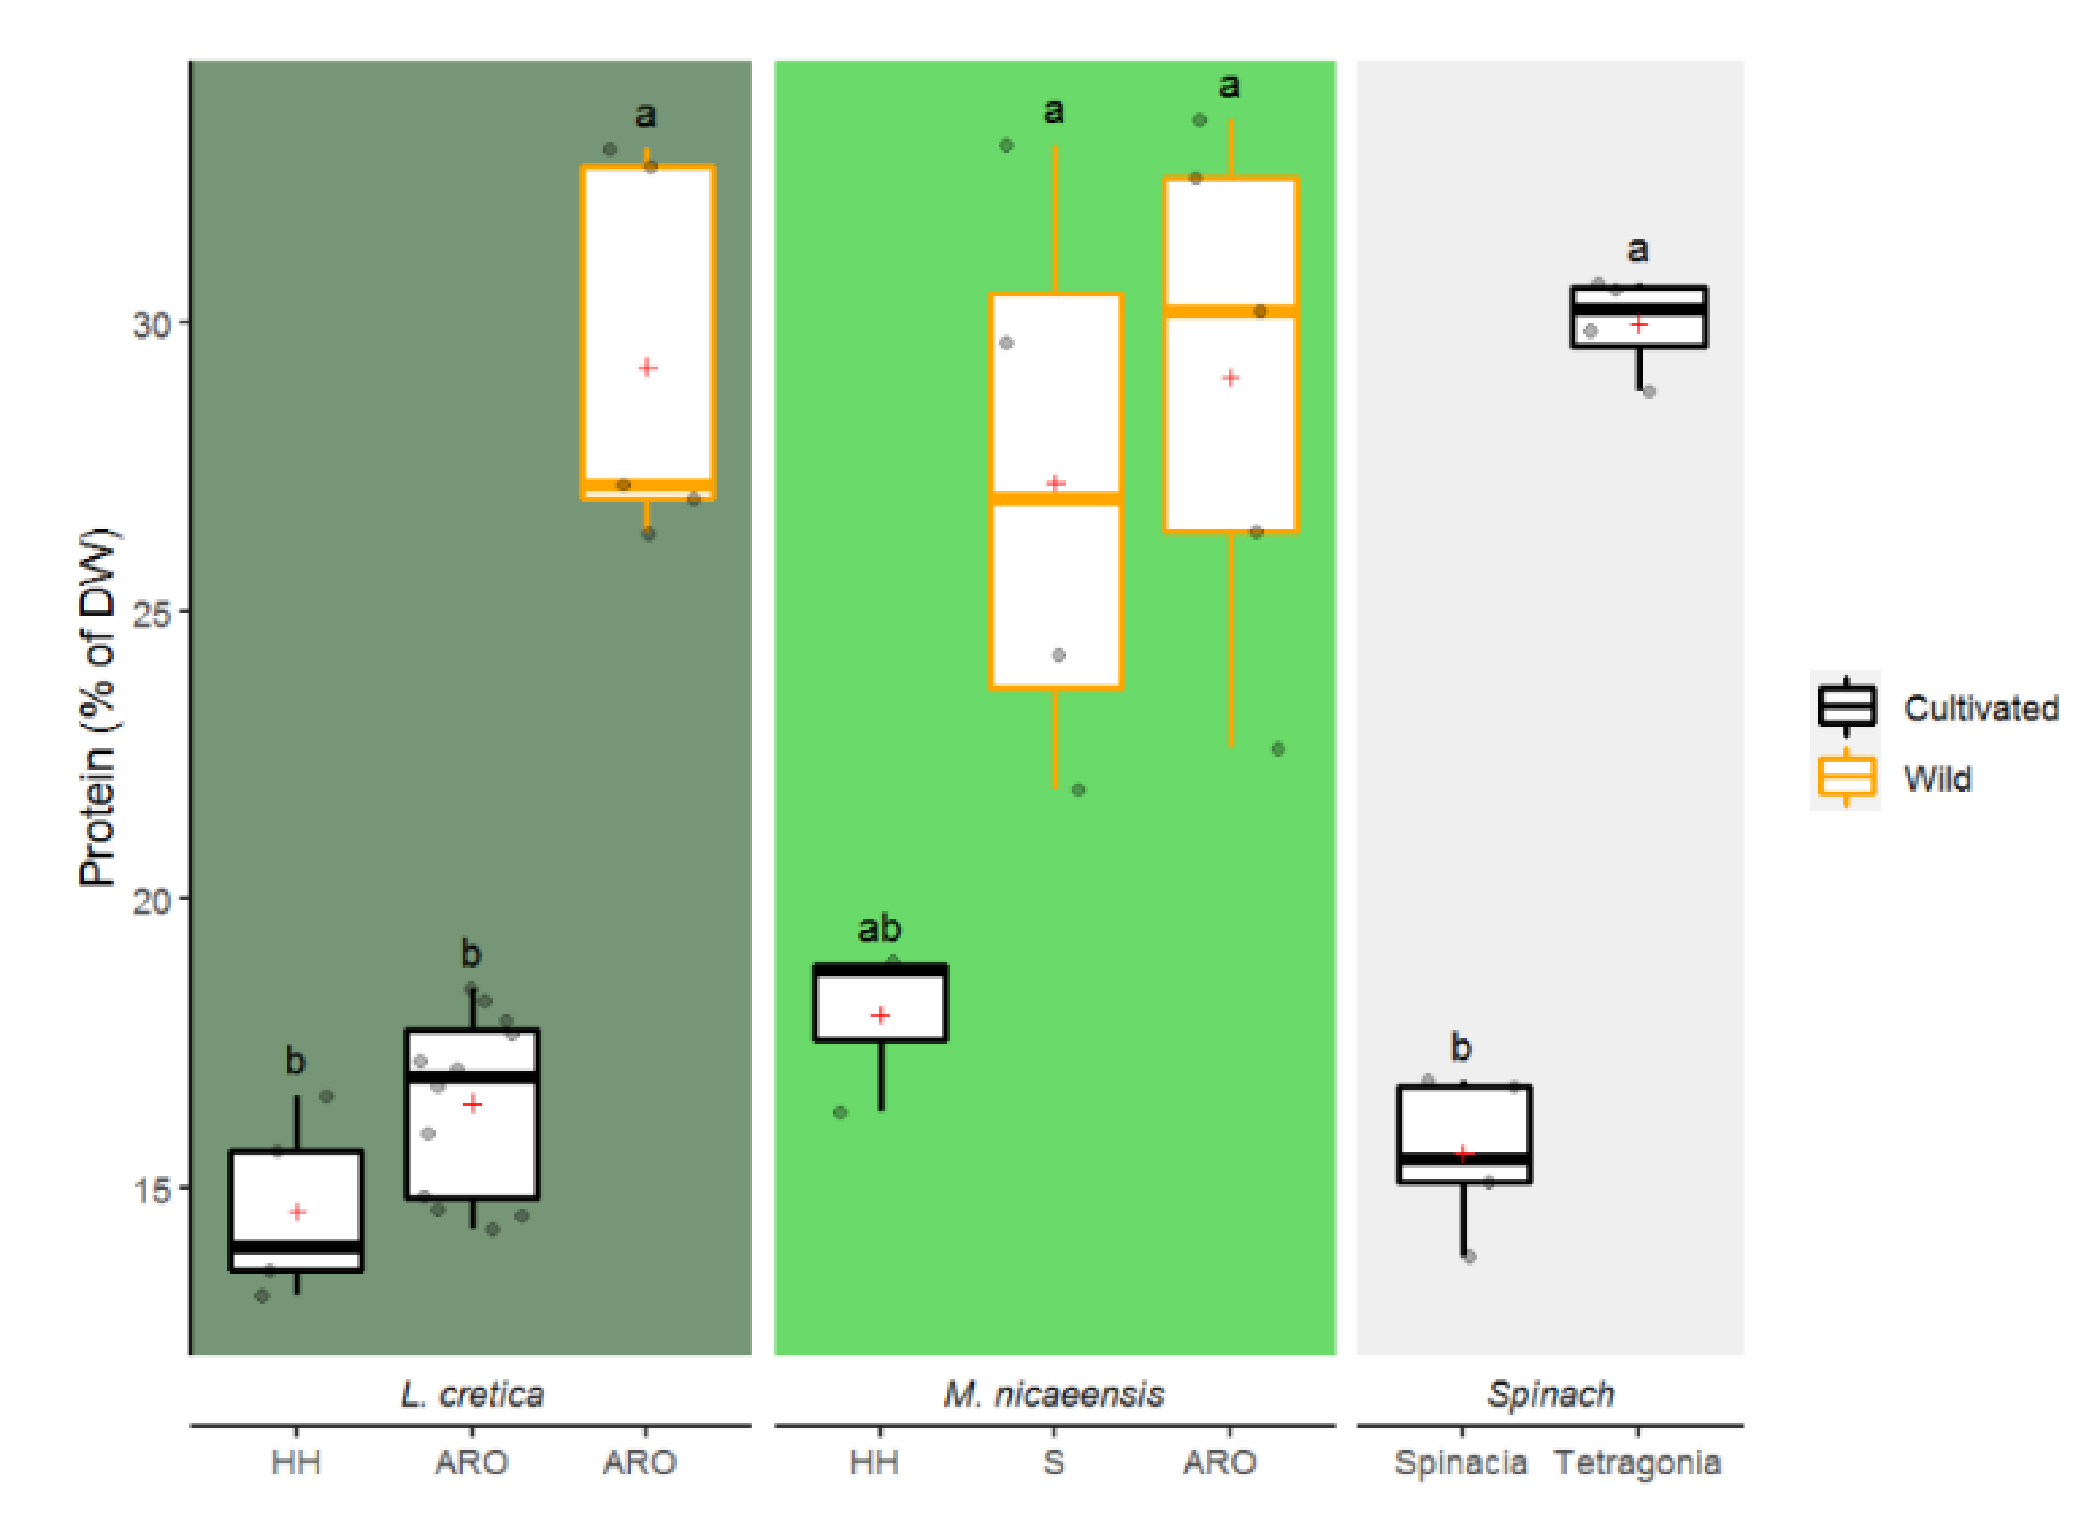
3.1.4. Total Protein

The total protein in the green leaves averaged 21.4 ± 6.9 mg/g DW, equivalent to 106.8 ± 34.3 mg per serving size (Figure 6). Wild L. cretica showed significantly higher (nearly doubled) total protein content in comparison to cultivated L. cretica. T. tetragonioides was significantly richer in protein per DW compared to S. oleracea. However, total protein content in T. tetragonioides was not significantly higher than in the protein-rich populations of L. cretica or M. nicaeensis.

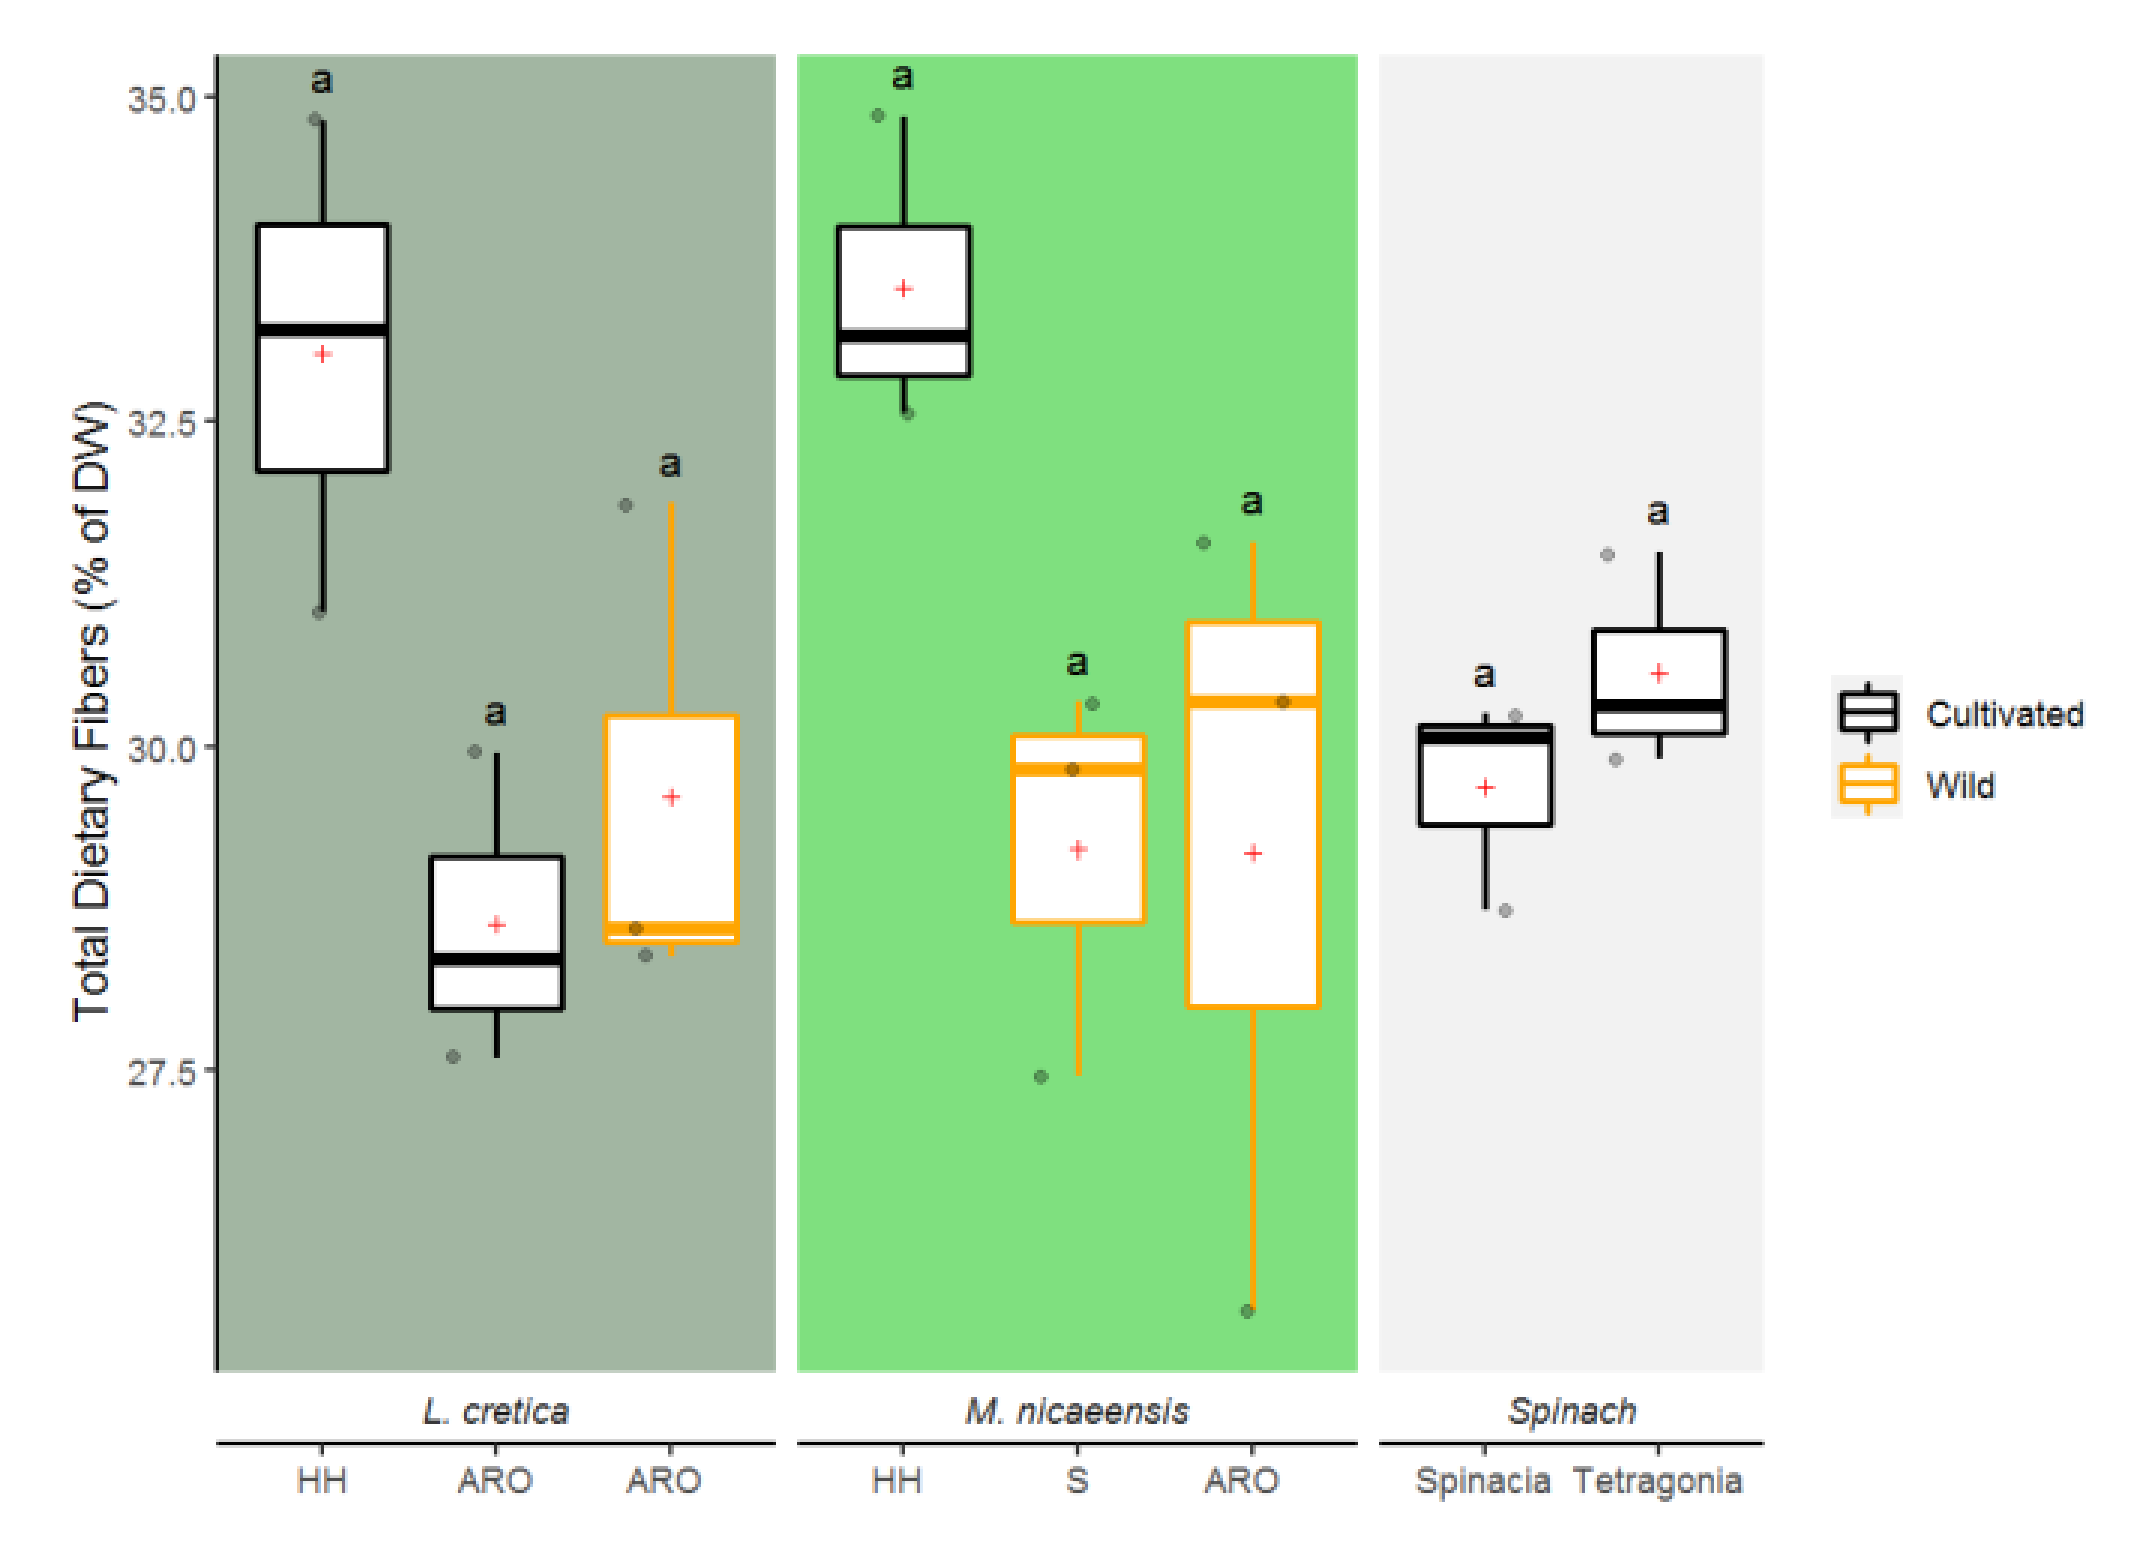
3.1.5. Total Dietary Fibers

Mean dietary fibers comprised 30.4 ± 2.3% DW across all analyzed species and origins (Figure 7). The differences between populations were statistically insignificant, yet the small sample size may underlie this finding (n = 3 per species and origin, see Table 1 and Table 2). The total dietary fiber content was equivalent to 1.5 ± 0.1 g per serving size.

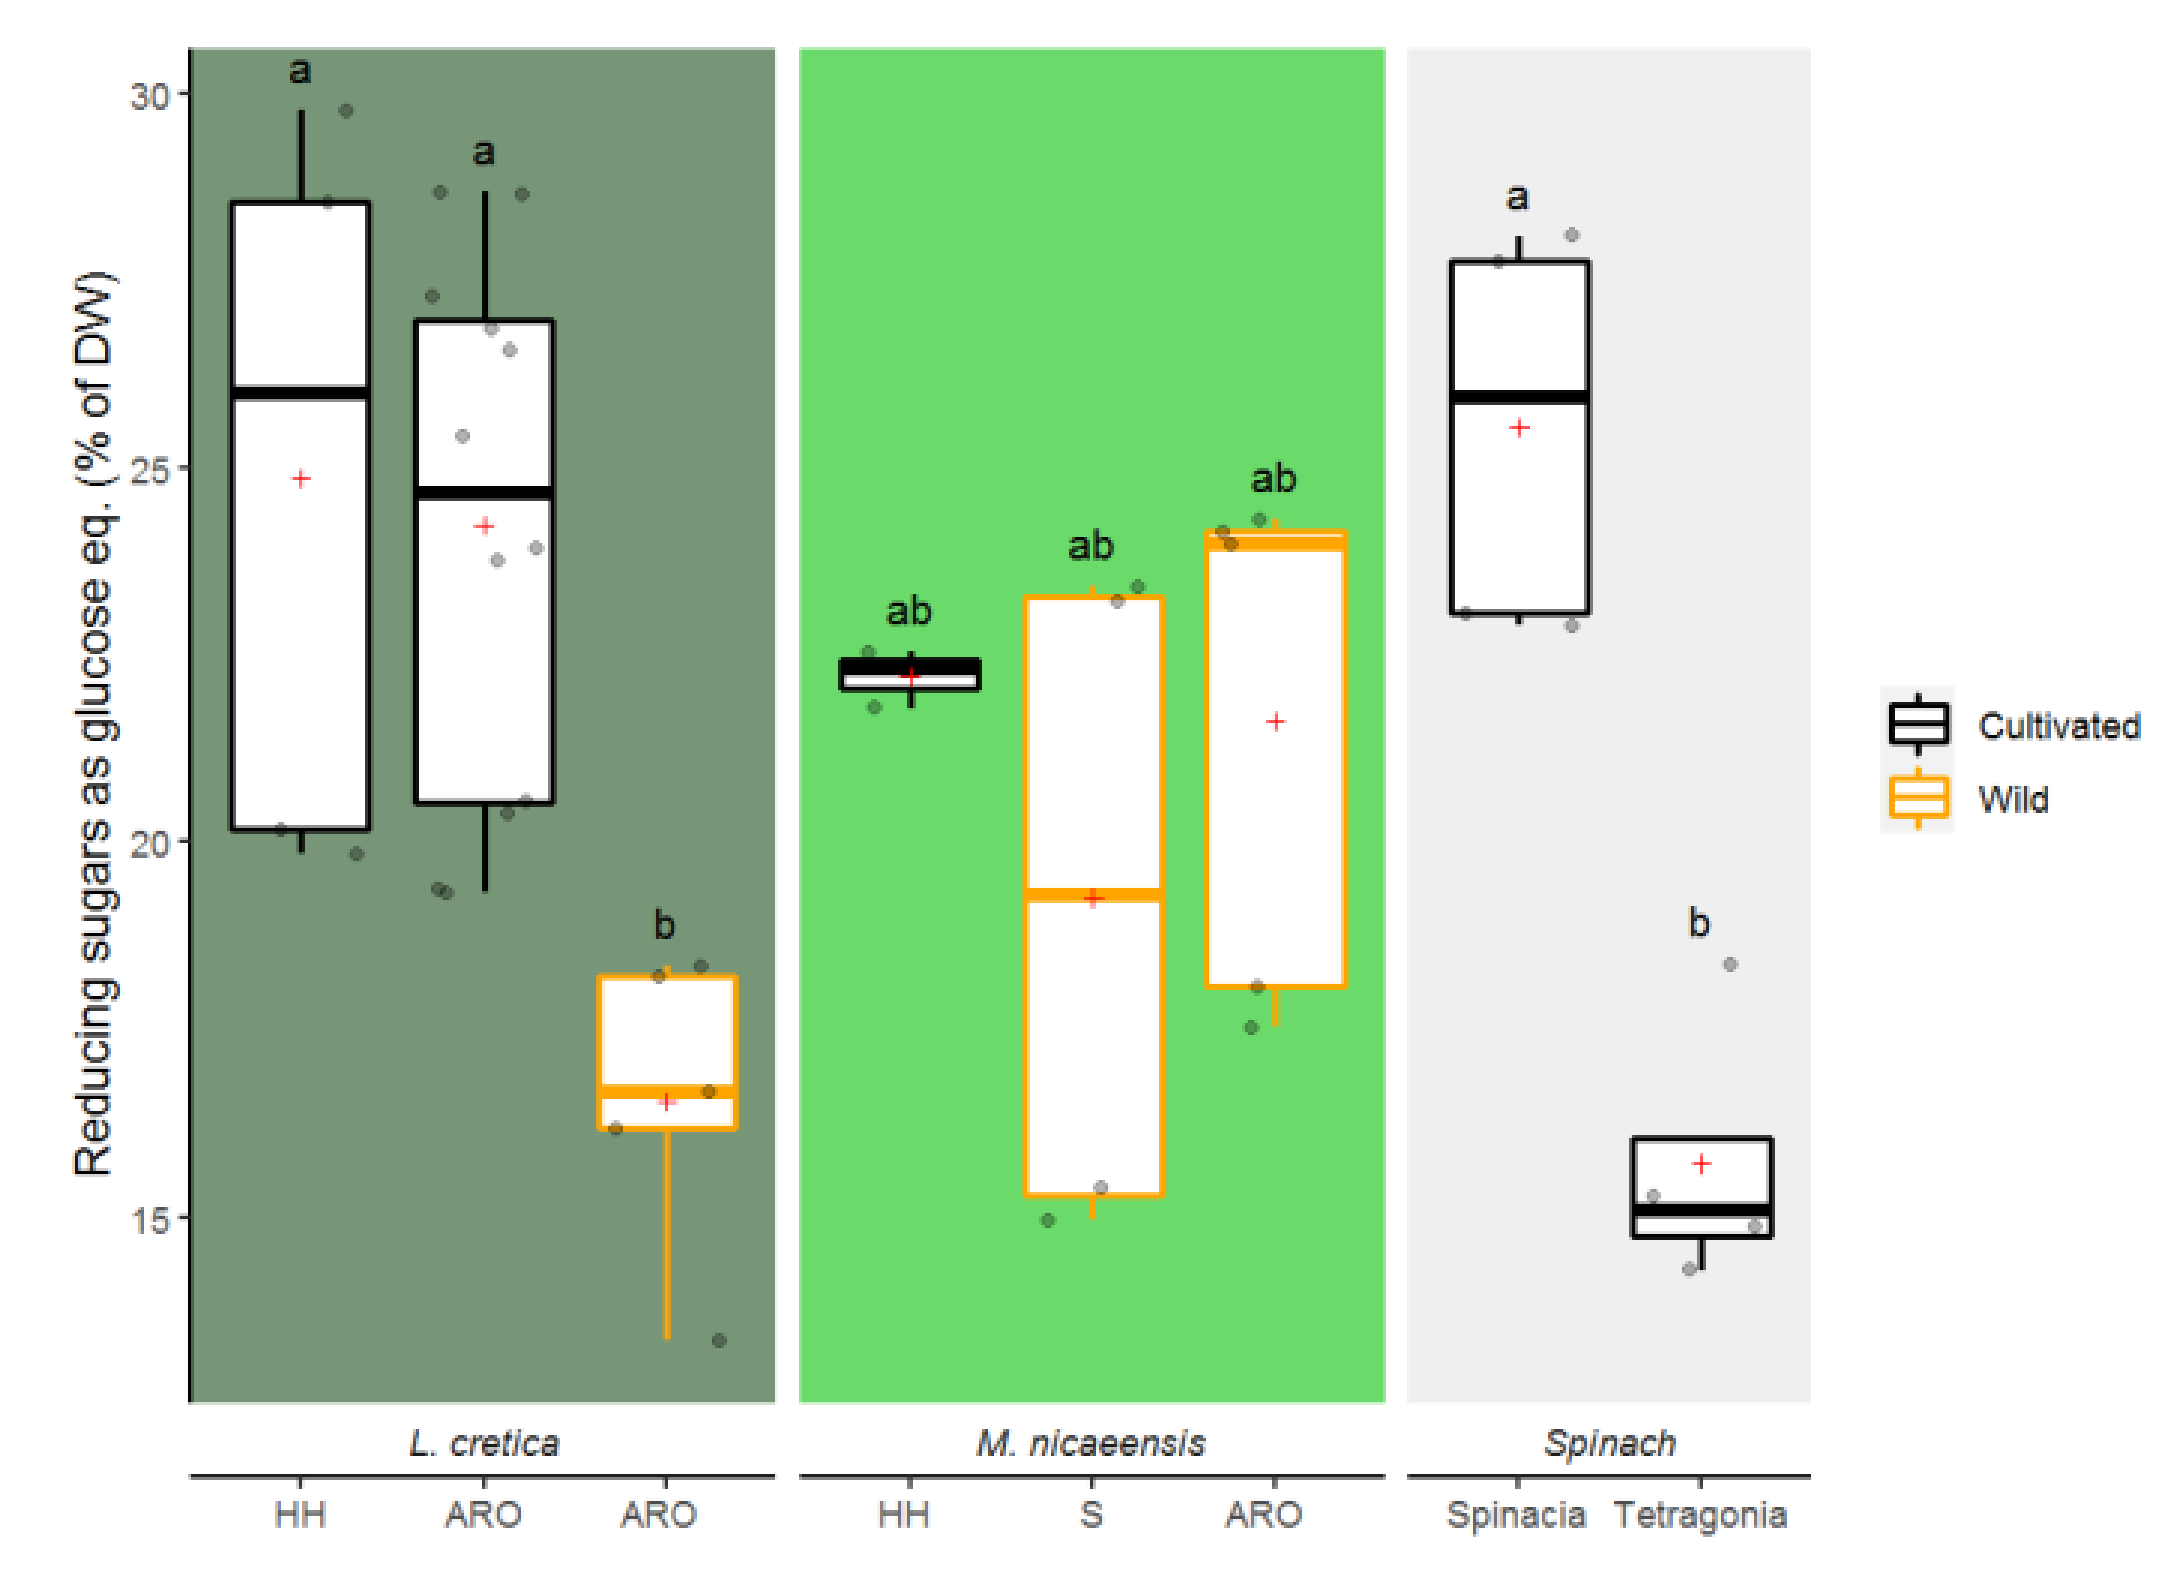
3.1.6. Reducing Sugars

A large variance in reducing sugars content was identified for most of the populations, with the exception of cultivated M. nicaeensis and T. tetragonioides (Figure 8). Wild L. cretica had significantly lower reducing sugars content in comparison to cultivated L. cretica plants. No significant differences were identified across the M. nicaeensis plants.

3.1.7. Elemental Analysis and Non-Nutritive Compounds

We analyzed six macro-elements (K, Mg, Ca, Na, P, and Cl) and seven micro-elements (Al, Se, Fe, B, Cu, Mn, Ba) in the dried leaves of Khubeza and spinach species (Table 1). S. oleracea showed the highest Fe content (170.03 ± 24.77 µmg/g DW), which was significantly higher than that of all the L. cretica populations (97.24 ± 18.20 µg/g DW), and that of two Malva populations from Havat Hanoi and ARO field margins (85.74 ± 4.62 µg/g DW). Interestingly, M. nicaeensis leaves collected at field margins at Sandala, adjacent to S. oleracea and T. tetragonioides, showed higher levels of Fe (146.6 ± 8.03 µmg/g DW) than other Khubeza leaves, and similar to the average Fe content in the spinach plants (145.29 ± 32.15 µg/g DW). The apparent similarity between proximate populations, suggests that the local conditions, edaphic (soil proprieties), climatic (water content, sun radiation) and agronomic (inputs as fertilizers and pest control) may, play an important role Fe accessibility and plant well-being and ultimately—on its nutritional value as food. Ca content in L. cretica leaves was significantly higher in the majority of the L. cretica and M. nicaeensis plants, averaging 19.41 ± 1.87 mg/g DW, in comparison to only 11.34 ± 0.21 mg/g DW in S. oleracea. In accordance with the Fe findings, Ca concentrations in M. nicaeensis leaves from Sandala were not significantly different from the Ca levels in the spinach leaves at Sandala. Na content was significantly higher in the spinach species (46.05 ±2 5.23 mg/g DW) in comparison to the Khubeza leaves (4.78 ± 3.54 mg/g DW). The spinach species seemed to accumulate more Cl as well (14.18 ± 3.78 mg/g DW in average), in comparison to the Malvaceae leaves (5.00 ± 2.54 mg/g DW), but a post-hoc analysis suggested that these differences are not always significant. Mg content in S. oleracea (4.94 ± 0.02 mg/g DW) was significantly higher than in most of the Khubeza leaves (2.63 ± 0.27 mg/g DW). There was no distinct difference in P content between plant species or origin. Similarly, no clear ergonomically meaningful (plant deficiencies and performance) or nutritionally relevant differences in the levels of the remaining micro-elements (Al, Se, B, Cu, Mn, and Ba) were measured. The average NO3 content of all the analyzed green leaves, was 7.9 ± 9.71 mg/g DW (Table 2). Cultivated Khubeza leaves appeared to contain lower levels of NO3 in comparison to leaves collected in wild populations at field margins. The levels of NO3 in the leaves of the cultivated populations were particularly low in the L. cretica and negligible in the Malva. These results suggest the importance of field conditions in general, and specifically, the dependence of the nitrophilic Malvaceae plants on nitrogen supply. Lastly, green leaves of Malvaceae did not contain OA at all, whereas spinach leaves contained an average of 0.5 ± 0.12 mg/g DW.
Table 1. Elemental analysis of macro- and micro-elements in two Malvaceae species and two spinach species. Value per each element is given in the first left column, and the statistical test that we performed at the second column to the left. Different lowercase letters indicate significant differences between populations of green leaves (p < 0.05), comparing all populations per element. Number or samples for statistical replicates is given in parentheses (n = X) for each population. Species names and abbreviation of locations are given in the headline. H. Noi stands for Havat Hanoi, and ARO for research station at the Agricultural Research Organization; Sandala = agricultural area near Sandala village, North Israel. Under the location name we indicate plant origin type—either “cultivated” in an agricultural field, or wildly grown at field (F.) margins.
Species L. cretica
(n = 22)
M. nicaeensis
(n = 12)
S. oleraceaT. tetragonioides
Source ARO Cultivated (n = 12)H. Noi Cultivated (n = 5)ARO
F. Margins (n = 5)
H. Noi Cultivated (n = 3)ARO
F. Margins (n = 5)
Sandala
F. Margins (n = 4)
Sandala Cultivated (n = 5)Sandala Cultivated
(n = 5)
ElementStatistical test mean ± sd/compact letter display of statistical differences
Al
µg/g DW
Kruskal Walis & Duun78.45 ± 14.44
ab
148.9 ± 129.6
ab
147.9 ± 148.24
ab
59.71 ± 4.59
b
47.73 ± 18.60
b
90.3 ± 13.50
ab
145.18 ± 41.87
a
80.03 ± 14.40
ab
Se
µg/g DW
1.21 ± 1.97
abc
0 ± 0
c
0 ± 0
c
3.31 ± 1.65
a
2.98 ± 1.38
abc
2.48 ± 2.86
abc
2.98 ± 2.16
ab
0 ± 0
c
Fe
µg/g DW
100.4 ± 18.83
cd
102.5 ± 21.99
bcd
84.48 ± 3.42
d
89.57 ± 5.26
cd
83.44 ± 2.45
d
146.6 ± 8.03
ab
170.03 ± 24.77
a
120.54 ± 13.46
abc
B
µg/g DW
13.39 ± 5.13
c
17.91 ± 5.41
abc
22.86 ± 2.74
a
14.91 ± 4.33
c
22.84 ± 13.7
c
13.66 ± 2.06
c
23.86 ± 3.44
ab
20.70 ± 5.26
a
Cu
µg/g DW
9.34 ± 1.43
ab
4.97 ± 0.005
b
15.91 ± 8.92
a
6.37 ± 1.67
ab
8.94 ± 1.47
ab
7.46 ± 2.88
ab
6.96 ± 2.72
ab
8.88 ± 1.42
ab
Mn
µg/g DW
48.34 ± 17.49
bc
37.8 ± 5.18
bc
49.67 ± 9.95
abc
29.85 ± 0.10
c
29.80 ± 12.14
c
27.33 ± 2.94
c
64.62 ± 4.68
ab
207.17 ± 25.68
a
Ba
µg/g DW
13.81 ± 2.85
a
12.94 ± 4.15
ab
9.94 ± 2.63
abc
14.92 ± 4.34
ab
3.97 ± 1.48
c
9.93 ± 0.03
abc
4.97 ± 0.004
bc
3.94 ± 1.44
c
K
mg/g DW
16.64 ± 2.07
c
18.47 ± 1.11
bc
24.95 ± 1.34
ab
19.79 ± 1.59
abc
22.37 ± 0.44
ab
24.95 ± 1.49
ab
37.17 ± 0.93
a
20.02 ± 3.92
bc
Mg
mg/g DW
2.46 ± 0.23
abc
2.52 ± 0.12
cd
2.92 ± 0.09
d
2.54 ± 0.15
cd
2.65 ± 0.22
cd
2.96 ± 0.29
abcd
4.94 ± 0.02
a
4.35 ± 0.024
ab
Ca
mg/g DW
18.45 ± 1.90
ab
19.11 ± 1.39
ab
21.881.73a19.74 ± 0.71
ab
20.38 ± 0.35
a
18.15 ± 0.32
abc
11.34 ± 0.21
c
13.23 ± 0.57
bc
Na
mg/g DW
ANOVA & Tukey1.96 ± 0.73
e
7.87 ± 1.39
cd
5.10 ± 1.71
d
12.51 ± 1.38
bc
1.87 ± 0.68
e
6.80 ± 0.51
cd
24.28 ± 7.12
b
67.82 ± 1.40
a
P
mg/g DW
5.06 ± 0.41
b
4.15 ± 0.39
c
6.67 ± 0.09
a
4.83 ± 0.49
bc
6.22 ± 0.10
a
5.21 ± 0.54
b
6.04 ± 0.18
a
4.30 ± 0.38
c
Cl
mg/g DW
7.1 ± 1.42
de
7.10 ± 1.42
bc
6.12 ± 1.98
c
9.9 ± 2.03
ac
2.36 ± 0.77
e
5.37 ± 0.68
cd
16.5 ± 1.28
a
11.86 ± 4.12
ab

4. Discussion

The goal of this study was to examine the agronomic and nutritional potential of M. nicaeensis and L. cretica (Khubeza plants), as novel green edible leaf crops. With the understanding that M. nicaeensis is preferred in the traditional Mediterranean cuisine, while L. cretica has agronomic advantages [15]. Our results showed that open-field growth of Khubeza required adjustments. The dependence of Khubeza on nitrogen supply was prominent, with M. nicaeensis exhibiting a higher dependency than L. cretica.
The dependency of the nitrophilic Malvaceae on nitrogen is evident throughout this research, with plants barely growing in an extensive agro-regime with minimal inputs, while prospering upon sufficient fertigation of liquid nitrogen (Figure 1 and Figure 2). Particularly, mild nitrogen enrichment resulted in the successful growth of M. nicaeensis. Moreover, M. nicaeensis and L. cretica grown wild at field margins of intensive agriculture showed higher nutritional values than plants cultivated in a field with poor inputs, suggesting that plants at field margins were selected for conditions of high nitrogen in the soil. Considering these findings, it is suggested that agronomic adjustments can promote rapid commercialisation of different Malvaceae species as novel crops. Furthermore, as early seasonal and multi-harvested plants [15] with nitrogen catch crop properties [25,27] and suitability for mechanical harvesting, Khubeza poses a unique potential from agricultural and agronomic perspectives.
Comparison of the nutritional composition of the studied leaves revealed no remarkable differences between both species of Malvaceae and two commercial spinach species; the Malvaceae plants showed slight advantages in several parameters. Generally, it is important to note, that the literature is scarce with regard to nutraceuticals and macromolecule composition of the focal species. Moreover, documented data on the general Malvaceae family may vary depending on the specific species, tested part of the plant and agronomic conditions [18,43,44,45]. Values of TPC, ascorbic acid and the subsequent antioxidant capacities were generally higher in Malvaceae than in spinach (Figure 3, Figure 4 and Figure 5). TPC values of M. nicaeensis and L. cretica found in the present work were similar to those documented for M. sylvestris [46] and M. aegyptiaca [43]. Ascorbic acid contents of our samples were slightly higher than those reported for M. sylvestris [18]. The protein content in wild M. nicaeensis and L. cretica leaves (25–30 g/100 g DW) was higher than that of S. oleracea leaves, but similar to that of S. tetragonia (Figure 6). This protein level is remarkably high in comparison to M. sylvestris and M. aegyptiaca (~12 and 8 g/100 g DW) [18,43], and may be the result of overestimation due to excessive levels of non-protein nitrogen in nitrophilic plants [35]. Similar levels of protein were found in several edible leafy green plants such as S. oleracea, Vernonia amygdalina, Solanum Africana, and others [43] (Zouari et al., 2011). No significant differences were found between the studied Malvaceae and spinach species with regard to carbohydrate levels, as measured by the reducing sugar and TDF levels (Figure 7 and Figure 8). The low level of reducing sugars in L. cretica may predict a low glycaemic response [47], a desirable characteristic of food additives for enriched flour products [48]. In comparison to edible leaves of other Malvaceae species, the total carbohydrate levels in our samples (50–60% on DW basis) were lower than those in M. sylvestris and M. aegyptiaca leaves (71–78% on DW basis) [18,43].
Elemental analysis showed that Malvaceae leaves had lower Fe content than spinach, albeit growing Malvaceae in proximity to spinach population resulted in a smaller gap (Table 1). In parallel, the Khubeza leaves showed higher Ca levels, and lower Na and Cl concentrations. The minerals profile of our samples were similar to the profiles of other Malvaceae species [45] (Ozer and Aksoy., 2019). We found that Malvaceae and spinach leaves contained low levels of NO3, but when extensively irrigated and fertilized, the nitrate content climbed substantially, especially in the case of spinach (Table 2). This finding is an additional indication of improved Malvaceae crop yield and nutritional composition upon adjustment of agronomic aspects. OA is considered an absorption inhibitor of calcium [49] and other minerals [50]. Inhibited absorption of iron in the presence of high OA levels has been reported [51], but some argue it is not significant [52]. We did not detect OA in Malvaceae leaves, whereas OA was detected in spinach leaves (Table 2).
Table 2. Non-nutritive compounds in two Malvaceae species and two Spinach species. Value per each element is given in the first left column, and the statistical test performed in the second column to the left. Different lowercase letters indicate significant differences between populations of green leaves (p < 0.05), comparing all populations per element. Number or samples for statistical replicates is given in parentheses (n = X).
Species L. cretica
(n = 22)
M. nicaeensis
(n = 12)
S. oleraceaT. tetragonioides
Source ARO Cultivated (n = 12)H. Noi Cultivated (n = 5)ARO
F. Margins (n = 5)
H. Noi Cultivated (n = 3)ARO
F. Margins (n = 5)
Sandala
F. Margins (n = 4)
Sandala Cultivated (n = 5)Sandala Cultivated
(n = 5)
MoleculeStatistical testmean ± sd
compact letter display of statistical differences
NO3
mg/g DW
Kruskal Walis & Duun0 ± 0
b
0 ± 0
b
8.5 ± 3.74
a
1.2 ± 0.52
ab
3.62 ± 2.18
a
5.88 ± 3.57
a
1.96 ± 1.35
ab
23.2 ± 13.7
a
OA
mg/g DW
0 ± 0
b
0 ± 0
b
0 ± 0
b
0 ± 0
b
0 ± 0
b
0 ± 0
b
0.45 ±0.11
a
0.56 ± 0.11
a

5. Conclusions

The presented findings demonstrated the nutritional advantages of Khubeza leaves as a novel crop, as compared to spinach leaves. Obviously, comparing the nutritional contribution of different food items is not straightforward, as a variety of aspects, including serving size in question, freshness component, plant performance (nutrition, water content, disease) and other factors, must be taken into consideration. Therefore, we prefer to focus on our results with spinach as a reference than to draw comparisons with the literature. Khubeza leaves can be grown in agricultural field and produce edible leaves that are similar to spinach in many agronomic and nutritional aspects, including antioxidative activity, and ascorbic acid, total protein, total dietary fibers, reducing sugars, and microelement contents. Moreover, adjustment of agronomic parameters immediately improved the yield and efficiency of Malvaceae crops, which had never been selected or cultivated before. Taken together, Khubeza leaves show the following advantages: high nutritional value, similar to spinach in all of the studied aspects beside Fe, low levels of OA and NaCl, rapid growth and high yield per area, taking into account mechanical multi-harvest of the entire young leaves and petioles. Thus, to diversify agriculture and food supply in Mediterranean and dryland ecosystems, we propose to further study the use of Khubeza leaves as edible catch-crops.

Supplementary Materials

Figures S1–S8 are available online at https://www.mdpi.com/article/10.3390/agronomy11071294/s1. Figure S1: Sowing experimental plot at the ARO location. Figure S2: Havat Hanoi experimental plot. Figure S3: “Khubeza” plants grown under controlled greenhouse conditions, November 2019. Figure S4: Nitrogen enrichment experiment at the ARO net house location. Figure S5: Fresh “Khubeza” leaf weight after harvest (left) and dried by lyophilizer. Figure S6: “Khubeza” leaf powder and wheat dough. Figure S7: Pasta based on partial replacement of wheat flour with various percentages of “Khubeza” powder. Figure S8: Pasta based on partial replacement of wheat flour with various percentages of “Khubeza” powder.

Author Contributions

Conceptualization, L.B. and O.S.; methodology, all authors; data analysis, A.C. and E.B.-S.; writing—original draft preparation, O.S.; writing—review and editing, L.B. and O.S.; visualization, E.B.-S. and O.S.; supervision, O.S.; project administration, L.B. and O.S.; funding acquisition, L.B. and O.S.; All authors have read and agreed to the published version of the manuscript.

Funding

This research was partially funded by The Plants Production and Marketing Board, Ministry of Agriculture and Rural Development, Israel, grant number 277084020.

Institutional Review Board Statement

Not applicable.

Informed Consent Statement

Not applicable.

Data Availability Statement

Not applicable.

Acknowledgments

The authors acknowledge Havat Hanoi for providing place to grow plants, Asher Bar-Tal for his assistance in analyzing elements, OA, and NO3. Workers and volunteers at the Shelef research team: Kinneret Rozenblat, Guy Shotland, Smadar Wininger, and Zvika Amitai. Technician and students in the Basheer team: Polina Israelson, Tomer Ashkenazi and Nicole Kaufman.

Conflicts of Interest

The authors declare no conflict of interest.

References

  1. Tilman, D.; Cassman, K.G.; Matson, P.A.; Naylor, R.; Polasky, S. Agricultural sustainability and intensive production practices. Nature 2002, 418, 671–677. [Google Scholar] [CrossRef] [PubMed]
  2. Wang, H.L.; Swallow, B.M. Optimizing expenditures for agricultural land conservation: Spatially-explicit estimation of benefits, budgets, costs and targets. Land Use Policy 2016, 59, 272–283. [Google Scholar] [CrossRef]
  3. FAO; IFAD; UNICEF; WFP; WHO. The State of Food Security and Nutrition in the World 2020. Transforming Food Systems for Affordable Healthy Diets; FAO: Rome, Italy, 2020; p. 320. [Google Scholar]
  4. Altieri, M.A. The ecological role of biodiversity in agroecosystems. Agric. Ecosyst. Environ. 1999, 74, 19–31. [Google Scholar] [CrossRef] [Green Version]
  5. Adams, M.W.; Ellingboe, A.H.; Rossman, E.C. Biological uniformity and disease epidemics. BioScience 1971, 21, 1067–1070. [Google Scholar] [CrossRef]
  6. Shukla, P.R.; Skea, J.; Calvo Buendia, E.; Masson-Delmotte, V.; Pörtner, H.-O.; Roberts, D.C.; Zhai, P.; Slade, R.; Connors, S.; van Diemen, R.; et al. IPCC, 2019: Climate Change and Land: An IPCC Special Report on Climate Change, Desertification, Land Degradation, Sustainable Land Management, Food Security, and Greenhouse Gas Fluxes in Terrestrial Ecosystems; IPCC: Geneva, Switzerland, 2019. [Google Scholar]
  7. Peel, M.C.; Finlayson, B.L.; McMahon, T.A. Updated world map of the Koppen-Geiger climate classification. Hydrol. Earth Syst. Sci. 2007, 11, 1633–1644. [Google Scholar] [CrossRef] [Green Version]
  8. Rewald, B.; Eppel, A.; Shelef, O.; Hill, A.; Degu, A.; Friedjung, A.; Rachmilevitch, S. Hot desert environments. In Life at Extremes: Environments, Organisms and Strategies for Survival; Bell, E., Ed.; CABI: Wallingford, UK, 2012; pp. 196–218. [Google Scholar]
  9. Shelef, O.; Guy, O.; Solowey, E.; Kam, M.; Degen, A.A.; Rachmilevitch, S. Domestication of plants for sustainable agriculture in drylands: Experience from the Negev Desert. Arid Land Res. Manag. 2016, 30, 209–228. [Google Scholar] [CrossRef]
  10. Shelef, O.; Fernández-Bayo, J.D.; Sher, Y.; Ancona, V.; Slinn, H.; Achmon, Y. Elucidating Local Food Production to Identify the Principles and Challenges of Sustainable Agriculture. In Sustainable Food Systems from Agriculture to Industry, 1st ed.; Galanakis, C.M., Ed.; Elsevier Inc.: London, UK, 2018; pp. 47–81. [Google Scholar] [CrossRef]
  11. Shelef, O.; Weisberg, P.J.; Provenza, F.D. The Value of Native Plants and Local Production in an Era of Global Agriculture. Front. Plant Sci. 2017, 8. [Google Scholar] [CrossRef] [Green Version]
  12. Davies, W.J.; Zhang, J.; Yang, J.; Dodd, I.C. Novel crop science to improve yield and resource use efficiency in water-limited agriculture. J. Agric. Sci. 2011, 149, 123–131. [Google Scholar] [CrossRef]
  13. Gupta, A.K. Origin of agriculture and domestication of plants and animals linked to early Holocene climate amelioration. Curr. Sci. 2004, 87, 54–59. [Google Scholar]
  14. Mayer-Chissick, U.; Lev, E. Wild edible plants in Israel tradition versus cultivation. In Medicinal and Aromatic Plants of the Middle-East; Yaniv, Z., Dudai, N., Eds.; Springer: Dordrecht, The Netherlands, 2014; pp. 9–26. [Google Scholar]
  15. Ben-Simchon, E.; Sapir, E.; Vaknin, Y.; Shelef, O. Malvaceae spp. leaves as a novel crop for food. Int. J. Agric. For. Life Sci. 2019, 3, 279–286. [Google Scholar]
  16. Feinbrun-Dothan, N.A.; Danin, A. Analytical Flora of Eretz-Israel; Plitmann, U., Ed.; CANA Publishing House Ltd.: Jerusalem, Israel, 1998; p. 1008. [Google Scholar]
  17. Shehata, H.S.; Galal, T.M. Factors affecting the distribution and associated species of Malva parviflora in the Nile Delta, Egypt. Weed Biol. Manag. 2015, 15, 42–52. [Google Scholar] [CrossRef]
  18. Barros, L.; Carvalho, A.M.; Ferreira, I.C.F.R. Leaves, flowers, immature fruits and leafy flowered stems of Malva sylvestris: A comparative study of the nutraceutical potential and composition. Food Chem. Toxicol. 2010, 48, 1466–1472. [Google Scholar] [CrossRef]
  19. Guarrera, P.M. Food medicine and minor nourishment in the folk traditions of Central Italy (Marche, Abruzzo and Latium). Fitoterapia 2003, 74, 515–544. [Google Scholar] [CrossRef]
  20. Cooper, M.R.; Johnson, A.W. Poisonous Plants in Britain and Their Effects on Animals and Man; HM Stationery Office: London, UK, 1984. [Google Scholar]
  21. Koller, D.; Levitan, I. Diurnal Phototropism in Leaves of Lavatera-Cretica L under Conditions of Simulated Solar-Tracking. J. Exp. Botany 1989, 40, 1059–1064. [Google Scholar] [CrossRef]
  22. Ray, M.F. New combinations in Malva (Malvaceae: Malveae). Novon 1998, 8, 288–295. [Google Scholar] [CrossRef]
  23. Moreau, D.; Milard, G.; Munier-Jolain, N. A plant nitrophily index based on plant leaf area response to soil nitrogen availability. Agron. Sustain. Dev. 2013, 33, 809–815. [Google Scholar] [CrossRef]
  24. Santamaria, P. Nitrate in vegetables: Toxicity, content, intake and EC regulation. J. Sci. Food Agr. 2006, 86, 10–17. [Google Scholar] [CrossRef]
  25. Constantin, J.; Mary, B.; Laurent, F.; Aubrion, G.; Fontaine, A.; Kerveillant, P.; Beaudoin, N. Effects of catch crops, no till and reduced nitrogen fertilization on nitrogen leaching and balance in three long-term experiments. Agric. Ecosyst. Environ. 2010, 135, 268–278. [Google Scholar] [CrossRef]
  26. Meisinger, J.J.; Delgado, J.A. Principles for managing nitrogen leaching. J. Soil Water Conserv. 2002, 57, 485–498. [Google Scholar]
  27. Vinograd, A.; Zaady, E.; Kigel, J. Abandoned corrals: Colonization and vegetation recovery of ephemeral habitats in silvo-pastoral systems. J. Plant Ecol. 2020, 13, 722–731. [Google Scholar] [CrossRef]
  28. Chauhan, B.S.; Gill, G.; Preston, C. Factors affecting seed germination of little mallow (Malva parviflora) in southern Australia. Weed Sci. 2006, 54, 1045–1050. [Google Scholar] [CrossRef]
  29. Faulkner, G.P.; Pourshahidi, L.K.; Wallace, J.M.W.; Kerr, M.A.; McCrorie, T.A.; Livingstone, M.B.E. Serving size guidance for consumers: Is it effective? Proc. Nutr. Soc. 2012, 71, 610–621. [Google Scholar] [CrossRef] [Green Version]
  30. Singleton, V.L. Citation Classic-Colorimetry of Total Phenolics with Phosphomolybdic-Phosphotungstic Acid Reagents. Cc/Agr. Biol. Environ. 1985, 48, 18. [Google Scholar]
  31. Benzie, I.F.F.; Strain, J.J. The ferric reducing ability of plasma (FRAP) as a measure of “antioxidant power”: The FRAP assay. Anal. Biochem. 1996, 239, 70–76. [Google Scholar] [CrossRef] [PubMed] [Green Version]
  32. Nobrega, J.A.; Lopes, G.S. Flow-injection spectrophotometric determination of ascorbic acid in pharmaceutical products with the Prussian Blue reaction. Talanta 1996, 43, 971–976. [Google Scholar] [CrossRef]
  33. Matei, N.; Dobrinas, S.; Radu, G.L. Spectrophotometric determination of ascorbic acid in grapes with the Prussian Blue reaction. An. Univ. Ovidius Constanta-Ser. Chim. 2012, 2, 23. [Google Scholar] [CrossRef]
  34. Kjeldahl, J.G.C.T. New method for the determination of nitrogen in organic bodies. J. Anal. Chem. 1883, 22, 366–382. [Google Scholar]
  35. Mariotti, F.; Tome, D.; Mirand, P.P. Converting nitrogen into Protein-Beyond 6.25 and Jones’ factors. Crit. Rev. Food Sci. Nutr. 2008, 48, 177–184. [Google Scholar] [CrossRef]
  36. Lindsay, H. A colorimetric estimation of reducing sugars in potatoes with 3, 5-dinitrosalicylic acid. Potato Res. 1973, 16, 176–179. [Google Scholar] [CrossRef]
  37. Chua, M.; Chan, K.; Hocking, T.J.; Williams, P.A.; Perry, C.J.; Baldwin, T.C. Methodologies for the extraction and analysis of konjac glucomannan from corms of Amorphophallus konjac K. Koch. Carbohyd. Polym. 2012, 87, 2202–2210. [Google Scholar] [CrossRef]
  38. Team, R.C. R: A Language and Environment for Statistical Computing; R Foundation for Statistical Computing: Vienna, Austria, 2020. [Google Scholar]
  39. Bates, D.; Machler, M.; Bolker, B.M.; Walker, S.C. Fitting Linear Mixed-Effects Models Using lme4. J. Stat. Softw. 2015, 67, 1–48. [Google Scholar] [CrossRef]
  40. Hothorn, T.; Bretz, F.; Westfall, P. Simultaneous inference in general parametric models. Biometrical. J. 2008, 50, 346–363. [Google Scholar] [CrossRef] [Green Version]
  41. Kassambara, A. ggpubr: ‘ggplot2’based Publication Ready Plots; R Package Version 0.4.0; R Foundation for Statistical Computing: Vienna, Austria, 2020. [Google Scholar]
  42. Ogle, D.H.; Wheeler, P.; Dinno, A. FSA: Fisheries Stock Analysis; R Package Version 0.8.32; R Foundation for Statistical Computing: Vienna, Austria, 2021. [Google Scholar]
  43. Zouari, N.; Fakhfakh, N.; Zouari, S.; Sellami, M.; Abid, M.; Ayadi, M.A.; Zaidi, S.; Neffati, M. Volatile and lipid analyses by gas chromatography/mass spectrometry and nutraceutical potential of edible wild Malva aegyptiaca L.(Malvaceae). Int. J. Food Sci. Nutr. 2011, 62, 600–608. [Google Scholar] [CrossRef]
  44. Khan, H.; Jan, S.A.; Javed, M.; Shaheen, R.; Khan, Z.; Ahmad, A.; Zaman Safi, S.; Imran, M. Nutritional composition, antioxidant and antimicrobial activities of selected wild edible plants. J. Food Biochem. 2016, 40, 61–70. [Google Scholar] [CrossRef]
  45. Mehtap, Ö.Z.E.R.; Aksoy, M. Mineral composition and nutritional properties of Malva neglecta and Malvella sherardiana consumed as vegetable in Central Black Sea Region of Turkey. Turk. J. Food Agric. Sci. 2019, 1, 18–23. [Google Scholar]
  46. Conforti, F.; Sosa, S.; Marrelli, M.; Menichini, F.; Statti, G.A.; Uzunov, D.; Tubaro, A.; Menichini, F.; Della Loggia, R. In vivo anti-inflammatory and in vitro antioxidant activities of Mediterranean dietary plants. J. Ethnopharmacol. 2008, 116, 144–151. [Google Scholar] [CrossRef]
  47. Brennan, C.S. Dietary fibre, glycaemic response, and diabetes. Mol. Nutr. Food Res. 2005, 49, 560–570. [Google Scholar] [CrossRef]
  48. Fardet, A.; Leenhardt, F.; Lioger, D.; Scalbert, A.; Rémésy, C. Parameters controlling the glycaemic response to breads. Nutr. Res. Rev. 2006, 19, 18–25. [Google Scholar] [CrossRef]
  49. Heaney, R.P.; Weaver, C.M. Oxalate-Effect on Calcium Absorbability. Am. J. Clin. Nutr. 1989, 50, 830–832. [Google Scholar] [CrossRef]
  50. Kelsay, J.L.; Prather, E.S. Mineral balances of human subjects consuming spinach in a low-fiber diet and in a diet containing fruits and vegetables. Am. J. Clin. Nutr. 1983, 38, 12–19. [Google Scholar] [CrossRef]
  51. Noonan, S.C.; Savage, G.P. Oxalate content of foods and its effect on humans. Asia Pac. J. Clin. Nutr. 1999, 8, 64–74. [Google Scholar] [PubMed]
  52. Bonsmann, S.S.; Walczyk, T.; Renggli, S.; Hurrell, R.F. Oxalic acid does not influence nonhaem iron absorption in humans: A comparison of kale and spinach meals. Eur. J. Clin. Nutr. 2008, 62, 336–341. [Google Scholar] [CrossRef]
Figure 1. Development of L. cretica and M. nicaeensis in experimental open field (2019–2020). (a) Plant height 64 days and 121 days after sowing; (b) Leaf FW per plant 121 days after sowing. Each dot represents an individual plant; dots are distributed horizontally for visual clarity. *** and **** indicates p-value ≤ 0.001 and p-value ≤ 0.0001, respectively.
Agronomy 11 01294 g001
Figure 2. Development of L. cretica and M. nicaeensis in nitrogen (N) enrichment net house experiment (2020–2021). High and low indicates fertigation with 180 ppm and 120 ppm, respectively. Each dot represents an individual plant; dots are distributed horizontally for visual clarity. Median is indicated as a horizontal line within the box plot. (a) Plant height after 50 days; (b) Leaf FW per m2 after 77 days. ns stands for Not Statistically Significant.
Agronomy 11 01294 g002
Figure 3. Total phenolic content (TPC) of leaves of two Malvaceae species and two spinach species. Different lowercase letters indicate significant differences between types of green leaves (p < 0.05). Species names and abbreviations of locations are given in the lower line. HH = Havat Hanoi, ARO = research site at the Agricultural Research Organization; S = agricultural area near Sandala village, North Israel. Box plot color indicates “Cultivated” in an agricultural field, or “Wild”, grown wildly at field margins or feral fields. Median and average are indicated as a horizontal line within the box plot and red cross, respectively, and gray dots denote results of single analyses.
Agronomy 11 01294 g003
Figure 4. Antioxidative activity in leaves of two Malvaceae species and two spinach species. Different lowercase letters indicate significant differences between types of green leaves (p < 0.05). Species names and abbreviations of locations are indicated in the lower line. HH = Havat Hanoi, ARO = research site at the Agricultural Research Organization; S = agricultural area near Sandala village, North Israel. Box plot color indicates “Cultivated” in an agricultural field, or “Wild”, grown wildly at field margins or in feral fields. Median and average are indicated as a horizontal line within the box plot and red cross, respectively, and gray dots denote results of single analyses.
Agronomy 11 01294 g004
Figure 5. Ascorbic acid in leaves of two Malvaceae species and two spinach species. Different lowercase letters indicate significant differences between populations of green leaves (p < 0.05). Species names and abbreviations of locations are given in the lower line. HH = Havat Hanoi, ARO = research site at the Agricultural Research Organization; S = agricultural area near Sandala village, North Israel. Box plot color indicates “Cultivated” in an agricultural field, or “Wild”, grown wildly at field margins or feral fields. Median and average are indicated as a horizontal line within the box plot and red cross respectively, and gray dots denote results of single analyses.
Agronomy 11 01294 g005
Figure 6. Total protein in leaves of two Malvaceae species and two spinach species. Different lowercase letters indicate significant differences between populations of green leaves (p < 0.05). Species names and abbreviations of locations are given in the lower line. HH = Havat Hanoi, ARO = research site at the Agricultural Research Organization; S = agricultural area near Sandala village, North Israel. Box plot color indicates “Cultivated” in an agricultural field, or “Wild”, grown wildly at field margins or feral fields. Median and average are indicated as a horizontal line within the box plot and red cross respectively, and gray dots denote results of single analyses.
Agronomy 11 01294 g006
Figure 7. Total dietary fiber content in leaves of two Malvaceae species and two spinach species. Different lowercase letters indicate significant differences between populations of green leaves (p < 0.05). Species names and abbreviations of locations are given in the lower line. HH = Havat Hanoi, ARO = research site at the Agricultural Research Organization; S = agricultural area near Sandala village, North Israel. Box plot color indicates “Cultivated” in an agricultural field, or “Wild”, grown wildly at field margins or feral fields. Median and average are indicated as a horizontal line within the box plot and red cross respectively, and gray dots denote results of single analyses.
Agronomy 11 01294 g007
Figure 8. Reducing sugar content in leaves of two Malvaceae species and two spinach species. Different lowercase letters indicate significant differences between populations of green leaves (p < 0.05). Species names and abbreviations of locations are given in the lower line. HH = Havat Hanoi, ARO = research site at the Agricultural Research Organization; S = agricultural area near Sandala village, North Israel. Box plot color indicates “Cultivated” in an agricultural field, or “Wild”, grown wildly at field margins or feral fields. Median and average are indicated as a horizontal line within the box plot and red cross, respectively, and gray dots denote results of single analyses.
Agronomy 11 01294 g008
Publisher’s Note: MDPI stays neutral with regard to jurisdictional claims in published maps and institutional affiliations.

