Article

Earthworm Abundance Changes Depending on Soil Management Practices in Slovenian Vineyards

1
University Centre of Viticulture and Enology Meranovo, Faculty of Agriculture and Life Sciences, University of Maribor, Pivola 10, 2311 Hoče, Slovenia
2
Departamento de Análisis Geográfico Regional y Geografía Física, Facultad de Filosofía y Letras, Campus Universitario de Cartuja, University of Granada, 18071 Granada, Spain
3
Department of Physical Geography, University of Trier, 54296 Trier, Germany
*
Author to whom correspondence should be addressed.
Agronomy 2021, 11(6), 1241; https://doi.org/10.3390/agronomy11061241
Submission received: 25 May 2021 / Revised: 16 June 2021 / Accepted: 17 June 2021 / Published: 19 June 2021

Abstract

:
Earthworms are key indicators of soil quality and health in vineyards, but research that considers different soil management systems, especially in Slovenian viticultural areas is scarce. In this investigation, the impact of different soil management practices such as permanent green cover, the use of herbicides in row and inter-row areas, use of straw mulch, and shallow soil tillage compared to meadow control for earthworm abundance, were assessed. The biomass and abundance of earthworms (m2) and distribution in various soil layers were quantified for three years. Monitoring and a survey covering 22 May 2014 to 5 October 2016 in seven different sampling dates, along with a soil profile at the depth from 0 to 60 cm, were carried out. Our results showed that the lowest mean abundance and biomass of earthworms in all sampling periods were registered along the herbicide strip (within the rows). The highest abundance was found in the straw mulch and permanent green cover treatments (higher than in the control). On the plots where the herbicide was applied to the complete inter-row area, the abundance of the earthworm community decreased from the beginning to the end of the monitoring period. In contrast, shallow tillage showed a similar trend of declining earthworm abundance, which could indicate a deterioration of soil biodiversity conditions. We concluded that different soil management practices greatly affect the soil’s environmental conditions (temperature and humidity), especially in the upper soil layer (up to 15 cm deep), which affects the abundance of the earthworm community. Our results demonstrated that these practices need to be adapted to the climate and weather conditions, and also to human impacts.

1. Introduction

In sloping vineyards, sustainable inter-row soil management practice is key to improve water retention capacity and control of sediment mobilisation [1,2]. The negative consequences of an inadequate soil supply, according to the climatic conditions, are reflected in increased soil erosion rates [3,4], a loss of water and nutrients, greenhouse gas emissions [5] and depletion of soil quality with regard to acidification, salinization, pollution [6] and poor soil structure [7]. The impact of soil management practices on soil biodiversity is focused on specific key indicators such as insects or micro-organisms [8,9]. For example, the presence of earthworms is a clear indicator of the soil’s biodiversity status and affects soil quality and productivity [10].
It is well known that earthworms respond differently to diverse soil management practices because they are among the largest soil organisms that are sensitive to the mechanical impacts of tillage [11,12]. When they are widely distributed on a plantation, they are useful bioindicators for sustainable land use [13,14,15]. The population size in the soil can be assessed to understand the positive or negative impacts of different soil management practices (inter and within-row) on the physical and biological properties of soil in vineyards [16]. Earthworms in the soil also have a positively recognised impact on increasing nutrient and water availability, increasing macroaggregate stabilisation [17,18,19], organic matter degradation and water infiltration through biopores [20]. All of these advantages directly affect soil erosion rates [21] and stimulate microorganisms that form important microbiological products for plants [22]. Earthworm activity is mainly related to soil moisture, the content of organic matter and calcium in the soil [23,24]. Moreover, the addition of organic matter in the vineyard can increase the abundance of endogenous earthworms [25]
It is worth highlighting the elevated number of different environmental conditions and diverse soil management practices carried out in vineyards, i.e., permanent or occasional green covering of soil, mulching (covering with various organic substances), tillage, weed control with herbicides, especially within the row (vine-strip), and combinations of these. Moreover, soil greening in perennial plantations can improve earthworm species diversity and abundance, because plant residues of turfgrass (including roots) are important sources of food for earthworms [24] and show the least negative impact on the earthworm population [16]. In addition, straw mulch generates ideal conditions for self-regulation of soil temperature and humidity, which directly affects earthworms [26,27]. However, herbicides (especially within the row) are used in perennial plantations to control weeds. Their negative effects are reflected in the formation of a less favourable habitat for earthworms as a result of the absence of vegetation cover [28].
The testing of individual soil management practices and their impact on earthworms are common. Faber [11] tested different tillage tools and found no differences in the earthworm population. The lowest impact of tillage was registered when it was tilled in spring during the dry period. In addition to soil tillage, other practices, such as the use of copper [28], can reduce the earthworm population in orchards, which can further reduce soil quality. From an environmental point of view, green cover is more suitable in vineyards than the use of pesticides [16], but only in regions with enough precipitation to avoid exigent water competition and stresses. This needs to be considered seriously. In our research, different soil management practices in the same pedoclimatic conditions were considered, primarily to obtain more objective estimates of the differences between them. These included the most commonly treated soil tillage, short-term use of herbicides (three seasons), permanent green cover, the long-term use of herbicides (over 20 years) and covering the soil with straw (at the start of the experiment).
In Slovenia, more than two-thirds of vineyards are on hill slopes from 10 to 50%, and less than one third are planted on terraces. Permanent green cover is used in most vineyards to reduce soil erosion, and in the part of the country characterised by a continental climate, it represents more than 95% of soil management in vineyards. In the Mediterranean part, about 45% of the vineyards are located in the Karst area, and up to 86% are along the border with the Italian Collio (Ministry of Agriculture, Forestry and Food, Slovenia). Climate change could be affecting this wine-growing area, and the competition for water between vines and green cover plants [3]. Therefore, it is necessary to adopt a correct soil management system to ensure vine productivity and wine quality with the least environmental impact.
Therefore, the main goal of our research was to demonstrate how different soil management practices in steep-slope vineyards impacts earthworm biomass, abundance, their distribution according to soil layers, while considering soil water content and soil temperature. We hypothesize that treatments where the soil is less exposed to solar radiation (i.e., green cover and mulch) would have a more positive impact on earthworm development. Detailed knowledge of this impact would help in the adoption of sustainable soil management practices in vineyards to be adapted, as much as possible, to the climatic and soil conditions of each wine-growing area and biodiversity conditions.

2. Material and Methods

2.1. Study Site

This research was conducted in the University Centre (UC) of Viticulture and Enology Meranovo, and the Faculty of Agriculture and Life Sciences, University Maribor, Slovenia, in an experimental active vineyard (Cerkvenjak, 46°57′82.8″ N; 15°94′99.0″ E, 245 m a.s.l.). The study area is a steep-slope vineyard with a 17% inclination and an exposure to the SE, and was established in 1996 with different white grape varieties according to the traditional Slovenian cultivation system (inter-row: 2.5 m; per vine plant: 1 m). The vineyard was cultivated according to the viticultural practice of integrated production with an inter-row permanent green soil cover and the use of herbicides within the row (vine-strip). The study was conducted from April 2014 to October 2016. The average amount of precipitation (1 April to 31 October) was 841 mm in 2014, 723 mm in 2015, and 563 mm in 2016 (the long-term average from 1980–2019 was 712 mm). The average temperatures were 15.9 °C (2014), 16.6 °C (2015) and 16.3 °C (2016), and the values of the Huglin index in these years were 1736, 2057, and 2017 °C units, which are near the average for the last 10 years (16.45 °C and 19.81 °C units, respectively), except in 2014 (Meteorological station Maribor, Slovenian Environmental Agency).
The soils are medium deep loams with a pH of about 5.4 (0.1 mol/L KCl). Based on the ammonium lactate extraction procedure, an average sample of soils contains 2.4 mg soluble-P2O5-P, 21.7 mg soluble-K2O-K, 21 mg soluble-MgO-Mg per 100 g, and 2.8% of organic matter of air-dried soil (0–30 cm). These soil characteristics were obtained before starting the trial in April 2014. Fertilizers were not applied during the experimental period.

2.2. Experiment Set Up

In 2014, four 42 m long and 2.5 m wide experimental plots (replicates) were randomly arranged and tested with five different soil management practices: (i) herbicide; applied glyphosate throughout the inter-row area, 1.5 L/ha, every year in early May and late June; (ii) mulched soils with 1.2 kg of straw/m2 in the first year of trial (2014) before the bud burst of the grapevine, and in the following years (2015, 2016) with 0.5 kg/m2; (iii) tillage; inter-rows were cultivated in early April and late June to a depth of 15 cm; (iv) natural permanent green cover; mowing green cover plants with a mulcher used five times in one season; and, (v) herbicide strips; applied herbicide in the same way as in the first above-mentioned treatment, but only within the row (vine-strip). All treatments were compared to a control plot (perennial meadow 15 m from the vineyard, which was mowed twice a year). Each of five soil management practices were randomly assigned to each plot (6 m long and 2.5 m wide). Between the treatments, 6 m long non treated areas were left to avoid any effect (Figure 1).

2.3. Sampling and Measurements

Sampling campaigns were conducted for three years (2014–2016), monitoring the abundance of earthworms (belonging to the Lumbricidae family) along with the soil profile at a depth from 0 to 60 cm. At each sampling date, (22 May 2014, 9 August 2014, 13 October 2014, 13 June 2015, 17 May 2016, 15 June 2016 and 5 October 2016) pedological pits (0.5 × 0.5 m2, depth 0.6 m) were excavated in each treatment in four replicates. Each soil layer (0 to 15 cm 15 to 30 cm, 30 to 45 cm and 45 to 60 cm) was separated into four foils, and the weight and number of earthworms (juvenile and adult), and their density in various layers per m2 were monitored. Manual sampling of earthworms from well-defined depths to a depth of 0.6 m is considered a sufficiently accurate method to estimate the size of earthworm populations [29]. The earthworms were classified by size into three categories: (i) small (up to 3 cm), (ii) medium (3 to 6 cm) and (iii) large (over 6 cm). At each depth, the soil temperature was measured with a laser thermometer (IRT 39650-20, Cole-Parmer Instrument Co., Illinois, USA), and soil samples were taken to determine the gravimetric water content after drying for 48 h at 105 °C [30].

2.4. Statistical Analysis

Before the analysis of variance, all parameters were tested for normality and variance homogeneity using the Levene test. For each sampling term, and between sampling terms and soil depths, one-way ANOVAs on earthworm biomass, density, and individual biomass were conducted. When the main effects were significant, mean comparisons between soil management methods were conducted using Tukey’s test. The relationships between earthworm densities and soil moisture or biomass of earthworms were tested within treatments using Pearson correlations. The data were analysed using IBM SPSS Statistics software (vers. 25, IBM, Incorporation, Armonk, New York, NY, USA).

3. Results and Discussion

3.1. Abundance and Biomass of Earthworm Community

The impact of different soil management practices on the mean abundance and biomass of earthworms in different sampling terms is shown in Figure 2. In the first measurement period (22 May 2014), there was a significantly higher earthworm abundance in the mulch, control and green cover treatments compared to the herbicide strips (p = 0.035, p = 0.021 and p = 0.013, respectively). During summer (9 August 2014), the abundance of the earthworm community slightly decreased in all treatments, except in the herbicide plots where, in addition to the control, it was significantly higher compared to the herbicide strip and tillage plot (p = 0.003 and p = 0.041, respectively). This higher mean abundance of earthworms in the herbicide treatment at the start of the trial could be due to the increased mass of dead plant material (organic matter) present, which represents a large source of food for earthworms. Schreck [16] stated that such conditions can create favourable conditions for their reproduction. The abundance of earthworms in the herbicide strip plots was almost halved from spring to autumn. All treatments except tillage resulted in a significantly higher abundance of earthworms than in the herbicide strip (p ≤ 0.05).
In 2015, we performed only one sampling of earthworms (13 June 2015). In that year, most of the growing season registered water scarcity, apart from in May. In June 2015, there was less rainfall compared to 2014 and 2016. This coincided with a significantly lower abundance of the earthworm community, being the lowest in the herbicide strips and the highest in the control plots (p = 0.007). Compared to the treatments, most earthworms were located in the mulched plots, which clearly shows the positive effects of mulch on vineyard soils during dry conditions [30,31,32]. The treatments of green cover, herbicide, mulch and tillage did not differ significantly from each other (p ≤ 0.05).
At the beginning of the trial in 2016 (17 May), there were no significant differences among treatments (p ≤ 0.05). The lowest earthworm abundance was registered in the herbicide strip plot, with the highest in the mulch plot, and somewhat lower in the green cover plot. After one month (15 June 2016), there were similar dynamics; the lowest abundance was detected in the herbicide strip, the highest in the green cover (p = 0.036), and slightly lower in the mulched plot (p = 0.046). The abundance of the earthworm community almost halved in herbicide and tillage plots. In the last term (5 October 2016), after three years of experimentation, most earthworms were located on the meadow control, and significantly fewer in the cultivated soils (p = 0.030) and herbicide strips (p = 0.014). Throughout the experiment, the earthworm abundance was the most stable in the green cover and mulched plots. This agrees with Vršič [3], who states that there were three times more earthworms in green cover plots and mulch than in the cultivated soils. Chan [33] found using meta-analysis that the total earthworm abundance under no-tilled soils can be from two to nine times higher than with conventional tillage. In our experiment, on average, the highest abundance of earthworm community was obtained in the green-covered soil compared to other methods. This can be related to the benefits obtained with the availability of plant residue food [25,27]. Since earthworms were provided from different plant residues throughout the year in green cover and mulch, they can grow and proliferate more rapidly in these soils. As reported by other authors [e.g., 33], less disturbed systems are also key; thus, these factors can provide a good habitat for earthworm growth, with longer periods for feeding and cocoon production.
Earthworm abundance in the herbicide treatment was among the highest in the first year, but declined in the following years, possibly due to the reduction of the amount of food available for earthworms coinciding with the reduced vegetation cover. Deteriorating living conditions (higher soil temperature and lower soil water content) could also contribute to the reduction of earthworm abundance as reported by [29]. In the tillage plot, the mean earthworm abundance decreased from the beginning of the experiment to the end. Similar findings were found by Schreck, Andersen, and Ernest [16,26,34] in an apple orchard plantation. Dekemati [12] also found significantly higher earthworm abundance in no-tillage soil compared to ploughed soils, and in reduced and conventional tillage treatments. Our hypothesis, i.e., that green cover and mulch would have the highest earthworm abundances compared to the other treatments (herbicide and tillage), was justified.
Often the size of the earthworm community, expressed by the number of specimens, does not reflect the current condition of the soil because it does not include the size of earthworms. Depending on their size, earthworms have different effects on the soil [29]. In our experiment, there was a strong correlation between the mean abundance and biomass of earthworms (r = 0.85), so that the earthworm abundance in most cases coincided with their biomass (Figure 3). At the beginning of the experiment, the mean biomass of earthworms was the highest in the green cover, and slightly lower in the herbicide and mulch plots, and almost three times higher as in the herbicide strip plot (p = 0.008, p = 0.028 and p = 0.048, respectively). In the second term, the values remained at a similar level, but the differences were not significant. At the end of the experiment during the first year (13 October 2014), the mean biomass of earthworms in the herbicide and green cover were 4.2 (p = 0.011) and 4.7 (p = 0.003) times higher than in the herbicide strip, respectively.
Like abundance, earthworm biomass confirms that soil moisture has a major impact on earthworm development. Due to the drought conditions in 2015, especially in the spring, the biomass of earthworms was significantly lower compared to 2014, with above-average rainfall (p < 0.0001; Figure 2), but the ratio in biomass between the soil management practices was even higher. The mean biomass of earthworms in herbicide (p = 0.016) or in control (p = 0.023) plots was almost 10 times higher than in the herbicide strip. In the case of mulch, the mean biomass of earthworms was 30 g/m2. Even though the mean biomass of earthworms in the mulch plot was lower compared to the herbicide plot, the mean abundance of earthworms was twice as high (96/m2) as in the herbicide plots (44/m2).
In 2016, from the first to the third term, the lowest mean biomass of earthworms was in the herbicide strip. In the first term, there was a significantly higher mean biomass in the mulched plot (p = 0.041), in the second in the green cover (p = 0.036), and in the third period the differences were not significant. The highest value was registered in the mulch (155.2 g/m2) and green cover (146.9 g/m2) soils. De Vetter [27] also observed this using straw mulch.
Permanent green cover and mulching had a favourable effect on the mean biomass of earthworms, better than the control (meadow), except in the driest year of 2015. With the treatment of herbicides, there was initially a higher mean biomass of earthworms, but it decreased from the first term from 152.6 g/m2 to 98.4 g/m2. Correia [35] confirmed that the biomass of earthworms in soil treated with glyphosate was halved and the earthworms remained alive in the soil at all stages of development, but their biomass decreased. This was similar to the tillage plot, except that the mean biomass was slightly higher at the beginning and at the end of the experiment) compared to the herbicide strip. However, the availability of organic matter was lower in both cases, which can affect the biomass of earthworms [25].
From the mean abundance and biomass of earthworms during the entire experimental period (from 22 May 2014 to 5 October 2016), we can conclude that different soil management practices had significant effects (p ≤ 0.05) on both parameters of the earthworm community (Table 1). On average, the lowest earthworm abundance was in the herbicide strip with a mean biomass of 34.9 dt ha−1. Significantly larger earthworm communities were in the permanent green cover, mulch and control plots compared to the herbicide strip (p < 0.0001) and tillage (p = 0.024, p = 0.004 and p = 0.017, respectively). Schreck [16] also reported that mechanical weeding dramatically decreases the biomass of earthworms in the vineyard. The use of different soil tillage methods [11] was not found to decrease the earthworm abundance. The mean biomass of earthworms was significantly higher in the permanent green cover compared to the herbicide strip (p < 0.0001), tillage (p = 0.030) and control (p = 0.048) plots. The mean biomass of earthworms in the permanent green cover was 12.9 dt ha−1 and in the mulch 11.9 dt ha−1, which is 56% and 44% higher, respectively, then in the tillage soils (8.3 dt ha−1). Similar dynamics in vineyards and orchards were also reported by Paoletti [36]. In the herbicide strip, the mean biomass of earthworm was only a third of that in a permanent greening treatment.

3.2. Earthworm Abundance and Biomass at Different Soil Depths

In the third year of the experiment (2016), the density of earthworms was also determined according to the soil depth, considering different layers (Figure 4). About two-thirds of the earthworms were distributed in the first 15 cm (from 64.1% in the herbicide to 69.7% in the mulched plot). In the mulched plot there were almost twice as many earthworms as in the tilled soils. The lowest amount was found in the herbicide strip. A total of 13.3% was reached in the mulch and tillage plots from 15 to 30 cm. In this soil layer, 25.5% of the total abundance was found in the control plot. At a depth of 30–60 cm the earthworm abundance was 8.1% in the herbicide strip and control plots and reached 20.4% in the tilled soils. This means that when tillage machines or herbicides are used, the earthworms are homogeneously distributed along with the upper layers. Several authors attribute this fact to the increase in bulk density and soil compaction, affecting soil porosity, aeration, as well as loss of nutrients and organic carbon [2,37,38].
Considering the biomass of the earthworms at different soil depths, we observed slightly different relationships compared to their density (Figure 4). The biomass of earthworms at a depth up to 15 cm was most proportional to their amount in the control plot; 66.4% of density represented 66.2% of the biomass. The other treatments also had a similar proportion of earthworm density at this depth, from 64.1% in the herbicide to 69.7% in the mulch, but their amounts represented from 30.5% in green cover to 50.7% of earthworm biomass in the herbicide strip. The highest biomass of earthworms was found in the mulch and green cover plots. Although there were 20% or fewer earthworms at a depth of 30– 60 cm, except in the control and herbicide strips (8.1%), their biomass in these soil layers represented about 50% of the earthworm community, except in the control (15.4%) and the herbicide strip (16.4%) plots. This means that in the case of mulch, green cover, tillage, and herbicide plots, the biomass of earthworms was more or less evenly distributed to a depth up to 60 cm, which could not be confirmed by their abundance. Although ecological categories were not assessed in the current experiment, the mean biomass of individual earthworms increased from the top to the bottom of the soil profile except in the herbicide strip (Figure 5). The highest mean biomass of individuals in the first layer was found in the control plot (748 mg). In the next two soil layers, the highest mean values were 1183 mg and 2092 mg, respectively, corresponding to the green cover plot. Finally, in the last surveyed layer, 1842 mg was the highest, which was found in the mulched soils. Along with the soil profile, on average, the largest earthworms were found in the green cover plots (1329 mg per ind.) and the lowest ones in the herbicide strip plots (502 mg per ind.). The relationships between biomass and abundance of earthworms per m2 were different according to the soil layer (Figure 6). The correlation was higher in the second part of the studied profile, which was also confirmed by the fact that at a depth of 30–60 cm the majority of earthworm biomass was represented by larger specimens, except in the herbicide strip at the fourth depth (Figure 5). The most likely reason for this is that larger species are located deeper in the soil, as stated by Jiménez [39]. The mature worms of some species are located deeper in the soil than the immature worms [15].

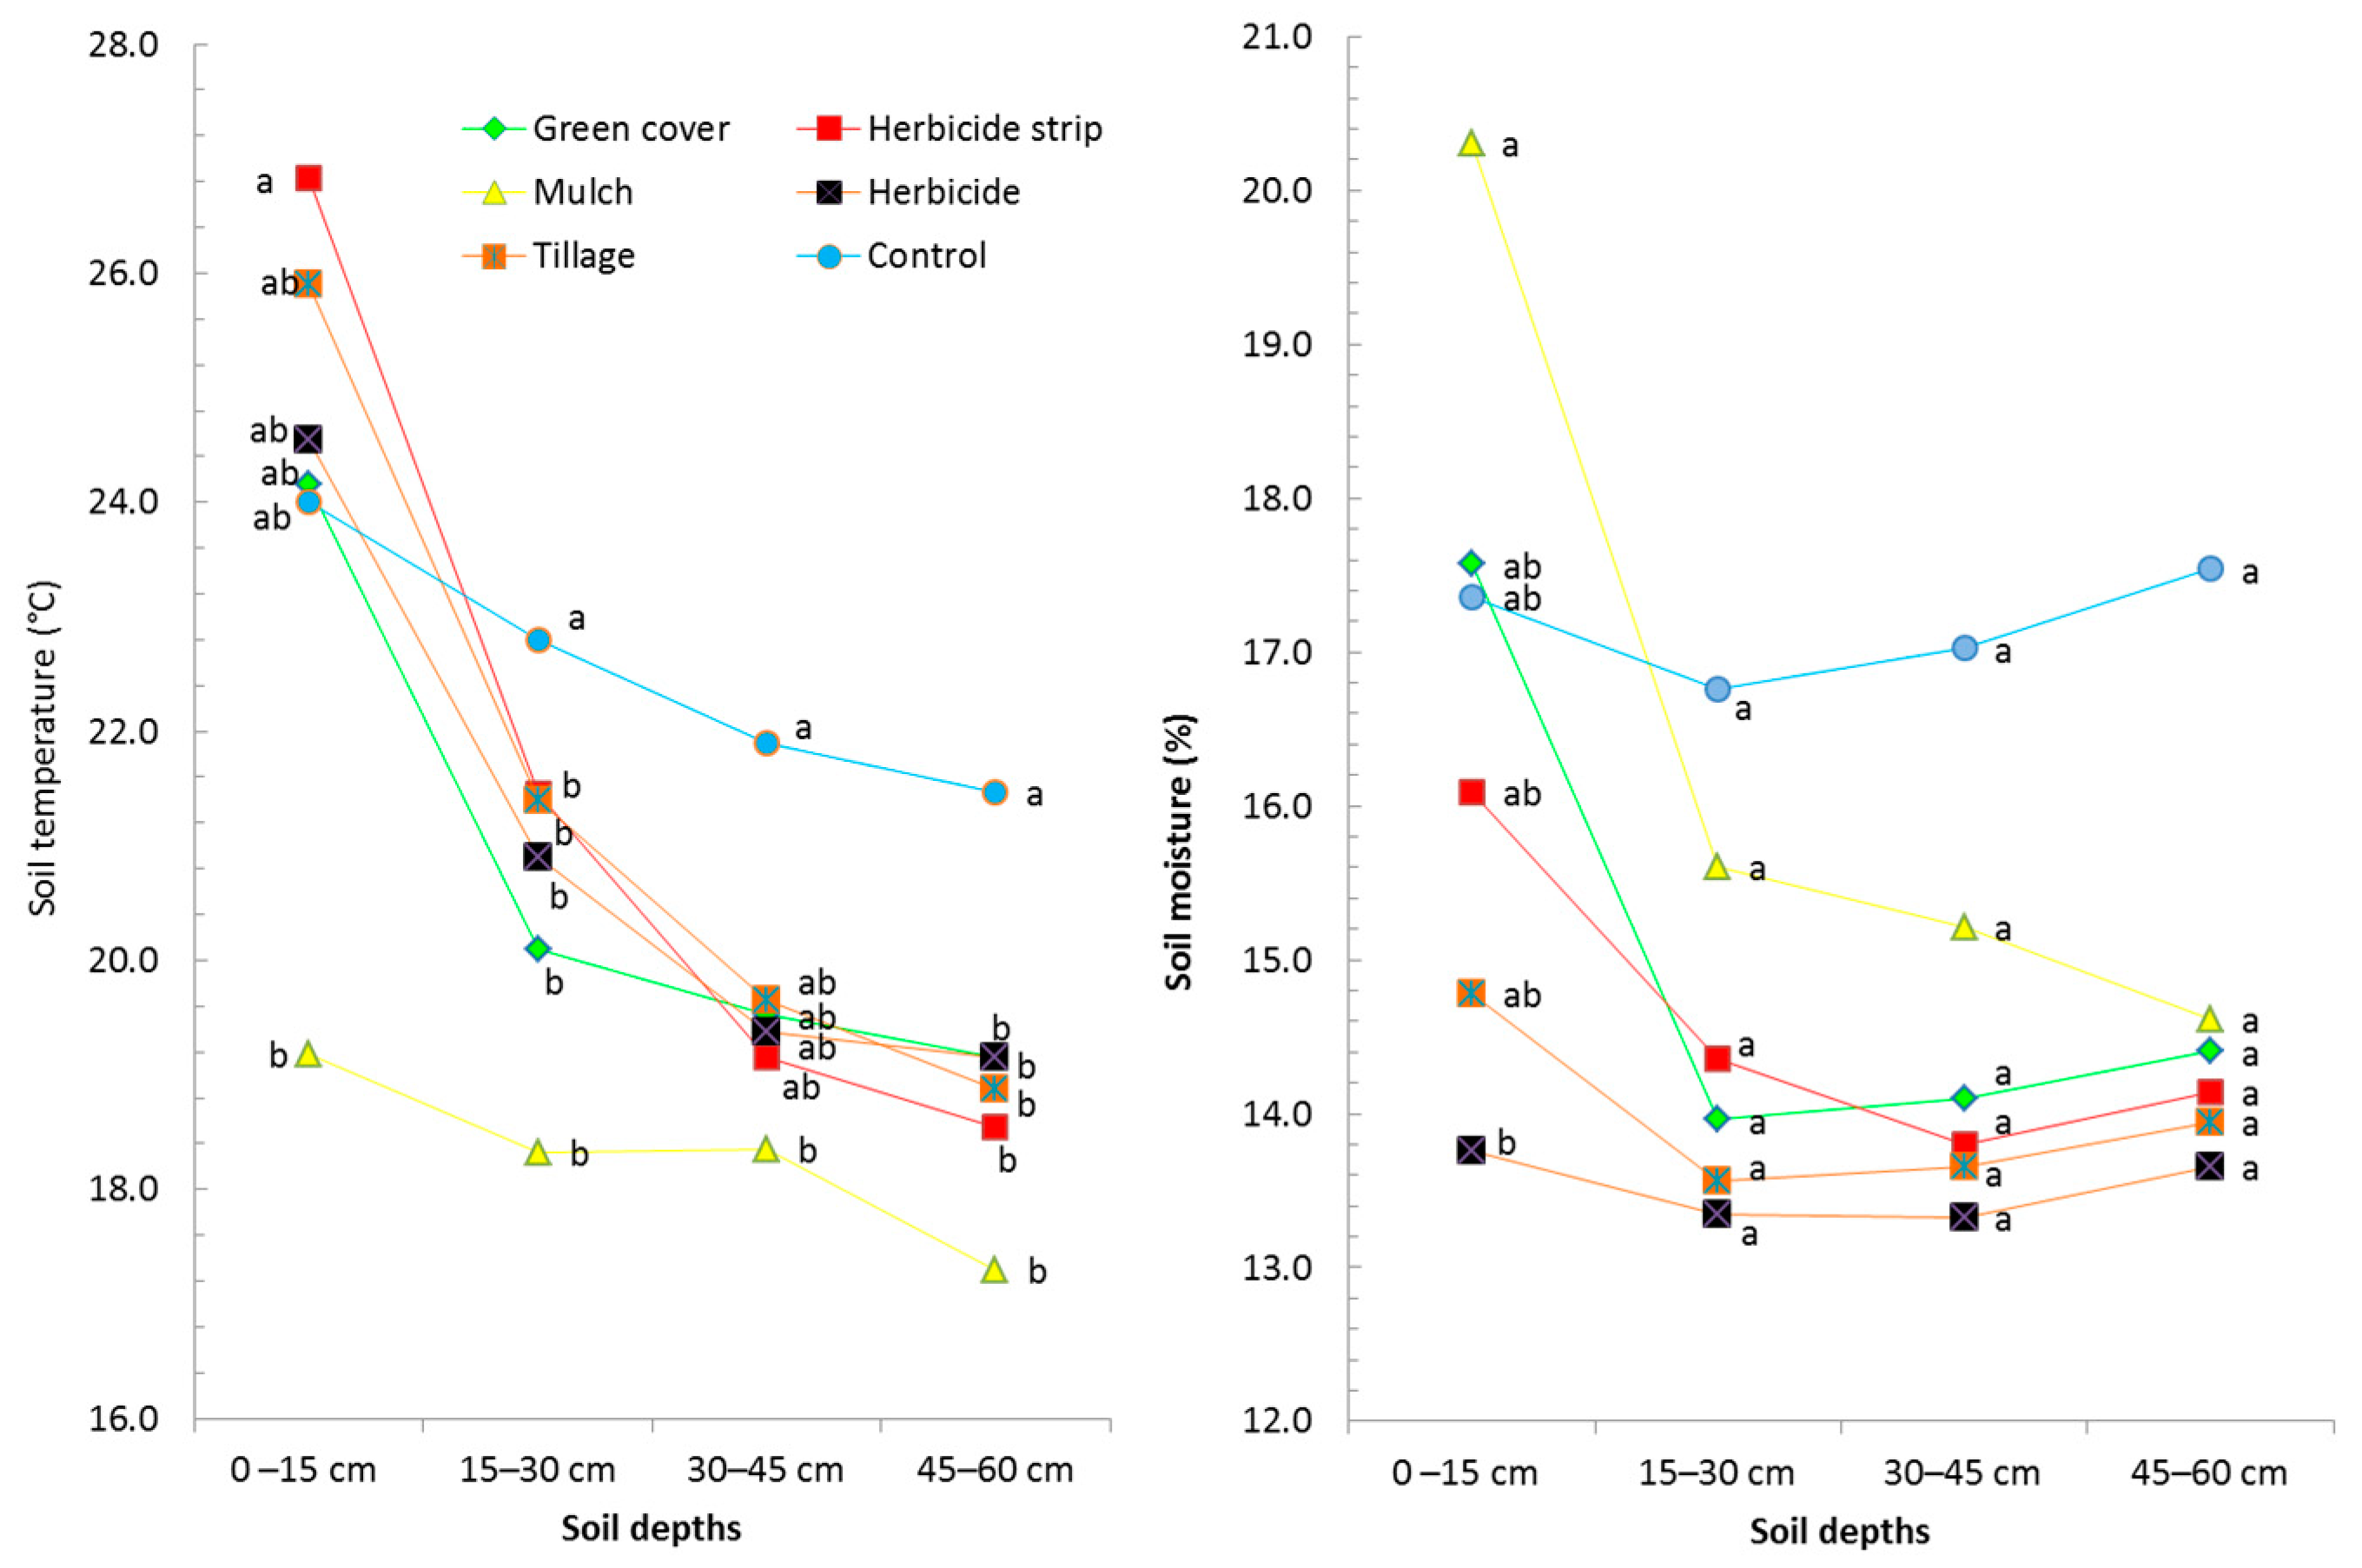
3.3. Soil Temperature and Moisture

In the third year of the trial (2016) at each depth, at the same time as the earthworm abundance was monitored, soil temperature and moisture were also measured. The mean soil temperature and moisture in Spring samples 2016 (Figure 7), considering the different soil management practices, were significantly different in the first depths (p ≤ 0.05) during the survey. The lowest temperature (19.2 °C) and highest moisture (20.3%) was registered in the mulched plot. Higher temperature and lower moisture were registered in treatments where the soil was more exposed to solar radiation (herbicide, tillage, herbicide strip). Earthworms had good conditions in the Spring for their activities and reproduction in green cover, mulch and control plots. Differences in temperature, especially in the upper layer, may have influenced the development of earthworms. Viljoen [40] found that the highest maturation rate of earthworms was obtained at 22 and 25 °C, which were the optimal temperatures for cocoon production. They also noted that although higher temperatures favoured growth, fecundity would be higher at this range. Upper lethal temperatures of earthworms typically range between 25 and 35 °C but vary substantially among species [41].
In the following layers of the soil profile up to 60 cm, the differences were lower. Due to the higher water content in covered soils, more energy is needed to heat the soil, but the reason for the lower soil temperature under the mulch is also that straw has a low thermal conductivity and heat transfer from the atmosphere to the soil and vice versa [20].
The influence of soil moisture on earthworm abundance was found along with the soil profile at depths from 0 to 60 cm during the survey (Figure 8). With the increase in soil moisture, the abundance and biomass of earthworms (r = 0.776; p = 0.001 and r = 0.625; p = 0.011, respectively) increased, while the biomass of individual earthworms decreased (r = −0.496; p = 0.028). From the first to the fourth soil layer these relationships weakened. The highest share of this connection was represented in data from the first half of the profile (0–30 cm), both in number (r = 0.833) and the biomass of earthworms (r = 0.891). Soil moisture had an important effect on the vertical distribution of earthworms as stated by Fründ [42], but these temperature connections could not be confirmed. Wever, Berry, and Eriksen-Hammel [43,44,45] stated that the greatest increase in earthworm biomass was found in soil with 25–30% moisture and 15–20 °C. The correlations between earthworm parameters, soil moisture and temperature, according to the different soil management practices, are in Table 2.

4. Conclusions

Different soil management practices in the vineyard affected soil moisture and temperature, indicating significant differences in earthworm abundance and their distribution by soil profile. The highest soil temperatures and the lowest soil moisture at a depth of 15 cm were recorded in the treatments where the soil was more exposed to solar radiation (herbicide, herbicide strip, and shallow tillage). On average, at all depths, the lowest temperature was in the mulched plot, and the soil moisture was the highest compared to other soil treatments, except the control (meadow). This is because straw reflects more sunlight into the atmosphere, causing less solar energy to be absorbed into the soil. In the soil with a permanent green cover there was slightly lower soil moisture than in the mulched soil. The earthworm abundance was highest in permanent green cover and mulch (higher than in control), which provided favourable conditions for earthworm development. At the beginning of the experiment, the abundance of the earthworm community was also similar in the herbicide plot (over the entire surface). This can be related to the benefits obtained by the rapid availability of plant residue food (organic matter). Towards the end of the experiment, however, the abundance began to decline in this treatment, indicating a deterioration in soil conditions. The lowest mean earthworm abundance and biomass per individual were found in the herbicide strip. Although no toxicity was detected in this experiment, it could be concluded that the use of glyphosate adversely affects the development of earthworms. Shallow tillage also harmed earthworms, as their abundance decreased during this experiment due to disturbances in habitat and deterioration of natural conditions. The differences in the abundance of the earthworm community according to the different soil management practices showed that earthworms are good bioindicators for the assessment of soil fertility and sustainable land use, and for monitoring the efficiency of ecosystem services in viticulture. According to the hypothesis, permanent green covering and straw mulch proved to be the most suitable soil management practices for earthworms in vineyards in the continental part of Slovenia. Long-term use of herbicides had a very negative effect on earthworms that was slightly less in its effect than soil tillage. However, the most commonly used soil management practice (green cover) will have to be adapted to climate change in the future. Less precipitation and higher temperatures have a negative impact on the development of earthworms, which, in addition to difference between treatments, was also confirmed by the differences between sampling terms. Alternating tillage in the vineyard is possible every second inter-row space, which would allow repopulation of earthworms in the disturbed inter-rows from neighbouring vegetated inter-rows.

Author Contributions

Conceptualisation. S.V. and M.B.; methodology. S.V. and B.P.; formal analysis. B.P.; investigation. M.B.; writing—Original draft preparation. S.V.; writing—Review and editing. J.R.-C.; funding acquisition. S.V. All authors have read and agreed to the published version of the manuscript.

Funding

This research was funded by the University Centre of Viticulture and Enology Meranovo, Faculty of Agriculture and Life Sciences.

Institutional Review Board Statement

The study was conducted according to the guidelines of the Declaration of Helsinki, and approved by the study commission of the Faculty of Agriculture and Life Sciences in 2020.

Data Availability Statement

Data are available at the University of Maribor (https://dk.um.si/Dokument.php?id=142381, accessed on 19 June 2021) and UC of viticulture and enology Meranovo.

Acknowledgments

The authors would like to thank the University centre of viticulture and enology, Faculty of Agriculture and Life Sciences for their financial support of this research. The authors are also grateful for the hard physical work of a group of technical assistants and students, which was necessary for the establishment of these perennial trials.

Conflicts of Interest

The authors declare no conflict of interest. The funders had no role in the design of the study; in the collection, analyses, or interpretation of data, in the writing of the manuscript, or in the decision to publish the results.

References

  1. Bagagiolo, G.; Biddoccu, M.; Rabino, D.; Cavallo, E. Effects of rows arrangement, soil management, and rainfall characteristics on water and soil losses in Italian sloping vineyards. Environ. Res. 2018, 166, 690–704. [Google Scholar] [CrossRef] [PubMed]
  2. Novara, A.; Stallone, G.; Cerdà, A.; Gristina, L. The Effect of Shallow Tillage on Soil Erosion in a Semi-Arid Vineyard. Agronomy 2019, 9, 257. [Google Scholar] [CrossRef] [Green Version]
  3. Vršič, S. Soil erosion and earthworm population responses to soil management systems in steep-slope vineyards. Plant Soil Environ. 2011, 57, 258–263. [Google Scholar] [CrossRef] [Green Version]
  4. Rodrigo-Comino, J. Five decades of soil erosion research in “terroir”. The State-of-the-Art. Earth-Sci. Rev. 2018, 179, 436–447. [Google Scholar] [CrossRef]
  5. Hofmann, M.; Schultz, H.R. Erratum to: Modeling the water balance of sloped vineyards under various climate change scenarios. BIO Web Conf. 2015, 5, 01027. [Google Scholar] [CrossRef]
  6. Serpa, D.; Nunes, J.; Keizer, J.; Abrantes, N. Impacts of climate and land use changes on the water quality of a small Mediterranean catchment with intensive viticulture. Environ. Pollut. 2017, 224, 454–465. [Google Scholar] [CrossRef]
  7. Riches, D.; Porter, I.; Oliver, D.; Bramley, R.; Rawnsley, B.; Edwards, J.; White, R. Review: Soil biological properties as indicators of soil quality in Australian viticulture. Aust. J. Grape Wine Res. 2013, 19, 311–323. [Google Scholar] [CrossRef]
  8. Bruggisser, O.T.; Schmidt-Entling, M.H.; Bacher, S. Effects of vineyard management on biodiversity at three trophic levels. Biol. Conserv. 2010, 143, 1521–1528. [Google Scholar] [CrossRef] [Green Version]
  9. Nicholls, C.I.; Parrella, M.; Altieri, M.A. The effects of a vegetational corridor on the abundance and dispersal of insect biodiversity within a northern California organic vineyard. Landsc. Ecol. 2001, 16, 133–146. [Google Scholar] [CrossRef]
  10. Orgiazzi, A.; Panagos, P. Soil biodiversity and soil erosion: It is time to get married. Glob. Ecol. Biogeogr. 2018, 27, 1155–1167. [Google Scholar] [CrossRef]
  11. Florian, F.; Elisabeth, W.; Zaller, J.G. Earthworms are little affected by reduced soil tillage methods in vineyards. Plant Soil Environ. 2017, 63, 257–263. [Google Scholar] [CrossRef] [Green Version]
  12. Dekemati, I.; Simon, B.; Vinogradov, S.; Birkás, M. The effects of various tillage treatments on soil physical properties, earthworm abundance and crop yield in Hungary. Soil Tillage Res. 2019, 194, 104334. [Google Scholar] [CrossRef]
  13. Pérès, G.; Piron, D.; Bellido, A.; Goater, C.; Cluzeau, D. Earthworms Used as Indicators of Agricultural Managements. Fresenius Environ. Bull. 2008, 17, 1181–1189. [Google Scholar]
  14. Coll, P.; Le Cadre, E.; Blanchart, E.; Hinsinger, P.; Villenave, C. Organic viticulture and soil quality: A long-term study in Southern France. Appl. Soil Ecol. 2011, 50, 37–44. [Google Scholar] [CrossRef] [Green Version]
  15. Fründ, H.-C.; Graefe, U.; Tischer, S. Earthworms as Bioindicators of Soil Quality. Soil Biol. 2011, 24, 261–278. [Google Scholar] [CrossRef]
  16. Schreck, E.; Gontier, L.; Dumat, C.; Geret, F. Ecological and physiological effects of soil management practices on earthworm communities in French vineyards. Eur. J. Soil Biol. 2012, 52, 8–15. [Google Scholar] [CrossRef] [Green Version]
  17. Kavdir, Y.; Ilay, R. Earthworms and Soil Structure. Soil Biol. 2010, 24, 39–50. [Google Scholar] [CrossRef]
  18. Blouin, M.; Hodson, M.; Delgado, E.A.; Baker, G.L.; Brussaard, L.; Butt, K.R.; Dai, J.; Dendooven, L.; Peres, G.; Tondoh, J.E.; et al. A review of earthworm impact on soil function and ecosystem services. Eur. J. Soil Sci. 2013, 64, 161–182. [Google Scholar] [CrossRef]
  19. Arai, M.; Miura, T.; Tsuzura, H.; Minamiya, Y.; Kaneko, N. Two-year responses of earthworm abundance, soil aggregates, and soil carbon to no-tillage and fertilization. Geoderma 2018, 332, 135–141. [Google Scholar] [CrossRef]
  20. White, R.E. Understanding Vineyard Soils: Site Selection and Soil Preparation; Oxford University Press: New York, NY, USA, 2015; pp. 30–66. [Google Scholar]
  21. Shuster, W.D.; McDonald, L.P.; McCartney, D.A.; Parmelee, R.W.; Studer, N.S.; Stinner, B.R. Nitrogen Source and Earthworm Abundance Affected Runoff Volume and Nutrient Loss in a Tilled-Corn Agro Ecosystems. Biol. Fertil. Soils 2002, 35, 320–327. [Google Scholar] [CrossRef]
  22. Safeer, A.; Aziz, I.; Mahmood, T.; Akmal, M. Influence of Different Tillage Practices and Earthworm on Selected Soil Physio-Chemical Parameters and Yield of Maize. Soil Environ. 2013, 32, 114–120. [Google Scholar]
  23. Zaller, J.; Arnone, J. Earthworm and soil moisture effects on the productivity and structure of grassland communities. Soil Biol. Biochem. 1999, 31, 517–523. [Google Scholar] [CrossRef]
  24. Foth, H. Fundamentals of Soil Science: Soil Ecology, 8th ed.; John Wiley and Sons: New York, NY, USA, 1990; pp. 115–132. [Google Scholar]
  25. Pérès, G.; Cluzeau, D.; Curmi, P.; Hallaire, V. Earthworm activity and soil structure changes due to organic enrichments in vineyard systems. Biol. Fertil. Soils 1998, 27, 417–424. [Google Scholar] [CrossRef]
  26. Andersen, L.; Kühn, B.F.; Bertelsen, M.; Bruus, M.; Larsen, S.E.; Strandberg, M. Alternatives to herbicides in an apple orchard, effects on yield, earthworms and plant diversity. Agric. Ecosyst. Environ. 2013, 172, 1–5. [Google Scholar] [CrossRef]
  27. Devetter, L.W.; Dilley, C.A.; Nonnecke, G.R. Mulches Reduce Weeds, Maintain Yield, and Promote Soil Quality in a Continental-Climate Vineyard. Am. J. Enol. Vitic. 2014, 66, 54–64. [Google Scholar] [CrossRef]
  28. Paoletti, M.G. The role of earthworms for assessment of sustainability and as bioindicators. Agric. Ecosyst. Environ. 1999, 74, 137–155. [Google Scholar] [CrossRef]
  29. Edwards, C.A.; Bohlen, P.J. Biology and Ecology of Earthworms, 3rd ed.; Chapman & Hall: London, UK, 1996; 426p. [Google Scholar]
  30. Al-Shammary, A.A.G.; Kouzani, A.; Gyasi-Agyei, Y.; Gates, W.; Rodrigo-Comino, J. Effects of solarisation on soil thermal-physical properties under different soil treatments: A review. Geoderma 2020, 363, 114137. [Google Scholar] [CrossRef]
  31. Anikwe, M.; Mbah, C.; Ezeaku, P.; Onyia, V. Tillage and plastic mulch effects on soil properties and growth and yield of cocoyam (Colocasia esculenta) on an ultisol in southeastern Nigeria. Soil Tillage Res. 2007, 93, 264–272. [Google Scholar] [CrossRef]
  32. Kader, M.; Senge, M.; Mojid, M.; Ito, K. Recent advances in mulching materials and methods for modifying soil environment. Soil Tillage Res. 2017, 168, 155–166. [Google Scholar] [CrossRef]
  33. Ernst, G.; Emmerling, C. Impact of five different tillage systems on soil organic carbon content and the density, biomass, and community composition of earthworms after a ten year period. Eur. J. Soil Biol. 2009, 45, 247–251. [Google Scholar] [CrossRef]
  34. Correia, F.V.; Moreira, J.C. Effects of Glyphosate and 2,4-D on Earthworms (Eisenia foetida) in Laboratory Tests. Bull. Environ. Contam. Toxicol. 2010, 85, 264–268. [Google Scholar] [CrossRef]
  35. Chan, K. An overview of some tillage impacts on earthworm population abundance and diversity—Implications for functioning in soils. Soil Tillage Res. 2001, 57, 179–191. [Google Scholar] [CrossRef]
  36. Paoletti, M.; Sommaggio, D.; Favretto, M.; Petruzzelli, G.; Pezzarossa, B.; Barbafieri, M. Earthworms as useful bioindicators of agroecosystem sustainability in orchards and vineyards with different inputs. Appl. Soil Ecol. 1998, 10, 137–150. [Google Scholar] [CrossRef]
  37. Głąb, T. Impact of soil compaction on root development and yield of meadow-grass. Int. Agrophys. 2013, 27, 7–13. [Google Scholar] [CrossRef] [Green Version]
  38. Moradi, J.; John, K.; Vicentini, F.; Veselá, H.; Vicena, J.; Ardestani, M.M.; Frouz, J. Vertical distribution of soil fauna and microbial community under two contrasting post mining chronosequences: Sites reclaimed by alder plantation and unreclaimed regrowth. Glob. Ecol. Conserv. 2020, 23, e01165. [Google Scholar] [CrossRef]
  39. Jimenez, J.J.; Decaens, T. Vertical distribution of earthworms in grassland soils of the Colombian Llanos. Biol. Fertil. Soils 2000, 32, 463–473. [Google Scholar] [CrossRef] [Green Version]
  40. Viljoen, S.; Reinecke, A. The temperature requirements of the epigeic earthworm species Eudrilus eugeniae (oligochaeta)—A laboratory study. Soil Biol. Biochem. 1992, 24, 1345–1350. [Google Scholar] [CrossRef]
  41. Singh, J.; Schädler, M.; Demetrio, W.; Brown, G.G.; Eisenhauer, N. Climate change effects on earthworms-a review. Soil Org. 2019, 91, 114–138. [Google Scholar] [CrossRef]
  42. Fründ, H.-C.; Egbert, E.; Dumbeck, G. Spatial distribution of earthworms [Lumbricidae] in recultivated soils of the Rhenish lignite-mining area, Germany. J. Plant Nutr. Soil Sci. 2004, 167, 494–502. [Google Scholar] [CrossRef]
  43. Wever, L.A.; Lysyk, T.J.; Clapperton, M. The influence of soil moisture and temperature on the survival, aestivation, growth and development of juvenile Aporrectodea tuberculata (Eisen) (Lumbricidae). Pedobiologia 2001, 45, 121–133. [Google Scholar] [CrossRef]
  44. Berry, E.; Jordan, D. Temperature and soil moisture content effects on the growth of Lumbricus terrestris (Oligochaeta: Lumbricidae) under laboratory conditions. Soil Biol. Biochem. 2001, 33, 133–136. [Google Scholar] [CrossRef]
  45. Eriksen-Hamel, N.S.; Whalen, J.K. Growth rates of Aporrectodea caliginosa (Oligochaetae: Lumbricidae) as influenced by soil temperature and moisture in disturbed and undisturbed soil columns. Pedobiologia 2006, 50, 207–215. [Google Scholar] [CrossRef]
Figure 1. Different soil management practices. (1) herbicide, (2) mulch, (3) tillage, (4) green cover, (5) herbicide strip (left in the vineyard, right the experiment plan sketch). Picture is original (photo Marko Breznik).
Agronomy 11 01241 g001
Figure 2. Abundance and fresh biomass (g) of earthworms per m2 according to different soil management practices in the vineyard from 2014 to 2016. Different lowercase letters denote significant differences among the soil management practices within the sampling term with a > b > c, and uppercase between the sampling terms A > B > C > D (p ≤ 0.05). Values are mean ± standard error (SE), errors bars are SE.
Agronomy 11 01241 g002
Figure 3. The connection between abundance and biomass of earthworms within treatments (2014–2016; p = 0.001).
Agronomy 11 01241 g003
Figure 4. Earthworm abundance and their biomass at different soil depths per m2 according to different soil management practices during the last year of the trial. Different letters denote significant differences among soil management practices in each depth (p ≤ 0.05), error bars are standard errors.
Agronomy 11 01241 g004
Figure 5. Mean biomass of individual adult earthworms per m2 at different soil depths according to different soil management practices. Different letters denote significant differences among soil management practices in each depth (p ≤ 0.05).
Agronomy 11 01241 g005
Figure 6. Relationship between mean biomass and number of earthworms per m2 at different soil depths (in all depths p = 0.001, except 15–30 cm p = 0.038) according to different soil management practices in vineyard; r—Pearson correlation index.
Agronomy 11 01241 g006
Figure 7. Mean soil temperature and moisture of spring samples in the third year of the trial along with the soil profile at depths from 0 to 60 cm. according to different soil management practices. Different letters denote significant differences among soil management practices in each depth (p ≤ 0.05).
Agronomy 11 01241 g007
Figure 8. Relationship between mean soil moisture and the mean number and weight of earthworms along with the soil profile at depths from 0 to 60 cm; r—Pearson correlation index.
Agronomy 11 01241 g008
Table 1. Abundance and biomass (g) of earthworms per m2 in soil with different soil management practices in the period from 22 May 2014 to 5 October 2016.
Soil Management SystemNumber of EarthwormsWeight of Earthworms
Average ± SE Average ± SE
Green cover167 ± 14.2a129.19 ± 14.42a
Herbicide strip66 ± 7.18c34.89 ± 5.56c
Mulch (straw)178 ± 14.57a118.94 ± 13.56ab
Herbicide157 ± 17.13ab107.54 ± 12.03ab
Tillage110 ± 9.71bc82.73 ± 9.37b
Control 169 ± 11.04a85.27 ± 5.80b
Different letters denote significant differences among soil management practices with a > b > c (p ≤ 0.05); values are mean ± standard error (SE).
Table 2. Correlations between earthworm parameters and soil moisture and temperature according to different soil management practices along with the soil profile at depths from 0 to 60 cm.
EarthwormsSoil Management Practices/Depth of SoilPearson Correlation
(Soil Moisture)
Pearson Correlation
(Soil Temperature)
Up to 15 cm15–30 cm30–45 cm45–60 cmUp to 15 cm15–30 cm30–45 cm45–60 cm
Number/m2Green cover−0.4180.223−0.5180.138−0.056−0.0380.740 **0.237
Herbicide strip0.346−0.3020.1670.4760.0630.127−0.1410.425
Mulch−0.157−0.034−0.2070.4610.0950.0690.842 ***−0.07
Herbicide−0.1310.3590.3620.803 **−0.3980.4660.865 ***0.489
Tillage−0.5270.4680.3920.354−0.3570.0830.466−0.099
Control0.840 ***0.879 ***0.651 *0.2320.826 **0.906 ***0.4030.511
Biomass/m2Green cover−0.454−0.096−0.435−0.2120.096−0.2810.740 **0.532
Herbicide strip0.437−0.121−0.0960.1310.1710.229−0.2580.562
Mulch0.356−0.357−0.1940.3930.087−0.0340.805 **0.141
Herbicide−0.110.5720.1510.6940.2990.5340.739 **0.342
Tillage−0.5170.0710.3030.394−0.1930.0020.2920.054
Control−0.893 ***0.888 ***0.511−0.001−0.700 *0.939 ***0.2530.343
Weight per individualGreen cover−0.366−0.4590.181−0.1010.094−0.4680.0380.583
Herbicide strip−0.250.0860.1010.172−0.417−0.0060.0860.465
Mulch0.692*−0.676 *0.0160.2940.1170.007−0.1920.304
Herbicide0.0440.646 *0.4040.0160.724 **0.704 *0.5830.213
Tillage−0.1970.05−0.0710.5870.0580.408−0.1940.455
Control−0.859 ***−0.299−0.154−0.296−0.931 ***−0.253−0.1950.083
*, ** and *** indicate significance at the 0.10, 0.05 and 0.01 levels, respectively.
Publisher’s Note: MDPI stays neutral with regard to jurisdictional claims in published maps and institutional affiliations.

