1. Introduction
Soybean belongs to the five arable crops with the largest production area worldwide. It was cultivated in 2019 on 121 M ha in the world and on 908,000 ha in the European Union. More than 140 years ago, [
1] successfully introduced the soybean plant (
Glycine max (L.) Merr.) also to Central Europe and discussed its cultivation for the first time. Soybean is a very important crop due to its seeds, which have the highest protein concentration, and also one of the highest oil concentrations among legumes, containing carbohydrates and other minerals as well [
2,
3]. The crop is large-seeded with large cotyledons and accordingly considerable seed P reserves. [
4] reported total P concentrations in the seeds of soybean around 7.5 mg g
−1 fresh mass (FM), which is up to 2.5-fold and 1.5-fold higher than the seed P concentration in rice (
Oryza sativa) and common bean (
Phaseolus vulgaris), respectively. Studies of [
5,
6,
7] suggest that seed P maintains the growth of young soybean plants beyond the seedling stage, especially under low P phytoavailability from soil. It may also enhance the shoot P uptake through earlier access to the soil P resources by a faster root establishment. [
8] assumed that heavier seeds with higher seed P content could be considered as an adaptation trait developed by plants in response to low soil P phytoavailability. This hypothesis is confirmed by recent findings indicating genetic associations between soybean seed size and P efficiency in low-P environments [
9,
10]. In contrast to higher P reserves present in larger seeds, correlations between soybean seed size and other characters such as grain yield, seed protein, or seed carbohydrate content are generally not consistent but depend on the genetic population investigated, as well as on specific environmental conditions.
The dilemma of phosphorus (P) in agriculture as a finite resource has been already thoroughly discussed by [
11]. [
12] defined P-efficient crops and genotypes as those with greater P acquisition efficiency and lower soil-P requirements. They emphasized the necessity of developing such genotypes, which would minimize the excessive use of P fertilizers, resulting in a better P-balance, and reducing the losses and subsequent environmental side effects due to runoff, leaching, and eutrophication. [
13] proved that some crops are able to grow at low P concentration in the biomass (<2 mg P kg
−1), which can be considered as low-P tolerant (with regard to P utilization efficiency). On the contrary, the plants which cannot perform well under low P phytoavailability are considered as P-sensitive. According to the Austrian Agency for Health and Food Safety (AGES), any P content between 26–46 mg kg
−1 CAL-P in a substrate is classified as “low”, whilst P contents lower than 26 mg kg
−1 CAL-P are considered as “very low”. [
7] used in one experiment substrates with 60 mg P kg
−1 or 115 mg P kg
−1 for low or high P availability, respectively, and in another experiment on soybean they used P-deficient farming soil of 2.2 mg P kg
−1 amended with nutrient solutions providing 75 mg P kg
−1 (low P) to induce a milder P deficiency stress vs. 400 mg P kg
−1 (high P). In another experiment by [
14] on soybean, the low P supply level to induce the deficiency stress was as low as 12.60 mg P kg
−1. From a study by [
15], we know that the P uptake of soybean is not as efficient as with other legumes such as lupin, which took up on average 2.6 times more P per unit root length than soybean. This is due to principal differences in root architecture and root class formation between different grain legume species [
16]. Low phytoavailability of phosphorus in the soil is a major constraint to soybean production and, therefore, searching for soybean genotypes that can efficiently acquire and utilize the mineral P from the soil is an important breeding objective to secure and improve soybean production [
14,
17].
It is also evident that soybean cultivars differ genetically with regard to P uptake, and P-efficient soybean varieties that are capable of efficient acquisition of P from the soil will improve soybean production [
14,
17]. Many phenotypic characteristics support crops in tolerating low P stress. Among them are differences in root branching pattern and the rate of P uptake per unit root length, root extension rates, root dry weight, root:shoot and shoot:grain allometry, and the minimum required tissue P concentration for plants to function properly [
18]. Of course, most of those traits can somehow be adapted by breeding techniques. Nevertheless, not all of the sources for variation in P acquisition and use efficiency are fully understood, e.g., it is not known how long the seed P stock would affect the shoot biomass and the shoot P content. [
19] indicated that seed size is closely related to phosphorus use efficiency in the common bean. Despite the fact that dependency of plants on seed P gradually fades out after emergence, [
7] suggested that in a large-seeded crop such as soybean, its effect will drag out beyond the seedling stage.
Knowing that under low P supply conditions the young soybean plants are highly relying on seed P content within the early growth stages, we hypothesized that screening soybean genotypes of different seed size for early biomass and P accumulation would show that those genotypes, which have relatively higher seed weight and seed P content, can potentially provide more P supply to sustain a better early biomass accumulation in shoot and root. This effect might be due to transfer of P from the seed to the shoot or by investing it in root growth for establishing a better root system for P uptake from the soil. Overall, in the present study, we intended to test the hypothesis that soybean seed size and thus seed P content positively affect the shoot and root growth and P accumulation up to anthesis, particularly under low P phytoavailability from the soil.
2. Material and Methods
2.1. Experimental Site and Conditions
Two pot experiments were carried out in the greenhouse at the Tulln Campus of BOKU University at the average temperature of 22 °C/14 °C for day and night, respectively. The relative humidity was 43%, and lights were set to 14 h day/10 h dark with 380 μmol photons m−2 s−1 provided by four metal-halide lamps (Phillips, each 400 W) placed 100 cm above the soil surface. The experiments were laid out in completely randomized design with eight or six replicates in experiments 1 or 2, respectively.
2.2. Germplasm
Seeds of 15 soybean varieties with different seed weight were provided by BOKU Institute of Plant Breeding from different origin (
Table 1). Genotype selection was based on covering a maximum phenotypic diversity as revealed from earlier field experimental results, and on cultivar release date including cultivars from as early as the 1920–1950 period up to the most recent breeding lines. The modern cultivar ES Mentor (most widely grown soybean cultivar in Austria and other central European countries during 2012–2018) was included as a control. In order to avoid variations within the seedlings of the same genotype, only seeds of visibly the same size and same health appearance from a determined seed weight range (variation of seed weight within each genotype <1.6%) were chosen as the representatives of each genotypic population. In experiment 2, four genotypes with superior P uptake based on either seed P resources or soil P acquisition, as found in experiment 1 (cf. results section), were selected besides ES Mentor as a control.
2.3. Plant Growth Substrate
Soil material was collected from an agricultural field at Bruck an der Leitha, Lower Austria, with previous cropping history of potato. Soil organic matter (SOM) was 2.36%, soil pH was 6.3, and soil cation exchange capacity (CEC) was 15.3 cmol kg
−1. For experiment 1, the potting substrate was a 1:1 soil–sand mix (
w/
w). The measured plant available P concentration of the prepared substrate, using the calcium acetate lactate (CAL) extraction of [
20], was 21.6 mg kg
−1, which, according to the Austrian Agency for Health and Food Safety (AGES), is classified as “low”. The CAL extraction shows a close correlation with Olsen P analyses [
21]. The potting mix was fertilized with 480 mg Compo Floranid NK in each pot (14% N, 19% K
2O, 3% MgO, 11% S, 0.02% B, 0.01% Cu, 0.5% Fe, and 0.01% Zn). For experiment 2, there were two substrates prepared with different P availability, i.e., high P (HP) or low P (LP). Here, the potting substrate was a 1:6 soil–sand mix (
w/
w). The measured plant available P concentrations of the prepared substrate for LP and HP were 6.17 mg kg
−1 and 68.12 mg kg
−1 CAL-P, which, according to AGES, are classified as “very low” and “sufficient”, respectively. In that experiment, nutrients were applied by means of fertigation. A modified 20% strength Epstein nutrient solution, as suggested by [
22], was prepared, and the macronutrients were supplied differently for HP and LP pots. In this experiment, the two levels of soluble P as well as other nutrients were supplied on a regular basis (100 mL of the final solutions per day for the first 30 out of 40 days) and as evenly as possible to the soil surface using 100 mL mechanical pipettes to reach the desired concentration of elements in the potting substrate after applying the complete 3 L of final solution. Concentrations of the supplied nutrients in the substrates at LP and HP are presented in
Table 2.
2.4. Setup and Execution of Experiments
In total, 1700 g or 2700 g of the potting mix were put into 4 L (19 cm diameter by 20 cm height) plastic pots for experiment 1 or 2, respectively. Subsequently, four seeds were directly placed on the soil surface in each pot in a triangle arrangement, with one in the middle, and covered by 300 g (~3 cm column) of the particular potting mix. Then, they were watered immediately using deionized water to the saturation point. After that, they were left alone to let the soil water content go down to about 75% field capacity (FC). The gravimetric soil water content at that time was determined by taking soil samples 4 days after watering from each pot. The samples were weighed, dried, and weighed again to determine the gravimetric soil water content. The weight of the pots at about 75% FC was recorded, and for the rest of the experiment the pots were weighed daily and water was added to bring them back to 75% FC.
2.5. Data Collection and Sample Harvest
The phenological development of soybean plants was documented according to BBCH scale [
23] twice per week. The plant shoots were harvested 30 days or 40 days after planting (DAP) in experiments 1 or 2, respectively, by cutting them from the soil surface to get the aboveground biomass of four plants per pot. They were then oven-dried at 65 °C for 72 h to determine the dry matter (DM). The roots were washed out with tap water to remove adhering soil particles and debris. Then, they were placed in 250 mL Schott flasks filled with 20% EtOH and stored in the dark at 6 °C till they were scanned, yielding digital black and white images (600 dpi) which were used for determining morphological root traits, including total root length (TRL) and root surface area (RSA), by the means of WinRhizo
® Pro (Regent Instruments Inc., QC, Canada) according to the protocol developed by [
24]. Finally, they were also oven-dried to determine the root DM.
2.6. Analysis of Seed and Shoot Phosphorus Content
In order to determine the seed P content as well as the shoot P uptake, P concentrations were determined in mg P g−1 sample. For seed analysis, six single seeds per genotype of the same size as those planted later were used as replicates. Oven-dried seed and shoot samples were ground using a RETSCH® ball mill (Schwingmühle MM 400) for typical grinding time of 14 s with vibration frequency of 20 Hz, providing a homogenous powder with d90 ˂ 5 μm final fineness. The ground samples were emptied out into plastic tubes (Eorf® Reaktionsgefäß 5 mL), dried at 105 °C for about 4 h, and cooled in a desiccator. Subsequently, they were weighed with a Sartorius® BP61 lab scale for 100 ± 1 mg, then transferred to CEM-Xpress Teflon vessels and finally submerged in 4 mL HNO3 overnight. On the next day, 1 mL of H2O2 30% w/v (300 g H2O2 per 1000 mL total volume distilled water) was poured into each vessel. Then, the samples were fully digested by acid cooking in a “MARS 6 System” microwave (CEM GmbH, Kamp-Lintfort, Germany) at 1030–1080 W for 20 min (generates about 200 °C). The digests were filtered through P-free filter papers (Macherey-Nagel GmbH & Co. KG, Düren, Germany) into 25 mL flasks and topped up with demineralized water. The digests were later diluted with demineralized water for the measurements by ICP-OES (Perkin-Elmer Optima 3300 DV).
2.7. Statistical Analysis
After checking the normality by Kolmogorov–Smirnov procedure, and the homogeneity of variances with Levene’s test, one- or two-way analyses of variance (ANOVA) were carried out. Significant differences of means were determined by using Tukey’s HSD mean separation test (p < 0.05). For experiment 2, this was done for LP and HP data separately in case of a significant interaction of genotype × P supply level. Relationships between seed weight or seed P and shoot biomass or shoot P uptake were determined using bivariate linear correlation and regression models. Statistics were performed using IBM® SPSS® Statistics version 21 and SigmaPlot™ version 14.0.
3. Results
3.1. Experiment 1
One-way ANOVA showed a significant difference among genotypes at p < 0.01 for seed dry matter (DM), seed P content, shoot, root, and total plant DM, shoot:root ratio, shoot P uptake, total root length (TRL), and at p < 0.05 for seed P concentration and root surface area (RSA) at 30 DAP.
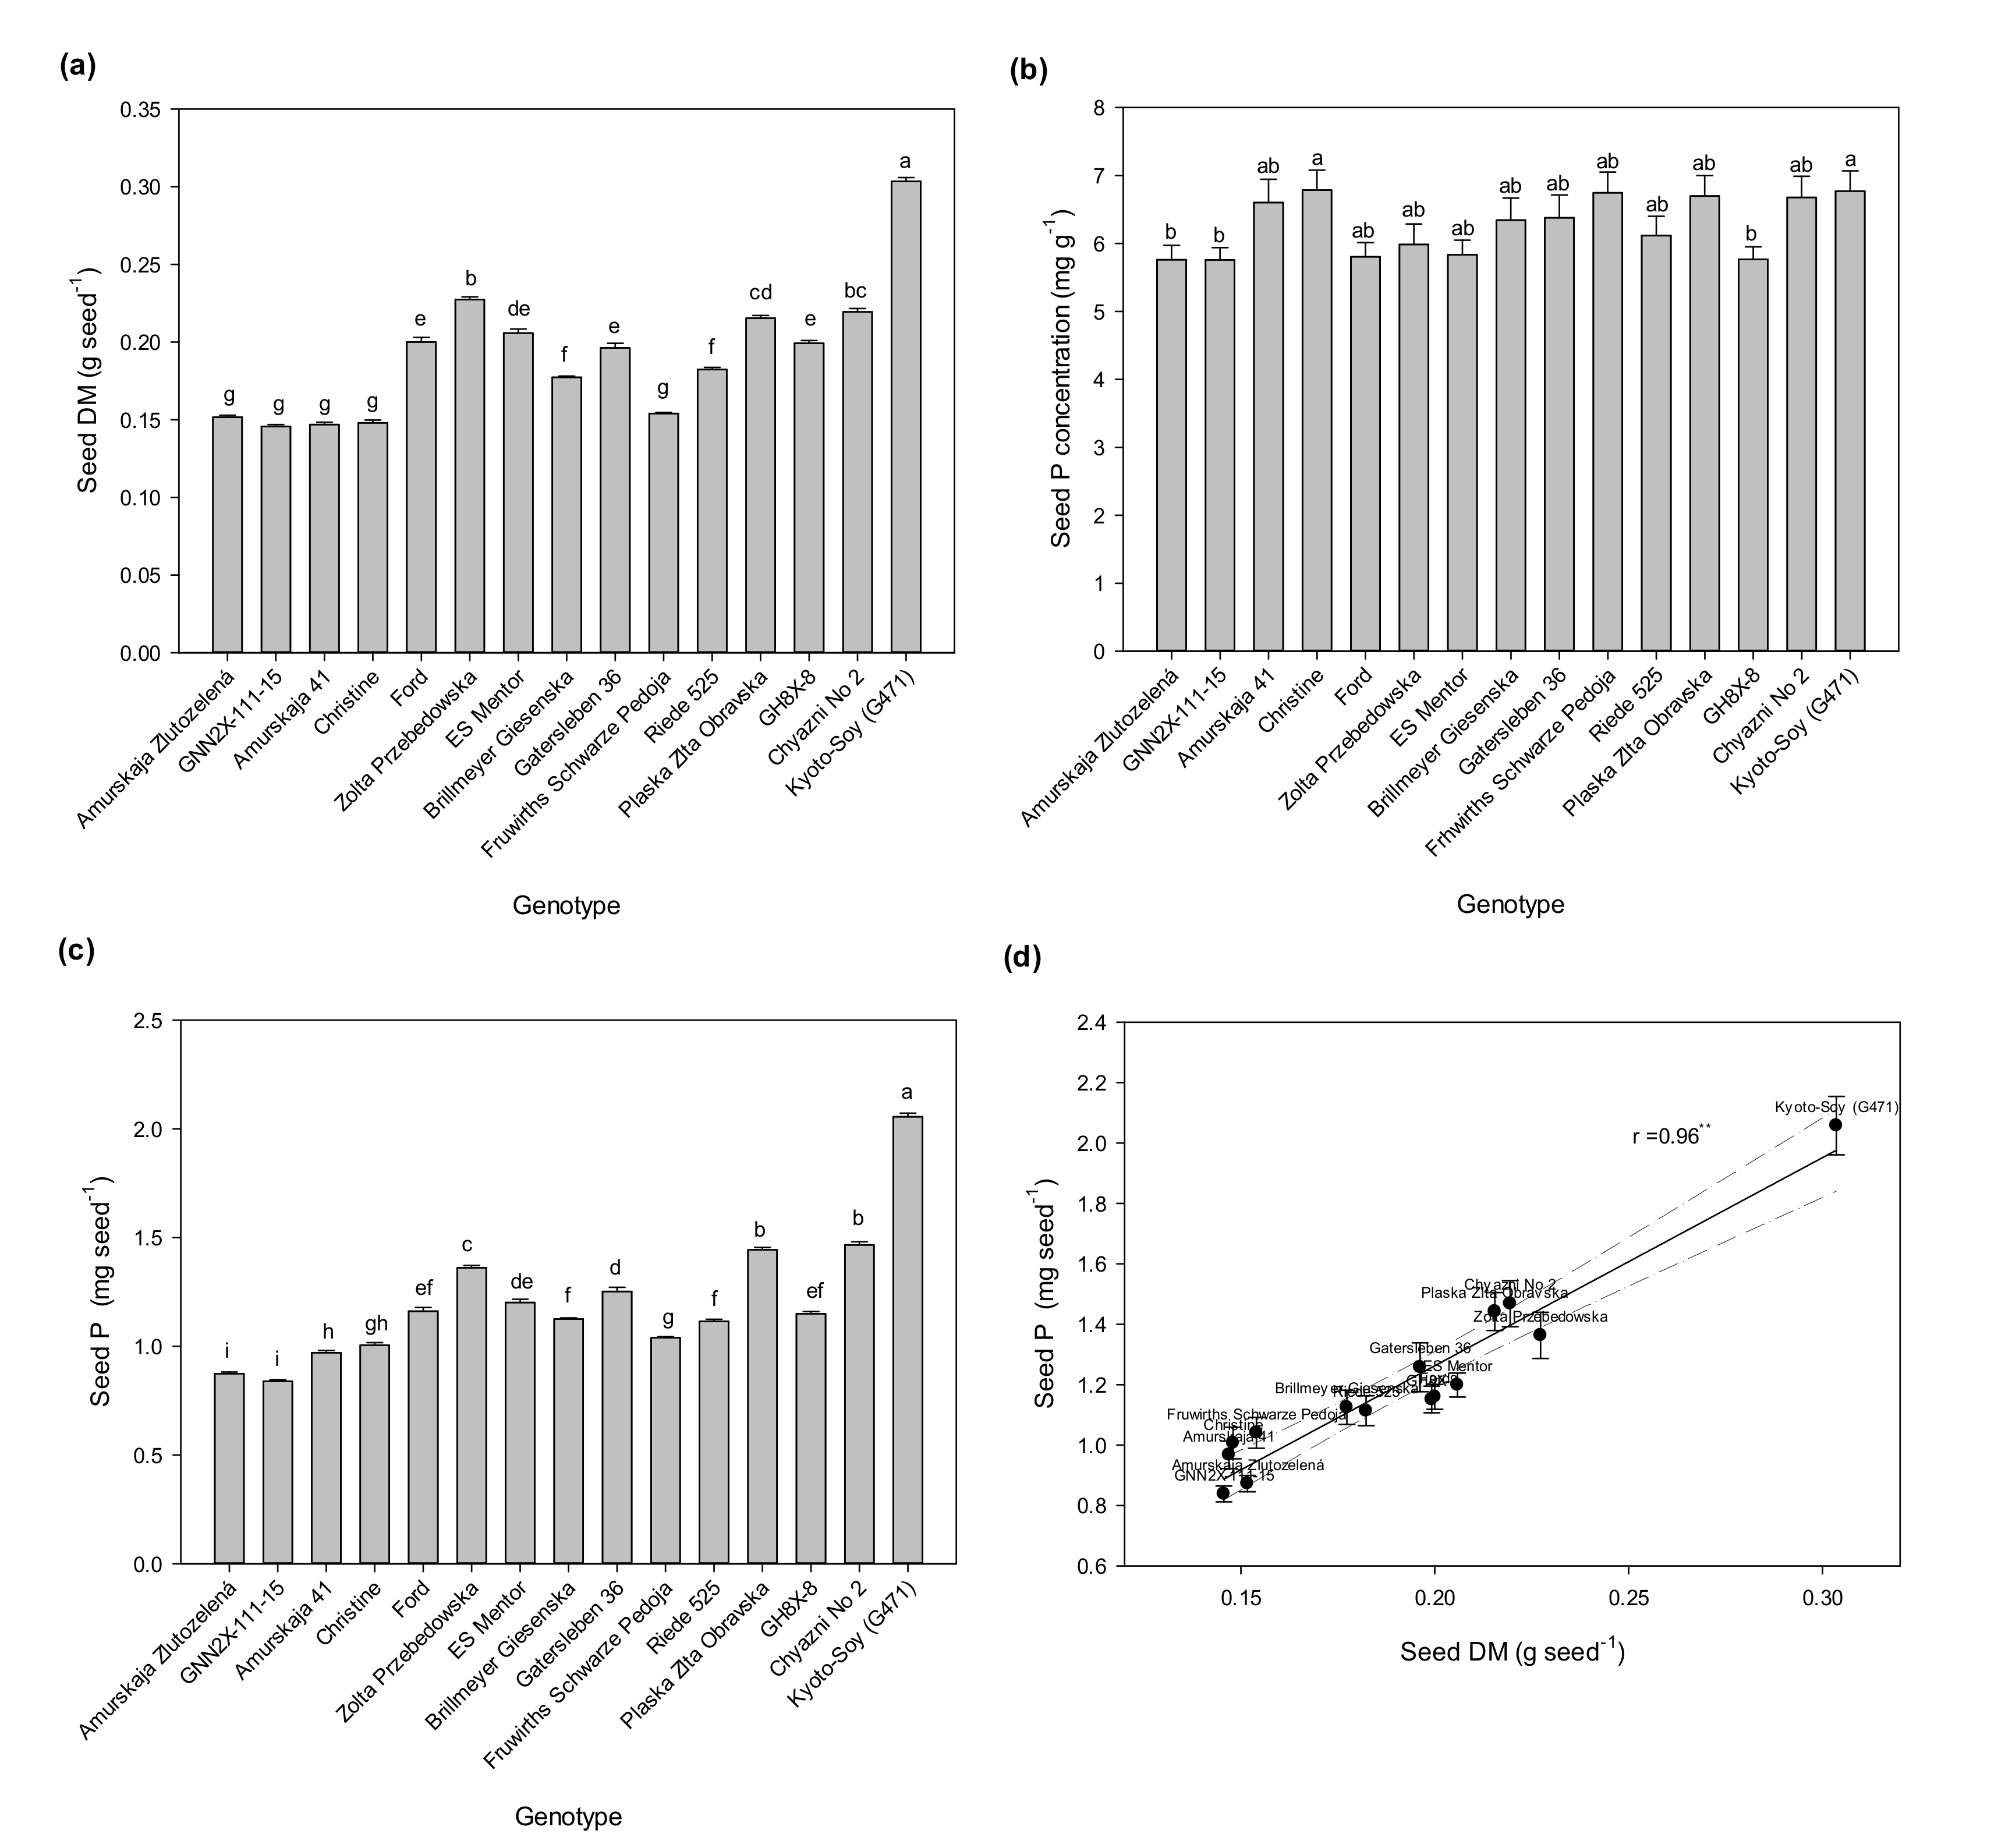
As presented in
Figure 1, the tested soybean genotypes differed in seed size, i.e., seed weight (
Figure 1a) and seed P content (
Figure 1c), and seed P content was closely (linearly) related to seed size (
Figure 1d). Seed P concentration was also significantly variable in that set of soybean genotypes (
Figure 1b). The seed P concentrations for the varieties in this experiment ranged from 5.76 mg g
−1 to 6.79 mg g
−1 (
Figure 1b). Kyoto-Soy had by far the largest seeds. A group of five genotypes attained only half of its seed weight. The seed P concentrations were much less variable, but here Kyoto-Soy also showed a high value. Consequently, the seed P content was also highest with that genotype. Generally, the seed P content can be explained at 92% by seed weight (
Figure 1d).
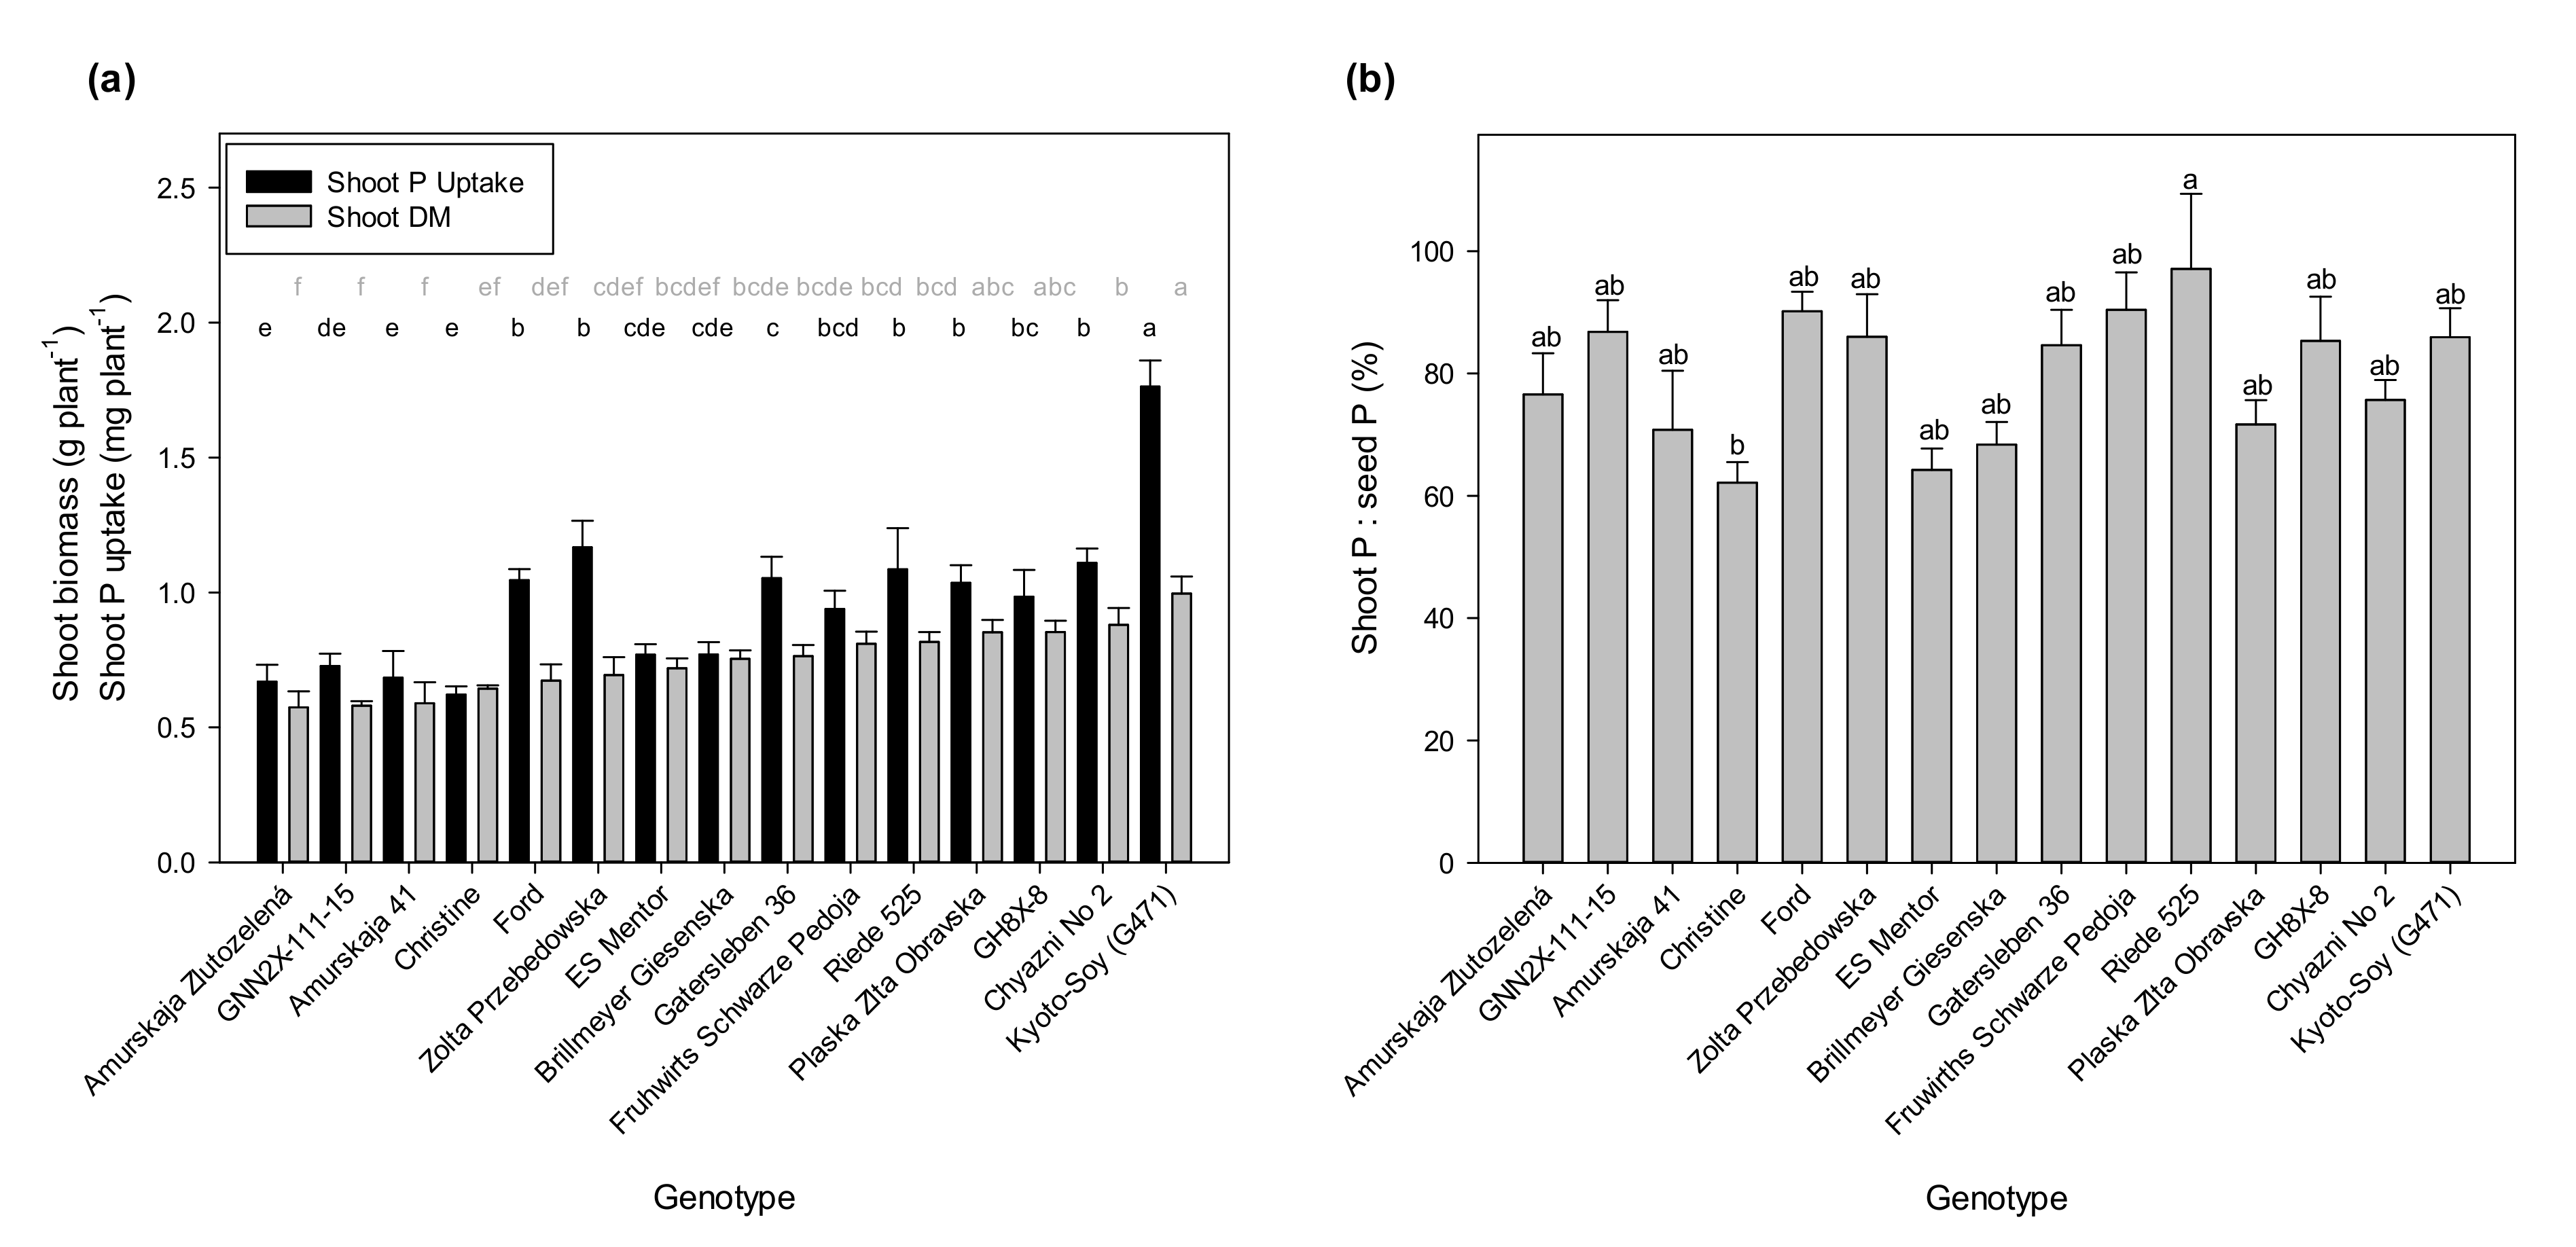
With regard to shoot P and shoot DM, we found a very high shoot P content again with Kyoto-Soy (
Figure 2a), which results also in the highest shoot P concentration (data not shown). Within a range of biomass values that were not statistically different, we observed significantly different shoot P uptake values. Comparatively high shoot P uptake results in relation to shoot DM were found with Ford, Zolta Przebedowska, Riede 525, and some others, while Christine, ES Mentor, and Brillmeyer Giesenska attained only low shoot P uptake in relation to their shoot biomass.
Figure 2b presents the contribution of the seed P content to the P uptake of the shoots. Despite significant differences for the ratio of shoot P uptake and seed P content 30 DAP (
p < 0.05), most of the genotypes had similar mean values for this ratio. A significant difference occurred only between the highest value at 97.4% for Riede 525, close to 100%, and the lowest for Christine slightly above 60%. These two genotypes differed not much in their seed P reserves (cf.
Figure 1c). On average, 79.7% of seed P was reflected by shoot P. This suggests a strong impact of the seed P reserves on the absolute P accumulation in shoots 30 DAP under comparatively low P availability from the soil.
Based on these results, we selected four genotypes for the second experiment, suggesting a high efficiency of P uptake, either from seed resources or from the soil. These were Kyoto-Soy due to its large seeds (with much P) and high shoot P concentrations, Riede 525 due to its high shoot P:seed P ratio and a comparatively high shoot P uptake, and also Ford and Zolta Przebedowska due to comparatively high shoot P uptake. Finally, ES Mentor was included as a widely known control genotype without obvious advantages or disadvantages in P efficiency. Zolta Przebedowska also had a substantially higher shoot:root ratio than ES Mentor (data not shown).
3.2. Experiment 2
The two-way ANOVA revealed significant main effects of genotype and P supply for shoot, root, and total plant DM, shoot:root ratio, shoot P concentration, shoot P uptake, total root length (TRL), root surface area (RSA), and shoot P:seed P ratio at 40 DAP. The interaction of main effects was significant for all variables except for shoot P concentration, shoot P uptake, TRL, and RSA.
Shoot DM was affected by the interaction of genotype and P supply. Comparisons of means under LP and HP separately show that Zolta and Kyoto were more productive than the other genotypes at LP, while at HP, Riede 525 and Kyoto produced more shoot biomass when compared to the least productive genotype Ford (
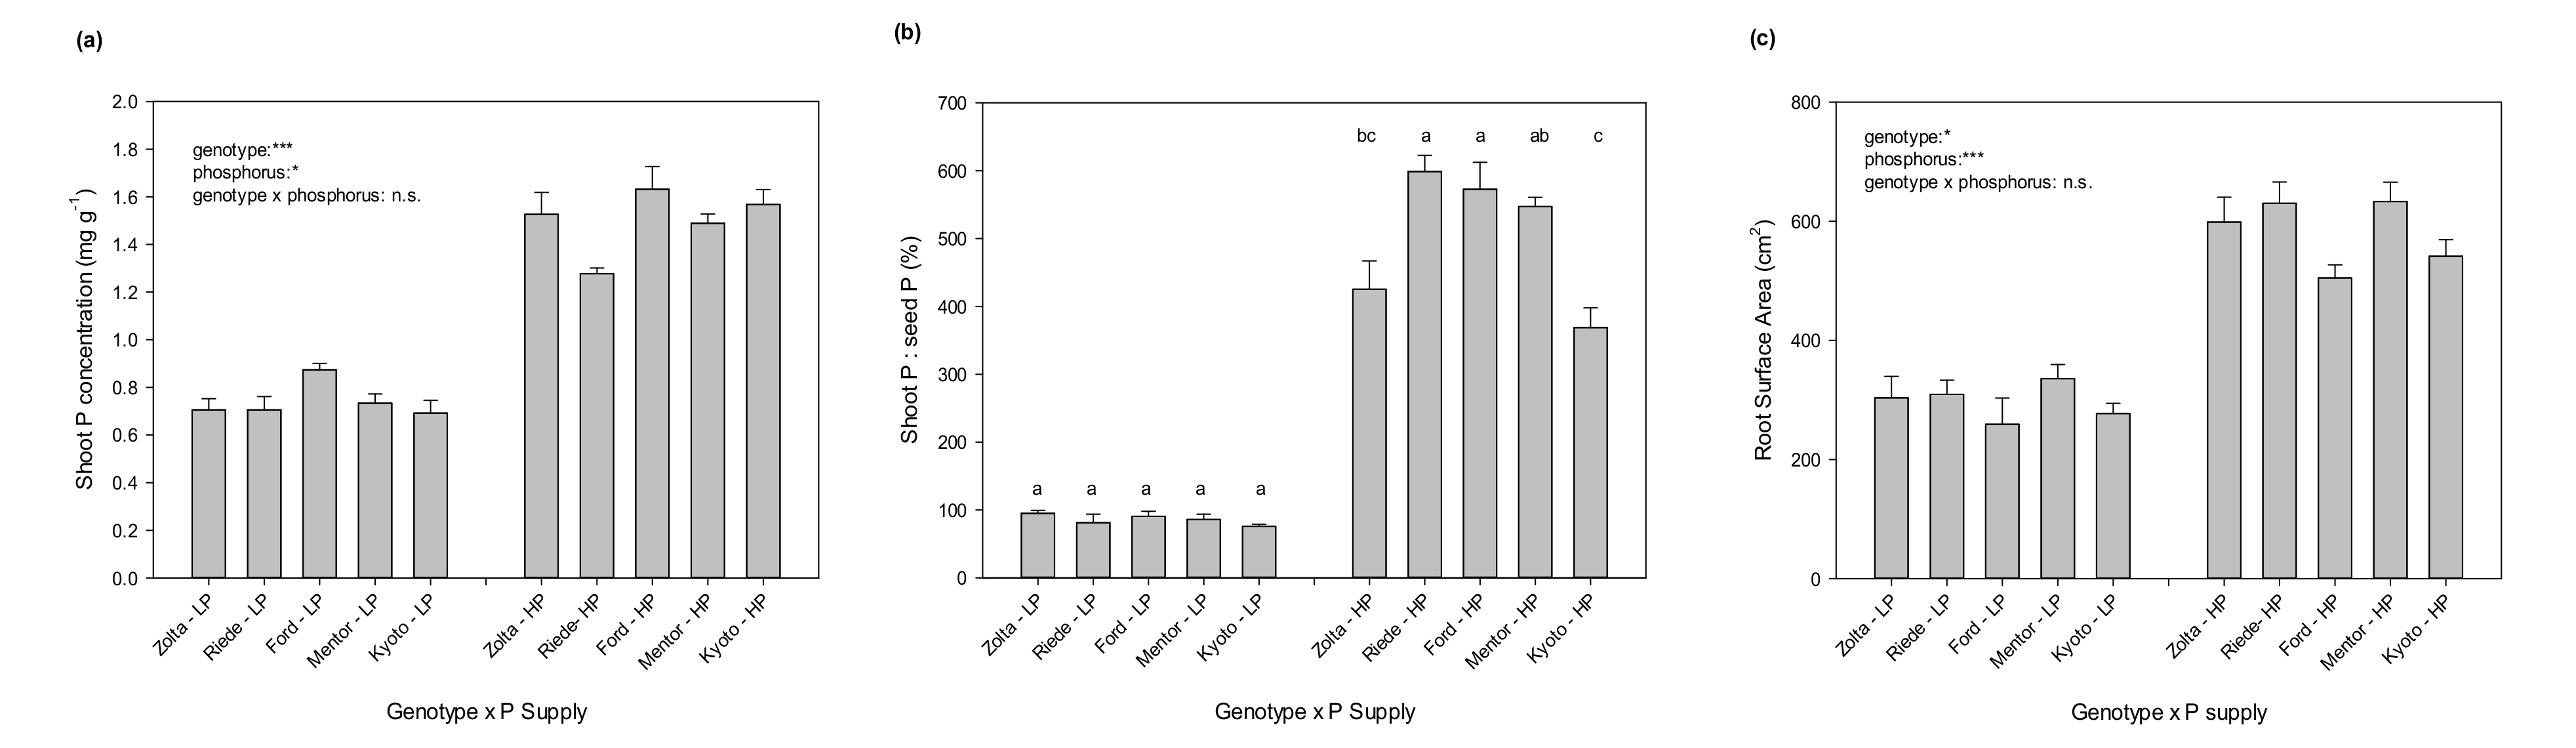
Figure 3a). Nevertheless, a similar pattern was repeated at both LP and HP among the genotypes regarding shoot DM, except for genotype Riede 525 at HP, which showed a better growth response to P application. Results similar to the shoot DM pattern also apply to genotypic variations in shoot P uptake, and Riede 525, despite the higher shoot DM, also falls within that trend. This suggests that the higher level of biomass accumulation of Riede 525 at HP occurred at the cost of P dilution in the shoot tissues, which is confirmed by the P concentrations (
Figure 4a). The opposite of a dilution effect, i.e., a generally increased P concentration, can be seen in Ford, where less biomass accumulation went along with significantly higher P concentrations when compared to the other genotypes, especially with Riede 525 at HP. However, the variations in the shoot P components, i.e., shoot DM and shoot P concentration, in Riede 525 and Ford at HP compensated each other, and therefore the trend of shoot P uptake of all genotypes was similar at LP and HP without an interaction effect.
The interaction of genotype and P supply also affected root biomass accumulation (
Figure 3b). Similar to the shoot DM, the trends of genotypic variations of root DM at LP and HP were also different. Considerable variation in root DM can be observed at HP, while at LP, differences were not significant. Similar to the case of shoot DM at HP, the highest and lowest root DM accumulation at HP was found with Riede 525 (also ES Mentor) and Ford, respectively. Riede 525 especially showed a strong positive root growth response to elevated soil P supply, compared to its low value at LP.
As presented in
Figure 3c, shoot:root ratio was substantially lower in plants grown in P limited substrate. Larger shoot:root ratios at HP are due to a relatively greater increase in shoot growth than in root growth with P application. On average, the soybean genotypes at HP accumulated 2.99-fold more biomass in the shoots when compared to LP, while the increase in root DM due to high P supply was only 1.83-fold. Lowest shoot:root ratio was observed in ES Mentor at both HP (different from Ford and Kyoto) and LP treatments (different to Zolta and Kyoto). The highest shoot:root ratio under HP occurred in Ford and Kyoto, while, under LP, Kyoto had a higher shoot:root ratio compared to all other genotypes.
Total DM of plants, which is the sum of root and shoot DM 40 DAP (
Figure 3d), was also different between the two P supply levels and followed, genotypically, the same trend of variations as shoot DM, with identical statistical groupings. In spite of the strong positive correlation of seed size with shoot DM at LP (
r = 0.99;
Figure S1a), the strength of the relationship of the same variables at HP was weak and nonsignificant. Similarly, strong positive correlations of seed P content with shoot DM at LP were also recorded (
r = 0.96;
Figure S1c), whilst the strength of the relationship of the same variables at HP was again weak and nonsignificant. The relationships of root DM with seed size and seed P content were not significant at both LP and HP treatments (
Figure S1b,d).
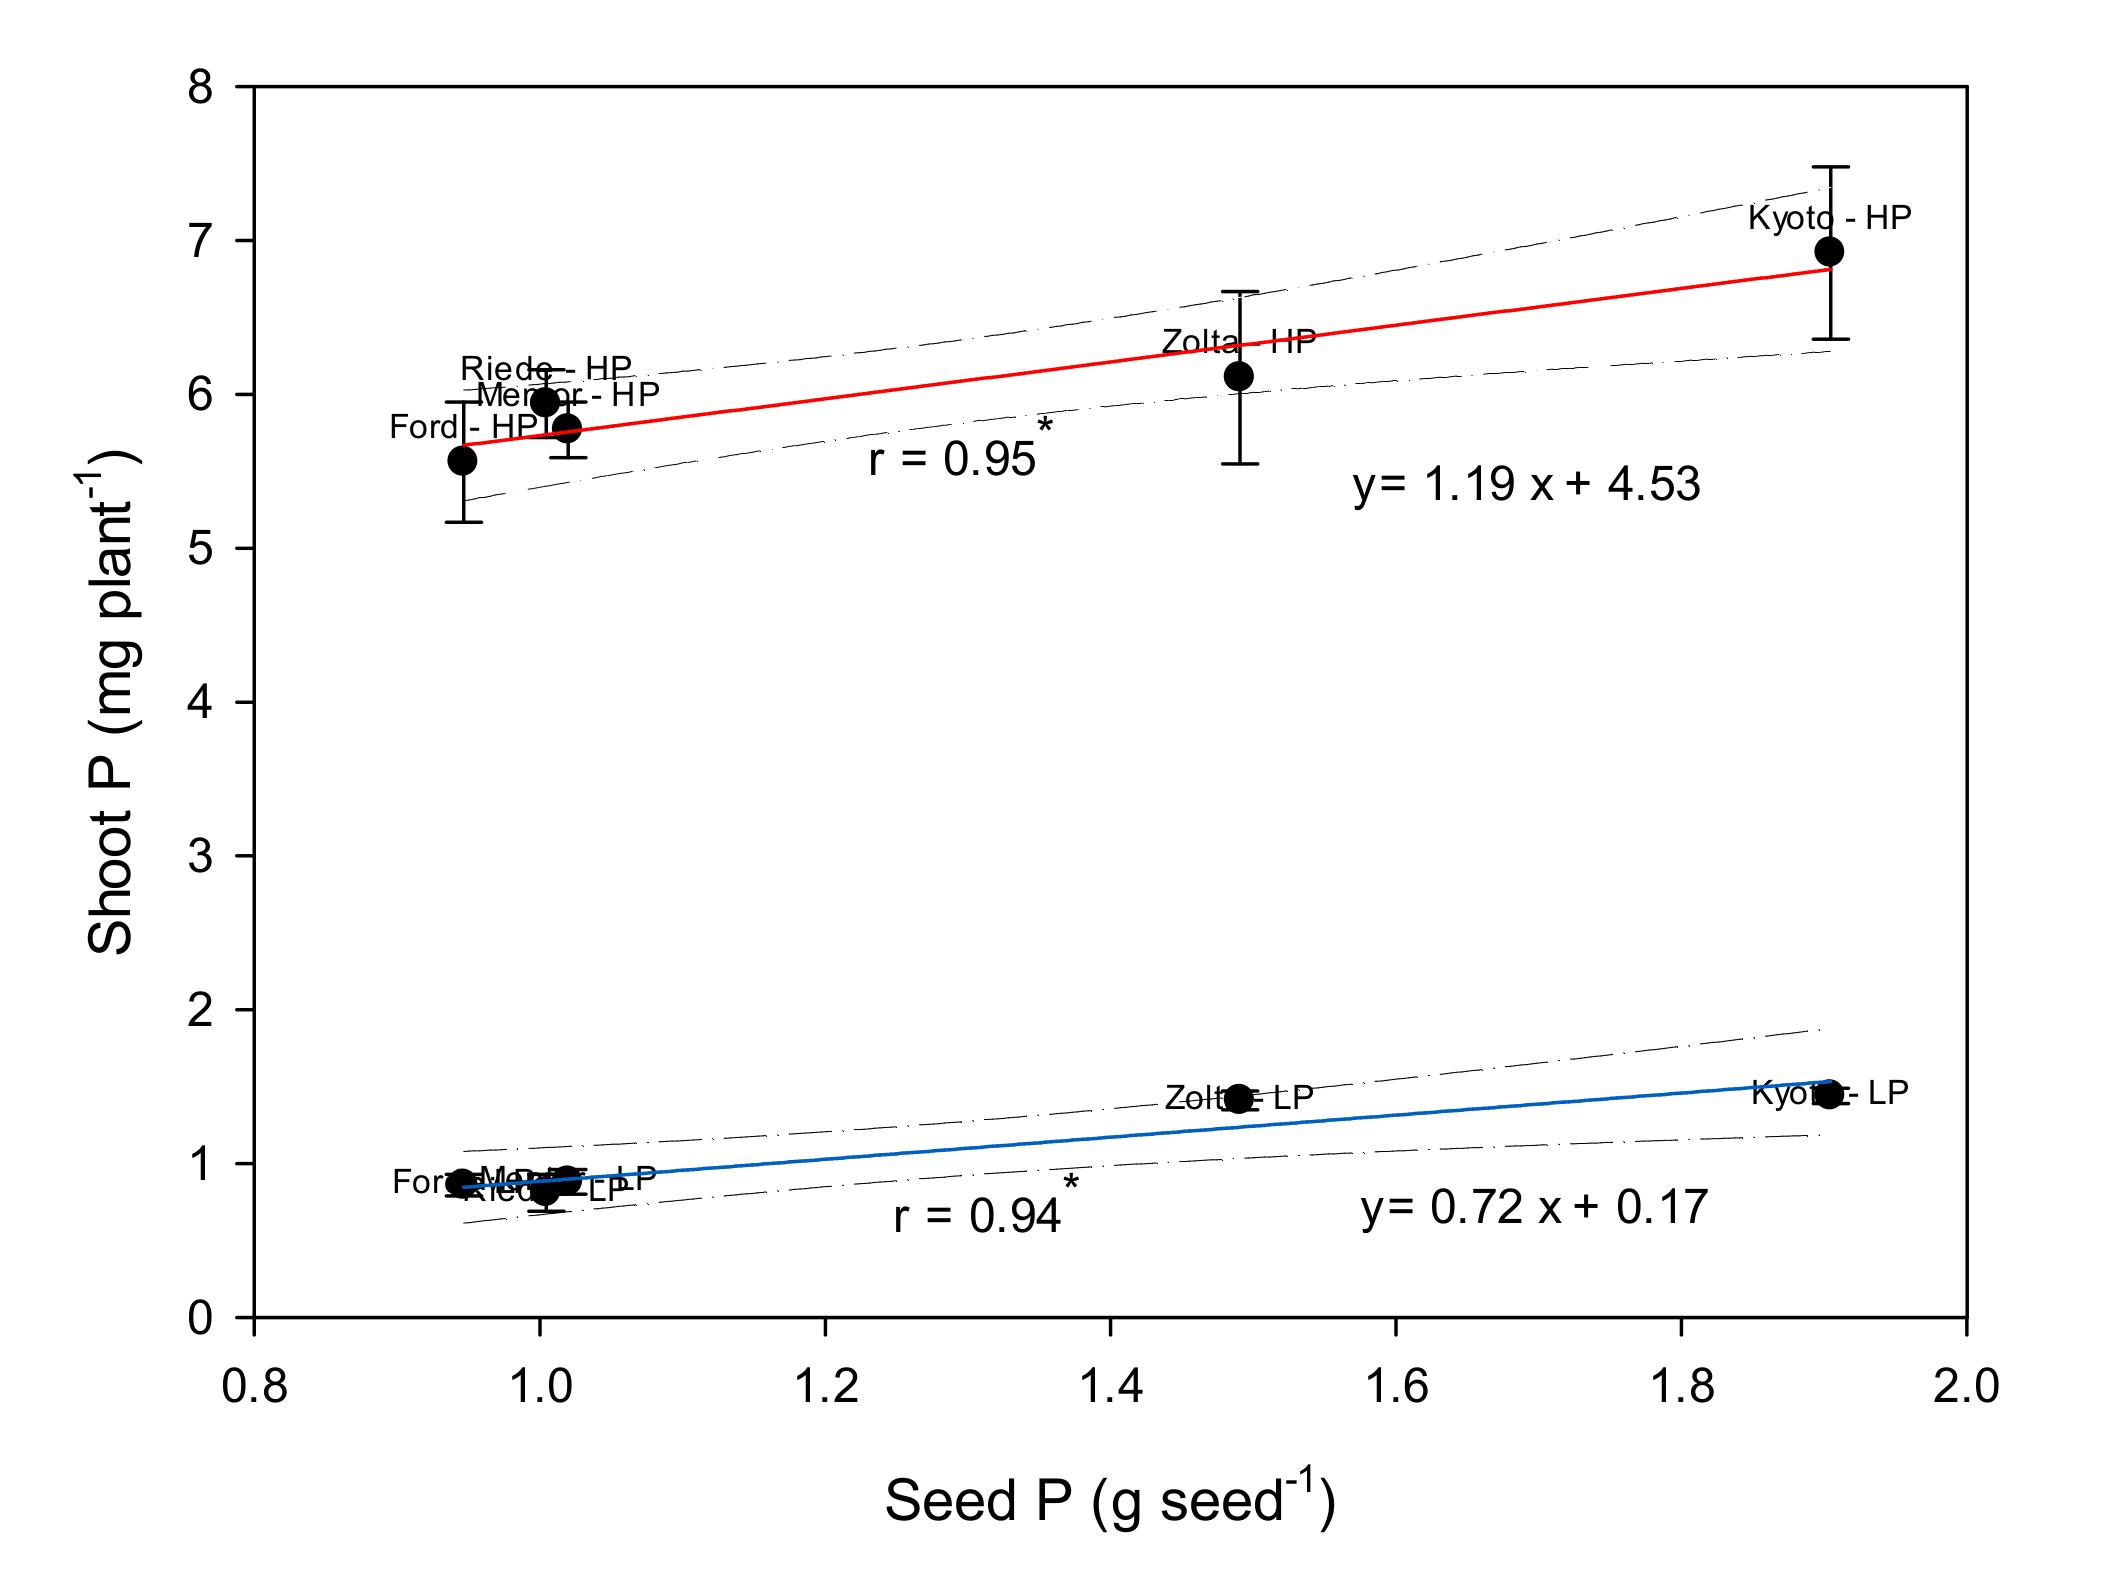
We have calculated linear regressions of shoot P on seed P to estimate the function parameters (
Figure 5). The slope can be interpreted as an indicator of the amount of shoot P that was taken up per unit of seed P. This parameter was significant for each P supply level (1.19 and 0.72 for HP and LP, respectively). Obviously the regression slope at HP was 1.48-fold that at LP. Additionally, it was above or below 1 for HP or LP, respectively. This underlines the importance of seed P for shoot P uptake for both low and high P supply conditions, but with a stronger increase of shoot P per unit of seed P at elevated soil P supply.
The average shoot P:seed P ratios at LP and HP were 86% and 503%, respectively (
Figure 4b). At LP, the ratio shoot P:seed P was close to 1:1 and without genotypic differences, underlining the importance of seed P in fulfilling the P requirements of the young soybean plants under P starvation. However, a clear variation existed among genotypes at HP. Here, Riede 525 and Ford showed much larger shoot P:seed P ratios when compared to Zolta and Kyoto, and ES Mentor also had a higher proportion than Kyoto. Riede 525 attained the highest proportion of shoot P:seed P also in experiment 1 at a moderate P supply level (cf.
Figure 2b), indicating that Riede 525 (followed by Ford and ES Mentor) will be efficient in soil P acquisition unless the P stress is very severe.
Root surface area (RSA) differed between P supply levels (
p < 0.05) and genotypes (
p < 0.001), but no significant interaction was observed (
Figure 4c). RSA at HP was about double as high as at LP, and Ford and Kyoto showed lower RSA values than the rest of the genotypes, both at LP and HP. The results for total root length (TRL) were about the same with regard to statistical significances and treatment pattern (data not shown). Both TRL and RSA do not contribute significantly to explain the differences in shoot P content among genotypes at either P level (
Figure S2). However, there are obviously positive effects of TRL and RSA on P uptake related to the different P supply levels.
4. Discussion
The soybean genotypes used in this study showed variability for all measured traits, including biomass productivity and aboveground P uptake, which offers a potential to enhance the P status of soybean plants on widely spread P-deficient soils by cultivar selection and breeding. In experiment 2, the effect of P supply on all traits was significant as well, implying that the P deficiency stress was applied beyond the threshold and for long enough to cause a significant growth limitation. Since the soil P concentration in experiment 1 can be classified as comparatively low, we can assume that plants in experiment 1 also grew under limited P supply, which is supported by the average shoot P:seed P ratio of 80%, very similar to 86% with LP in experiment 2. Finally, the significant interactions found in experiment 2 indicate differences among genotypes in response to phosphorus availability, although the important trait of P uptake did not show that interaction.
4.1. The Importance of Seeds for Plant P Supply
The seed P concentration in the tested genotypes ranged from 0.58% to 0.68%, which is within the range of seed P concentrations previously reported by [
7] for other soybean genotypes (0.37% to 0.74% P). Our study confirms the close correlation between soybean seed weight and seed P content among a set of 15 genotypes with substantial variation in seed size (146–304 mg per seed). [
6] and [
7] have also reported that significant differences for seed P content among genotypes of soybean derived mostly from the variation in seed DM, as opposed to seed P concentration.
[
7] found a moderate correlation of seed size with shoot DM (r = 0.75) and shoot P content (r = 0.74) in soybean plants under low P supply. For cow pea, it was also proven by [
25] that seed size had a significant effect on shoot and total plant DM. We observed close correlations of seed size and seed P with shoot dry matter, but only under LP conditions. This indicates an advantage of large-seeded genotypes or seed lots under low soil P supply. Seed P, however, showed significant positive correlations with P uptake at both LP and HP, which underlines the importance of seed P content for improving P acquisition in soybean prior to anthesis. However, the absolute P uptake at HP was much larger than the seed P stock, which suggests a minor role of seed P for plant growth at HP, while plants at low P showed P uptake values quite similar to the seed P reserves (shoot P:seed P of about 80–86%). However, neither seed size nor seed P had any positive effect on root growth.
According to previous studies, it takes four weeks until the percentage of total plant P which has been taken up by roots gets appreciable [
4]. [
26] also showed that in maize, with even smaller seed P content, the seed P alone can be enough for maximal seedling growth under low P phytoavailability for 4 weeks. Later on in that study, genotypes with faster root establishment could quickly complement seed P content by root uptake. It should be mentioned that the overall shoot P concentration in our experiments was always below 2 mg P g
−1 DM even at HP, which has been defined by [
27] as critical tissue P concentration, indicating that the plants presumably faced early stages of P-deficiency stress. One should also be aware that the seed P effect on shoot biomass accumulation is confounded with effects of other nutrients which are also supplied by the seed reserves. The small differences between genotypes in P concentration that we found (cf.
Figure 1b) suggest that concentrations of different mineral elements do not vary much between genotypes.
4.2. The Importance of Roots for Plant P Supply
Among root traits, we found differences in root DM, TRL, and RSA between the 15 genotypes in Experiment 1. [
28] indicated that large seeds are superior to small seeds not only in plant shoot, but also in root weight, which we cannot confirm (cf.
Figure S1). Among the five selected genotypes in experiment 2, we observed important differences in root DM only under HP conditions, while TRL and RSA showed only main effects.
Shoot:root allometry differed between genotypes and the ratio decreased under P starvation, which might indicate a strategy to enhance the plant P status by fostering root growth. This is in accordance with [
29], who stated that P supply makes the root system more extensive but enhances shoot growth to a larger degree, which widens the shoot:root ratio. [
7] also found that the root:shoot ratio (the reverse index) was generally higher at low P supply. However, other reports, such as [
30], state that severe P stress does not affect soybean shoot:root allometry, as opposed to sunflower and maize. In our study, ES Mentor had the lowest shoot:root ratio both at LP and HP, but not all genotypes increased that ratio to the same degree at HP, and Ford’s value at HP was higher than those of the other genotypes. It can be hypothesized that, with little P available in the substrate, more root growth might increase P acquisition, but at the price of more metabolic costs for soil exploration. This may have consequently caused the lower slope of the regression line between shoot P and seed P at LP, compared to the HP treatment (cf.
Figure 5).
[
31] suggested that RSA is a better measure of the absorptive capacity of a root system than TRL in soybean, but we observed very similar response patterns of both traits for genotype and P supply effects. The HP treatment increased RSA and TRL substantially, but we found no increasing differentiation of RSA and TRL among genotypes with an increase in phytoavailable P, similar to [
32]. In contrast, [
33] observed a larger total root length under very low P supply (4.6 mg P kg
−1), compared to a moderate P supply level (32.3 mg P kg
−1), in field-grown soybean. [
34] reported that P deprivation does not necessarily result in a significant root length decrease in legume crops such as cowpea. [
35] found that increasing the soil fertility level from 50% to 100% of the conventionally recommended rate increased the RSA in soybean by 79.2%, but an additional increment in fertilizers by 50% decreased the RSA. This suggests an optimum relationship of P supply and RSA.
Eventually, the root traits could not help much to explain differences between genotypes in shoot P content at either P supply level, suggesting that the differences in root morphological traits, which might result in different shoot P acquisition, are mostly covered up by the stronger effect of seed P, at least under P starvation until 40 DAP. Other studies, however, on rice suggest that root P uptake starts very early after germination and contributes substantially to seedling P supply [
36,
37]. The missing dependency of P uptake on TRL and RSA might be due to the comparatively short duration of the experiment. We know from [
38] that in other crops such as wheat and canola, with much smaller seeds and seed P content, significant positive correlations between the shoot P uptake and root length at 8 and 12 weeks after planting can occur. Additionally, the chosen experimental setup with the use of fertigation in comparatively small pots might be a reason why plants having more root contact surface with the substrate do not necessarily show higher shoot P uptake, while such a correlation could be expected in a field experiment with conventional fertilizer application to the soil surface. [
39] point to the importance of root hairs and fine roots (<0.05 mm diameter), which are most decisive for P acquisition but were not included in the present study.
4.3. The Importance of Genotypes for Plant Growth and P Uptake
Based on a subset of five genotypes with different seed size and comparatively high potential P acquisition, we have found variation in biomass and P accumulation before anthesis in the aboveground organs and, to a smaller extent, also at HP in roots. Elevated values for shoot P:seed P ratio at HP in Riede 525, Ford, and ES Mentor imply that these genotypes gained more profit from the P applied to the substrate. However, this variation could be hardly explained by differences in root traits, as indicated above. Nevertheless, Riede 525 and ES Mentor developed more root DM and longer roots (TRL) at HP than the other genotypes.
Genotypes Kyoto and Zolta Przebedowska, which had larger seeds and more seed P content, accumulated more biomass and relatively more P in their shoots under deficient soil P conditions (LP). This could, in reference to [
13], be interpreted as low P-tolerant or, in reference to [
12], as P-efficient, but the reason was presumably the larger seed size. The differences between genotypes in growth and P uptake, however, were more pronounced at high P phytoavailability (HP) than at LP. Riede 525 accumulated disproportionately more biomass in the shoot at HP and, to some extent, ES Mentor did so as well. This is also extendable to root DM and total DM, where Riede 525 and ES Mentor benefited most from the P application. The results suggest to classify the genotypes, with regard to early aboveground biomass accumulation, into two groups: (i) genotypes with relatively higher shoot DM at LP (in the present study, Zolta Przebedowska and Kyoto) might be considered as low P-tolerant due to high seed P reserves, while (ii) those with more shoot DM at HP (here: Kyoto and Riede 525, also to some extent Zolta Przebedowska and ES Mentor) will be the more P-efficient genotypes. The elevated early biomass accumulation in Riede 525, however, exceeded the level that can be explained by higher seed P reserves and was at the cost of P dilution, i.e., a low P concentration in the shoot tissue. The opposite of dilution, i.e., a comparatively high phosphorus concentration, was found in Ford at HP, where less biomass accumulation resulted in a significantly higher concentration of P when compared to Riede 525. The tendency of high accumulation of phosphorus in the shoot of the genotype Ford is in accordance with our findings in the first experiment, where Ford accumulated more P in the shoot compared to other genotypes within a range of similar aboveground biomass production (cf.
Figure 1).
5. Conclusions
The tested soybean genotypes varied much in seed size and thus seed P content, while seed P concentrations differed only to a smaller extent. The shoot P accumulation relied, to a large degree, on seed P reserves during the vegetative growth period in the case of low P soil supply. In case of high P soil supply, however, the role of seed P is negligible with regard to absolute P uptake. Yet, a very close linear relationship between seed P and shoot P uptake was also confirmed at high P. Some genotypes reacted more positively than others on an elevated P supply (HP) in biomass production of shoot and root, and in P uptake, but none of the selected genotypes showed an outstanding biomass production or P uptake under low P supply. Although a clear positive effect of high P supply on root traits and P uptake was observed, total root length and root surface area of soybean did not explain differences in P uptake between genotypes at either P supply level. Overall, no substantial genotypic differences were observed in P use efficiency under P deficiency apart from the effect of seed P reserves. Due to the close correlation with seed P, seed size can be considered an important trait when screening genotypes for fast, early P accumulation and growth. Apart from plant breeding, this finding is particularly relevant in seed production, as seed lots with larger seed size could be utilized to achieve rapid canopy development in stressful environments and for better weed competitiveness of soybean.


