Article

Environmental Assessment of Furrow vs. Drip Irrigated Pear (Pyrus bretschneideri Rehd.) Production Systems in Loess Plateau (China)

1
College of Resources and Environment, Academy of Agricultural Sciences, Southwest University, Chongqing 400716, China
2
Interdisciplinary Research Center for Agriculture Green Development in Yangtze River Basin, Southwest University, Chongqing 400716, China
3
Monitoring Station of Soil Quality and Ecology of Purple Soil in TGR Area, Ministry of Education, Chongqing 400716, China
4
State Cultivation Base of Eco-Agriculture for Southwest Mountainous Land, Southwest University, Chongqing 400716, China
5
College of Horticulture, Gansu Agricultural University, Lanzhou 730070, China
6
School of River and Ocean Engineering, Chongqing Jiaotong University, Chongqing 400074, China
*
Author to whom correspondence should be addressed.
These authors contributed equally to this work.
Agronomy 2021, 11(6), 1201; https://doi.org/10.3390/agronomy11061201
Submission received: 29 April 2021 / Revised: 8 June 2021 / Accepted: 9 June 2021 / Published: 12 June 2021

Abstract

:
Irrigation systems increase fruit yield of water shortage orchards in semiarid and arid lands, but their environmental impacts remain unclear. This study carries out a comparative cradle-to-gate life cycle assessment (LCA) of the furrow and drip irrigated pear production systems in the Loess Plateau of China based on 2009–2018 inventory data from integrated experimental stations. The water depletion (WD), water footprint (WF), global warming (GWP), acidification (AP), and eutrophication (EP) potentials of the furrow and drip irrigated pear production systems were calculated and compared, including the orchard installation phase (phase I), primary growing phase (phase II), low production phase (phase III), and full production phase (phase IV). Results indicated that the cumulative WD, GWP, AP, and EP of the drip irrigated system were 148.3 m3, 130.1 kg CO2-eq, 0.9 kg SO2-eq, and 0.6 kg PO4-eq per ton of pear fruit harvest, respectively, which were 37.3–73.5% lower than those of the furrow irrigated system. The GWP, AP, EP, and WD of phase I to III contributed 39.3–46.1% in the drip irrigated system vs. 27.8–38.6% in the furrow irrigated system of the total amount, which should not be neglected in perennial orchard systems. The annual WFs were 0.9, 0.2, and 0.2 m3 kg−1 year−1 in phases II, III, and IV of the drip system, respectively, which were 50–71.4% lower than that of the furrow system. Green WF of furrow and drip irrigated systems were approximately the same, but the blue WF and grey WF of drip irrigation systems were 35.7–62.1% and 66.0–73.2% lower than those of the furrow irrigated system. The drip irrigated pear production system significantly mitigated environmental impacts and WFs, mainly due to reduced fertilizer application, water consumption, electricity, and diesel demand. Irrigation that changed from a furrow to a drip system was responsible for most environmental reductions, but 8% decreases of yields in phase IV. The outcomes from assessing the furrow and drip irrigated pear production systems could provide useful information for decision-making by the pear orchardists in the Loess Plateau.

1. Introduction

Improving global agriculture for food security to satisfy the burgeoning population growth and mitigating environmental impacts have become important goals in recent years [1]. With the improvement of people’s living standards, demands on grains, vegetables, and fruits in China have significantly increased [2,3]. In this regard, China has developed effective land-use policies (e.g., agrarian reform and the household responsibility system) for developing intensive agriculture, which has led to dramatic improvements in agricultural production and productivity over the last 50 years [4]. However, recent studies have demonstrated that Chinese intensive agriculture incurs substantial environmental costs, resource depletion, land and freshwater degradation [5]. In particular, China’s intensive fruit production systems are at high environmental risks due to the excessive application ratio of chemical fertilizers and large consumption of water [6,7,8,9]. Accordingly, it is imperative to evaluate the environmental impacts and water productivity of fruit production systems in China and searching for approaches to environmental potential mitigation, water-saving, and sustaining fruit productivity via improved orchard management strategies.
In the past 20 years, life cycle assessment (LCA) has been used to estimate the potential environmental impacts in a certain agricultural production system [10,11,12]. Researches have been conducted to qualify the total environmental costs and determine the main contributors of fruit product systems to identify mitigation strategies in fruit production and retail based on the LCA methodologies [6,13,14]. However, these works are mostly underestimated since they consider only the environmental impact of the full production phase [15]. In the direct selling supply chain of apple and peach production systems, the contribution to the environmental impacts of orchards in other phases (except for the full production phase) was 20–30%, which should not be neglected in perennial orchard systems [11]. Studies on environmental impact estimations of orchards in other phases are still lacking.
On the other hand, droughts have a negative effect on agriculture production and represent one of the most destructive climate disasters worldwide [16]. Due to economic development and population growth, the extensive land-use exchange for fruit cultivation (especially for apples and pears) on the Loess Plateau increases rapidly [17]. However, the Loess Plateau is located in northwestern China, characterized by a semiarid and arid climate and severe water shortages. In this regard, localized irrigation techniques (such as furrow, spray, and drip irrigation) have become increasingly popular methods to save water in intensive orchards because they more efficiently reduce deep percolation and evaporation [18]. Previous studies have demonstrated that drip irrigation systems can improve water use efficiencies by 17.2% in apple orchards and 17.6–24.6% in pear orchards of the Loess Plateau, respectively [19,20]. Although water-saving irrigation technologies could increase water use efficiency and yields, the water consumption and environmental costs during the material construction process for irrigation systems cannot be overlooked [21]. Nevertheless, such costs are rarely calculated because the construction of an irrigation project always occurs in the installation phase of an orchard.
The standard cultural practices in local pear production included annual artificial fertilization, flower, fruit thinning, bagging, pesticide management, and winter pruning. Additionally, there is an absence of multi-year LCAs comparing the environmental impacts under improved irrigation management of the fruit production systems in the Loess Plateau. The objectives of this study were to (1) evaluate the environmental impacts of furrow and drip irrigation pear production systems from the orchard installation to full production phase based on inventory data for ten consecutive years collected from integrated experimental stations on the Loess Plateau and (2) compare the main contributors for environmental potentials of the two irrigation systems and provide options for environmental mitigation, water-saving, and better orchard management.

2. Materials and Methods

2.1. Case Study Area and Weather

Baiyin city (37°12′6″ N, 104°02′04″ E) in Gansu Province of the Loess Plateau is characterized by temperate arid semiarid climate conditions and high soil erosion in the north temperate zone, with high evaporation rates and low precipitation. The average annual temperature, total hours of sunshine, and precipitation are 8.2 °C, 2726 h, and 206 mm, respectively (Table S1). This region is an important cultivation area for Huangguan pear (Pyrus bretschneideri Rehd. cv. “Huangguan”) and Zaosu pear (Pyrus bretschneideri Rehd. cv. “Zaosu”) production in the Loess Plateau due to its favorable natural weather conditions. The pear planting area and yield are 35,700 ha and 404,148 tons, respectively [22].

2.2. Description of Irrigated Pear Production Systems

In this study, the experimental demonstration site of furrow (4 ha) and drip irrigated (3.2 ha) pear orchard systems were set up in October 2009 by transplanting 2-year-old “Huangguan” grafted seedlings with the same frame of 1.5 m × 4 m in single ridging after the soil tillage by a diesel-guzzling rotavator. No control treatments were set up. The initial soil properties of the two experimental demonstration sites: pH 7.73, 10.71 g kg−1 SOC, 0.59 g kg−1 total nitrogen, 29 mg kg−1 available phosphorus, and 191 mg kg−1 available potassium in the furrow irrigation system; pH 7.63, 8.8 g kg−1 SOC, 0.40 g kg−1 total nitrogen, 23 mg kg−1 available phosphorus, and 152 mg kg−1 available potassium in the drip irrigation system. Therefore, the initial application amount of organic fertilizer in the drip irrigated system was higher than the furrow irrigated system. In addition, weed management was conducted in the late spring and medium summer after the flower and fruit thinning by the diesel-guzzling rotavator. After the leaves fall, the waste leaf litter and soil tillage were simultaneously operated by the same diesel-guzzling rotavator. After harvest and pruning branches in winter, the wasted paper bags were transported to the nearby recycle bin and power station for further recycling. To ensure the normal growth of pear trees and the harvest of fruit, irrigation management is indispensable. In the conventional furrow irrigation system, water is directly pumped into the furrows between trees. In recent years, subsurface drip irrigation management was carried out in some pear orchards. In drip irrigated systems, water is first pumped into PVC buckets and then allocated via drip pipes to the trees. The main pipes (with one pump per plot) of the drip irrigated orchards were placed crosswise, with the capillary pipes at the front of the plots. Two capillary pipes were laid between the rows near the pear trees (see the diagram in Figure S1). The irrigation amount and timing of the furrow or drip systems were scheduled to supplement rainfall and meet tree water requirements. The irrigation amounts for each phase per year are shown in Table 1. In mid-September, the mature pears were sold to the fruit purchase point near the orchard (less than 5 km). About 30% of the harvest pears produced by the furrow irrigated system or the drip irrigation system would be sold in the surrounding cities after packaging in the fruit purchase point. The remaining pears would be stored in the cold house for about five months and sold in batches around the spring festival across the country.

2.3. LCA Methodology

The LCA method in this study was designed as a series of four steps according to the ISO 14,040 and 14,044 standards [23,24], including system boundary and functional units, life cycle inventory analysis, selection of impact categories and emission parameters, and life cycle impact assessment.

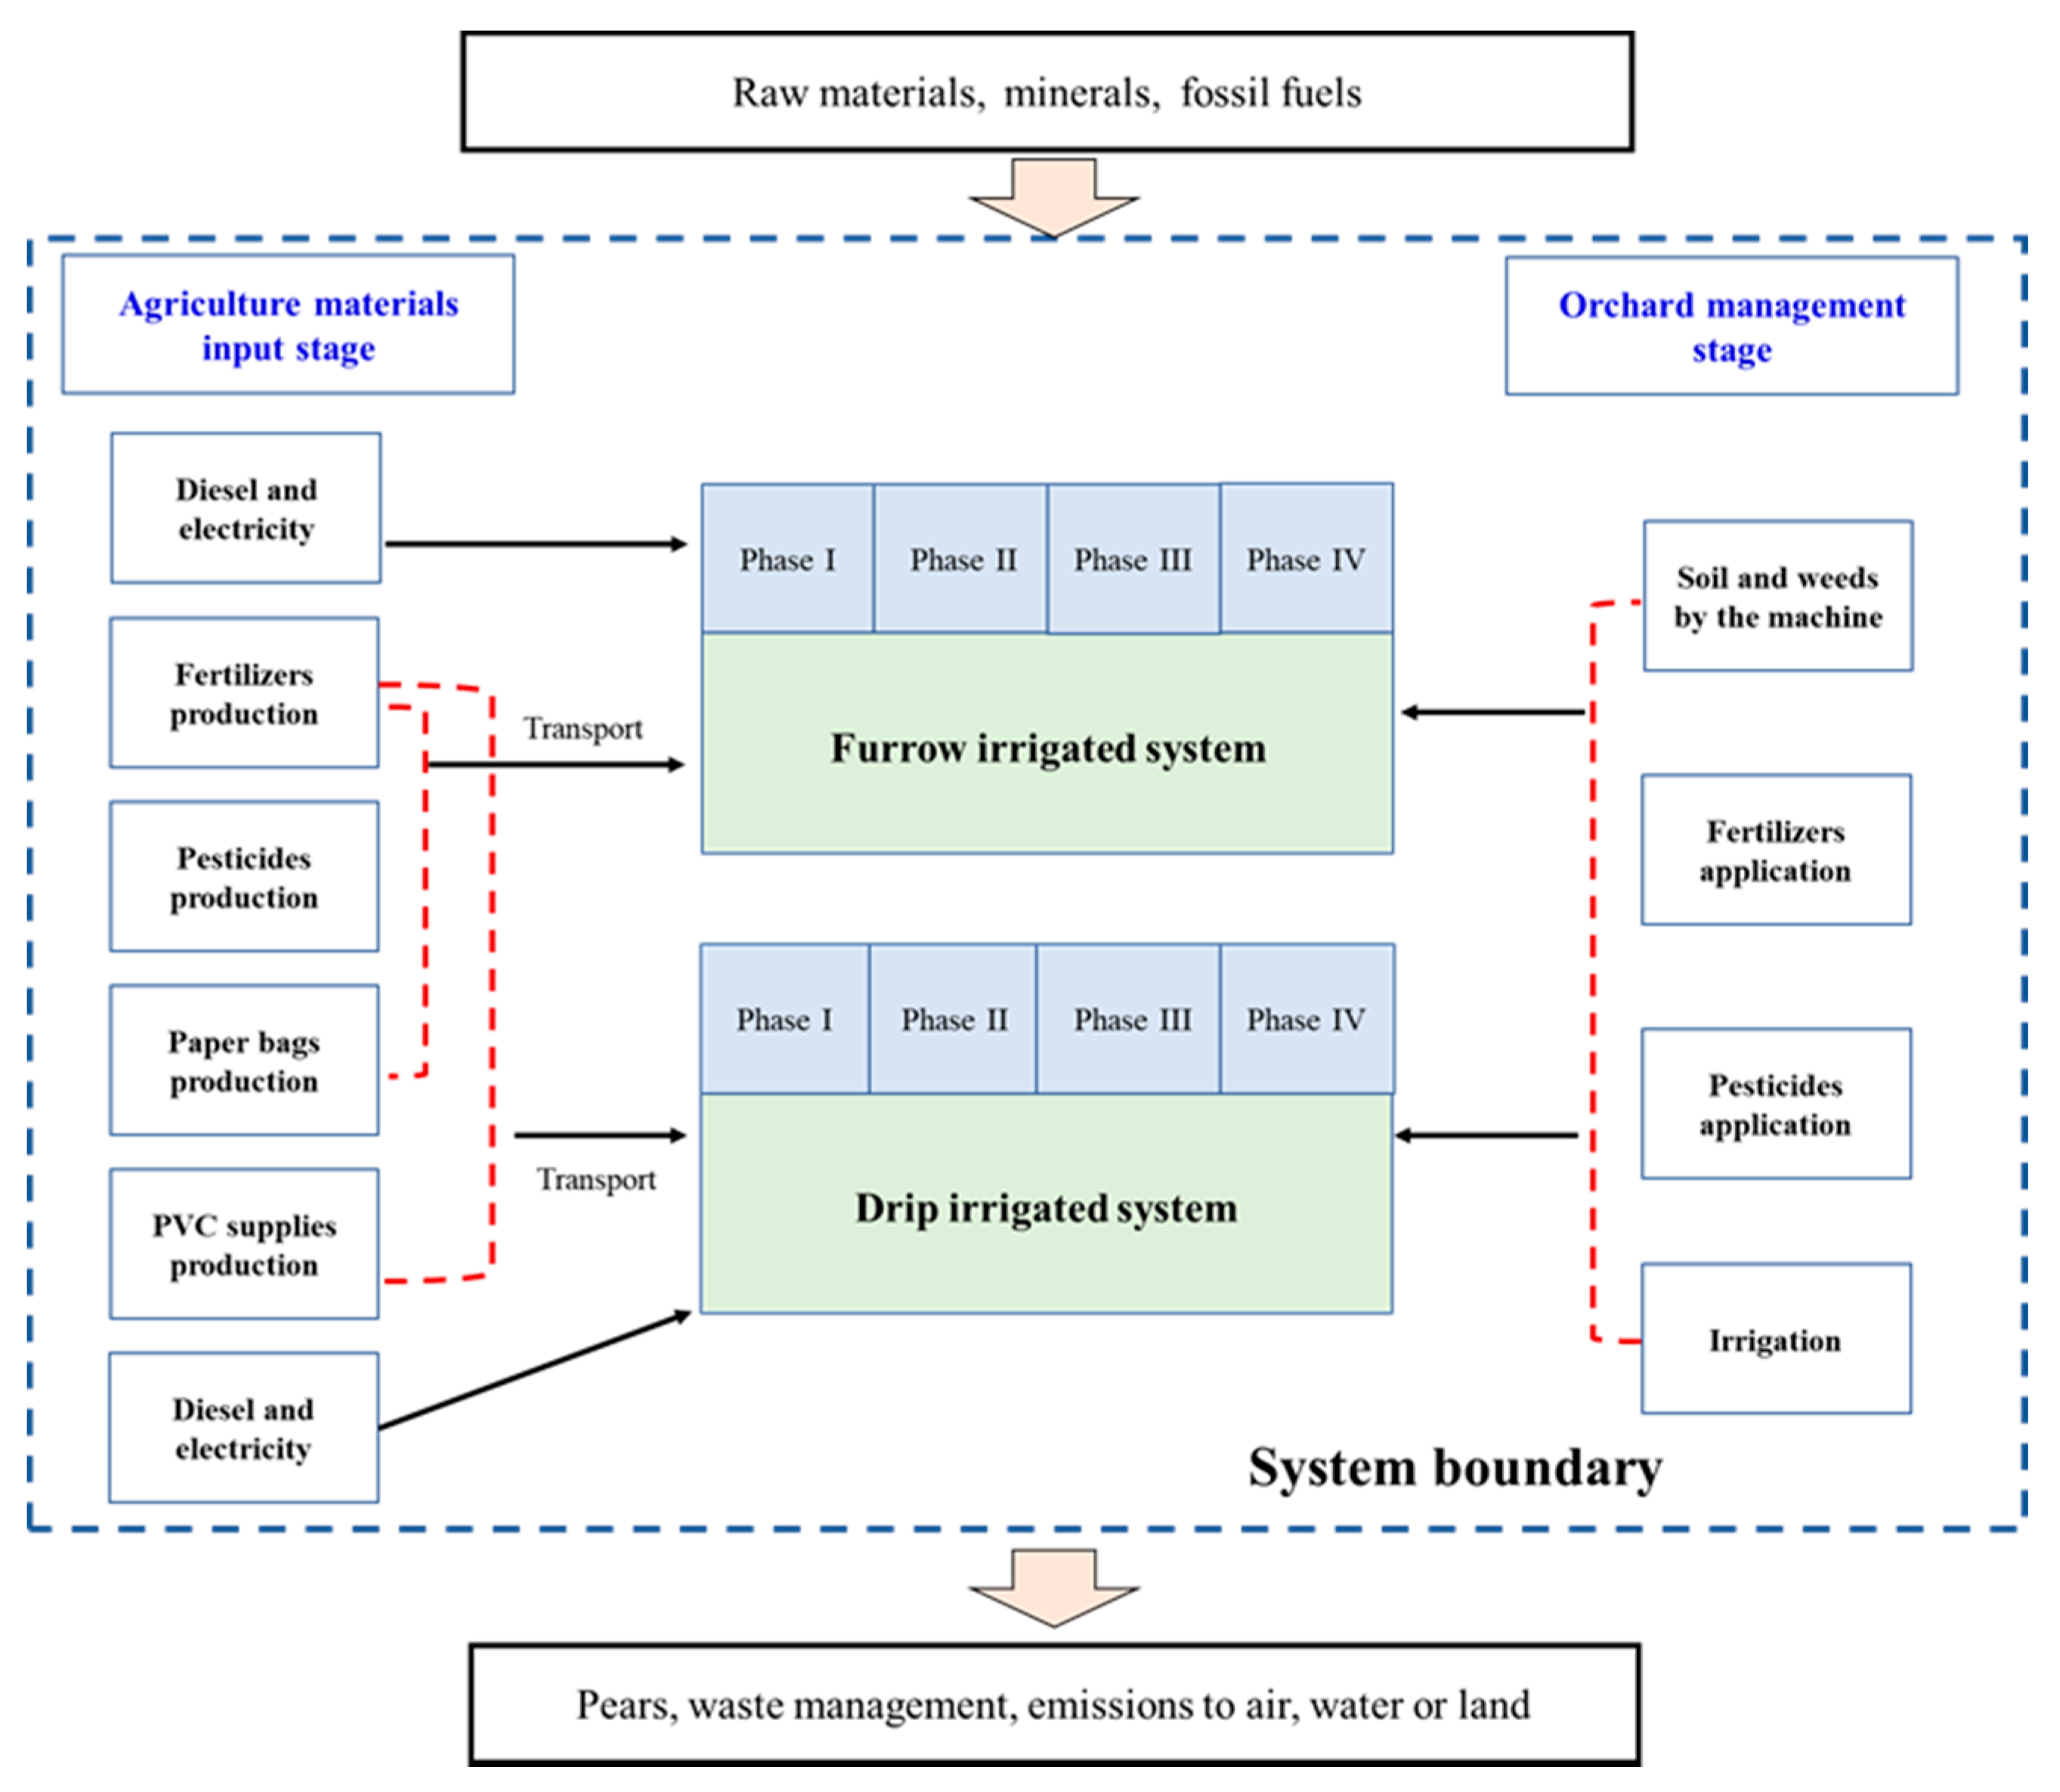
2.3.1. System Boundary and Functional Units

Contributions of the orchard phase in fruit production systems were identified most to the environmental impacts in the scenario of the direct selling supply chain [11,15]. The system boundaries in this study extended from the cradle to gate to identify different irrigated systems on the environmental impact, which only focused on pear production from the orchard installation phase to the full production phase. The environmental assessments of the “farm-to-consumption” between the furrow and drip irrigated systems were not considered in this study for the same processing steps. There were two subsets in the LCA analysis of the furrow and drip irrigated pear production systems (Figure 1). The first subset included the production and transportation of agricultural materials (AMS, fertilizers, pesticides, diesel fuels, and paper bags). The second subset included management and application of agricultural materials (OMS, fertilizer application, bagging, pruning, weeding, and pest management, diesel, and electricity consumption by different machines). As the fruit yield in phase I was 0, the impacts were expressed only as per ha, whereas the impacts of phase II to IV were expressed in both per hectare and per metric ton of pear production.

2.3.2. Life Cycle Inventory Data

The foreground data were extracted from the orchard managers’ annual production record manuals of the integrated experimental station by the modern agricultural industry technology system during ten consecutive years (2009–2018). The inventory data included the corresponding four phases of pear growth: orchard installation phase (Phase I) for one year, primary growing phase (Phase II) for two years, low production phase (Phase III) for two years, and full production phase (Phase IV) for five years (Table S2). Data about the cultivation and management of pear production were collected. In detail, the fertilization time and ratio, the amount of irrigation water and corresponding electricity usage, the pesticides and paper bags consumption in the fruit growing seasons, the diesel consumed by diesel-guzzling rotavator, and the amount of PVC pipes and buckets used in the drip irrigated system are recorded in Table 1. The additional background data included the transportation of pesticides, paper bags, diesel, and PVC and the waste of leaf litter, paper bags, and pruning branches. Through the investigation in the agricultural supply stores near the orchard, the average transportation distance of agricultural materials above was postulated 50 km. Furthermore, the waste leaf litter was simultaneously operated with the soil tillage by diesel consumed machines in the autumn. The wasted paper bags (assumed as 100% recycling) and pruning branches were transported to the nearby recycle bin (10 km) and power station (20 km), respectively.

2.3.3. Selection of Impact Categories and Emission Parameters

For comparing the environmental costs and water productivity of the furrow and drip irrigated pear production systems, GWP, AP, EP, WD, and WFs affected by different irrigation practices were selected and calculated. The emission parameters of the foreground data were collected from published papers based on related indicators for furrow and drip irrigated fruit production systems in semiarid and arid lands (see details in Tables S3–S5). The environmental potentials calculated by the LCA from the local and latest emission factors could ensure the calculation accuracy of results. The emission parameters of background data on the transportation of agricultural materials and wastes by agricultural tractors were extrapolated from the Ecoinvent database v3 in Simapro 5.2 (2016).

2.3.4. Life Cycle Impact Assessment

The calculation of GWP over 100 years was based on formulas from the fifth assessment report of the Intergovernmental Panel on Climate Change [25]. The AP and EP were calculated by the EDIP97 method [26].
The formulas for the estimation of impact categories in each phase were as follows:
EIi = EIAMS-i + EIOMS-i
EIAMS-i = ∑ (APAMSi-j ×EPAMSi-j)
EIOMS-i = ∑ (APOMSi-j ×EPOMSi-j)
In Formula (1), the EIi is the abbreviation for the environmental impacts of i, with i representing the GWP, AP, and EP, which expressed as kg CO2 eq, kg SO2 eq, and kg PO4 eq per hectare/ton of pear production, respectively, in the furrow or drip irrigated systems; EIi is accounted as the EIAMS plus the EIOMS, which represent the environmental impacts calculated in the subsets of the agricultural materials stage and the orchard management stage, respectively. In Formulas (2) and (3), the APAMSj and APOMSj are the abbreviations for the application amount of item j in the agricultural materials stage and orchard management stage, respectively. EPAMSj and EPOMSj are the abbreviations for the emission parameter of item j in the agricultural materials stage (Table S3) and orchard management stage (Table S4), respectively, with j representing the fertilizers application ratio (N, P2O5, and K2O) expressed as kg, pesticides (kg), paper bags (kg), pruning (kg), and PVC pipes and buckets amount (kg) used in the drip irrigated system, as well as diesel (L) and electricity (kWh) used in both systems. According to Huijbregts et al. (2000), and Deng and Wang (2003), the conversion of equivalent coefficients in this study were listed in Table S3 of the Supplementary Materials [27,28].
The cumulative emission amounts of different impacts were finally expressed as follows:
TEIi = EIphaseI × 1 + EIphaseII × 2 + EIphaseIII × 2 + EIphaseIV × 5
where TEIi is accounted as the total environmental impacts of i, with i representing the global warming potential (kg CO2 eq), acidification potential (kg SO2 eq), and eutrophication potential (kg PO4 eq) and divided by the total hectare/tonnage of pear production from the orchard during 2009–2018.

2.4. Water Depletion (WD) Calculation

The WD was defined as the real tree evaporation, which was estimated by the method of Howell (2001) [29]. The seasonal WDs of the furrow and drip irrigated systems were calculated as follows:
WD = Peff + Ir + SWD + C − R − Dr
where WD is the water depletion during a growing season (m3 year−1) per hectare/ton of pear production. Peff is the precipitation data collected by the local meteorological station. Ir is the field irrigation volume by the furrow or drip systems, which was based on the local water demand during the growing season of pear trees. The soil water depletion (SWD) represents the difference between the initial soil water content and the final soil water content at 2 m depth. The runoff (R) in pear orchards was negligible because of the limited rainfall in the Loess Plateau and the large water holding capacity of the root zone soil. Furthermore, Dr and C are the drainage and capillary rise, respectively, which were assumed to be zero since the groundwater was too deep at greater than 8 m below the soil surface in the pear orchards.
The total water depletion (m3 per unit) was calculated as follows:
TWD = WDphaseI × 1 + WDphaseII × 2 + WDphaseIII × 2 + WDphaseIV × 5
where TWD is accounted as the sum of water depletion (m3) during 2009–2018 and divided by the total hectare/tonnage of pear production in the furrow and drip irrigated systems.

2.5. Water Footprint (WF) Calculation

The WF of pear production results from the quantification of green, blue, and gray water volume components. In addition to the data sources listed in Table 1, the other crop and soil data are obtained from FAO (FAO, 1998) to estimate the WF. The crop evapotranspiration (ETC, mm), effective precipitation (Peff, mm), and irrigation requirement (i.e., the difference between ETC and Peff, mm) were estimated by the software CropWat 8.0 (http://www.fao.org/nr/water/infores_databases_cropwat.html, accessed on 12 June 2021). We used the crop coefficient reported by Zhang et al. (2018) to calculate the crop evapotranspiration [9]. Annual WFs represent different growing phases were calculated as the sum of WFs in each phase divided the corresponding years (i.e., phase II of two years, phase III of two years, and phase IV of five years, respectively) and finally expressed as m3 kg−1 year−1. Then, the green orchard water footprint (GWF, m3 kg−1 year−1) was calculated as follows:
GWF = 10 · min ( ET C , P eff ) / FY
where 10 is the factor to convert water depths (mm) into water volume per land surface (m3 ha−1). FY is the fresh pear fruit yield (kg ha−1).
The blue orchard water footprint (BWF, m3 kg−1 year−1) was calculated as follows:
BWF =   max ( 10 · ( ET C P eff ) , I ) / FY
where I represents the irrigation (m3 ha−1). FY is the fresh pear fruit yield (kg ha−1).
The gray orchard water footprint (GRWF, m3 kg−1 year−1) was calculated with the following formula:
GRWF= a·AR/FY·(Cmax − Cnat)
where a is the leaching-runoff fraction (see detail in Table S4), AR is the nitrogen application rate to the pear orchards (kg N ha−1), FY is the fresh pear fruit yield (kg ha−1), Cmax is the maximum acceptable concentration, with a value of 10 mg L−1 for N as suggested by the Environmental Protection Agency, and Cnat is the natural N concentration, which was assumed to be zero due to lack of data.

2.6. Sensitivity Analysis

The results of environmental impacts and water footprint calculated in this study could be directly affected by parameters of the reactive nitrogen losses (ammonia volatilization, N2O emission, and nitrate leaching). In addition, the reactive nitrogen losses could be easily influenced by the amount of nitrogen applied and irrigation frequency in the actual orchard management. Thus, a scenario model was conducted to estimate the influence on the environmental impacts and water footprint by decreasing 10% of the reactive nitrogen losses emission parameters [30,31,32]. The sensitivity analysis was constructed by the same inventory data in Table 1 of the full production phase.

2.7. Statistical Analysis

Excel (Microsoft Corporation, Washington, DC, USA) and SimaPro 5.2 (PRé Sustainability, LE Amersfoort, the Netherlands) were used to collate and calculate the data. One-way analysis of variance (ANOVA) was analyzed the differences between irrigation systems by using SPSS 16.0. Duncan’s new multiple range (SSR) tests were employed to identify the significant differences (p < 0.05). Origin Pro 2020 (OriginLab Corporation, Northampton, MA, USA) was used to draw the figures.

3. Results

3.1. Input and Output of Furrow and Drip Irrigation Pear Production System in the Loess Plateau

The inputs of agricultural materials of the furrow and drip irrigation pear production system in the surveyed area are summarized in Table 1. Compared to the furrow system, the drip irrigated system is treated with a slightly higher amount of total fertilizer in phase I (626 kg N ha−1, 125.1 kg P2O5 ha−1, and 305.7 kg K2O ha−1 per year in drip irrigation vs. 402.9 kg N ha−1, 72.3 kg P2O5 ha−1 and 182.5 kg K2O ha−1 per year in furrow irrigation) and substantially lower amounts of total fertilizer in phases II-IV (198–262.3 kg N ha−1, 102.1–307.5 kg P2O5 ha−1, and 21.1–135.0 kg K2O ha−1 per year in drip irrigation vs. 417.3–830.9 kg ha−1, 146.7–555.2 kg P2O5 ha−1 and 182.5–285.2 kg K2O ha−1 per year in furrow irrigation), respectively. In the furrow irrigation system, the annual application rate of chemical nitrogen fertilizer increased exponentially (from 55.2 to 624.8 kg N ha−1) from phase I to phase IV. In contrast, the annual application rate of organic nitrogen fertilizer was maintained at 347.7 kg N ha−1 for phases I to III and dropped slightly to 206.1 kg N ha−1. Nevertheless, the annual application rate of chemical nitrogen fertilizer increased steadily (from 46.5 to 350.3 kg N ha−1) from phase I to phase IV in the drip irrigation system. In contrast, the initial application rate of organic nitrogen fertilizer was 579.5 kg N ha−1 for phase I, but dropped sharply to 12 kg N ha−1 per year for phases II-IV. The electricity only used for irrigation with groundwater in the furrow system was 815.1–1630.2 kWh ha−1 year−1 during phases I to IV. The electricity used for both irrigation with groundwater and fertilizer pumps in the drip system was 514.8–1115.4 kWh ha−1 year−1 during phases I to IV. The depletion of irrigation water in the furrow system was, on average, 52% higher than that of the drip system throughout phases I to IV. Compared to the drip system, the amount of diesel fuel consumed in the furrow irrigated system was similar in phase I (125 L ha−1 year−1), but higher (56, 75, and 90 L ha−1 year−1 in furrow irrigation vs. 47.5, 52.5, and 67.5 L ha−1 year−1 in drip irrigation) in phases II–IV, respectively. The paper bags used in the furrow or drip system were similar in phases I to IV (ranging from 0–900 kg ha−1 year−1). The annual pesticide uses in the furrow system ranged from 6.1 to 16.80 kg ha−1 in phases I to IV, which was slightly higher than the drip system (4.3 to 15.3 kg ha−1 year−1). The PVC consumption in only the drip system of phase I was 602.4 kg ha−1 without any increases during phases II to IV. Different irrigation systems induced significant differences in the development of pear trees, especially the fruit yield and waste pruning. The average yield for the drip irrigated system in phases II to III (9 and 37.5 t ha−1 year−1) was higher than that of the furrow irrigated system (7 and 27.5 t ha−1 year−1). In comparison, the average yield per year for the drip irrigated system in phase IV (67.5 t ha−1) was lower than that of the furrow irrigated system (72.5 t ha−1). The waste branches in annual winter pruning of the furrow irrigated pear system (ranging from 1.2 to 4.8 t ha−1 per year in phase II to IV) were significantly higher than that of the drip irrigated system (ranging from 0.6 to 2.9 t ha−1 per year in phase II to IV).

3.2. Water Depletion and Water Footprint of the Furrow and Drip Irrigation Pear Production System in Each Growing Phase

The WD and WF of the furrow and drip irrigation pear production system in different phases are presented in Figure 2. The WD of both the furrow and drip system increased by 120.3% and 108.6% from phase I to phase IV, respectively, while the WF of both the furrow and drip system decreased by 81% and 77.8% from phase II to phase IV, respectively. The WDs of the furrow system were 5682, 7212.5, 9604, and 12,517.2 m3 ha−1 year−1 in phases I to IV, respectively, which were 45.0–70.5% higher than that of the drip system (3732, 4972.5, 5631.5, and 7784.5 m3 ha−1 year−1). The total WFs in phases II to IV of the furrow systems were 2.1, 0.7, and 0.4 m3 kg−1 year−1, respectively, which were 2.3, 3.5, and 2 times that of the drip system (0.9, 0.2, and 0.2 m3 kg−1 year−1). The contributions of the GWF, BWF, and GRWF to the total WF were 8.2–13.4% in phase II, 37.7–42.6% in phase III, and 48.6–53.7% in phase IV for the furrow system. The contributions of the GWF, BWF, and GRWF to the total WF were 16.5–25.4% in phase II, 42.8–45.7% in phase III, and 31.8–38.2% in phase IV for the furrow system. GWF of furrow and drip irrigated systems were approximately the same, but the BWF and GRWF of drip irrigation systems were 35.7–62.1% and 66.0–73.2% lower than those of the furrow irrigated system. Gray water consumption was the major drive for the furrow irrigation pear production system, while blue water played a dominant role in the drip irrigation pear production system.

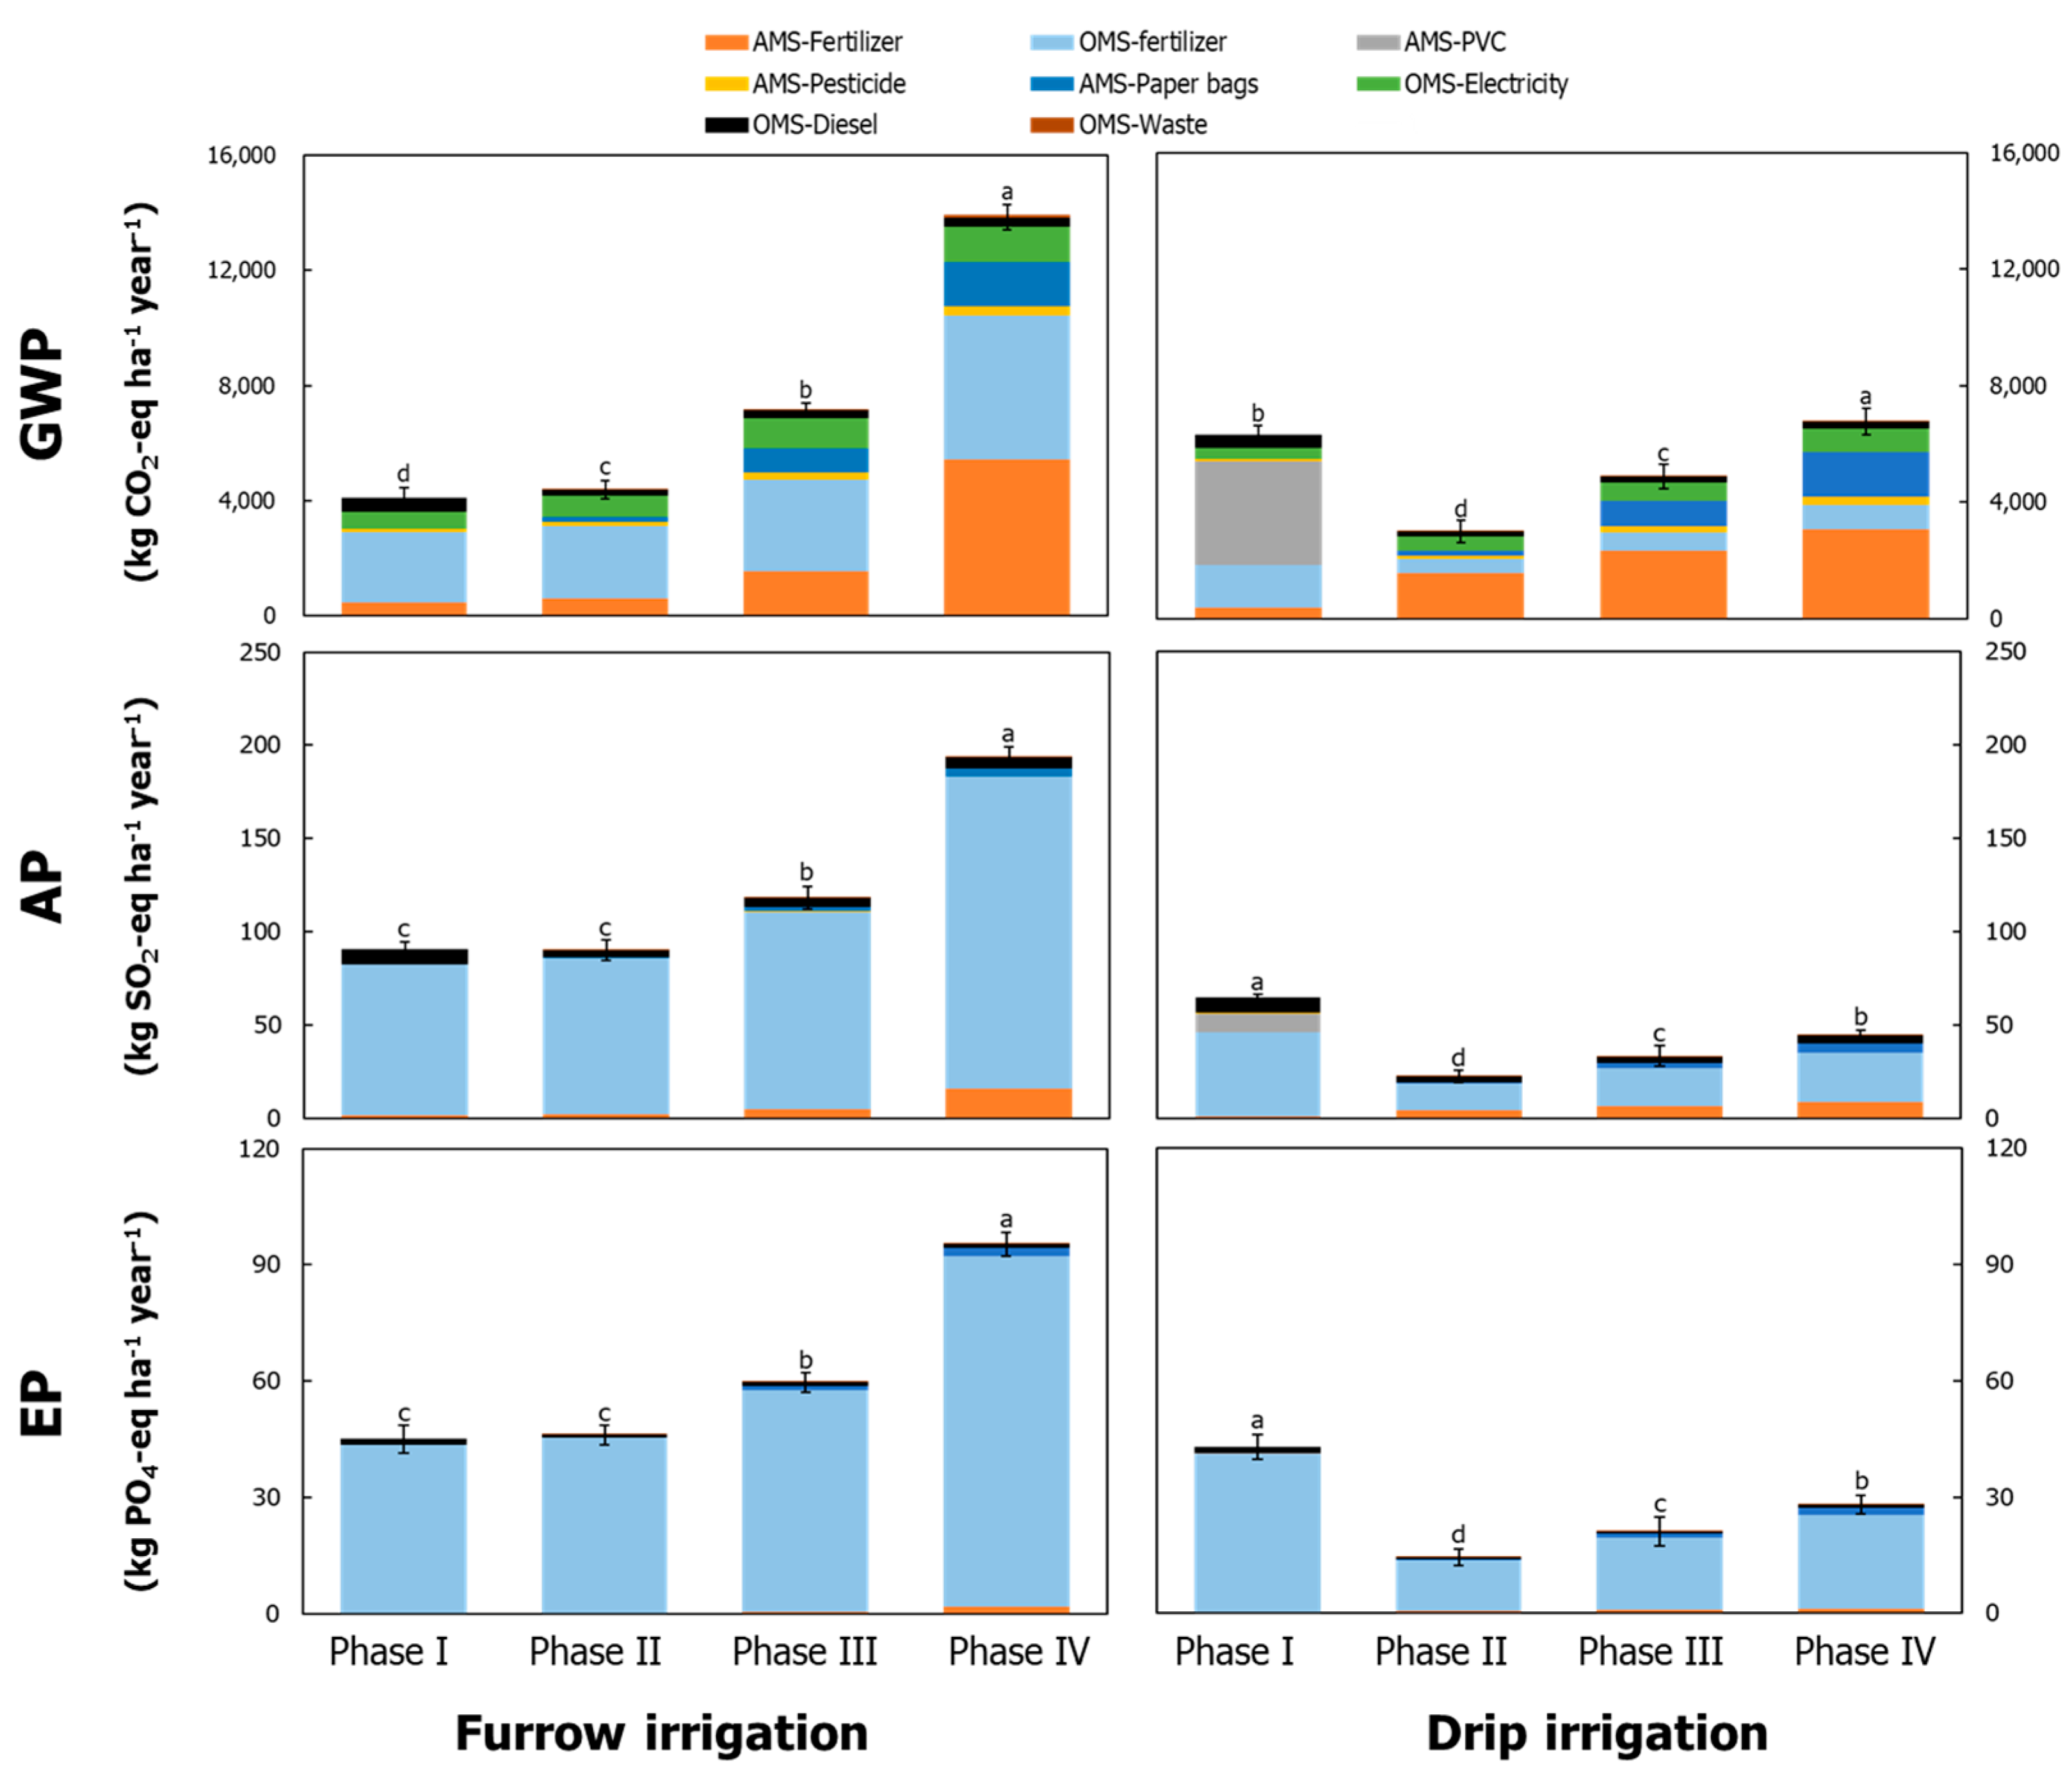
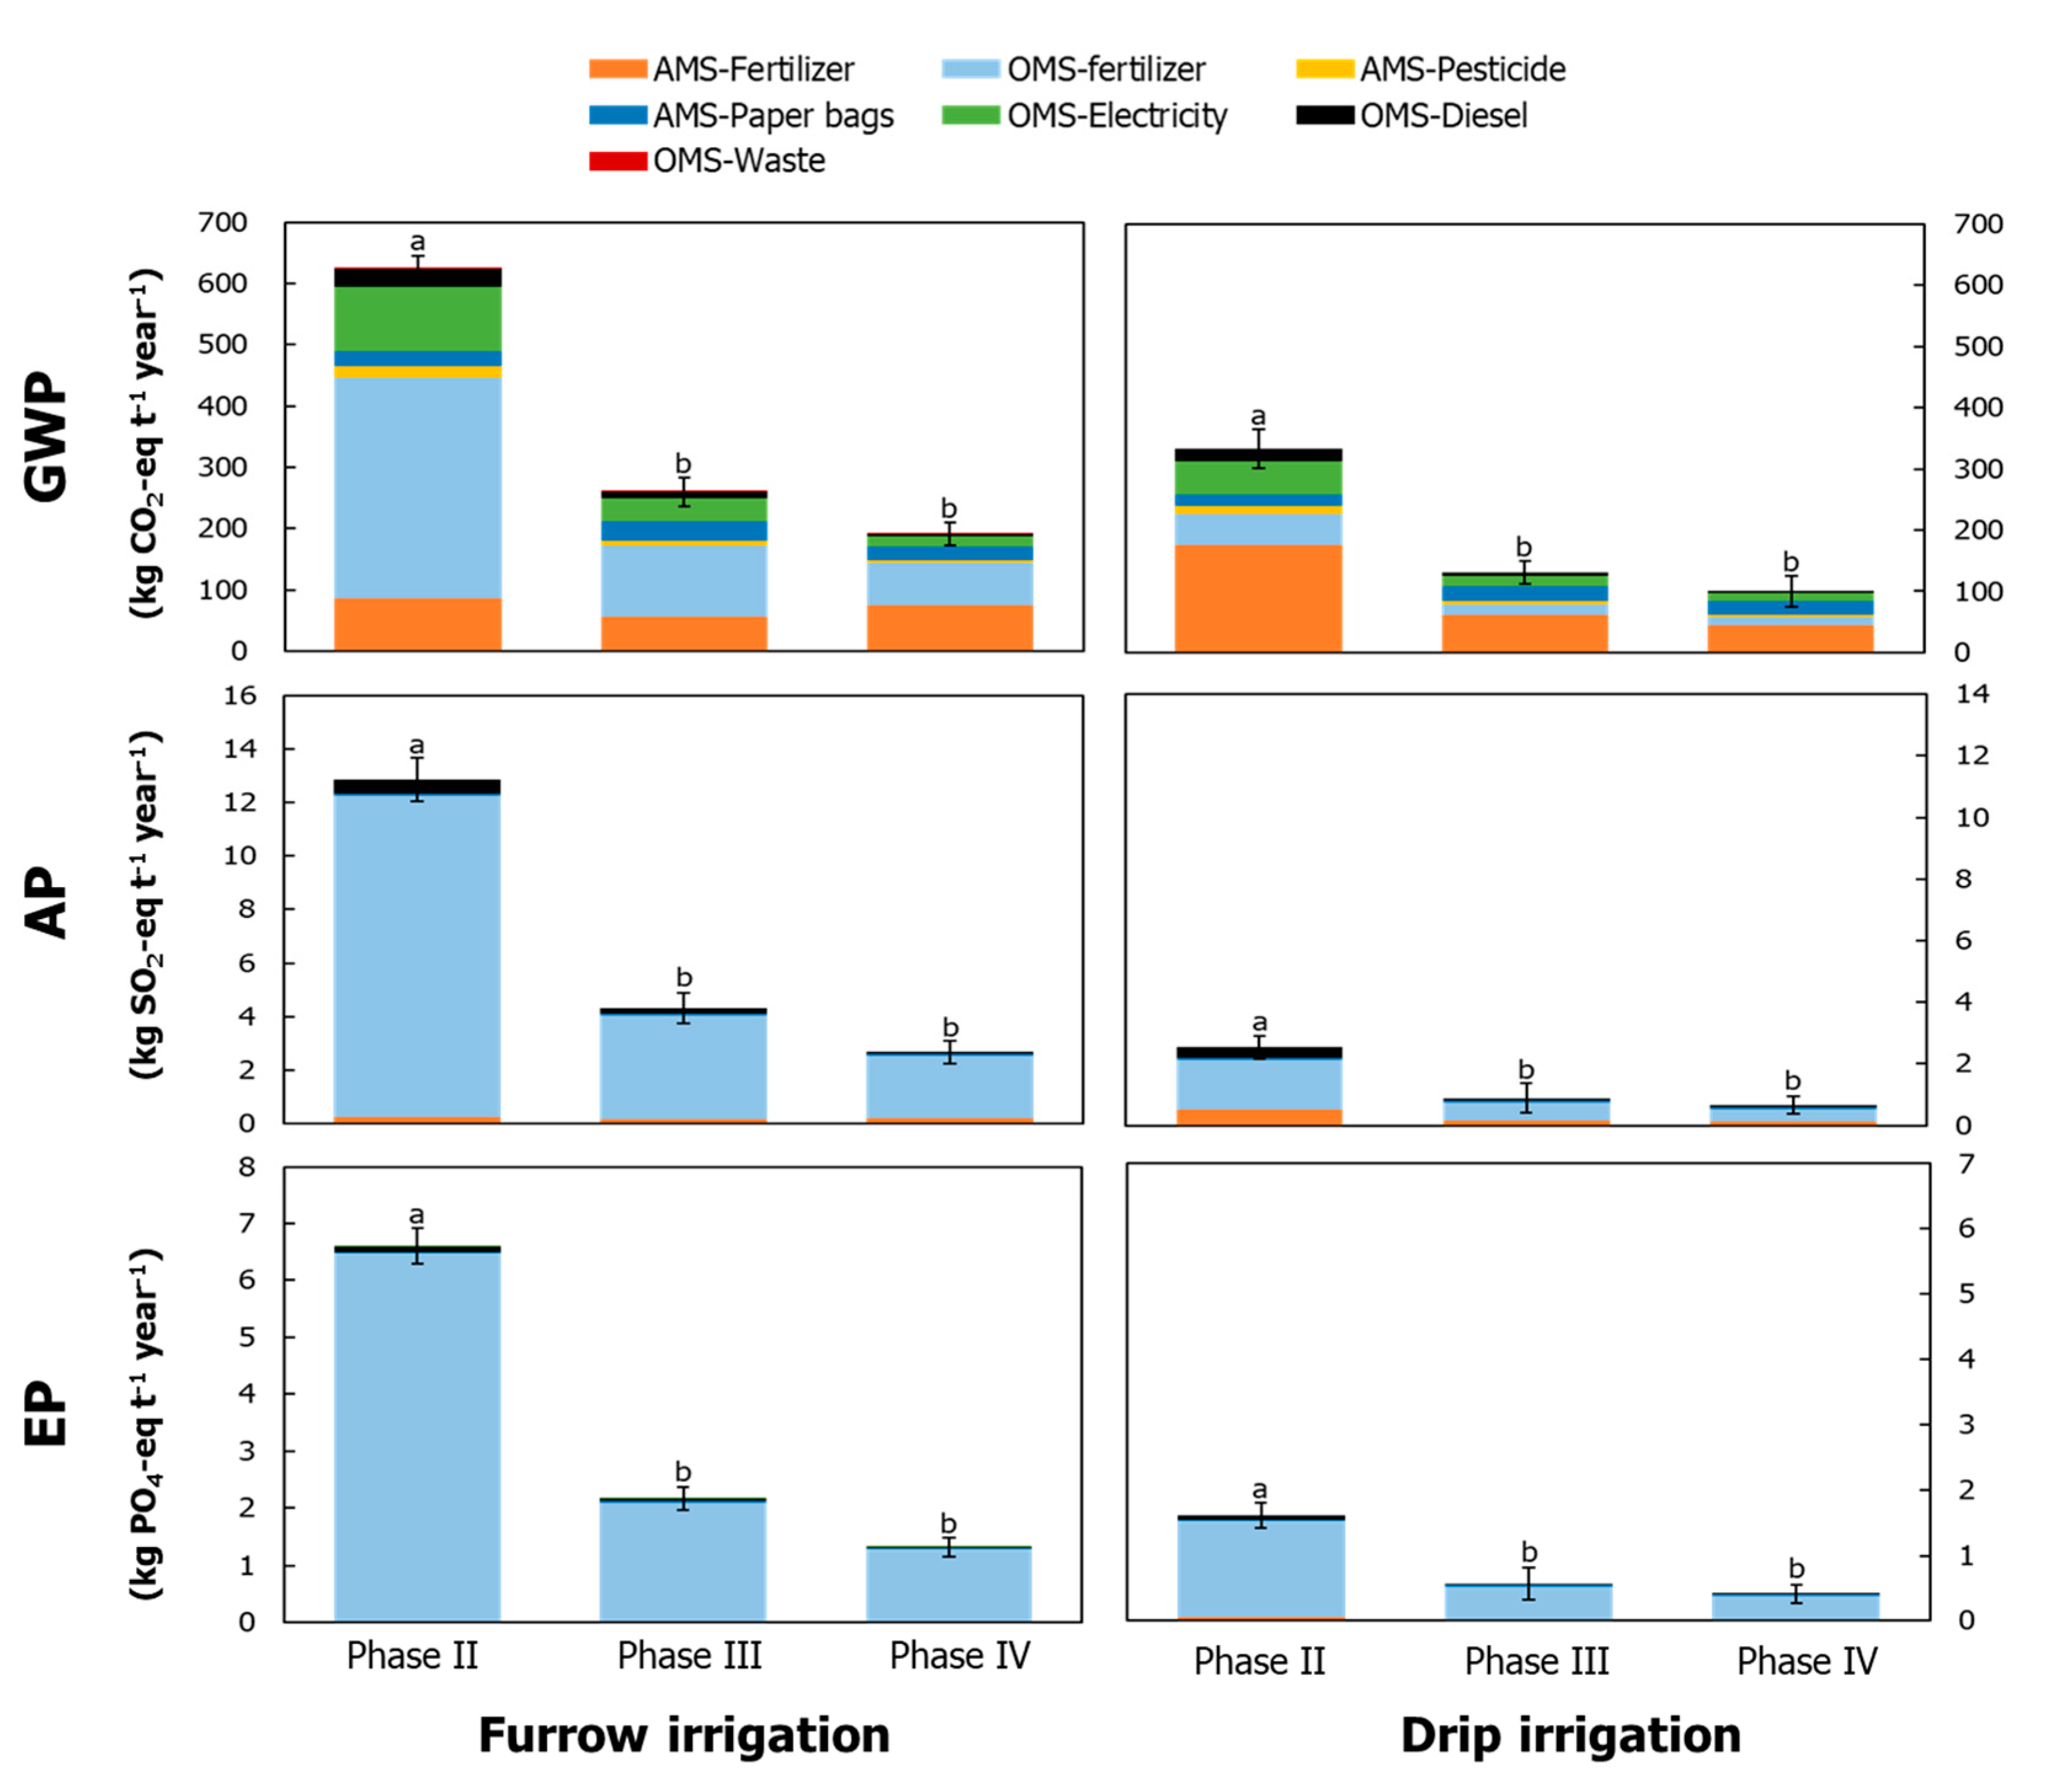
3.3. Environmental Impacts of Furrow and Drip Irrigation Pear Production Systems in Growing Phases

When expressed per hectare of pear cultivation area, the global warming (GWP), acidification (AP), and eutrophication (EP) potentials of furrow and drip irrigated pear production systems in the loess plateau of the four growing phases are shown in Figure 3. The GWP, AP, and EP of the furrow irrigation system increased with the growing phase, while the GWP, AP, and EP of the drip irrigation system first decreased and then increased with the growing phase. In the orchard installation phase, the GWP of the drip system (6330.8 kg CO2 eq ha−1) was 54.9% higher than that of the furrow system (4086.8 kg CO2-eq ha−1). Additional inputs on the PVC supplies contributed 58.2% to the total GWP in the drip system, while fertilization in the OMS contributed 60.9% to the total GWP in the furrow system. The AP and EP of the drip system in phase I were 28.5% and 4.7% lower than those of the furrow system (64.8 kg SO2-eq and 42.9 kg PO4-eq per ha in drip system vs. 90.6 kg SO2-eq and 45 kg PO4-eq per ha in furrow system), respectively. In the primary growing phase (phase II), the annual GWP, AP, and EP of the drip system were 31.2%, 74.7%, and 69.0% lower than those of the furrow system (3017.9 kg CO2-eq, 22.8 kg SO2-eq, and 14.5 kg PO4-eq per ha in drip system vs. 4389.5 kg CO2-eq, 90.0 kg SO2-eq and 46.7 kg PO4-eq per ha in furrow system), respectively. Similarly, in the low production phase (phase III), the annual GWP, AP, and EP of the drip system were 31.3%, 72.1%, and 65.9% lower than those of the furrow system (4935.7 kg CO2-eq, 33.3 kg SO2-eq, and 21.2 kg PO4-eq per ha in drip system vs. 7187.9 kg CO2-eq, 118.8 kg SO2-eq and 62.2 kg PO4-eq per ha in furrow system), respectively. In the full production phase (phase IV), the annual GWP, AP, and EP of the drip system were 51.0%, 77.3%, and 72.1% lower than those of the furrow system (6837.3 kg CO2-eq, 44.4 kg SO2-eq, and 28.1 kg PO4-eq per ha in drip system vs. 13,924 kg CO2-eq, 194.5 kg SO2-eq and 101.5 kg PO4-eq per ha in furrow system), respectively. The results also showed that fertilizer production and transportation in the AMS and application in the OMS contributed dominantly to the environmental potentials in phases II to IV in both the furrow and drip systems (Figure 3). In detail, fertilizers in the AMS and OMS of the furrow system contributed 73%, 68%, and 76% to the GWP in phases II, III, and IV, respectively. However, fertilizers in the AMS and OMS of the drip system contributed 71%, 63%, and 59% to the GWP in phases II, III, and IV, respectively. Similarly, fertilizers in the AMS and OMS of the furrow system contributed 96–97% to the AP in phases II-IV and 86–89% to the AP in phases II-IV in the drip system. In addition, fertilizers in the AMS and OMS of both the furrow and the drip system contributed 96% above the EP in phases II-IV.
When expressed per ton of fresh pear, the GWP, AP, and EP in phases II to IV of both furrow and drip irrigation pear production systems decreased with the growing phases (Figure 4), which mainly resulted from the increase in yield (Table 1). The annual GWP of the furrow irrigated system (639.7, 263.4, and 193.5 kg CO2-eq t−1) in phase II to IV were 1.9–2.0 times those of the drip irrigated system (338.4, 132.2, and 101.5 kg CO2-eq t−1), respectively. However, the annual AP of the furrow irrigated system (12.9, 4.3, and 2.7 kg SO2-eq t−1) in phase II to IV were 3.9–5.2 times those of the drip irrigated system (2.6, 0.9, and 0.7 kg SO2-eq t−1), respectively. Similarly, the annual EP of the furrow irrigated system (6.8, 2.3, and 1.4 kg PO4-eq t−1) in phase II to IV were 3.3–4.1 times those of the drip irrigated system (1.6, 0.6, and 0.4 kg PO4-eq t−1), respectively. The results also showed the main contributors of agricultural material inputs to the environmental potentials. In general, fertilizer usage in the AMS and OMS contributed dominantly to the environmental potentials in phases II to IV of both the furrow and the drip systems (Figure 4), but the contribution of the furrow system was higher than that of the drip system. In detail, fertilization in the OMS (contributing 59.3%) was identified as the dominant factor contributing to the GWP of the furrow system in phase II, followed by electricity and diesel consumption in the OMS (19.8%), fertilizer production, and transportation in the AMS (14.2%), and pesticide and paper bags in the AMS (6.7%). However, the production and transportation of fertilizers in the AMS (53.1%) contributed the most to the GWP of the drip system in phase II, followed by fertilizer application in the OMS (21.9%), electricity by irrigation, and diesel usage in the OMS (15.4%), and pesticide and paper bags in the AMS (9.5%). Similarly, the contributions of the fertilizers in the AMS and OMS to the GWP in the furrow irrigated system were 66.4% and 75.9% in phases III and IV, respectively, while the contributions of the fertilizers to the GWP in the AMS and OMS of the drip system were 65.6% and 59.8% in phases III and IV, respectively. The contributions to the AP of the fertilizers in the AMS and OMS of the furrow system were 95.3–96.8% in phases II to IV, while the contributions to the AP of the fertilizers in the AMS and OMS of the drip system were 79.2–91.9%. In addition, the contributions of the fertilizers in the AMS and OMS to the EP in the furrow and drip system in phases II to IV were close at more than 95% on average.

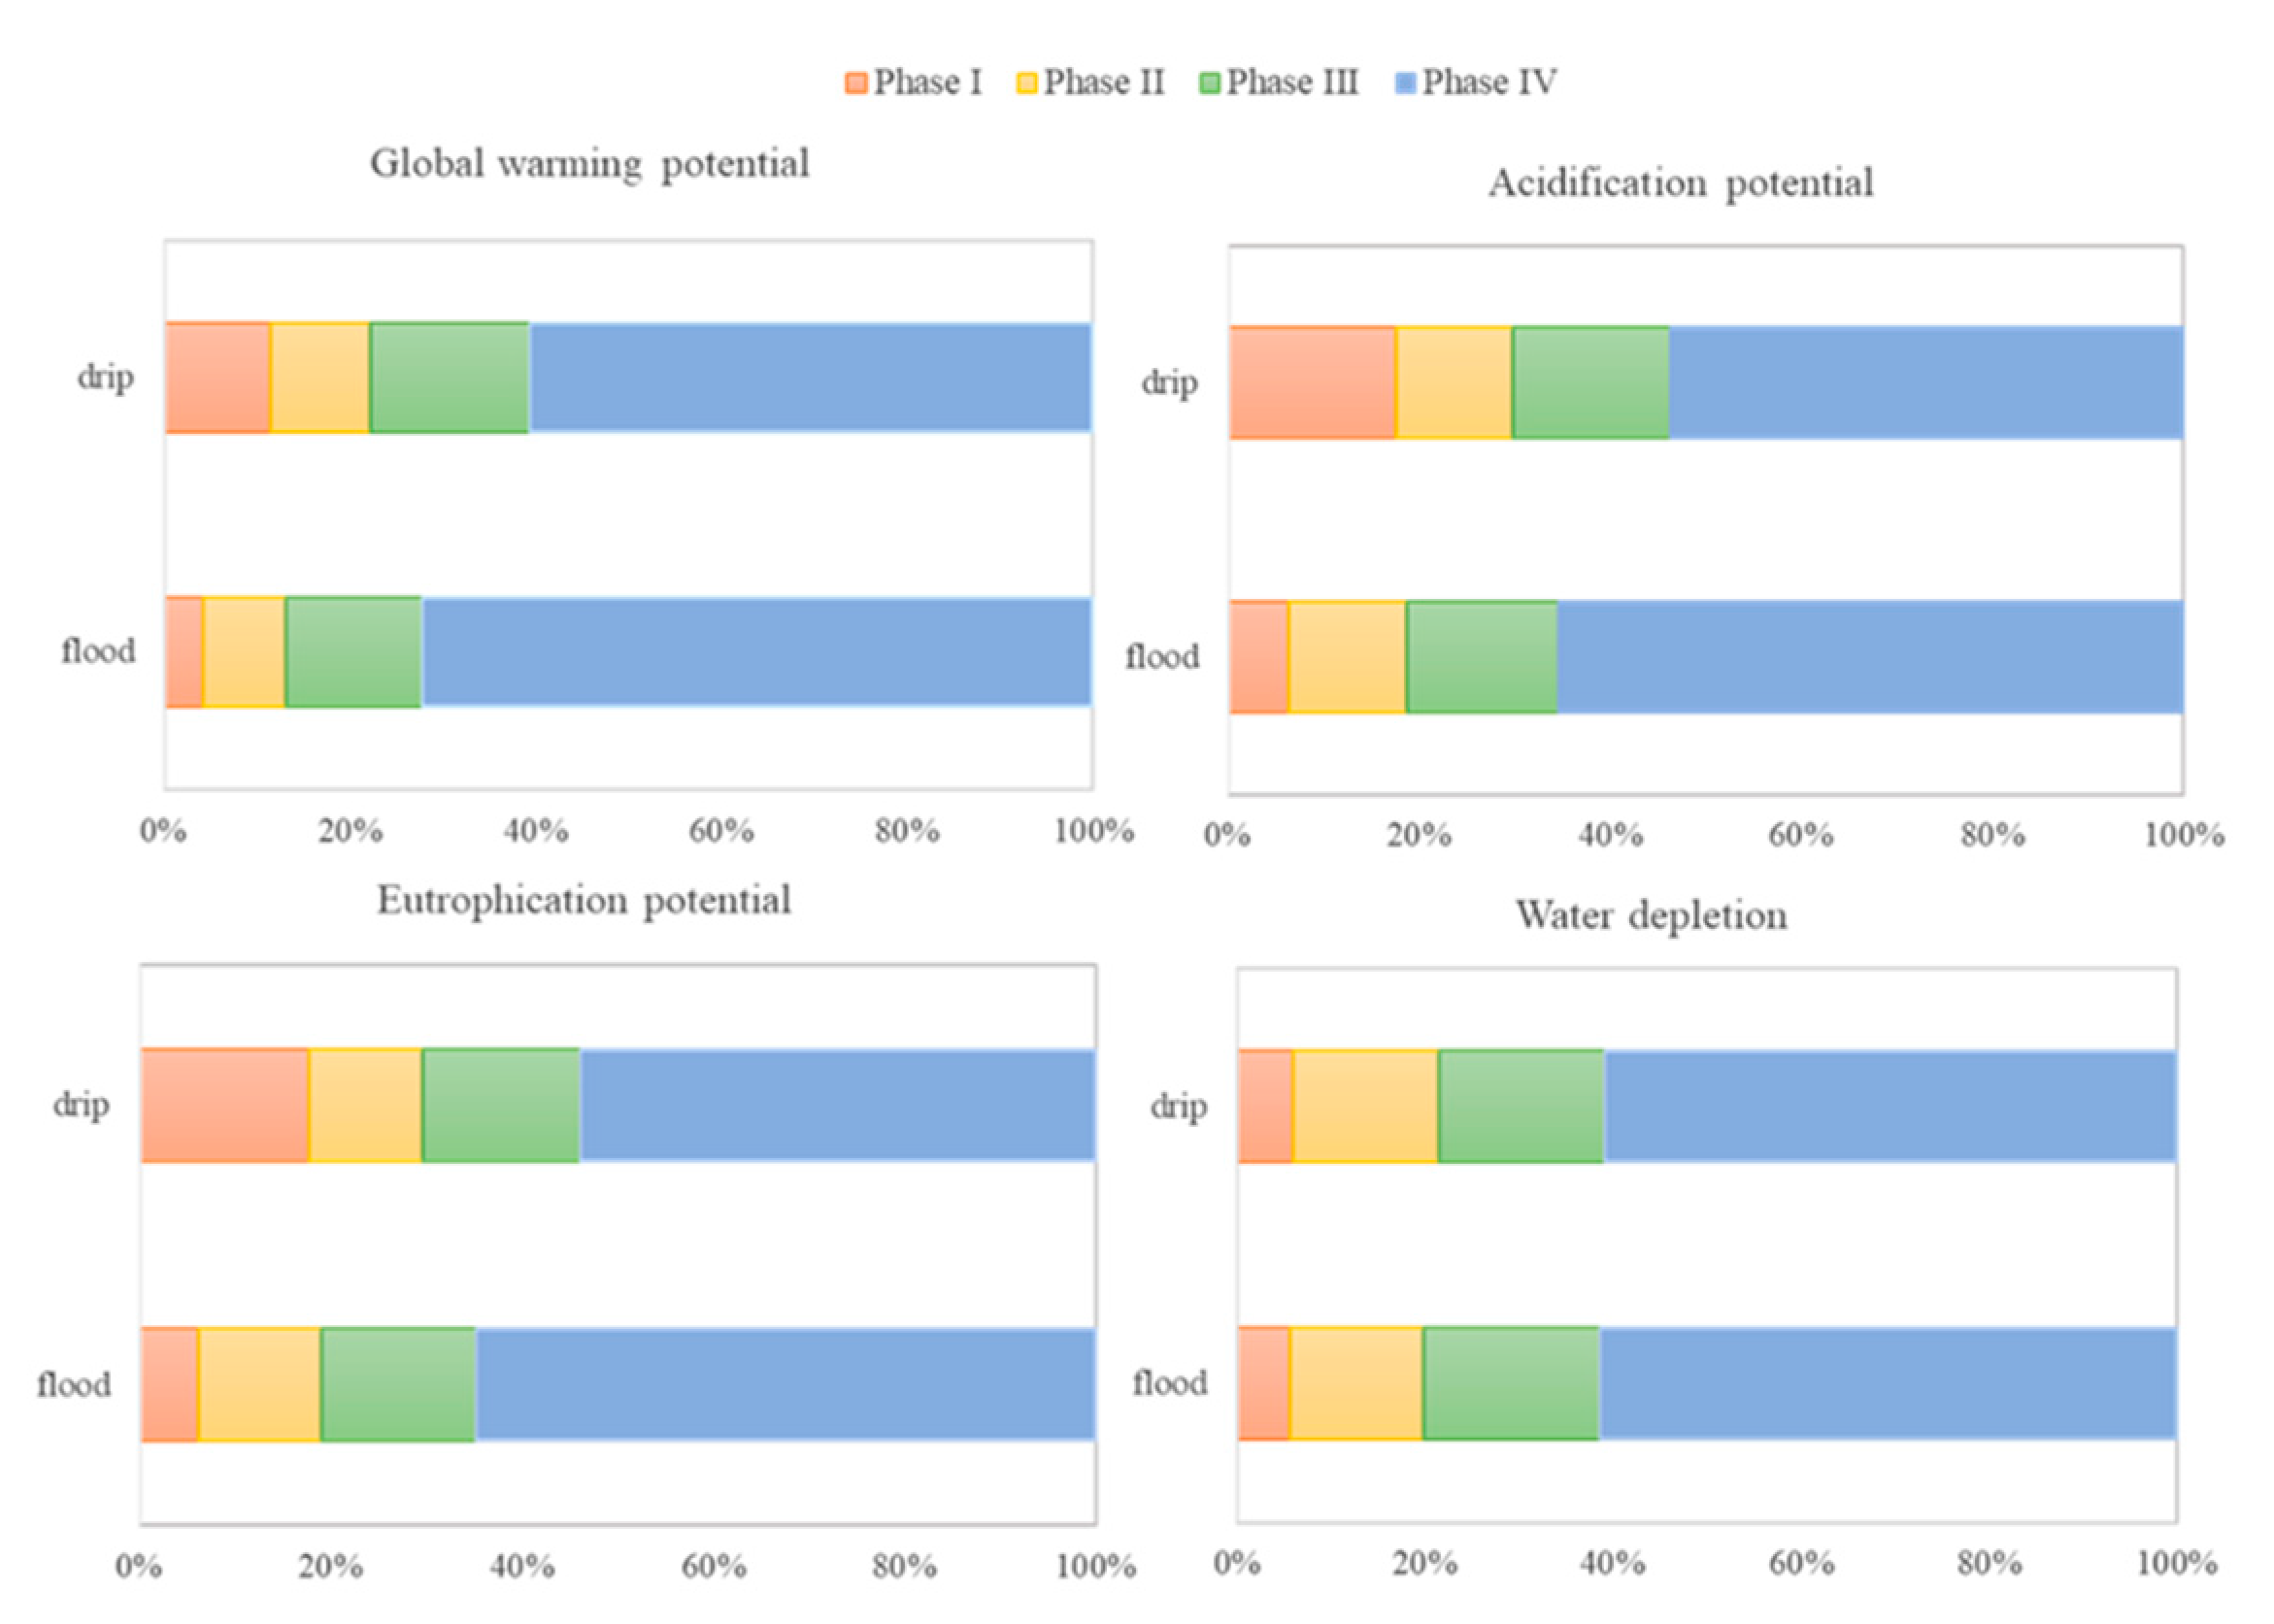
3.4. Total Amount and Contribution of the Environmental Impacts in Furrow and Drip Irrigation Pear Production Systems

The total amount of the environmental impacts and water depletion during 2009–2018 of the furrow and drip irrigation pear production systems are shown in Table 2. The total GWP, AP, EP, and WD of the furrow system were 96,846 CO2-eq, 1481 SO2-eq, 770 PO4-eq, and 101,901 m3 expressed per ha of pear production, which were 1.7, 3.7, 3.0, and 1.6 times that of the drip system (56424 CO2-eq, 399 SO2-eq, 255 PO4-eq and 63,863 m3). The total GWP, AP, EP, and WD of the furrow system were 225 CO2-eq, 3.3 SO2-eq, 1.8 PO4-eq, and 236 m3 expressed per ton of pear production, which were 1.7, 3.8, 3, and 1.6 times that of the drip system (139 CO2-eq, 0.9 SO2-eq, 0.6 PO4-eq and 148 m3). Phase contribution analysis of the furrow and drip irrigation pear production system is illustrated in Figure 5. The GWP, AP, EP, and WD of the full production phase contributed more than 50% of the total amount during the four phases. In detail, the GWP in phase IV of the furrow system contributed 72.2%, followed by that in phase III (14.6%), phase II (9%), and phase I (4%). The GWP in phase IV of the drip system contributed 60.7%, followed by that in phase III (17.2%), phase I (11.5%), and phase II (10.6%). The AP in the furrow system of phase IV contributed 65.4%, followed by that in phase III (16.0%), phase II (12.4%), and phase I (6.3%). The AP in the drip system of phase IV contributed 53.7%, followed by that in phase III (16.6%), phase I (17.6%), and phase II (12.1%). Similarly, the EP in phase IV of the furrow system contributed 64.7%, followed by that in phase III (16.2%), phase II (12.8%), and phase I (6.3%). The EP in the drip system of phase IV contributed 53.9%, followed by that in phase III (16.6%), phase I (17.8%), and phase II (11.8%). The WD in the drip system of phase IV contributed 61.0%, followed by that in phase III (17.6%), phase II (14.2%), and phase I (5.6%). The WD in the drip system of phase IV contributed 61.4%, followed by that in phase III (18.9%), phase II (14.2%), and phase II (5.6%). The EP in the drip system of phase IV contributed 53.9%, followed by that in phase III (16.6%), phase I (17.8%), and phase II (11.8%). The WD in the drip system of phase IV contributed 61.0%, followed by that in phase III (17.6%), phase II (14.2%), and phase I (5.6%). The WD in the drip system of phase IV contributed 61.4%, followed by that in phase III (18.9%), phase II (14.2%), and phase II (5.6%).

4. Discussion

4.1. Comparable Impacts of the Furrow and Drip Irrigated Systems

Semiarid and arid lands account for 43.1% of China’s land area, and agriculture in these areas has experienced a considerable water shortage because of the high evaporation rates and low precipitation [17]. Although irrigation can ensure the normal growth of trees and increase fruit yield in semiarid and arid areas, the environmental impacts may be high if improper irrigation management is carried out in orchards. In this study, the multi-year LCAs of pear production systems affected by furrow and drip irrigation in the Loess Plateau were calculated and compared. The results indicated that the cumulative WD, GWP, AP, and EP of the drip irrigated system over ten years were 148.3 m3, 130.1 kg CO2-eq, 0.9 kg SO2-eq, and 0.6 kg PO4-eq per ton of pear fruit harvest, respectively, and these values were 37.3–73.5% lower than those of the furrow irrigated system. The results in this study were consistent with that of previous research on the guayule rubber production system, which showed that the drip irrigated system could mitigate approximately 50% of the environmental impacts [33]. The total WFs were 0.9, 0.2, and 0.2 m3 kg−1 year−1 in phases II to IV of the drip irrigated pear production system, which were 50–71.4% lower than those of the furrow system. The gray water consumption derived by nitrogen leaching was the major contributor to the furrow irrigation pear production system, while blue water by irrigation played a dominant role in the drip irrigation pear production system. These results were similar to the water-saving drip irrigated systems reported by Zhang et al. (2021) in an apple production system, by Jayakumar et al. (2017) in a sugarcane production system, and by Lv et al. (2019) in the greenhouse tomato production system [19,34,35]. The drip irrigated agricultural systems could improve water and nutrient use efficiencies by decreasing nitrogen leaching [19]. The EP of the drip irrigated system was lower than that of the furrow irrigated system with improved nutrient management in North China Plain, both expressed by per hectare and per ton of fruit [8]. Nevertheless, the yield of the drip irrigated pear production system in the full production phase was slightly lower than that of the furrow irrigated system, which was different from the results for the drip irrigated systems applied for melon and tomato [35,36]. The annual average fertilizer application rate in the furrow irrigated system was too high at the full production phase, which led to a waste of resources and high environmental potentials, and excessive branch growth and biennial fruiting [37]. However, the annual average fertilizer application rate in the drip irrigated system was appropriate at the full production phase, which maintained a similar annual yield (Table S2) via orchard management by reducing excessive branch growth. Additionally, considerable environmental mitigation and limited yield decreases were receptible in the drip irrigated pear production systems.

4.2. Options for Environmental Mitigation in the Furrow and Drip Irrigated Pear Production Systems

The complete agriculture production phase was identified as the main contribution of GWP, AP, and EP over the fruit production phases [11], among which the contribution in the full production phase to the environmental impacts of orchards was demonstrated the most. However, the GWP, AP, EP, and WD of phase I to III contributed 39.3–46.1% in the drip irrigated system vs. 27.8–38.6% in the furrow irrigated system of the total amount, which should not be neglected in perennial orchard systems (Figure 5). In this study, fertilization contributed 72–98% to the environmental potentials in the furrowed system and 30–90% in the drip irrigated system (Figure 3), which was consistent with previous studies on pear [8,14], apple [13], and peach [6] production systems in China. Fertilizers, especially the chemical nitrogen fertilizer applied in the furrow and drip irrigation systems, should be optimized to reduce environmental impacts. Technological nutrient management for reducing the application rate of synthetic fertilizers should be considered [8]. For instance, the wider use of soil tests and fertilization, integrated soil–crop system management, and the recommendations from fertilizer nutrient experts should be highlighted to manage the fertilization to match crops or trees’ requirements [5,38,39], which was demonstrated to reduce the environmental potentials by 40–50% in the pear orchards of the North China Plain and 30–39% in a greenhouse pepper production system [8,40]. In addition, the proper ratio of chemical and organic fertilizer could further reduce the subsequent N2O and NH3 emissions, as well as the N-leaching at the field levels [7,41]. Moreover, the additional inputs associated with PVC supplies contributed 58.2% to the total GWP in the drip system at phase I; thus, more environmentally friendly materials could be applied, such as the bamboo winding composite pipes [42].

4.3. Sensitivity Analysis and Model Limitations

The results of sensitivity analysis are shown in Table 3. Overall, changes in the emission parameters of the reactive nitrogen losses had little effect on the environmental impact comparison of the furrow and drip irrigated pear production systems. However, the specific impact categories were influenced by the emission parameters change. In detail, changing the N2O emission parameter affected the GWP; the GWP, EP, and WFs were influenced by the reduced emission parameters of nitrate leaching; the AP and GWP were influenced by reducing NH3 emission parameters. Therefore, we can conclude that the sensitivity of the reactive nitrogen losses emission parameters from the furrow and drip irrigated pear production systems were not critically sensitive to the comparison analysis.
The environmental impacts of two different irrigated pear production systems were estimated in this study. Due to the same sales routes in the products, the system boundaries only included the cradle to the farm gate, which highlighted the principle focus on the environmental impact comparison influenced by the different irrigation systems. The diesel burnt emission parameters in the actual farm machines may be different from the background database. In arid and semiarid agricultural areas, some irrigation systems such as sprinkler, spray, and sub-drip irrigation have been demonstrated to good effect on crop productivities, water use efficiency, and environmental mitigation. For improving intensive fruit production management, collaborative irrigation systems were found to satisfy the integrated management needs. Future scenario modeling should include the other integrated irrigation systems and provide more options and suggestions to the orchard managers.

5. Conclusions

This study compared the LCAs of furrow and drip irrigated pear production systems in the Loess Plateau of China from the orchard installation phase to the full production phase. The results indicated that drip irrigation showed more efficient use of the applied agricultural materials, but had slight decreases in yields in phase IV compared to that of the furrow irrigated system. The cumulative WD, GWP, AP, and EP of the drip irrigated system over the total ten years were 148.3 m3, 130.1 kg CO2-eq, 0.9 kg SO2-eq, and 0.6 kg PO4-eq per ton of pear fruit harvest, respectively, which were 37.3–73.5% lower than those of the furrow irrigated system. The GWP, AP, EP, and WD of phase I to III contributed 39.3–46.1% in the drip irrigated system vs. 27.8–38.6% in the furrow irrigated system of the total amount, which should not be neglected in perennial orchard systems. The total WFs in phases II to IV of the drip systems were 0.9, 0.2, and 0.2 m3 kg−1 year−1, respectively, which were 50–71.4% lower than those of the furrow system. Green WF of furrow and drip irrigated systems were approximately the same, but the blue WF and grey WF of drip irrigation systems were 35.7–62.1% and 66.0–73.2% lower than those of the furrow irrigated system. The gray water consumption derived by nitrogen leaching was the major contributor to the furrow irrigated pear production system, while blue water by irrigation played a dominant role in the drip irrigation pear production system. Fertilization contributed 72–98% to the environmental potentials in the furrowed system, and 30–90% in the drip irrigated system, while additional inputs associated with PVC supplies contributed 58.2% to the total GWP in the drip system at phase I. The drip irrigated pear production system significantly mitigated environmental impacts, mainly due to reduced fertilizer application, electricity, and diesel demand. Ultimately, the outcomes from the multi-year LCAs of the furrow and drip irrigated pear production systems could provide useful information for decision-making by the pear orchardists in the Loess Plateau.

Supplementary Materials

The following are available online at https://www.mdpi.com/article/10.3390/agronomy11061201/s1, Table S1: average weather conditions in the survey area during 2009–2018, Figure S1: diagram of the furrow (A) and drip (B) irrigated systems, Table S2: the overview of the investigated information during 2009–2018, Table S3: emissions parameters of main agricultural inputs in the pear orchards, Table S4: the reactive nitrogen losses emission parameters of the furrow and drip irrigated pear production systems at the orchard management stage, Table S5: the equivalent coefficient of the emissions inventory for environmental impact potentials.

Author Contributions

Conceptualization, X.C., X.S. and J.W.; investigation, M.Z. and J.W.; writing—original draft preparation, J.W., Y.W. (Yu Wan) and Y.W. (Yong Wei); writing—review and editing, Y.W. (Yu Wan), Y.Z. (Yueqiang Zhang), Y.Z. (Yu Zeng) and Y.W. (Yong Wei). All authors have read and agreed to the published version of the manuscript.

Funding

This work is funded by the National Natural Science Foundation of China, China (31801932); National Training Program of Innovation and Entrepreneurship for Undergraduates (X202010635388), China; Natural Science Foundation of Chongqing, China (cstc2019jcyj-bshX0007); “Guangjiong” Cultivation Project of Undergraduate Science and Technology Innovation by Collage of Resources and Environment, Southwest University, China (202004); Science and Technology Project of Chongqing Urban Administration, China (CGKZ2020-23).

Institutional Review Board Statement

Not applicable.

Informed Consent Statement

Not applicable.

Acknowledgments

We appreciate the valuable comments and suggestions in fertilizer application ratio from Xu Yangchun of Nanjing Agricultural University.

Conflicts of Interest

The authors declare no conflict of interest.

References

  1. Godfray, H.C.; Beddington, J.R.; Crute, I.R.; Haddad, L.; Lawrence, D.; Muir, J.F.; Pretty, J.; Robinson, S.; Thomas, S.M.; Toulmin, C. Food security: The challenge of feeding 9 billion people. Science 2010, 327, 812. [Google Scholar] [CrossRef] [Green Version]
  2. Kearney, J. Food consumption trends and drivers. Philos. T. R. Soc. B. 2010, 365, 2793–2807. [Google Scholar] [CrossRef]
  3. Steffen, W.; Richardson, K.; Rockström, J.; Cornell, S.E.; Fetzer, I.; Bennett, E.M.; Biggs, R.; Carpenter, S.R.; de Vries, W.; de Wit, C.A.; et al. Planetary boundaries: Guiding human development on a changing planet. Science 2015, 347, 1259855. [Google Scholar] [CrossRef] [Green Version]
  4. Ghose, B. Food security and food self-sufficiency in China: From past to 2050. Food Energy Secur. 2014, 3, 86–95. [Google Scholar] [CrossRef]
  5. Chen, X.P.; Cui, Z.L.; Fan, M.S.; Vitousek, P.; Zhao, M.; Ma, W.Q.; Wang, Z.L.; Zhang, W.J.; Yan, X.Y.; Yang, J.C.; et al. Producing more grain with lower environmental costs. Nature 2014, 514, 486–489. [Google Scholar] [CrossRef] [PubMed]
  6. Guo, C.; Wang, X.; Li, Y.; He, X.; Zhang, W.; Wang, J.; Zhang, Y. Carbon footprint analyses and potential carbon emission reduction in China’s major peach orchards. Sustainability 2018, 10, 2908. [Google Scholar] [CrossRef] [Green Version]
  7. Yang, M.; Long, Q.; Li, W.; Wang, Z.; He, X.; Wang, J.; Wang, X.; Xiong, H.; Guo, C.; Zhang, G.; et al. Mapping the Environmental Cost of a Typical Citrus-Producing County in China: Hotspot and Optimization. Sustainability 2020, 12, 1827. [Google Scholar] [CrossRef] [Green Version]
  8. Wang, J.; Zhang, L.; He, X.; Zhang, Y.; Wan, Y.; Duan, S.; Xu, C.; Mao, X.; Chen, X.; Shi, X. Environmental mitigation potential by improved nutrient managements in pear (Pyrus pyrifolia L.) orchards based on life cycle assessment: A case study in the North China Plain. J. Clean. Prod. 2020, 262, 121273. [Google Scholar] [CrossRef]
  9. Zhang, Y.; Lei, H.; Zhao, W.; Shen, Y.; Xiao, D. Comparison of the water budget for the typical cropland and pear orchard ecosystems in the north China plain. Agric. Water Manage. 2018, 198, 53–64. [Google Scholar] [CrossRef]
  10. Cerutti, A.K.; Bruun, S.; Beccaro, G.L.; Bounous, G. A review of studies applying environmental impact assessment methods on fruit production systems. J. Environ. Manage. 2011, 92, 2277–2286. [Google Scholar] [CrossRef] [PubMed]
  11. Cerutti, A.K.; Beccaro, G.L.; Bruun, S.; Bosco, S.; Donno, D.; Notarnicola, B.; Bounous, G. Life cycle assessment application in the fruit sector: State of the art and recommendations for environmental declarations of fruit products. J. Clean. Prod. 2014, 73, 125–135. [Google Scholar] [CrossRef]
  12. Zhang, W.; He, X.; Zhang, Z.; Gong, S.; Zhang, Q.; Zhang, W.; Chen, X. Carbon footprint assessment for irrigated and rainfed maize (Zea mays L.) production on the Loess Plateau of China. Biosyst. Eng. 2018, 167, 75–86. [Google Scholar] [CrossRef]
  13. Zhu, Z.; Jia, Z.J.; Peng, L.; Chen, Q.; He, L.; Jiang, Y.; Ge, S. Life cycle assessment of conventional and organic apple production systems in China. J. Clean. Prod. 2018, 201, 156–168. [Google Scholar] [CrossRef]
  14. Yan, M.; Cheng, K.; Yue, Q.; Yan, Y.; Ress, R.M.; Pan, G.X. Farm and product carbon footprints of China’s fruit production-life cycle inventory of re presentative orchards of five major fruits. Environ. Sci. Pollut. R. 2015, 23, 4681–4691. [Google Scholar] [CrossRef] [PubMed]
  15. Rana, R.L.; Andriano, A.M.; Giungato, P.; Tricase, C. Carbon footprint of processed sweet cherries (Prunus avium L.): From nursery to market. J. Clean. Prod. 2019, 227, 900–910. [Google Scholar] [CrossRef]
  16. Pelling, M.; Maskrey, A.; Ruiz, P.; Hall, L.; Peduzzi, P.; Dao, Q.H.; Mouton, F.; Herold, C.; Kluser, S. Reducing Disaster Risk: A Challenge for Development; United Nations Development Programme: New York, NY, USA, 2004. [Google Scholar]
  17. Pang, J.; Wang, X.; Peng, C.; Mu, Y.; Ouyang, Z.; Lu, F.; Liu, W. Nitrous oxide emissions from soils under traditional cropland and apple orchard in the semiarid Loess Plateau of China. Agric. Ecosyst. Environ. 2019, 269, 116–124. [Google Scholar] [CrossRef]
  18. Sánchez-Martín, L.; Arce, A.; Benito, A.; Garcia-Torres, L.; Vallejo, A. Influence of drip and furrow irrigation systems on nitrogen oxide emissions from a horticultural crop. Soil Biol. Biochem. 2008, 40, 1698–1706. [Google Scholar] [CrossRef]
  19. Zhang, W.; Sheng, J.; Li, Z.; David, C.W.; Hu, G.; Xuan, J.; Zhao, H. Integrating rainwater harvesting and drip irrigation for water use efficiency improvements in apple orchards of northwest china. Sci. Hortic. 2021, 275, 109728. [Google Scholar] [CrossRef]
  20. Wang, L.; Wu, W.; Xiao, J.; Huang, Q.; Hu, Y. Effects of different drip irrigation modes on water use efficiency of pear trees in northern China. Agric. Water Manage. 2021, 245, 106660. [Google Scholar] [CrossRef]
  21. Moinet, G.Y.; Cieraad, E.; Turnbull, M.H.; Whitehead, D. Effects of irrigation and addition of nitrogen fertiliser on net ecosystem carbon balance for a grassland. Sci. Total. Environ. 2017, 579, 1715–1725. [Google Scholar] [CrossRef]
  22. China Agriculture Yearbook (Ed.) Editorial Board of Agriculture Yearbook of China; China Agriculture Press: Beijing, China, 2017. [Google Scholar]
  23. ISO-14040. Environmental Management Life Cycle Assessment Principles and Framework; International Organization for Standardization: Geneva, Switzerland, 2006. [Google Scholar]
  24. ISO-14044. Environmental Management Life Cycle Assessment Requirements and Guidelines; International Organization for Standardization: Geneva, Switzerland, 2006. [Google Scholar]
  25. IPCC. Climate Change 2014: Mitigation of Climate Change; Contribution of Working Group III to the Fifth Assessment Report of the Intergovernmental Panel on Climate Change; IPCC: Geneva, Switzerland, 2014. [Google Scholar]
  26. Hauschild, M.Z.; Wenzel, H. Environmental Assessment of Products; Chapman & Hall: London, UK, 1998. [Google Scholar]
  27. Huijbregts, M.A.J.; Thissen, U.; Guinee, J.B. Priority assessment of toxic substances in life cycle assessment. Part I: Calculation of toxicity potentials for 181 substances with the nested multi-media fate, exposure and effects model USES-LCA. Chemosphere 2000, 41, 541–573. [Google Scholar] [CrossRef]
  28. Deng, N.S.; Wang, X.B. Life Cycle Assessment; Chemical Industry Press: Beijing, China, 2003; pp. 134–149. (In Chinese) [Google Scholar]
  29. Howell, T.A. Enhancing water use efficiency in irrigated agriculture. Agron. J. 2001, 93, 281–289. [Google Scholar] [CrossRef] [Green Version]
  30. Maris, S.C.; Teiraesmatges, M.R.; Arbones, A.; Rufat, J. Effect of irrigation, nitrogen application, and a nitrification inhibitor on nitrous oxide, carbon dioxide and methane emissions from an olive (Olea europaea L.) orchard. Sci. Total Environ. 2015, 538, 966–978. [Google Scholar] [CrossRef]
  31. Coltro, L.; Marton, L.F.; Pilecco, F.P.; Pilecco, A.C.; Mattei, L.F. Environmental profile of rice production in Southern Brazil: A comparison between irrigated and subsurface drip irrigated cropping systems. J. Clean. Prod. 2017, 245, 491–505. [Google Scholar] [CrossRef]
  32. Hu, Y.; Zheng, J.; Kong, X.; Sun, J.; Li, Y. Carbon footprint and economic efficiency of urban agriculture in Beijing--a comparative case study of conventional and home-delivery agriculture. J. Clean. Prod. 2019, 234, 615–625. [Google Scholar] [CrossRef]
  33. Eranki, P.L.; El-Shikha, D.; Hunsaker, D.J.; Bronson, K.F.; Landis, A.E. A comparative life cycle assessment of flood and drip irrigation for guayule rubber production using experimental field data. Ind. Crop. Prod. 2017, 99, 97–108. [Google Scholar] [CrossRef]
  34. Jayakumar, M.; Janapriya, S.; Surendran, U. Effect of drip fertigation and polythene mulching on growth and productivity of coconut (Cocos nucifera L.), water, nutrient use efficiency and economic benefits. Agric. Water Manage. 2017, 182, 87–93. [Google Scholar]
  35. Lv, H.; Lin, S.; Wang, Y.; Lian, X.; Zhao, Y.; Li, Y.; Butterbach-Bahl, K. Drip fertigation significantly reduces nitrogen leaching in solar greenhouse vegetable production system. Environ. Pollut. 2019, 245, 694–701. [Google Scholar] [CrossRef]
  36. Abalos, D.; Sanchez-Martin, L.; Garcia-Torres, L.; van Groenigen, J.W.; Vallejo, A. Management of irrigation frequency and nitrogen fertilization to mitigate GHG and NO emissions from drip-fertigated crops. Sci. Total Environ. 2014, 490, 880–888. [Google Scholar] [CrossRef] [Green Version]
  37. Wang, J.; Shen, C.; Liu, N.; Jin, X.; Fan, X.; Dong, C. Non-destructive evaluation of the leaf nitrogen concentration by in-field visible/near-infrared spectroscopy in pear orchards. Sensors 2017, 17, 538. [Google Scholar] [CrossRef] [PubMed] [Green Version]
  38. Zhang, F.S. Soil Test and Fertilization Techniques; Agricultural University Press: Bejing, China, 2006. (In Chinese) [Google Scholar]
  39. He, P.; Jin, J.Y.; Pampolino, M.F.; Johnston, A. Approach and decision support system based on crop yield response and agronomic efficiency. Plant Nutr. Fert. Sci. 2012, 18, 499–505. (In Chinese) [Google Scholar]
  40. Wang, X.; Liu, B.; Wu, G.; Guo, X.; Jin, G.; Jin, Z.; Zou, C.; Chadwick, D.; Chen, X. Cutting carbon footprints of vegetable production with integrated soil-crop system management: A case study of greenhouse pepper production. J. Clean. Prod. 2020, 254, 120158. [Google Scholar] [CrossRef]
  41. Zhou, J.; Li, B.; Xia, L.; Fan, C.; Xiong, Z. Organic-substitute strategies reduced carbon and reactive nitrogen footprints and gained net ecosystem economic benefit for intensive vegetable production. J. Clean. Prod. 2019, 255, 984–994. [Google Scholar] [CrossRef]
  42. Shi, S.Q.; Cai, L.; Weng, Y.; Wang, D.; Sun, Y. Comparative life-cycle assessment of water supply pipes made from bamboo vs. polyvinyl chloride. J. Clean. Prod. 2019, 240, 118172. [Google Scholar] [CrossRef]
Figure 1. Life cycle and system boundaries of pear production by the furrow and drip irrigated systems in Loess Plateau of China.
Agronomy 11 01201 g001
Figure 2. The water depletion (WD) and water footprint (WF) of furrow and drip irrigation pear production system in different phases. Phase I–IV represent the orchard installation phase, the primary growing phase, the low production phase, and the full production phase, respectively. The WD of the furrow system was 45.0–70.5% higher than that of the drip system, and the WFs were 2.3, 3.5, and 2 times that of the drip system. GWF was the major drive for the furrow system, while BWF played a dominant role in the drip system. Different letters represent significant differences (p < 0.05) among the phases (a, b, c, and d).
Agronomy 11 01201 g002
Figure 3. Annual GWP, AP, and EP expressed per hectare of furrow and drip irrigated pear production system in different phases. Phase I–IV represent the orchard installation phase, the primary growing phase, the low production phase, and the full production phase, respectively. AMS and OMS are the abbreviation of the agriculture materials input stage and orchard management stage, respectively. Different letters represent significant differences (p < 0.05) among the phases (a, b, c, and d).
Agronomy 11 01201 g003
Figure 4. Annual GWP, AP, and EP expressed per ton of the fruit of furrow and drip irrigation pear production system in different phases. Phase II–IV represent the primary growing phase, the low production phase, and the full production phase, respectively. AMS and OMS are the abbreviation of the agriculture materials input stage and orchard management stage, respectively. Different letters represent significant differences (p < 0.05) among the phases (a, b).
Agronomy 11 01201 g004
Figure 5. Phase contribution analysis of the furrow and drip irrigated pear production system. Phase I–IV represent the orchard installation phase, the primary growing phase, the low production phase, and the full production phase, respectively.
Agronomy 11 01201 g005
Table 1. Inventory data of furrow and drip irrigation pear orchards expressed as per hectare per year during the four growing phases. Fruit yield and waste pruning were expressed by means followed by different letters represent significant differences (p < 0.05) between drip and furrow irrigated systems (a, b).
InputsOrchard Installation Phase
Phase I
Primary Growing Phase
Phase II
Low Production Phase
Phase III
Full Production Phase
Phase IV
FurrowDripFurrowDripFurrowDripFurrowDrip
Total fertilizer (kg ha−1 y−1)
N403626417198528278831362
P2O572.3125147102202237555308
K2O18330618321.118371.5258132
Synthetic fertilizer
N55.246.569.6186180266625350
P2O50.04.674.490.1130225512296
K2O0.01.60.09.10.059.5150120
Organic fertilizer
N348580348123481220612
P2O572.3121721272.31242.912
K2O183304183121831210812
Electricity (kWh ha−1 y−1)815515988665139490116301115
Irrigation water (m3 ha−1 y−1)480028505528328881004125104285776
Pesticides (kg ha−1 y−1)6.14.36.86.512.711.816.815.3
Paper bags (kg ha−1 y−1)00100100500500900900
Diesel consumption (L ha−1 y−1)1251255647.57552.59062.5
PVC supplies (kg ha−1)0602000000
Output
Yield (t ha−1 y−1)007 ± 1 a9 ± 1 a27.5 ± 2.5 b37.5 ± 2.5 a72.4 ± 5.5 a67.5 ± 3.5 b
Waste pruning (t ha−1 y−1)001.2 ± 0.2 a0.6 ± 0.1 b3.1 ± 0.3 a1.9 ± 0.3 b4.8 ± 0.9 a2.9 ± 0.3 b
Waste paper bags (kg ha−1 y−1)00100100500500900900
Table 2. The total global warming, acidification, eutrophication impacts, and water depletion during 2009–2018.
ImpactsUnitPer Hectare of Cultivation AreasPer ton of Fresh Pear Fruit Harvest
FurrowDripFurrowDrip
TEIGWPkg CO2-eq96,86456,424225130
APkg SO2-eq14813993.40.9
EPkg PO4-eq7702551.80.6
TWDWDm3101,90163,863236148
Table 3. Sensitivity analysis of changing the emission parameters of reactive nitrogen losses on the environmental impacts assessment.
Furrow Irrigated SystemDrip Irrigated System
GWP
(kg CO2-eq t−1)
AP
(kg SO2-eq t−1)
EP
(kg PO4-eq t−1)
WF
(m3 kg−1)
GWP
(kg CO2-eq t−1)
AP
(kg SO2-eq t−1)
EP
(kg PO4-eq t−1)
WF
(m3 kg−1)
Baseline1942.71.40.371020.70.40.20
EP-10% (N2O emission)1892.71.40.371010.70.40.20
EP-10% (nitrate leaching)1912.71.30.351010.70.40.19
EP-10% (NH3)1932.51.40.371020.60.40.20
Publisher’s Note: MDPI stays neutral with regard to jurisdictional claims in published maps and institutional affiliations.

