Article

Impact of Fungicide Application and Host Genotype on Susceptibility of Brassica napus to Sclerotinia Stem Rot across the South-Western Australian Grain Belt: A Genotype × Environment × Management Study

by
Sarita Jane Bennett
1,*,
Ashmita Rijal Lamichhane
1,
Linda L. Thomson
1,
King Yin Lui
1,2 and
Pippa J. Michael
1
1
Centre for Crop and Disease Management, Curtin University, GPO Box U1987, Perth, WA 6845, Australia
2
Currently at Department of Primary Industries & Regional Development, Kununurra, WA 6743, Australia
*
Author to whom correspondence should be addressed.
Agronomy 2021, 11(6), 1170; https://doi.org/10.3390/agronomy11061170
Submission received: 30 April 2021 / Revised: 27 May 2021 / Accepted: 4 June 2021 / Published: 8 June 2021
(This article belongs to the Special Issue Genotype× Environment Interactions in Crop Breeding)

Abstract

:
Sclerotinia stem rot (SSR), caused by the necrotroph Sclerotinia sclerotiorum Lib. (de Bary), is a major disease of canola in Australia, greatly reducing yields in high infection years. This study investigated genotype by environment by management interactions at 25 sites across the south-west Australian grainbelt from 2017 to 2020. Up to 10 canola varieties were grown each year with +/− fungicide application at 30% flowering. Disease incidence was low, with less than 20% infection recorded across most sites. Most variation in yield occurred between sites, rather than by management or variety, due to the environmental differences between the sites. Petal assays were found to be a poor indicator of later disease severity, suggesting the winter growing season in south-west Australia does not have reliable conducive conditions for disease development following petal drop in canola. The Additive Main Effects and Multiplicative Interaction model (AMMI) indicated that the open-pollinated varieties were broadly adapted and stable when fungicide was applied but became unstable with no fungicide, indicating SSR has a significant impact on yield when disease incidence is higher. This study highlights that further research is necessary to determine disease thresholds that lead to significant yield loss.

1. Introduction

Canola (Brassica napus L., oilseed rape) is the second most important oilseed crop in the world, with Europe, Canada, China, India and Australia the largest producers, respectively [1]. The rising demand for vegetable oils as a result of the increasing global population and changing energy policies for renewables in some countries means demand for oilseed is predicted to increase [2]. However, since the 1990s the average growth rate of canola yields has steadily declined in Australia and Europe, which has been attributed to less effective control of biotic stresses [1].
Sclerotinia stem rot (SSR), caused by the necrotrophic plant pathogen Sclerotinia sclerotiorum Lib. (de Bary), is one of the most destructive diseases of canola leading to significant yield losses in high infection years [3,4]. Due to a lack of host resistance, management of SSR typically occurs by prophylactic application of fungicides and crop rotation. However, accurate prediction of disease incidence is difficult as potential infection is related to environmental conditions including rainfall, humidity and temperature, as well as previous infection and crop rotation [5]. Furthermore, the use of crop rotation as a management tool is challenging due to the wide host range of S. sclerotiorum and long-term persistence of inoculum. Sclerotinia sclerotiorum has over 400 plant hosts [6] including canola and other pulses such as lupins (Lupinus angustifolius L.) and chickpeas (Cicer arietinum L.). Sclerotia, the resting bodies of S. sclerotiorum, are hard melanized structures that can persist in the soil for up to 8 years [7]. As canola is a highly profitable crop, rotations between canola plantings are generally less than 8 years, and in many areas a pulse crop is also included in the rotation [8]. The growing intensity of production and frequency of canola plantings within Australian farming systems creates an increased risk for SSR disease and has likely led to a surge of SSR incidence reports in recent years [4,9]. Integrated pest management (IPM) tactics including burning chaff windrows have the potential to reduce the carry-over of sclerotia into future years [10], but they are not recommended except in severe infection events. Strategies to maximize the efficacy of expensive fungicide applications and curtail the use of prophylactic spraying in order to reduce the impact of the disease is vital.
A study by Kirkegaard [4] on two canola yield trials located in the high-rainfall zone of New South Wales, Australia, reported that for each 1% increase in canola plants infected with SSR, yield decreased by 1.3%. This was markedly higher than the 0.5% yield reduction for each 1% increase in stem infection reported in experiments from Canada [11]. Kirkegaard et al. [4] suggested that the greater yield loss is due to larger plants and typically lower densities of canola crops under Australian conditions that would increase the potential yield loss associated with main-stem infection of individual plants compared to Canadian crops. However, this work was conducted in the high-rainfall agricultural zone of eastern Australia and may not be representative of all canola-growing regions in Australia. Canola is typically grown in the medium-to-high rainfall zones of southern Australia but does extend to low-rainfall zones where the annual rainfall is as low as 325 mm [12]. As annual rainfall declines, seeding rates also decline as does the risk of SSR. Yield loss from SSR may therefore vary depending on the environmental conditions at a site, along with the potential yield.
Genotype by Environment by Management (G × E × M) studies are important in determining the implications of plant diseases on crops in the field, compared to controlled conditions in the laboratory or glasshouse. Disease development varies significantly under different environmental conditions, and disease predictions in the laboratory are often not transferrable. However, G × E × M studies are not common in plant diseases because of the challenges of comparable disease incidence between sites and between years [13]. A study of SSR in the field as a G × E × M investigation is further challenged because of the sporadic and unpredictable nature of the disease [3,7], with disease outbreaks difficult to predict [10].
The aim of this study was to investigate the impact of fungicide management on SSR disease incidence and yield of commercially available canola varieties, as well as the potential contribution of sclerotia to future SSR infections across the south-west Australian grainbelt from 2017 to 2020. To determine the potential infection risk, in-field petal infection assays were undertaken in 2018–2020 along with pre-season soil sampling for background sclerotia levels in the soil.

2. Materials and Methods

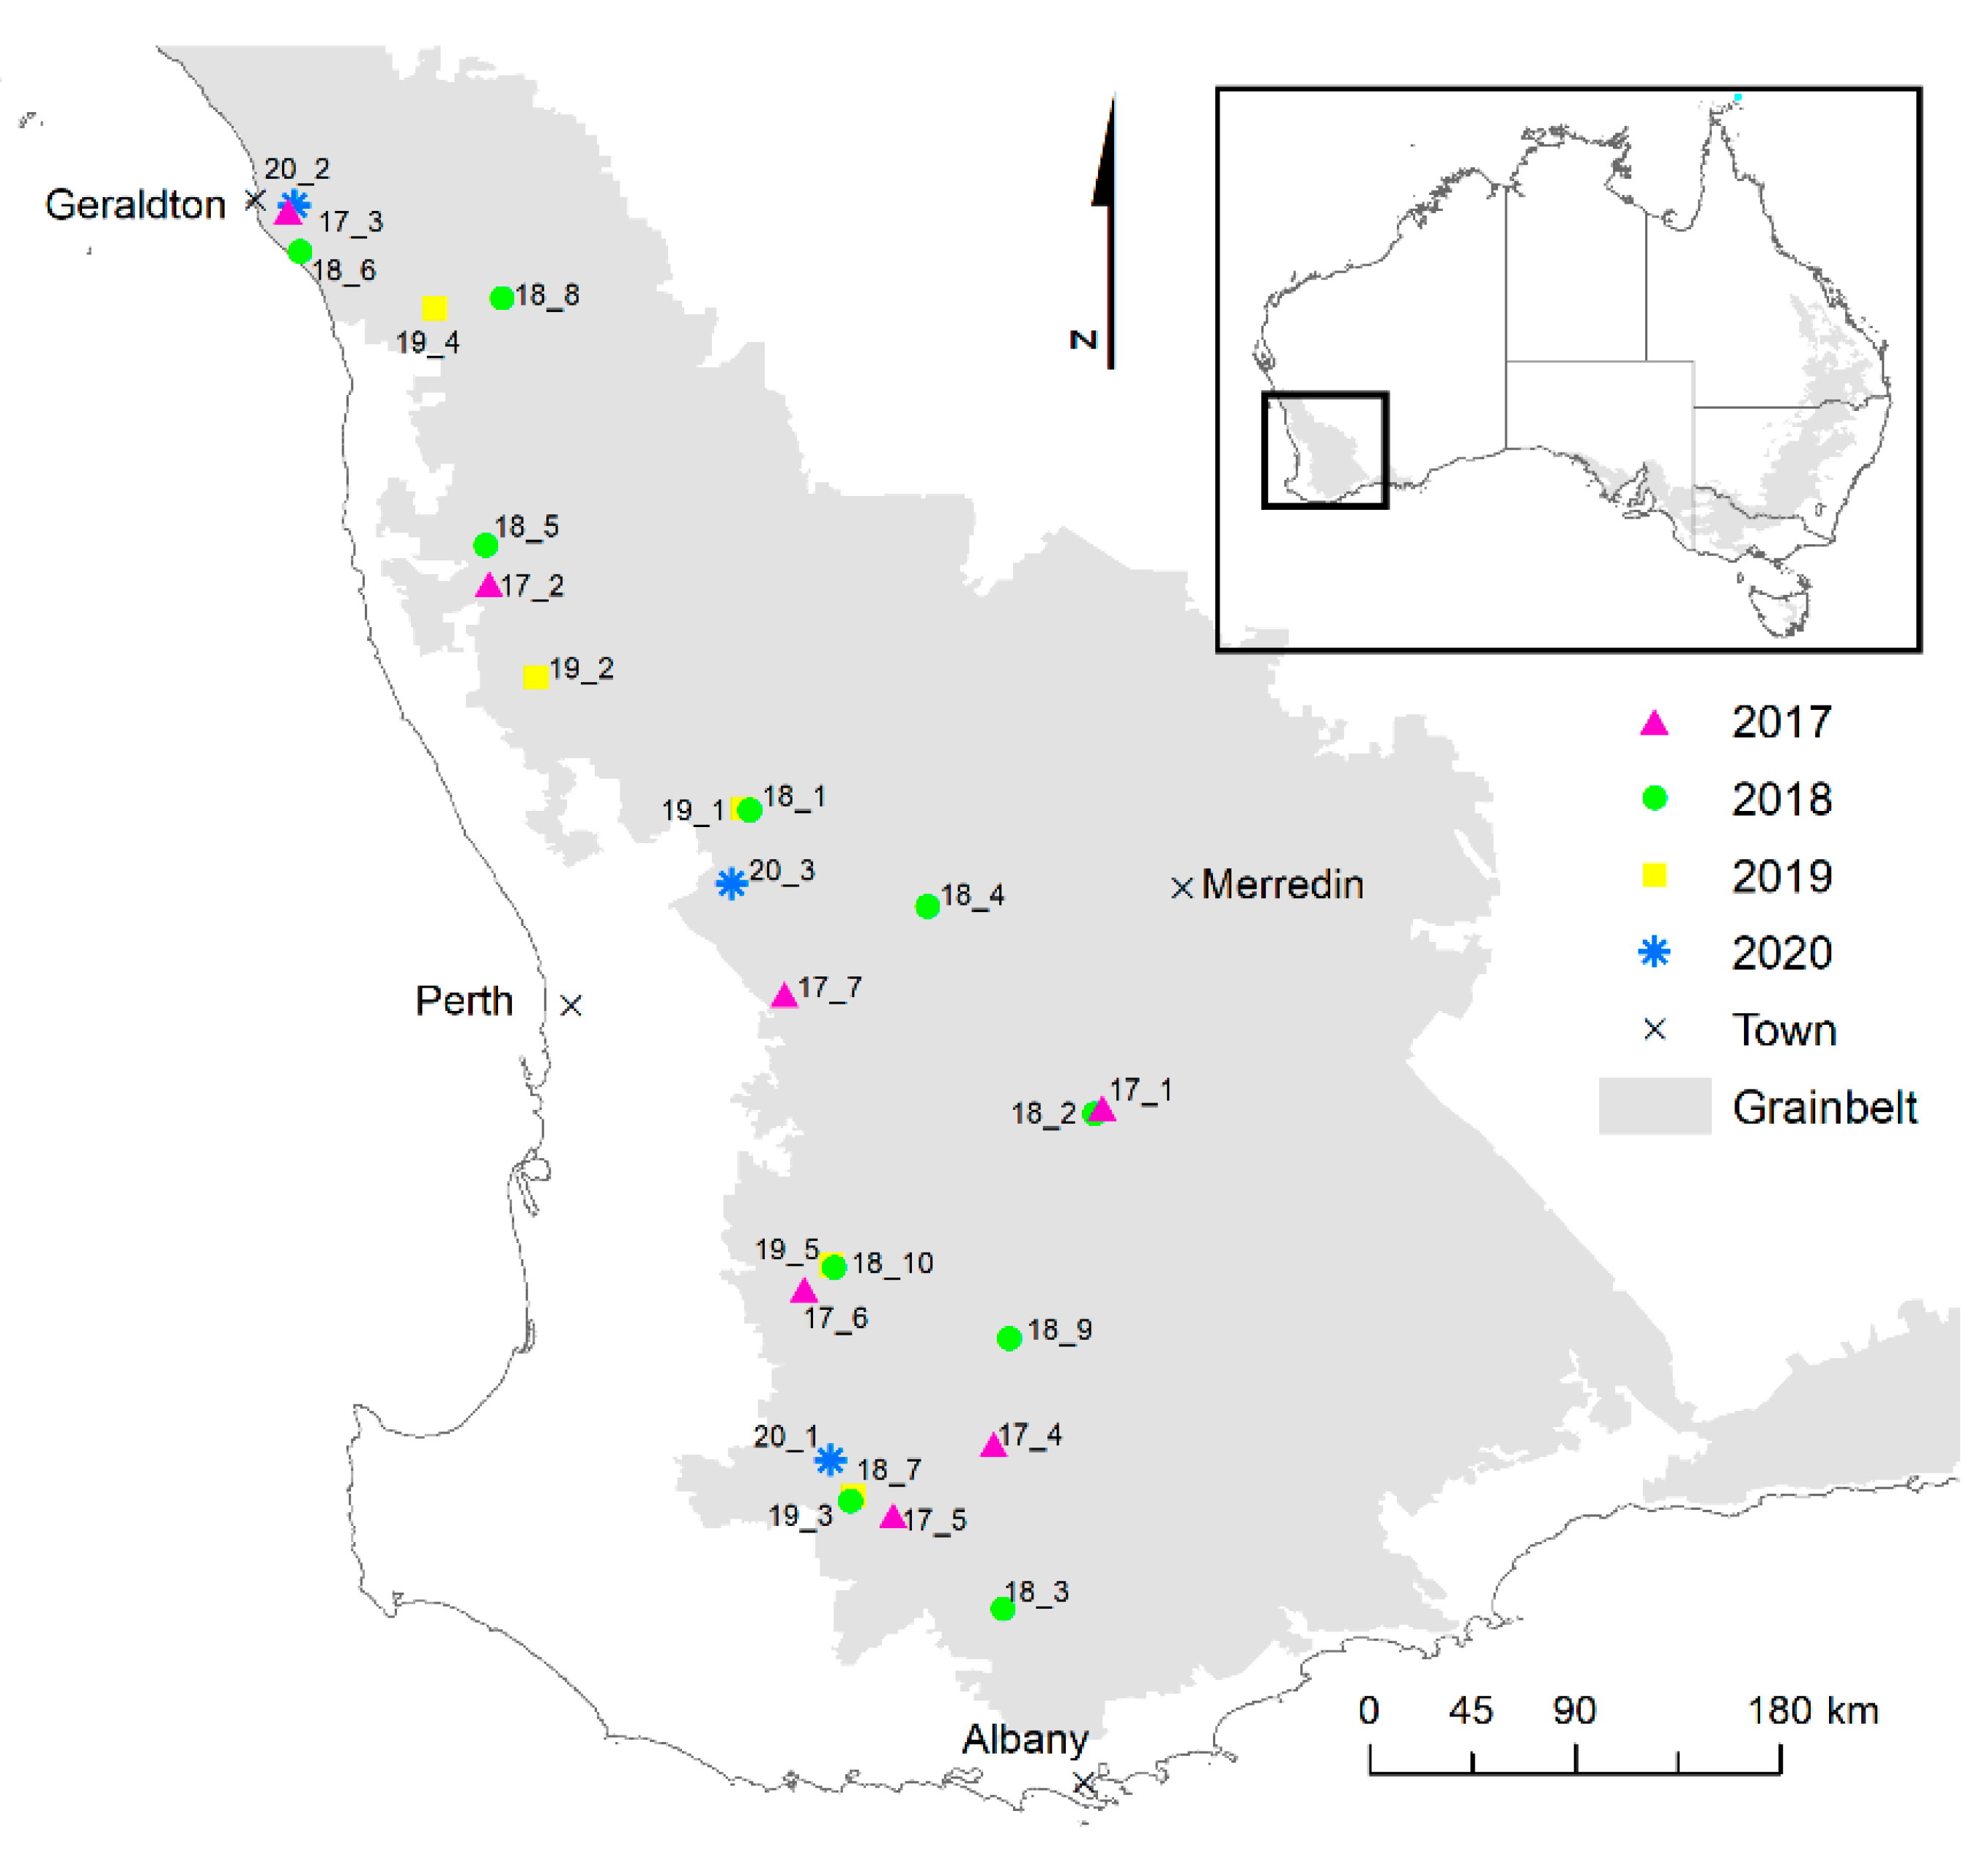
2.1. Sites and Experimental Design

Small-scale field plot experiments were conducted over a four-year period (2017–2020) across 25 farming enterprises within the south-western Australian grainbelt (Figure 1). Within each site a minimum of two commercial canola varieties were sown (Table 1) at recommended field rates (Table S1) and two fungicide treatments were applied: (a) control (no fungicide application) and (b) sprayed (fungicide application of Prosaro® 400 mL/ha at 30% flowering, when 30% of the canola plants within a plot have their first flowers open). A total of 13 canola varieties were evaluated over the 4 years (Table 1), with ATR Bonito and Hyola 559TT sown at all 25 sites across the four growing seasons and ATR Mako and InVigor T4510 sown at 18 sites from 2018 to 2020. Each site consisted of field plots (seeder width, 1.5–1.8 m × 10–12 m) arranged in a randomized block design with each variety and fungicide treatment replicated three times, with six to eight rows (25 cm spacing) per plot depending on the small-trial seeder used. Plots were sown and managed agronomically according to recommended current farmer practice (Table S1), with pesticide and fertilizer applied as required during the season to sustain high yields. Minimum and maximum daily temperature (°C), and total rainfall (mm) data during May to October (winter growing season) were obtained for each site [9], with both year of study and long-term data (1950–2020) collected (Table 2).

2.2. Field Measurements

To assess the level of existing inoculum (sclerotia) present at a site, soil cores were sampled from 18 sites (2018–2020) prior to sowing. For each plot, two replicate samples were taken from the middle of the plot at 2.5 and 7.5 m lengths using a 3 × 10 cm soil corer. Sclerotia were separated from the soil using a 300 mm diameter sieve with 2 mm woven wire and number of sclerotia per kilogram of soil calculated. Potential in-season infection risk from the same 18 sites above was determined by randomly sampling 12 whole flowers from replicate 1 control plots prior to fungicide application at 30% flowering. Collections took place during late morning, at least 4 hours after rain, with one flower sampled per plant. Individual flowers were placed in paper envelopes and kept cool. Single petals from each flower were plated onto 9 cm petri dishes containing potato dextrose agar (PDA) with four petals per 9 cm plate, one in each quadrant, and incubated at 20 °C in the dark. After 3 days, plates were scored for visible signs of actively growing S. sclerotiorum mycelium.
Plant emergence (number of plants per m2) was measured approximately 1 month after sowing for all sites, with number of plants per 50 cm within a row recorded ten times in a “v” pattern across each plot. Disease incidence (DI) per plot was determined after leaf drop, and prior to harvest, but before stems had changed color to enable ease of assessment of characteristic SSR stem lesion bleaching. Using a 50 cm ruler randomly placed greater than 1 m along the first inner row of the trial plot, the main stems from five individual plants were scored for the presence of SSR lesions on the main stem, from the base of the plant to below the lowest floral branch. Once 5 stems were scored (0 = no lesions, 1 = 1 lesion, up to 5 = 5 lesions) the ruler was placed 50 cm further along the next inner row and scoring repeated in an “v” pattern so that 10 measurements (50 individual plants) were taken per plot. To characterize disease severity per plot, five diseased plants were randomly selected and placed in a large paper bag. If no diseased plants could be found, healthy plants were taken instead. Plant samples were stored in a protected shelter at Curtin University’s field station in Perth, Western Australia, until plants had completely dried. Stem thickness (mm) at base and stem thickness at junction of first lateral branch were measured for each plant sample. The following measurements were taken of the lowest lesion on the main stem: height (mm) from base of plant to lowest point of first primary stem lesion, lesion length (mm), and number of sclerotia in each size fraction (<3 mm, 3–4 mm, >4 mm) within the stem. Stem thickness and sclerotia size were measured using digital calipers (Bahco 0–150 mm 1150D). Seed yield (kg) per plot was measured using a small trial harvester (Haldrup), before being converted to tonnes per hectare (t/ha) using plot dimensions.

2.3. Statistical Analysis and GIS Methods

McNemar’s chi-squared test on disease presence, Pearson’s correlation between yield and disease incidence and linear regression of ascospore presence on petals were analyzed in R [16]. Disease incidence and yield data were analyzed in Genstat (20th ed.; VSN International Ltd., Hemel Hempstead, UK) using an analysis of variance (ANOVA), with data transformed to meet normality and homogeneity of variance where required. Following ANOVA, significant differences between means were determined using Tukey’s post hoc test (p < 0.05). The R package “agricole” [17] was used to produce an Additive Main Effects and Multiplicative Interaction Model (AMMI) on yield, which analyses main effects and genotype by environment interactions in multi-location variety trials. The varieties were labelled as variety + treatment, to be able to separate the variety response to trial site under the two treatments. Principal Components Analysis (PCA) on data from the diseased plots was performed in R [16] using four independent variables arranged as a correlation matrix: yield, disease incidence, average lesion length and average number of sclerotes. Only plots with all variables measured were used (246 plots across 16 trial sites) in the PCA.
Boxplot data were plotted using the R package “ggplot2” [18] with each boxplot visualizing the median, mean, two hinges (25th and 75th percentiles), two whiskers (largest value no further than 1.5 × interquartile range), and all outliers. The map was generated with ArcMap (version 10.7.1; Esri Inc., Berkley, CA, USA).

3. Results

Weather conditions during the study period (Table 2) highlight the dry environment experienced for the large majority of sites, with 22 of the 25 locations receiving less than the long-term growing season rainfall (4–39%) and 10 sites receiving at least 80 mm less rain. Average maximum daily temperatures were also higher (0.3–1.8 °C) over the growing season at all sites across the 4 years, with sites in 2019 and 2020 having an average maximum temperature of more than 1 °C above the long-term average. Less difference was observed in the average minimum daily temperature, although in 2019 all sites except for Dandaragan (19-2) had a lower average minimum daily temperature than the long-term average.

3.1. Disease Incidence and Yield

Disease incidence was low for all sites across all years (3.8 ± 0.3% for control plots, 2.1 ± 0.2% for sprayed plots) with the highest level of disease in a single plot recorded in 2018 (36%; site 18-1), followed by all three 2020 sites (20–28%; Tables S2–S4). However, there was significant variation in DI between plots, with some plots at nearly all sites recording no plants with SSR infection and an average across the sites of less than 20% in all years. Disease incidence could not be assessed for site 18-6, and it was removed from analysis. An unbalanced ANOVA across plots (n = 780) found significant differences between main treatments (Variety, Site and Management) and the interactions between Variety and Site, and Management and Site. However, variance ratios (v.r.) highlight the significant contribution of Site (df = 23, v.r. = 58.0, p < 0.05), Management (df = 1, v.r. = 57.4, p < 0.05) and Variety (df = 12, v.r. = 23.6, p < 0.05) when compared to the interactions, with variance ratios of less than 3.5.
Disease incidence was also highly variable within varieties, as shown in Figure 2 for 25 sites with ATR Bonito and Hyola 559TT (2017–2020), and Figure 3 for 18 sites with ATR Mako and InVigor T4510. This highlights the variability in DI recorded between sites, and also between plots at each site, particularly 18-1 and the 3 sites in 2020. A total of 6 sites had no SSR recorded in any varieties over the 4 years (17-1, 17-7, 18-10, 19-1, 19-2, 19-4).
Due to marked differences in growing season conditions between years, and the significant differences between sites dominating the analysis, results were further investigated based on individual varieties within a site. ANOVA results of the 4 varieties included in all 18 trials from 2018–2020 showed significant interactions of Site × Management for DI in ATR Bonito, ATR Mako and InVigor T4510 (Table 3). However, the variance ratio for the interaction is low when compared to the main effect of Sites and Management in all varieties except for ATR Bonito, with Management having no significant effect on DI. The dominant contribution of the main effects of Site and Management to overall variation in DI was also observed in the unbalanced ANOVA (n = 780). There was no significant interaction between Site × Management for yield in any of the 4 varieties, and only Hyola 559TT responded with a significant difference in Management. Highly significant differences were observed between sites for all 4 varieties, with the large majority of yield variation (v.r.) directly attributed to the main effect of Site.
For all 13 varieties, an individual ANOVA on DI and yield within each site (Tables S2–S4) found that although there were several instances when Management had a significant effect on DI, there were no significant differences found in yield.
McNemar’s chi-squared test, which tests for consistency in response to 2 variables, in this case DI and yield, (χ2 = 9.735, df = 1, p-value = <0.001) showed that across all sites and varieties disease was present in 42% of all plots (n = 780), with control (unsprayed) plots having a higher disease presence (46% of plots, p < 0.002) than those which had a fungicide application (38% of plots) at 30% flowering. However, a Pearson’s correlation between DI and yield found no correlation across the whole study (n = 780). Even when using only the 18 sites with all 4 varieties present (ATR Bonito, ATR Mako, Hyola 559T and InVigor T4510) the correlation was below 0.2.

3.2. Pre-Season Soil Sclerotia

For the majority of sites, no sclerotia were found in the soil samples taken prior to the trials being sown. The highest number of sclerotia collected was at site 18-6 (Greenough, 23 ± 3.6 sclerotia/kg soil) in 2018, followed by 18-1 (Bolgart, 5.0 ± 0.9 sclerotia/kg soil) and 19-3 (Cranbrook, 4.0 ± 1.4 sclerotia/kg soil). Despite the higher levels of SSR infection recorded in 2020, less than 1 sclerotia per kg (0.3) was found at site 20-2 (Moonyanooka) and only 1 sclerotia was collected at site 20-1 (Kojonup) prior to sowing. All other sites found no sclerotia present in soil samples.

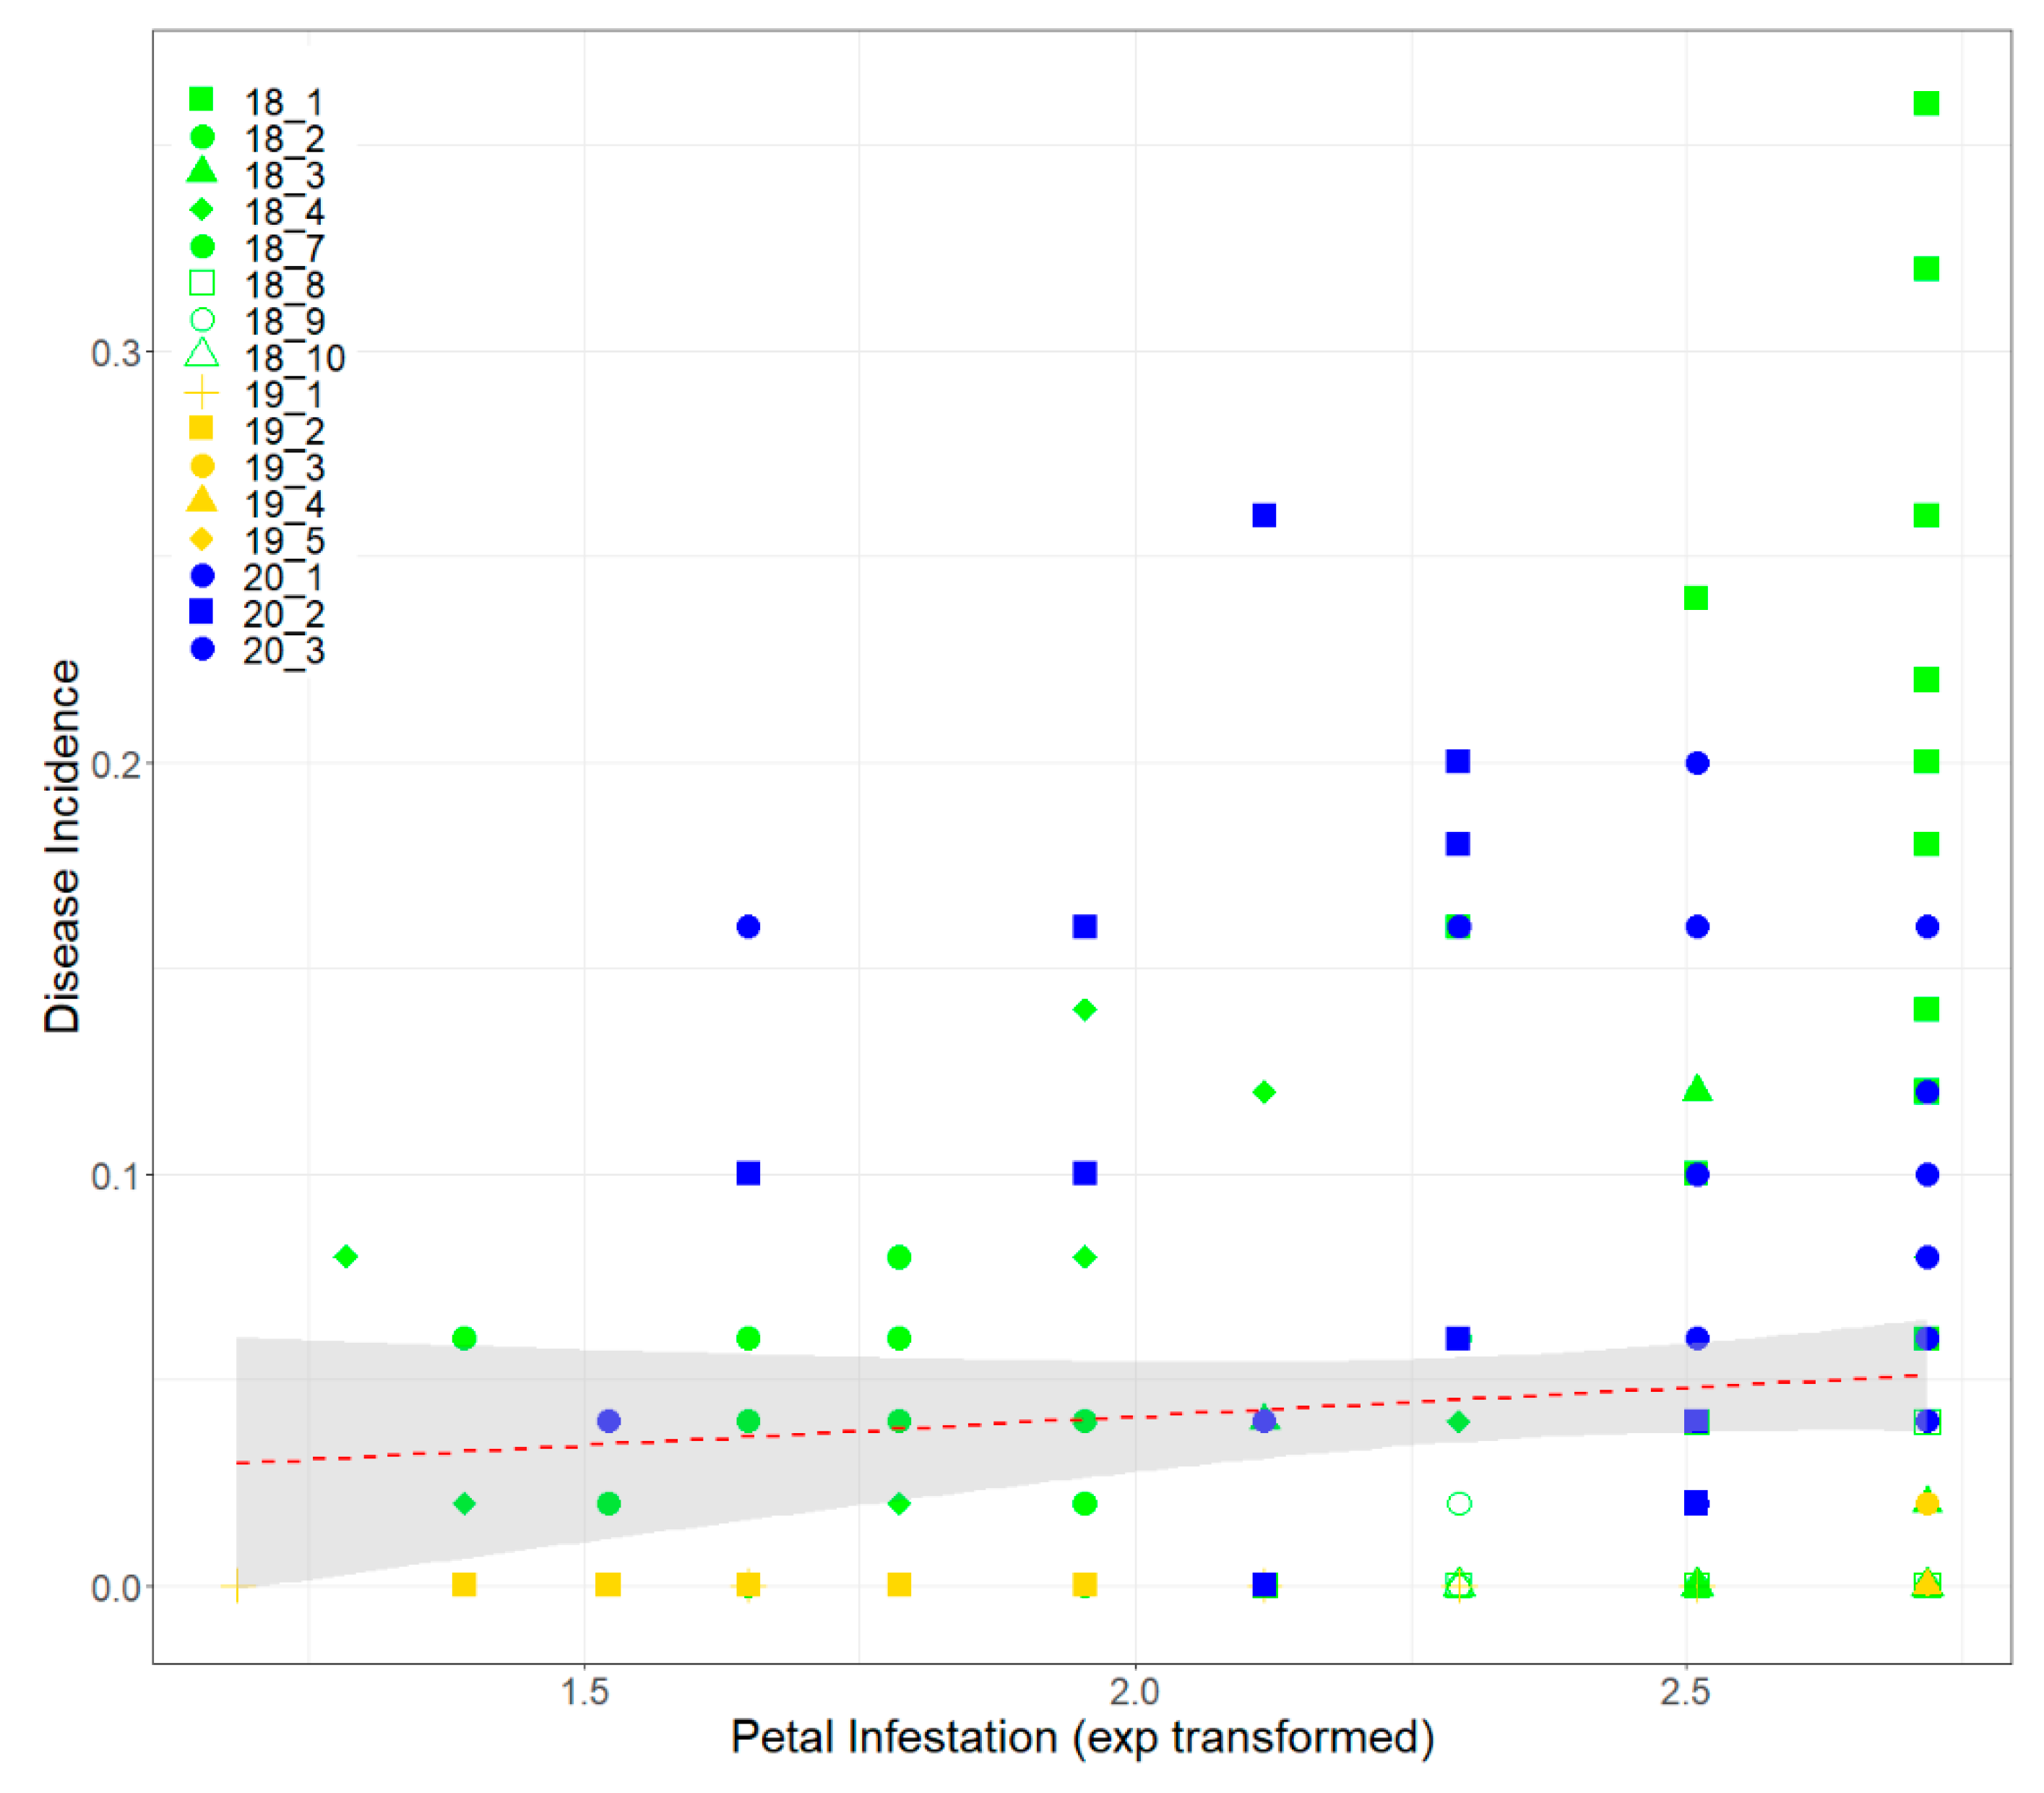
3.3. Petal Test Assay

The petal test assays performed at 30% flowering on control plots found over half the petals contained S. sclerotiorum ascospores at all sites, and that in two-thirds of the sites more than 80% of petals contained S. sclerotiorum ascospores. Regression analysis of DI and petal infestation (Figure 4) found no correlation existed between the 2 variables and showed that when ascospore presence on petals is low DI is always low, but when ascospore presence on petals is high (>75%) DI is hugely variable (ranging from 0% to 36%). Sites 18-5 and 18-6 were excluded from the regression analysis as petal incidence and DI were not recorded, respectively.

3.4. Diseased Stem Variables
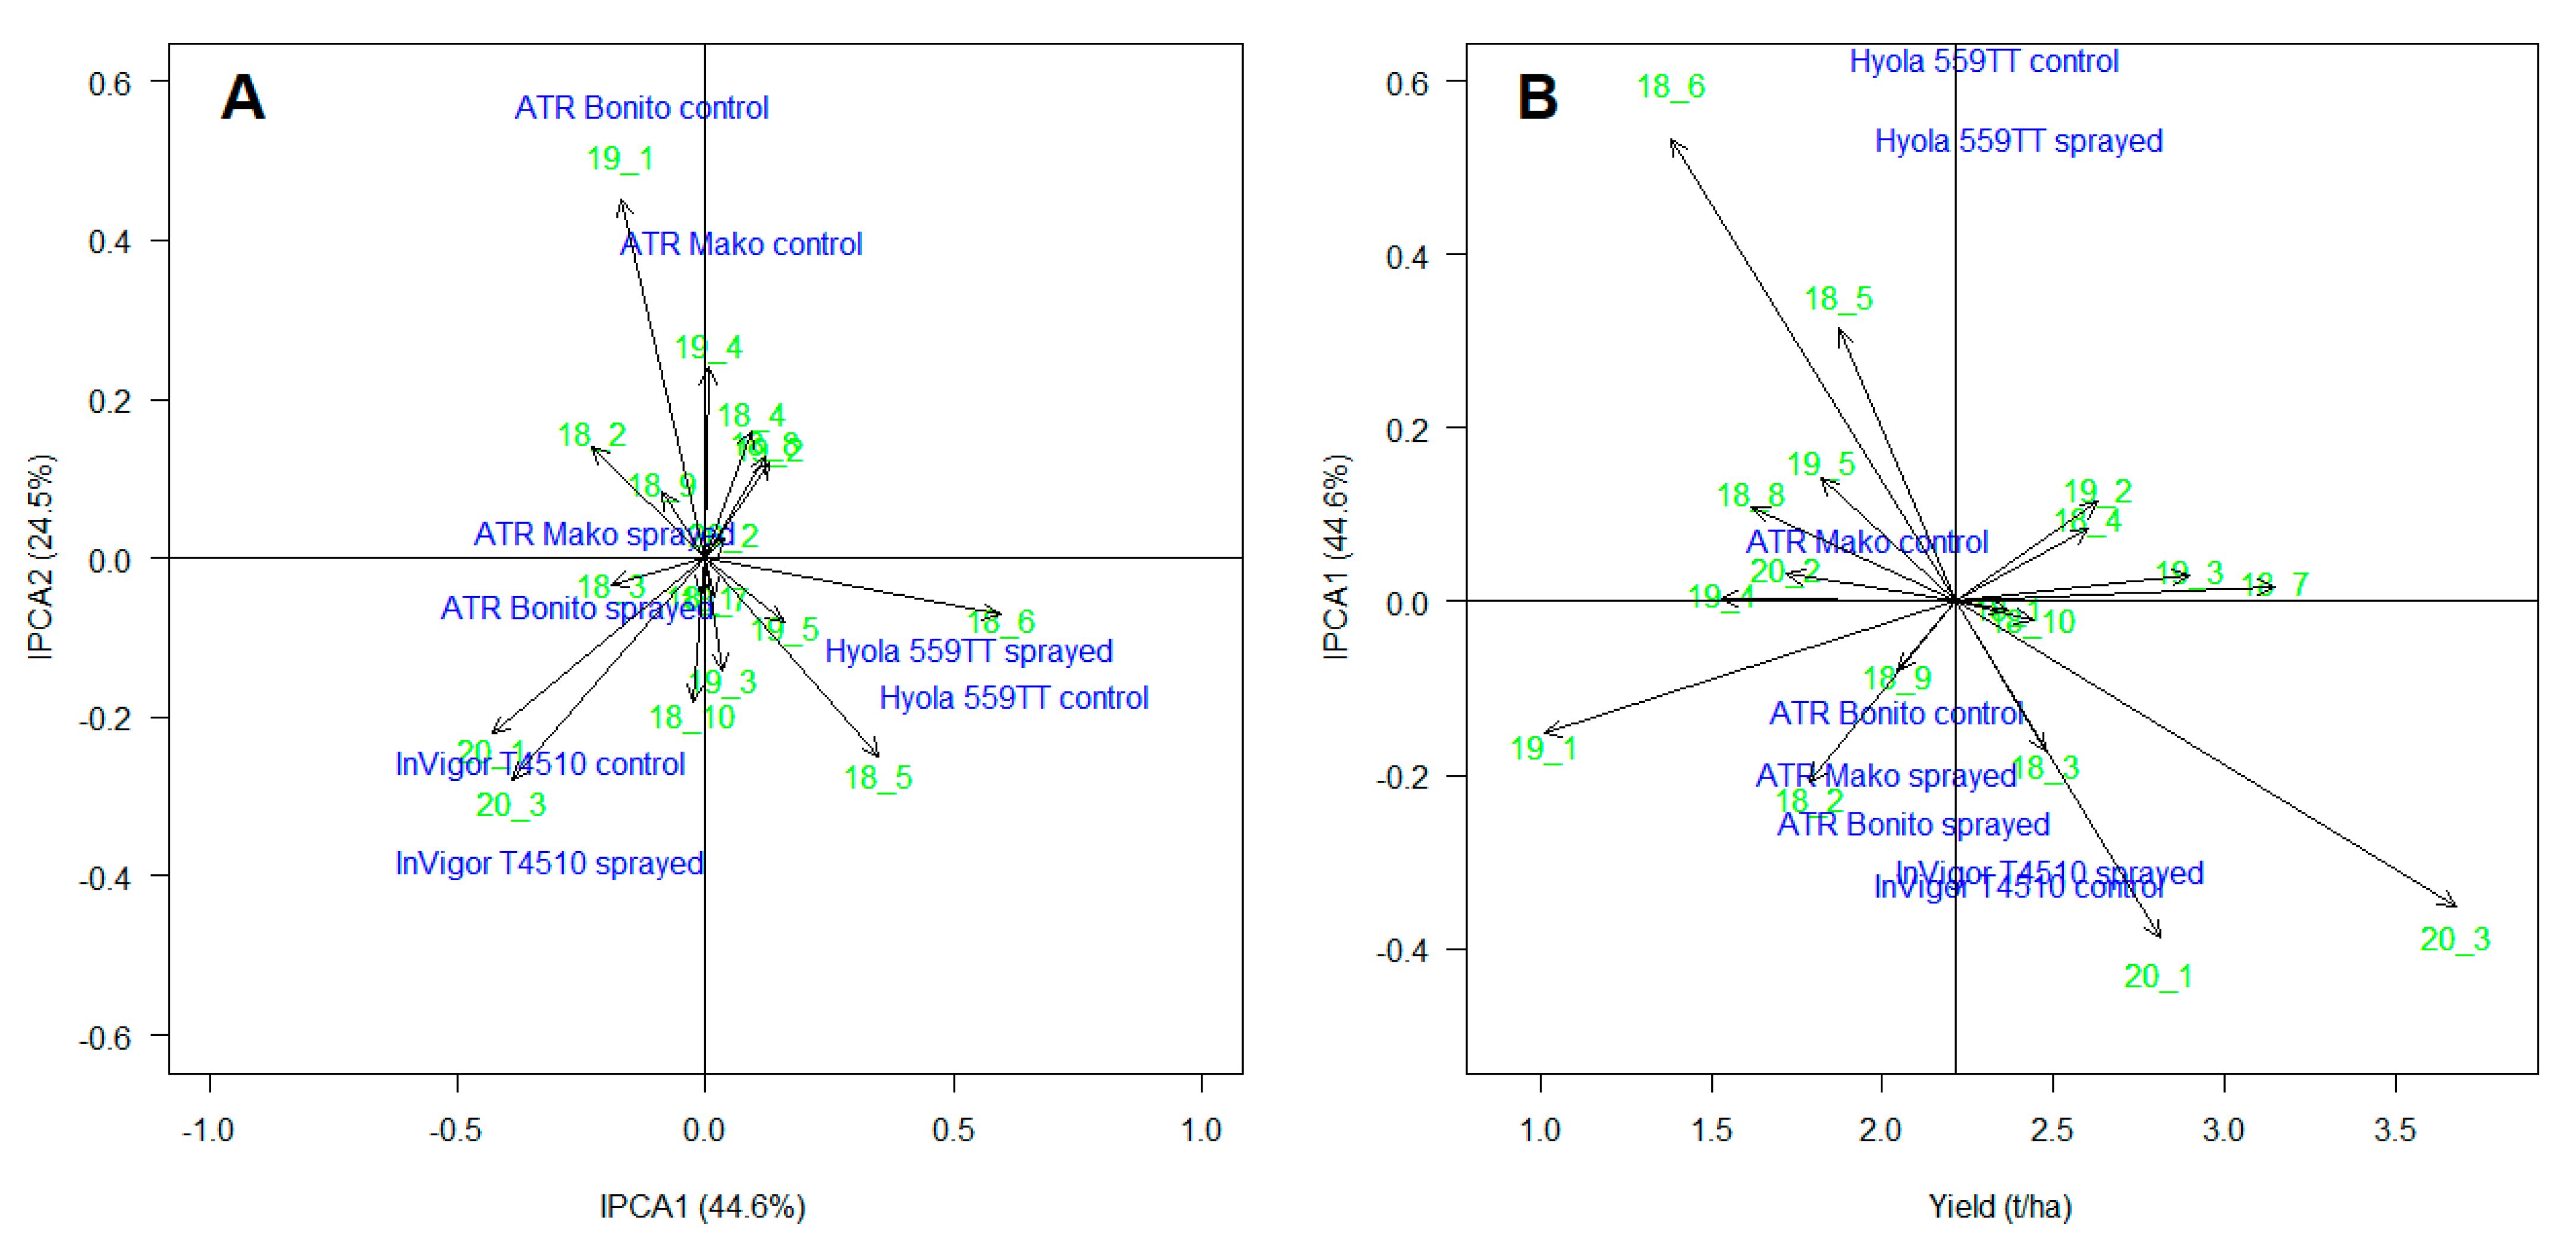
Diseased stem data (lesion length, total sclerotia number, sclerotia weight and size fractions) collected was markedly variable with many missing data points, as not all diseased plants produced sclerotia within the stem. The results of an unbalanced ANOVA therefore typically did not follow a normal distribution, even following transformation, and some sites and varieties were dropped from the analysis. For this reason, results of the unbalanced ANOVA are not presented. The variability in the measurements recorded between sites and between varieties is shown in Figures S1 and S2 where it can be seen that although the highest levels of SSR were not recorded in 2017, the lesion lengths of plants that were infected with S. sclerotiorum were higher in 2017 than in any other year, although this did not lead to higher numbers of sclerotia produced within the stem.

3.5. AMMI Analysis

An AMMI plot was conducted on data from the 18 sites that included the 4 canola varieties ATR Bonito, ATR Mako, Hyola 559TT and Invigor T4510. The aim of the AMMI analysis was to investigate the genotype (canola × fungicide treatment) by environment (trial site) interactions. An ANOVA was run on the dataset, and then a PCA was applied to the residuals of the ANOVA. Results showed that all factors were significant (p < 0.05) including Interaction PCA1 (IPCA1) and IPCA2 (Table 4). IPCA1 was found to explain 44.6% of the interaction variation, and IPCA2 explained 24.5%. Figure 5A shows a plot of IPCA1 by IPCA2, where it can be seen that in the hybrid varieties Hyola 559TT and InVigor T4510, the genotype cluster is by variety, whereas in the open-pollinated varieties ATR Bonito and ATR Mako, the genotype clusters are by management. Most sites were found to cluster around the origin of IPCA1 and IPCA2 (Figure 5A). However, 20-1 (Kojonup 2020) and 20-3 (Toodyay 2020) form a cluster on the basis of high negative IPCA1 and IPCA2 scores, 18-5 (Greenough 2018) and 18-6 (Dandaragan 2018) form individual clusters on the basis of high positive IPCA1 scores, and 19-1 (Bolgart 2019) forms an individual cluster on the basis of a high IPCA2 score. All genotypes (variety by treatment) were sensitive to environmental interactions and are specifically adapted, apart from ATR Mako sprayed and ATR Bonito sprayed, which are located close to the origin and thus broadly adapted. These results indicate that if ATR Mako and ATR Bonito are not sprayed for SSR, they have a strong environmental response but are broadly adapted to all environments where SSR is controlled. However, InVigor T4510 and Hyola 559TT have a strong environmental response independently of whether they are sprayed for SSR or not. Figure 5A suggests that Hyola 559TT shows a positive adaptation to 18-5 and 18-6, InVigor T4510 a positive adaptation to 20-1 and 20-3, and ATR Bonito unsprayed and ATR Mako unsprayed have a positive adaptation to 19-1 and to a lesser extent 19-4 (Mingenew 2019). Both of these sites had no recorded disease in 2019.

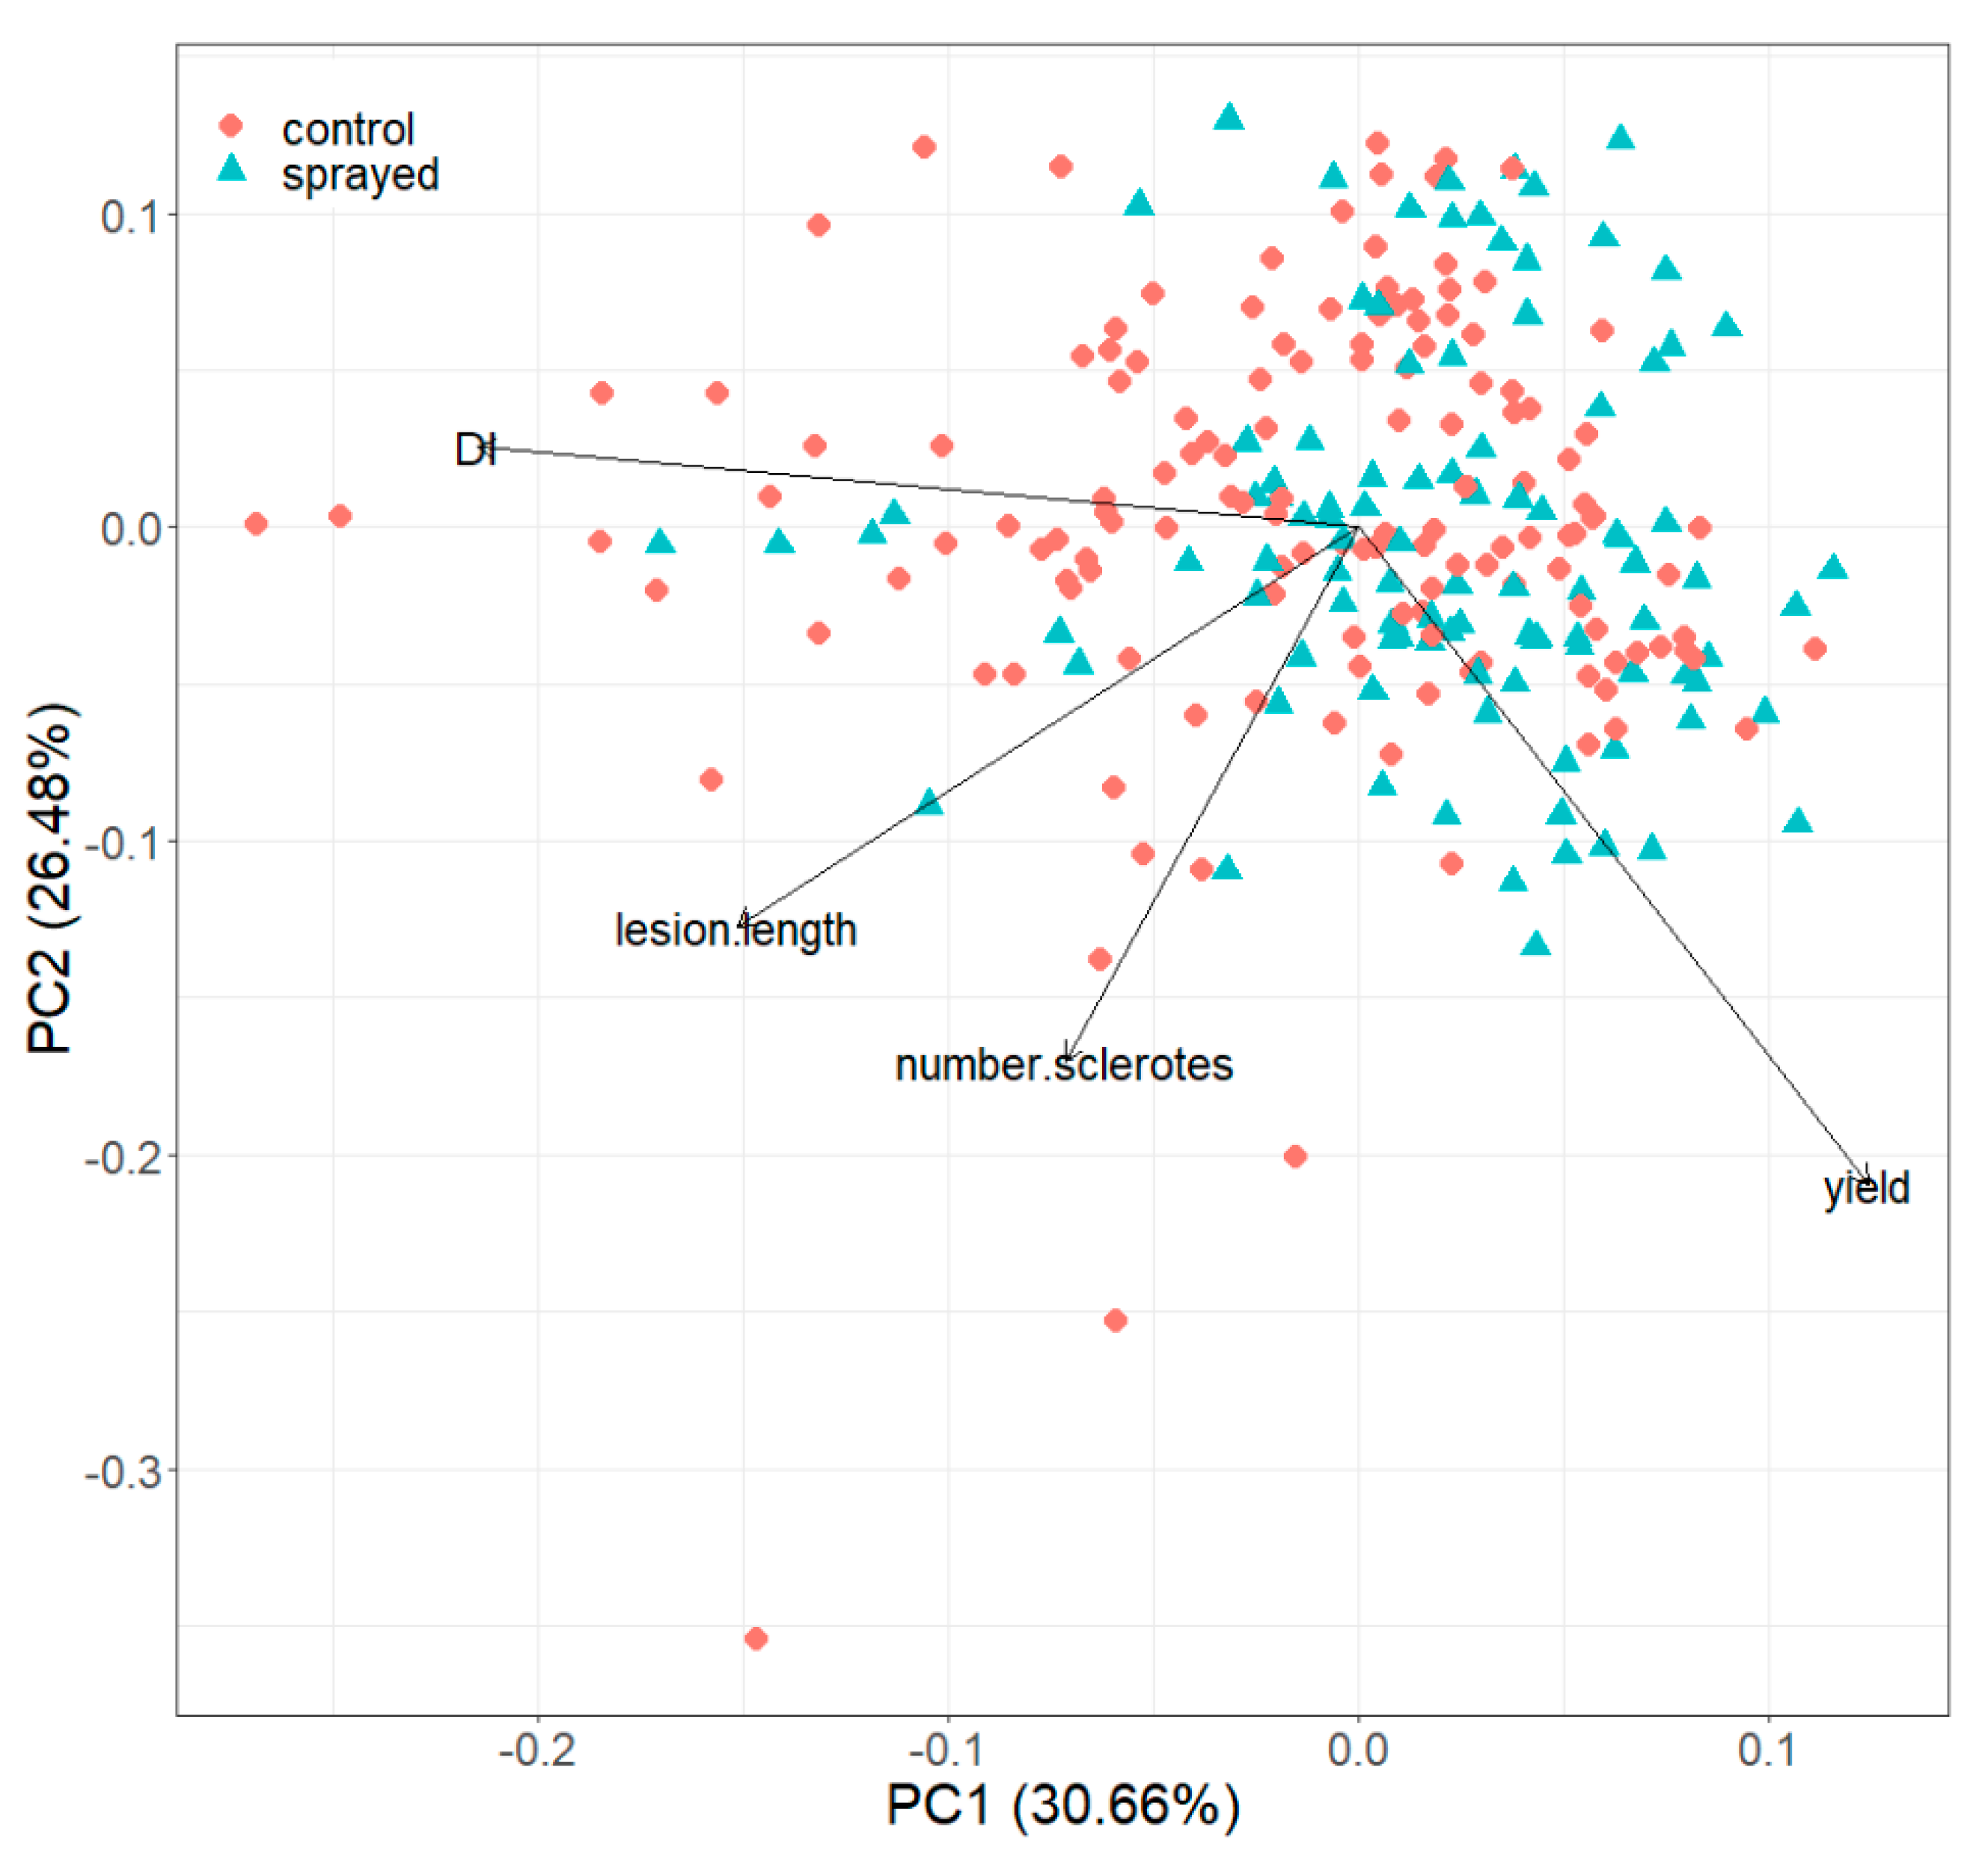
3.6. Principal Components Analysis

A principal components analysis of 246 diseased trial plots using yield and 3 other SSR disease variables (disease incidence, lesion length and total number of sclerotia within the stem) that were uncorrelated to each other, or to yield, was found to explain 57% of the variation in the first 2 principal components (PC1 and PC2; Table 5). The remaining SSR disease variables (stem thickness, sclerotia size, sclerotia fraction) did not improve the PCA model and were not used. The important variables in PC1 were disease incidence and to a lesser extent lesion length, whereas in PC2 the important variables were yield, number of sclerotia within the stem, and lesion length. A biplot of PC1 and PC2 (Figure 6) shows that although there is considerable variation in diseased trial plots across the PCA, plots that were sprayed to control SSR are clustered more towards the right-hand side of the figure and an increasing yield, and more of the unsprayed control trial plots are found towards the left and top of the figure where disease incidence and the number of sclerotia within the stem increases.

4. Discussion

Genotype by Environment interaction studies are not common in Sclerotinia stem rot, possibly because of the challenge of conducting field-based disease trials for a disease that is sporadic and unpredictable in nature. The Genotype by Environment interactions in the study reported here have shown that at these levels of disease, the environmental differences between trial sites are the main driver of yield differences within a variety rather than the fungicide management. However, the AMMI results indicated that the open-pollinated varieties ATR Bonito and ATR Mako are broadly adapted environmentally when SSR is controlled, but when SSR is not controlled are highly variable in their response to the disease and potentially do not perform well at high disease-risk sites. This is supported by current farmer variety preference, where, although lower yielding under optimum conditions compared to triazine-tolerant hybrid and glyphosate-tolerant genetically modified varieties, the open-pollinated varieties, and ATR Bonito in particular, maintain a preference among growers in Western Australia (J. Bucat, Pers. Comm.).
Genotype by Environment interaction studies on the response of plant diseases to crops are also limited. Some studies that have been published highlight some of the difficulties, including variation in the aggressiveness of isolates at different locations, leading to significant environment responses and uneven disease pressure at different locations (gray leaf spot (Cercospora zeae-maydis Tehon & E.Y. Daniels) in maize (Zea mays L.) [13]), and the difficulties in obtaining repeatability of disease assessments for varietal evaluations (rust (Uromyces viciae-fabae) in field peas (Pisum sativa L.) [19]). One way to avoid this is to increase the number of environments in which the evaluations take place, greatly increasing the cost and time required. Others, however, have identified the importance of Genotype × Environment × Management studies conducted in high disease-risk locations as they enable best management practices to be identified and incorporated into IPM strategies, particularly when no varieties are completely resistant to the disease in question (Fusarium head blight (Fusarium graminearum Schwabe) in wheat (Triticum aestivum L.) [20]). This also enables selection efficiency to be improved as disease resistance can be selected at the same time as environmental adaptation, thus reducing the time and cost of plant-breeding efforts (chocolate spot (Botrytis fabae) in faba bean (Vicia faba L.) [21]).
The question of conducting field trials using aggressive isolates is relevant in the study of SSR, as S. sclerotiorum, the causal agent of SSR, contains a high diversity of isolates. These have been reported to differentiate around the world [22], with two broad populations reported, but have also shown to contain significant ecological population diversity within and between fields in the grainbelt of Western Australia [23,24]. These isolates vary in their aggressiveness [25], and so it can be hypothesized that infection pressure at the field trial sites in this study was not only affected by the presence of ascospores of S. sclerotiorum and the environmental conditions at the site, but also on the presence of aggressive versus less aggressive isolates. For example, two of the ecological populations of sclerotia used in Michael et al. [23] were from adjacent fields to trial sites 17-3 and 17-5. The identified isolate genotypes of S. sclerotiorum from these sclerotia following mycelial compatibility grouping showed almost no overlap, and so the potential aggressiveness of isolates at the two sites would not be the same. Manual application of S. sclerotiorum ascospores for field testing of canola varieties has not been reliable due to the difficulties in maintaining the required environmental conditions following application [26,27]. Therefore, identifying sites with a high natural presence of aggressive isolates (high risk sites) may be more successful when conducting new variety evaluations.
Petal assays (petal testing) of S. sclerotiorum ascospore presence (and existing soil sclerotia) were not found to be a reliable method of determining subsequent SSR disease levels within a crop in the grainbelt of Western Australia, and therefore of determining whether a fungicide application should be applied to control for SSR. This is in contrast to previous results in Canada [28,29] that reported a high correlation between S. sclerotiorum ascospore presence on petals and subsequent development of SSR. Bečka et al. [30] also used petal assays to determine infection pressure, finding an 80% correlation between development of SSR in oilseed rape and presence of ascospores on fallen petals. It is suggested that the lack of correlation in Western Australia may be a response to the weather conditions in a winter growing season, where the cool humid conditions required for disease development do not occur routinely within the 5-day life span of ascospores, and as such ascospores often die before being able to infect the plant.
Current prediction models used in Australia [31] are primarily based on models developed using environmental conditions required for SSR in the northern hemisphere under a summer growing season in a cool temperate climate [5,32]. In these models, crop predictors such as number of years since last canola crop or host crop, disease incidence in last host crop and crop density are combined with weather predictors such as rain in June, rain in the last 2 weeks, and weather forecast, along with apothecia development in the region [5]. However recent research [23,24] has shown that S. sclerotiorum has adapted to an Australian winter growing season with the temperatures required for pre-conditioning of sclerotia over summer, and the temperatures required for germination matching those occurring within the south-western grainbelt of Western Australia. The results from the trials reported in this study can therefore be used to test these models and also to potentially develop better adapted parameters for disease prediction in Australia, prior to the 30% to 50% flowering growth stage of canola [31], the recommended time for a prophylactic fungicide application for the control of SSR. A review of SSR across a range of crops in South Africa [33] also determined that using models to predict disease occurrences and when to spray was useful to reduce the unnecessary use of fungicides, but that models needed to be developed based on local environmental conditions.
One of the limitations of this study was the low levels of disease recorded at the 25 environmental sites over the 4 years of the study, and that subsequently no significant differences were recorded in final yield between sprayed and unsprayed plots across a site. Morrall and Thomson [11] reported a 0.5% yield loss in canola for every 1% increase in SSR, and this was supported by work in North Dakota in the United States [26], where 1 unit of disease incidence led to a 0.5% yield loss. However, work completed by Kirkegaard et al. [4] in the high rainfall zone of eastern Australia suggested that yield loss occurred at a rate of 1.3% with every 1% increase in stem infection. This is double the yield loss that is reported in North America, and they suggest it is due to the lower seeding rates and larger plants used in their environment. The studies by del Rio et al. [26] and Kirkegaard et al. [4] both include a mix of varieties, including the typically larger hybrid varieties, and therefore this is unlikely to be the cause of the difference. Soil types in southern Australia are, however, known to be of poorer quality with low levels of organic carbon and therefore do not support the seeding rates used in many other areas of the world, leading to a greater spacing between plants. Loss of a plant due to SSR would therefore have a larger impact on potential yield, due to the reduced number of plants/m2. This is more likely to be the cause of the differences in reported yield loss between Australia and North America, but it needs further investigation. There is therefore a need to determine the level of disease within a crop that leads to yield loss, and to determine if this varies between varieties with different growth habits.
To conclude, the investigation of Sclerotinia stem rot in canola through the use of Genotype × Environment × Management interactions in this study highlighted the unpredictable occurrence and variability in incidence that occurs in this disease across years and across field sites within a year, as well as the significant interaction and importance of environmental variation in driving varietal response, especially in yield, within a site. The low level of disease recorded over the 4 years of the study (2017–2020) has been particularly challenging for the identification of canola varieties that respond favourably to current management practices for the control of SSR or those that contain any resistance to SSR under field environments. Nevertheless, the results of the AMMI analysis provided an indication of differences among varieties in their response to disease pressure and their narrow or broad adaptability across the sites investigated, and the PCA showed that although disease incidence has had an impact on canola grain yield, the numbers of sclerotia and lesion length along the stem are also important contributors to variety variation and are independent in their response to disease incidence. This has important implications in the potential contribution of inoculum for future infection events.

Supplementary Materials

The following are available online at https://www.mdpi.com/article/10.3390/agronomy11061170/s1, Figure S1 Lesion length and number of sclerotia in Sclerotinia stem rot diseased stems averaged by trial site and variety across four growing seasons (2017–2020); Figure S2. Number of sclerotia produced within a Sclerotinia stem rot diseased stem averaged by A) Variety and B) Site across four growing seasons (2017–2020), separated by size fractions of <3 mm, 3-4 mm and >4 mm. The number in brackets after the trial site name is the number of diseased stems included in the column mean; Table S1: Site and agronomic management details; Table S2: Effect of fungicide application on Sclerotinia stem rot disease incidence and grain yield (t/ha) of ATR Bonito and Hyola 559T at 25 field sites across 4 years; Table S3: Effect of fungicide application on Sclerotinia stem rot disease incidence and grain yield (t/ha) of ATR Mako and InVigor T4510 at 18 field sites across 3 years; Table S4: Effect of fungicide application on Sclerotinia stem rot disease incidence and grain yield (t/ha) of canola at 18 field sites across 3 years.

Author Contributions

Conceptualization, P.J.M. and S.J.B.; methodology, P.J.M., A.R.L., L.L.T., K.Y.L. and S.J.B.; validation, P.J.M. and S.J.B.; formal analysis, P.J.M. and S.J.B.; investigation, P.J.M., A.R.L., L.L.T., K.Y.L. and S.J.B.; resources, P.J.M. and S.J.B.; data curation, P.J.M., A.R.L. and S.J.B.; writing—original draft preparation, P.J.M. and S.J.B.; writing—review and editing, P.J.M. and S.J.B.; visualization, P.J.M. and S.J.B.; supervision, S.J.B.; project administration, P.J.M. and S.J.B.; funding acquisition, S.J.B. All authors have read and agreed to the published version of the manuscript.

Funding

This research was funded through a co-investment by Curtin University and the Grains Research and Development Corporation (GRDC), grant number CUR00023.

Data Availability Statement

All data are provided within this paper.

Acknowledgments

Thanks to Living Farm and Crop Circle Consulting for trial site management, and to BASF Australia Ltd., Advanta Seeds Pty Ltd., Pioneer Seeds Australia, Nuseed Pty Ltd., Nutrien Ag Solutions Ltd. and Gentech Seed Pty Ltd. for provision of seed. Thanks also to Lars Kamphuis, Yuphin Khentry, Robert Lee, Matthew Denton-Giles and Mark Derbyshire for assistance with recording data at some trials in 2017 and 2018.

Conflicts of Interest

The authors declare no conflict of interest. The funders had no role in the design of the study; in the collection, analyses, or interpretation of data; in the writing of the manuscript.

References

  1. Zheng, X.; Koopmann, B.; Ulber, B.; von Tiedemann, A. A global survey on diseases and pests in oilseed rape—Current challenges and innovative strategies of control. Front. Agron. 2020, 2, 590908. [Google Scholar] [CrossRef]
  2. Kirkegaard, J.; Lilley, J.M.; Morrison, M.J. Drivers of trends in Australian canola productivity and future prospects. Crop Pasture Sci. 2016, 67, 1–9. [Google Scholar] [CrossRef] [Green Version]
  3. Derbyshire, M.C.; Denton-Giles, M. The control of Sclerotinia stem rot on oilseed rape (Brassica napus): Current practices and future opportunities. Plant Pathol. 2016, 65, 859–877. [Google Scholar] [CrossRef] [Green Version]
  4. Kirkegaard, J.A.; Robertson, M.J.; Hamblin, P.; Sprague, S.J. Effect of blackleg and sclerotinia stem rot on canola yield in the high rainfall zone of southern New South Wales, Australia. Aust. J. Agric. Res. 2006, 57, 201–212. [Google Scholar] [CrossRef]
  5. Twengström, E.; Sigvald, R.; Svensson, C.; Yuen, J. Forecasting Sclerotinia stem rot in spring sown oilseed rape. Crop Protect. 1998, 17, 405–411. [Google Scholar] [CrossRef]
  6. Boland, G.J.; Hall, R. Index of plant hosts of Sclerotinia sclerotiorum. Can. J. Plant Pathol. 1994, 16, 93–108. [Google Scholar] [CrossRef]
  7. Bolton, M.D.; Thomma, B.; Nelson, B.D. Sclerotinia sclerotiorum (Lib.) de Bary: Biology and molecular traits of a cosmopolitan pathogen. Mol. Plant Pathol. 2006, 7, 1–16. [Google Scholar] [CrossRef] [PubMed]
  8. Harries, M.; Anderson, G.C.; Hüberli, D. Crop sequences in Western Australia: What are they and are they sustainable? Findings of a four-year survey. Crop Pasture Sci. 2015, 66, 634–647. [Google Scholar] [CrossRef] [Green Version]
  9. Van de Wouw, A.P.; Idnurm, A.; Davidson, J.A.; Sprague, S.J.; Khangura, R.K.; Ware, A.H.; Lindbeck, K.D.; Marcroft, S.J. Fungal diseases of canola in Australia: Identification of trends, threats and potential therapies. Australas. Plant Pathol. 2016, 45, 415–423. [Google Scholar] [CrossRef]
  10. Brooks, K.D.; Bennett, S.J.; Hodgson, L.M.; Ashworth, M.B. Narrow windrow burning canola (Brassica napus L.) residue for Sclerotinia sclerotiorum (Lib.) de Bary sclerotia destruction. Pest. Manag. Sci. 2018, 74, 2594–2600. [Google Scholar] [CrossRef]
  11. Morrall, R.A.A.; Thomson, J.R. Petal Test Manual for Sclerotinia in Canola; University of Saskatchewan: Saskatoon, SK, Canada, 1991. [Google Scholar]
  12. GRDC. Canola. Western Region. GRDC GrowNotes; Grains Research and Development Corporation: Canberra, Australia, 2015. [Google Scholar]
  13. Carson, M.L.; Goodman, M.M.; Williamson, S.M. Variation in aggressiveness among isolates of Cercospora from maize as a potential cause of genotype-environment interaction in gray leaf spot trials. Plant Dis. 2002, 86, 1089–1093. [Google Scholar] [CrossRef] [PubMed] [Green Version]
  14. Shackley, B.; Paynter, B.; Bucat, J.; Troup, G.; Seymour, M. Western Australian Crop Sowing Guide Bulletin 4917; State of Western Australia: Perth, Australia, 2020. [Google Scholar]
  15. Anonymous. SILO Patched Point Data. Available online: data.qld.gov.au (accessed on 1 May 2021).
  16. R Core Team. A Language and Environment for Statistical Computing; R Foundation for Statistical Computing: Vienna, Austria, 2020. [Google Scholar]
  17. de Mendiburu, F. Agricolae: Statistical Procedures for Agricultural Research; R Package Version 1.3-3; 2020; Available online: https://CRAN.R-project.org/package=agricolae (accessed on 1 February 2021).
  18. Wickham, H. Elegant Graphics for Data Analysis; Springer: New York, NY, USA, 2016. [Google Scholar]
  19. Das, A.; Parihar, A.K.; Saxena, D.; Singh, D.; Singha, K.D.; Kushwaha, K.P.S.; Chand, R.; Bal, R.S.; Chandra, S.; Gupta, S. Deciphering genotype-by- environment interaction for targeting test environments and rust resistant genotypes in field pea (Pisum sativum L.). Front. Plant Sci. 2019, 10, 825. [Google Scholar] [CrossRef] [PubMed]
  20. Beres, B.L.; Brûlé-Babel, A.L.; Ye, Z.; Graf, R.J.; Turkington, T.K.; Harding, M.W.; Kutcher, H.R.; Hooker, D.C. Exploring Genotype × Environment × Management synergies to manage fusarium head blight in wheat. Can. J. Plant Pathol. 2018, 40, 179–188. [Google Scholar] [CrossRef]
  21. Tekalign, A.; Sibiya, J.; Derera, J.; Fikre, A. Analysis of genotype × environment interaction and stability for grain yield and chocolate spot (Botrytis fabae) disease resistance in faba bean (Vicia faba). Aust. J. Crop Sci. 2017, 11, 1228–1235. [Google Scholar] [CrossRef]
  22. Derbyshire, M.; Denton-Giles, M.; Hane, J.; Chang, S.; Mousavi-Derazmahalleh, M.; Raffaele, S.; Buchwaldt, L.; Kamphuis, L. Selective sweeps in populations of the broad host range plant pathogenic fungus Sclerotinia Sclerotiorum. bioRxiv 2018, 352930. [Google Scholar] [CrossRef] [Green Version]
  23. Michael, P.; Lui, K.Y.; Thomson, L.L.; Lamichhane, A.R.; Bennett, S.J. Impact of preconditioning temperatures and duration period on carpogenic germination of diverse Sclerotinia sclerotiorum (Lib.) de Bary populations. Plant Dis. 2021. [Google Scholar] [CrossRef]
  24. Michael, P.J.; Lui, K.Y.; Thomson, L.L.; Stefanova, K.; Bennett, S.J. Carpogenic germinability of diverse Sclerotinia sclerotiorum populations within the southwestern Australian grain belt. Plant Dis. 2020, 104, 2891–2897. [Google Scholar] [CrossRef]
  25. Denton-Giles, M.; Derbyshire, M.C.; Khentry, Y.; Buchwaldt, L.; Kamphuis, L.G. Partial stem resistance in Brassica napus to highly aggressive and genetically diverse Sclerotinia sclerotiorum isolates from Australia. Can. J. Plant Pathol. 2018, 40, 551–561. [Google Scholar] [CrossRef] [Green Version]
  26. del Río, L.E.; Bradley, C.A.; Henson, R.A.; Endres, G.J.; Hanson, B.K.; McKay, K.; Halvorson, M.; Porter, P.M.; Le Gare, D.G.; Lamey, H.A. Impact of Sclerotinia stem rot on yield of canola. Plant Dis. 2007, 91, 191–194. [Google Scholar] [CrossRef] [Green Version]
  27. Lange, R.; Werezuk, R. Sclerotinia Stem Rot Field Nursery for Evaluation of Resistance and Fungicide Efficacy. Canola Agronomic Research Program. AG#2006-07 Final Project Report; Alberta Research Council: Edmonton, AB, Canada, 2008. [Google Scholar]
  28. Turkington, T.K.; Morrall, R.A.A.; Gugel, R.K. Use of petal infestation to forecast sclerotinia stem rot of canola: Evaluation of early bloom sampling, 1985–1990. Can. J. Plant Pathol. 1991, 13, 50–59. [Google Scholar] [CrossRef]
  29. Turkington, T.K.; Morrall, R.A.A.; Rude, S.V. Use of petal infestation to forecast sclerotinia stem rot of canola: The impact of diurnal and weather-related inoculum fluctuations. Can. J. Plant Pathol. 1991, 13, 347–355. [Google Scholar] [CrossRef]
  30. Bečka, D.; Prokinová, E.; Šimka, J.; Cihlář, P.; Bečková, L.; Bokor, P.; Vašák, J. Use of petal test in early-flowering varieties of oilseed rape (Brassica napus L.) for predicting the infection pressure of Sclerotinia sclerotiorum (Lib.) de Bary. Crop Protect. 2016, 80, 127–131. [Google Scholar] [CrossRef]
  31. Bayer CropScience. Getting the Best Possible Sclerotinia Control from Prosaro® 420 SC in Canola; Bayer Group: Melbourne, VIC, Australia, 2014. [Google Scholar]
  32. Koch, S.; Dunker, S.; Kleinhenz, B.; Röhrig, M.; Tiedemann, A.V. A crop loss-related forecasting model for Sclerotinia stem rot in winter oilseed rape. Phytopathology 2007, 97, 1186–1194. [Google Scholar] [CrossRef] [Green Version]
  33. Rothmann, L.A.; McLaren, N.W. Sclerotinia sclerotiorum disease prediction: A review and potential applications in South Africa. S. Afr. J. Sci. 2018. [Google Scholar] [CrossRef] [Green Version]
Figure 1. Map showing locations of Sclerotinia stem rot field trials established within the south-western Australian grain belt in 2017 (7 sites), 2018 (10 sites), 2019 (5 sites) and 2020 (3 sites).
Agronomy 11 01170 g001
Figure 2. SSR disease incidence (proportion of infected plants) and final yield (t/ha) of ATR Bonito and Hyola 559TT canola plants sown at 25 sites across four growing seasons (2017–2020). Two management treatments were applied: no fungicide application (control) and fungicide application at 30% flowering (sprayed).
Agronomy 11 01170 g002
Figure 3. Disease incidence (proportion of infected plants) and final yield (t/ha) of ATR Mako and Invigor T4510 canola plants sown at 18 sites across three growing seasons (2018–2020). Two management treatments were applied: no fungicide application (control) and fungicide application at 30% flowering (sprayed).
Agronomy 11 01170 g003
Figure 4. Regression analysis showing S. sclerotiorum ascospore infestation on canola petals (% petals sampled) and SSR disease incidence of canola plants sown at 16 sites across three growing seasons (2018–2020). Petals were sampled from replicate 1 control plots prior to fungicide application at 30% flowering. Petal infestation is shown as transformed exponential data. Red dotted lines indicate regression line, grey shading 95% confidence intervals (R = 0.08, n.s.), site symbols colored according to year.
Agronomy 11 01170 g004
Figure 5. AMMI biplots showing (A) IPCA1 vs. IPCA2 and (B) additive effects vs. IPCA1 in four canola varieties (ATR Mako, ATR Bonito, Hyola 559TT and Invigor T4510) from 18 sites across (2018–2020). Two management treatments were applied; no fungicide (control) and fungicide at 30% flowering (sprayed).
Agronomy 11 01170 g005
Figure 6. Principal Components Analysis (PCA) biplot of 246 diseased plots from 16 sites across four growing seasons (2017–2020). Two management treatments were applied: no fungicide (control) and fungicide at 30% flowering (sprayed).
Agronomy 11 01170 g006
Table 1. Description of canola varieties sown per year.
Year (Number of Sites)
VarietyHerbicide ToleranceBreeding TypeHarvest Maturity #2017 (7)2018 (10)2019 (5)2020 (3)
ATR BonitoTriazine tolerantOpen pollinatedearly-mid++++
Hyola 559TTTriazine tolerantHybridmid++++
ATR MakoTriazine tolerantOpen pollinatedearly-mid +++
InVigor T4510Triazine tolerantHybridearly-mid +++
DG 408RRGlyphosate tolerantHybridearly-mid ++
Pioneer 43Y23 RRGlyphosate tolerantHybridearly ++
Pioneer 44Y27 RRGlyphosate tolerantHybridearly-mid ++
Hyola 350TTTriazine tolerantHybridearly +
Hyola 530XTTriazine tolerant + Glyphosate tolerantHybridmid +
HyTTec TrophyTriazine tolerantHybridearly-mid +
HyTTec TridentTriazine tolerantHybridearly +
InVigor R4022PGlyphosate tolerantHybridearly-mid +
Xseed RaptorGlyphosate tolerantHybridearly-mid +
# Shackley [14].
Table 2. Average long-term and study year meteorological data for each field site.
1950–2020 Growing Season Data
(May–October) *
Year of Study Growing Season Data
(May–October)
YearSiteNearest TownTotal Rainfall (mm)Maximum Daily Temperature (°C)Minimum Daily Temperature (°C)Total Rainfall (mm)Maximum Daily Temperature (°C)Minimum Daily Temperature (°C)
201717_1Corrigin23618.66.422419.56.6
201717_2Dandaragan41320.58.932121.39.2
201717_3Greenough37322.010.325823.010.3
201717_4Katanning34717.06.526117.47
201717_5Kojonup39316.66.635217.06.9
201717_6Williams38517.76.137118.26.3
201717_7York37818.76.228219.56.2
201818_1Bolgart30519.67.731620.37.7
201818_2Corrigin24518.46.322819.26.3
201818_3Cranbrook36216.77.229417.27.3
201818_4Cunderdin24219.77.022720.26.5
201818_5Dandaragan41720.58.941520.89
201818_6Greenough37322.210.326722.810.4
201818_7Kojonup40016.76.435617.26.3
201818_8Mingenew27522.39.324322.79.3
201818_9Wagin26117.76.626718.26.7
201818_10Williams38317.76.131018.35.8
201919_1Bolgart30619.57.724621.37.4
201919_2Dandaragan43820.18.930021.68.9
201919_3Kojonup39916.86.529317.96.3
201919_4Mingenew33322.29.726223.89.6
201919_5Williams37517.66.127419.05.7
202020_1Kojonup36117.36.529818.36.7
202020_2Moonyanooka38521.710.026223.210.9
202020_3Toodyay35719.47.421921.07.7
* from SILO Point Data [15].
Table 3. Summary of treatment main effects and interactions on SSR disease incidence (proportion of infected plants) and canola yield (t/ha) for four varieties (ATR Bonito, Hyola 559TT, ATR Mako and InVigor T4510). Variance ratio and degrees of freedom (in brackets) are presented. Significance indicated by: ns, not significant, * p <0.05, ** p <0.01, *** p <0.001.
ResponseVarietySiteManagementSite × Management
Disease incidenceATR Bonito8.76 (23) ***0.46 (1) ns1.66 (23) *
Hyola 559TT6.62 (23) ***10.47 (1) **0.52 (23) ns
ATR Mako16.43 (16) ***18.40 (1) **2.11 (16) *
InVigor T45108.98 (16) ***20.31 (1) ***3.11 (16) ***
YieldATR Bonito47.80 (24) ***0.57 (1) ns0.93 (24) ns
Hyola 559TT44.41 (24) ***5.56 (1) *0.56 (24) ns
ATR Mako53.36 (17) ***1.87 (1) ns0.67 (17) ns
InVigor T451058.20 (17) ***3.50 (1) ns0.30 (17) ns
Table 4. Summary of treatment Additive Main effects and Multiplicative Interactions (AMMI) on canola yield (t/ha) for four varieties (ATR Bonito, Hyola 559TT, ATR Mako and InVigor T4510). Genotype represents Variety + Management. Sums of squares (s.s.), mean squares (m.s.), variance ratio (v.r.) and degrees of freedom (d.f.) are presented. Significance indicated by; ns, not significant, *** p < 0.001.
Sourced.f.s.s.m.s.v.r.F pr
Total431229.050.531
Treatments143214.821.50258.06<0.001 ***
  Genotypes716.502.35791.12<0.001 ***
  Environments17191.5011.26552.58<0.001 ***
  Block367.710.2148.28<0.001 ***
Interactions1196.810.0572.21<0.001 ***
  IPCA 1233.040.1325.10<0.001 ***
  IPCA 2211.670.0793.07<0.001 ***
Residuals752.110.0281.090.3129 ns
Error2526.520.026
Table 5. Eigenvalues, percentage variation and component loadings following Principal Components Analysis (PCA) of 246 diseased plots from 16 sites across four growing seasons (2017–2020).
ComponentPC1PC2PC3
Standard deviation1.10741.02930.9790
Proportion of Variance0.30660.26480.2396
Cumulative Proportion0.30660.57140.8111
Loadings
Yield0.4147−0.6996−0.2695
Disease Incidence−0.71720.0849−0.0004
Lesion length−0.5064−0.4249−0.5822
Number of sclerotia−0.2391−0.56830.7670
Publisher’s Note: MDPI stays neutral with regard to jurisdictional claims in published maps and institutional affiliations.

