Article

Novel Poly-(Lactic-Co-Glycolic Acid) Targeted Nanoparticles Conjunct with Antibody for the Enhancement of Antibacterial Activity against Ralstonia solanacearum

1
School of Biotechnology, Jiangsu University of Science and Technology, Zhenjiang 212018, China
2
Sericultural Research Institute, Chinese Academy of Agricultural Sciences, Zhenjiang 212018, China
*
Author to whom correspondence should be addressed.
Agronomy 2021, 11(6), 1159; https://doi.org/10.3390/agronomy11061159
Submission received: 8 April 2021 / Revised: 30 May 2021 / Accepted: 1 June 2021 / Published: 5 June 2021

Abstract

:
Due to the strong pathogenicity of Ralstonia solanacearum, a variety of strategies have been used to develop antibacterial agents; however, antibacterial drugs with targeted effects on R. solanacearum remain lacking. Herein, we present a nanoagent targeting R. solanacearum based on our previous research on poly-(lactic-co-glycolic acid) (PLGA) particles (PLGA-NPs) loaded with methyl caffeate and caffeic acid phenethyl ester. Antibodies that have specific effects on R. solanacearum, which were verified using immuno-PCR, were first used to prepare PLGA-targeted nanoparticles (PLGA-TNPs). The antibody coupling process was investigated in terms of antibody binding degree and antibacterial activity. The EC50 value of PLGA-TNPs was 0.021 mg/mL, which was significantly reduced by 92% in comparison to PLGA-NPs. PLGA-TNPs had a perforating effect on the cell membrane of R. solanacearum, but no effects on Escherichia coli according to the SEM results. In addition, a downregulation of the pathogenicity-related genes compared to PLGA-NP treatment was observed, and the expression of egl, phcA, phcB, pilT, polA-238, and pehC decreased by 78, 79, 87, 61, 58, and 41%, respectively. Therefore, PLGA-targeted nanoparticles not only enhance the activity against R. solanacearum, but also provide a new idea for controlling bacterial wilt.

Graphical Abstract

1. Introduction

Ralstonia solanacearum is the pathogen that causes plant bacterial wilt, one of the most severe diseases affecting the production of many important crops worldwide [1]. Soil, water, and even animals serve as a potential medium for this serious threat, which makes it difficult to prevent. After a plant is infected, the leaves of the plant still appear green, but symptoms of wilting soon appear. Due to this feature and the degree of damage, farmers and scientists in China call it “bacterial wilt” (Qing Ku Bing) [1]. Major crops and economic plants such as potatoes, tobacco, tomatoes, and mulberries can be infected [2]. These crops have been plagued by this disease over the years, causing little or no harvest and severely damaging the livelihoods of farmers. The main pathogenic factors of R. solanacearum include extracellular polysaccharide (EPS), cell wall degrading enzymes (mainly cellulase and pectinase), and type III Hrp secretory system effector protein factors associated with pathogenesis [3]. The infestation of cyanobacteria can be divided into the following two stages: pre-infection and post-infection. In the pre-infection stage, R. solanacearum invades plant roots through secondary roots and root wounds multiply in the interstices of epidermal and cortical cells and activates PrhA (a plant regulator of the Hrp gene), which regulates type III and type II secretion systems through two regulatory pathways [4]. One of the pathways is that PrhA regulates the gene expression of PrhI and PrhJ sequentially by activating the PrhR gene. The signal is transmitted to HrpG to activate the transcriptional activator HrpB gene of the Hrp gene cluster, which positively regulates the Hrp gene cluster and opens the type III secretion system in preparation for the initiation of pathogen colonization. Another pathway is that plant cell signaling is transmitted to pehR via the outer model receptor protein pehS of R. solanacearum and regulates the expression of environmental tolerance genes such as exopolygalacturonases (pehC), and initiates the type II and type IV secretion systems, activating the expression of the flagellar formation and motility-related gene pilT to accelerate the colonization process of R. solanacearum in the plant cells [5]. These regulatory genes, such as exopolygalacturonases (pehC), phcA, phcBSR, and the motility-related gene pilT [6], all play important roles in the pathogenicity of R. solanacearum. The molecular mechanism of this regulation is that plant cell signaling is transmitted to pehR via the outer model receptor protein pehS of R. solanacearum and regulates the expression of environmental tolerance genes such as pehC. Thus, this antibacterial agent has the potential to effectively inhibit the pathogenicity of R. solanacearum.
Antibiotics are often used to prevent plant microbial diseases due to their good antibacterial effect, but the repeated use of antibiotics also leads to the increased resistance of pathogenic microorganisms. According to statistics, in 2015, about 97,000 tons of antibiotics were used in the animal husbandry industry in China, accounting for 46.1% of the total output of antibiotics that year; excessive use of antibiotics has brought a series of problems to animals, plants, and the ecological environment. For example, the drug resistance of pathogenic bacteria is enhanced, the immune function of livestock and poultry is impaired, the disease resistance of animals and plants is reduced, the environmental microorganisms are threatened, and the ecological balance is undermined. If the dosage of antibiotics is further increased, a vicious circle will occur. In the context of the abuse of antibiotics, polymer nanoparticles containing antibacterial substances might be a promising solution. Various biodegradable polymers have been employed by the US Food and Drug Administration (FDA) as drug carriers for many human diseases [7], and poly-(lactic acid) (PLA), poly-(glycolic acid) (PEG), and their copolymers poly-(lactic-co-glycolic acid) (PLGA) have been extensively utilized for the treatment of human diseases for several years [8]. In addition, some metal nanoparticles, such as silver [9] and magnesium oxide [10], have aided in the control of bacterial wilt due to their role in promoting reactive oxygen species (ROS) production and increasing oxidative stress in cells. However, considering the development of drug resistance in pathogens, such a single antibacterial mechanism is not suitable for current agricultural research. Due to the application of polymeric nanoparticles, the active molecules showed higher antibacterial activity [11]. PLGA is a polymer nanomedicine with multifunctional potential, while attracting the attention of researchers for its great potential for artificial transformation [12].
Nanodrug delivery systems based on PLGA have a variety of ways of encapsulating pharmacodynamic molecules to adapt to different needs and show excellent degradability. Pharmaceutical molecules can be packaged inside the core or embedded in or adsorbed on the surface of nanoparticles according to different needs [8]. Previous studies indicated that PLGA nanoparticles (PLGA-NPs) loaded with caffeic acid phenethyl ester (CAPE) and caffeic acid methyl ester (MC) showed a significant effect on the control of R. solanacearum [13]. However, a major concern regarding this application is that the nanoparticles could jeopardize other beneficial microorganisms or the cells of plant roots. A considerable amount of literature has been published, but currently no studies address the use of antibodies to modify PLGA nanomedicine to achieve targeted drug delivery to R. solanacearum.
A previous study conducted by our research group showed that the application of caffeic acid and its ester derivatives had obvious effects on the inhibition of growth of R. solanacearum [13]. Hereby, a pharmaceutical conjugated with antibodies is proposed based on PLGA nanoparticles loaded with CAPE and MC. The EDC/NHS carboxyl activation method was employed to produce PLGA-targeted nanoparticles (PLGA-TNPs) against R. solanacearum. The antibody binding effect and antibacterial performance, which are both used as indicators for investigation, were studied and both the high-concentration treatment groups of 3.2 and 4.0 mg/mL showed high antibacterial rates. To evaluate the antibacterial activity of PLGA-TNPs on R. solanacearum, RT-PCR, scanning electron microscopy (SEM), and transmission electron microscopy (TEM) were employed.

2. Results and Discussion

2.1. Identification of the Specific Binding Ability of the R. solanacearum Antibody

Immuno-PCR was employed to detect the specific binding ability of the antibodies to R. solanacearum [14]. Figure 1 shows that the samples from four PCR tubes covered with R. solanacearum-specific antibodies yielded characteristic bands, while samples containing water and R. solanacearum were used as negative and positive controls, respectively. However, the positive control group showed higher luminance due to the lower strain content in the PCR tubes. The antibody combined with the PCR tube can target R. solanacearum. Due to this specific binding capacity, there was no immune response in the PCR tube with E. coli, and E. coli could be washed away using a PBST buffer during the wash stage. Therefore, this antibody possessed the targeted binding ability to R. solanacearum.

2.2. Binding Process Conditions Based on TMB Chromogenic Reaction

Figure 2A shows the effects of different ratios of EDC/NHS on the TMB chromogenic reaction of PLGA-TNPs. When the EDC/NHS ratio was 1:1, the OD450 value reached a maximum value of 0.4582 ± 0.0124. The ratio of EDC/NHS showed different effects on the degree of antibody binding. EDC could activate carboxyl groups, while NHS could enhance the stability of carbodiimide cross-linking products. When the concentration of EDC was in a certain range, it increased the number of antibody couplings. However, when the concentration of EDC was too high, it reduced the number of antibody couplings [15]. This was consistent with our results that the coupling of antibodies was inhibited when the ratio of EDC to NHS was greater than 1:1 [16,17]. Therefore, the optimal ratio of EDC and NHS was 1:1 when the degree of antibody binding was detected using a TMB chromogenic reaction.
Figure 2B shows the effects of magnetic activation time on the TMB chromogenic reaction of the targeted nanoparticles. When the activation time was from 10 to 30 min, the number of antibodies coupled by the nanoparticles increased, and the maximum OD450 was 0.85 ± 0.12 at 30 min. When the nanomedicine was activated using magnetic stirring, as time increased, the compound nanomedicine interacted more fully with EDC and NHS [18]. However, the OD450 value decreased rapidly when the activation time exceeded 30 min, which may be because the decrease in EDC concentration with the extension of the activation time reduced the content of compound nanoparticles, which was not conducive to the coupling of antibodies [19]. Therefore, considering the highest coupling between antibodies and nanoparticles, the optimal activation time for the nanoparticles was 30 min.
Figure 2C shows the effects of different pH values of a PB buffer solution on the TMB chromogenic reaction of the targeted nanoparticles. To obtain the optimal antibody coupling scheme, a buffer with a pH of 5.7 to 8 was selected in this study. When the pH changed from 5.7 to 7.0, the acid-base environment changed from acidic to neutral, indicating an increasing trend in pH. When the pH was between 7.0 and 8.0, the acid-base environment changed from neutral to alkaline, and the OD450 value decreased gradually. Therefore, the highest OD450 value reached 1.61 ± 0.07 at a pH of 7. Studies have shown that the pH of the buffer can affect the activity of antibodies, and most of the coupling reactions of antibodies occur in neutral or weakly alkaline conditions [20], which is consistent with our results. Therefore, a reaction buffer with a pH of 7 was selected as the best reaction condition for follow-up experiments.
Figure 2D shows the effects of antibody binding time on the TMB chromogenic reaction of the targeted nanoparticles. Before 40 min had passed, the value of OD450 increased with increasing time and reached a maximum value of 1.12 ± 0.04 at 40 min. The value of OD450 decreased with increasing time after 40 min. The reaction time of antibody binding is an important parameter related to the number of antibodies that are conjugated to the surface of nanoparticles. Previous studies have shown that a shorter reaction time will cause antibodies to fail to bind effectively to nanoparticles, and unbound antibodies will be lost in the washing process. Due to the instability of the coupling effect, the dissociation of the fully bound antibody-nanoagent conjugate was caused by a long reaction time [21]. Consequently, since the reaction time of OD450 is the longest, when the reaction time reaches 40 min, it indicates an effective antibody coupling.
Therefore, the optimal conditions for the preparation of targeted nanoparticles were achieved using magnetic stirring for 30 min, antibody binding for 40 min with a PB buffer (pH 7.0), and an antibody dilution factor of 1000-fold.

2.3. The Growth Inhibition of Camphene

Figure 3 shows the results of investigating the effects of the mass ratio of EDC/NHS, activation time, pH of the PB buffer, binding time, and antibody usage on the antibody binding process. These conditions are critical in the antibody binding process [22,23], which has potential effects on the antibacterial performances of PLGA-TNPs. Various high-concentration treatment groups showed high antibacterial rates. Differences in the preparation conditions resulted in different degrees of antibody binding, which indirectly led to differences in the antibacterial rates. To achieve the highest antibacterial rate of 95.08 ± 1.58%, the preferred conditions were as follows: a 1:1 mass ratio of EDC/NHS, 30 min activation time, PB buffer system with a pH of 7, 40 min of binding time, and 1000-fold dilution of the antibody, which were the same conditions used to investigate the binding process conditions based on an investigation of the degree of antibody binding.
Table 1 shows the EC50 value of different forms containing the same Active Pharmaceutical Ingredient (API) for an inhibitory effect on R. solanacearum. According to the literature [24], the EC50 of PLGA-NPs is calculated to be 0.021 mg/mL, which means that 3.05 μg of MC and 2.86 μg of CAPE were required when a 50% inhibition rate was reached with a 28% loading rate of PLGA-TNPs. However, compared to other forms of API, the usage was significantly decreased with the same antibacterial effect. Due to the targeting effect of antibodies, the EC50 of PLGA-TNPs decreased by 92% compared to that of PLGA-NPs, which greatly improves the utilization rate of API and, in effect, enhances the reduction abilities of a PLGA-TNPs reduction. This may be because antibody-modified nanoparticles are more likely to bind to bacterial wilt, thereby enhancing the antibacterial effect. The binding ability of antibody modified nanoparticles to R. solanacearum was enhanced as a result of the specific binding ability of the antibodies.

2.4. Characterization of PLGA-TNPs

Figure 4 shows the results of the PLGA-TNP characterization. FT-IR, zeta potential analysis, TEM, and particle size distribution were used in the analysis of PLGA-TNPs. Figure 4A shows the FTIR spectra of PLGA-TNPs, CAPE, MC, and PLGA, where 1763 cm−1 is the stretching of the C = O bond in the ester bond, and 1182 cm−1, 1095 cm−1 is the stretching of the CO bond. These two features were identified as the characteristic peaks of PLGA [25] The main peaks of CAPE at 3478, 3323, and 1600 cm−1 were significantly reduced, indicating that CAPE was successfully embedded in PLGA [26]. The hydroxyl stretches at 3478, 1607, 1535, and 1445 cm−1 are the unique C = C bond stretching of the aromatic compounds, and 1307 cm−1 is the stretching of CO bonds on -COOH, which are characteristic peaks of MC [27]. In the spectrum of PLGA-TNPs, the characteristic peaks of 1281, 1307, 1607, 1535, and 1445 cm−1 were significantly reduced, indicating that PLGA has successfully embedded MC. It can be judged that MC and CAPE have been successfully embedded.
According to the results shown in Figure 4B, the zeta potential of the targeted nanoparticles is −4.85 mV, while the zeta potential of ordinary nanoparticles is −23.52 mV. The change in the zeta potential of the nanoparticle proves that the antibody is successfully attached to the surface of the nanoparticle, but the targeted nanoparticle is easier to polymerize in solution [28]. Combined with the TEM results shown in Figure 4C, the PLGA-TNPs presented a multilayer structure, which indicated that the antibody successfully coupled to the PLGA-NPs. Figure 4D shows that the average particle size of a PLGA-TNP was 189.05 nm.

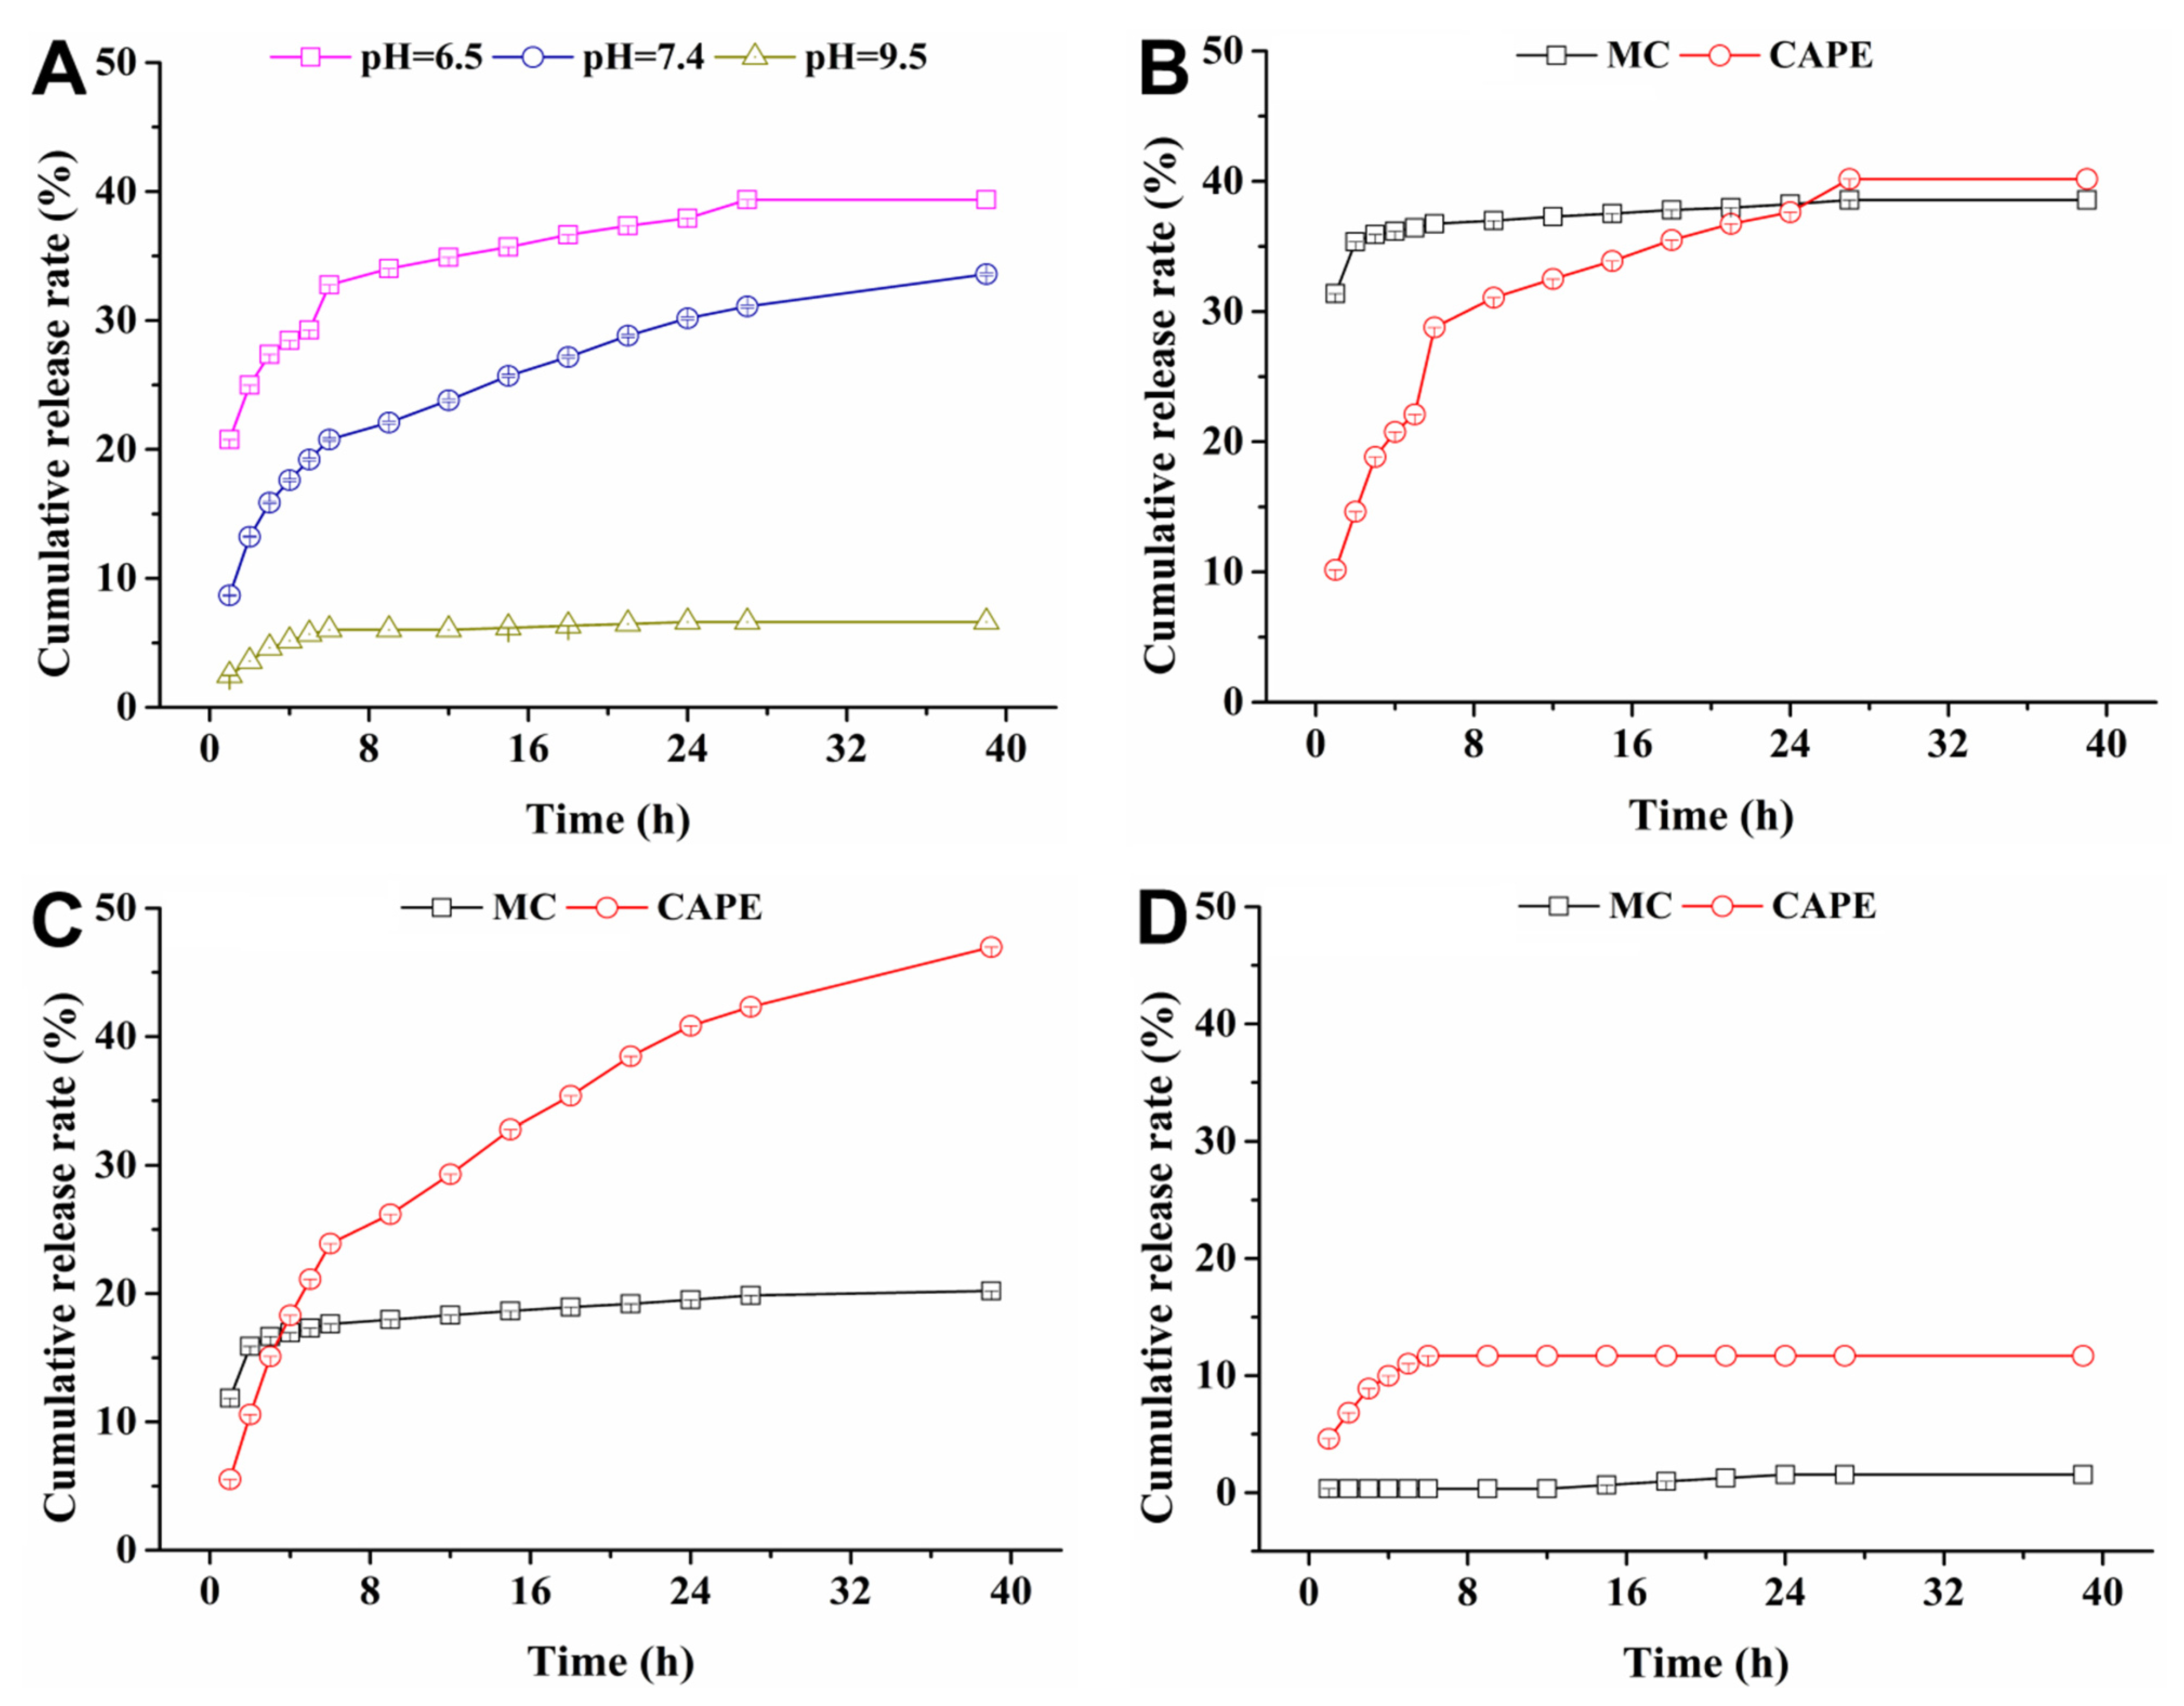
2.5. Release Kinetics of PLGA-TNPs

Figure 5 shows the relationship between the cumulative release rate and the release time of PLGA-TNPs. The release rate of PLGA-TNPs was the highest, and the cumulative effective drug release was the highest in the weakly acidic buffer solution with a pH of 6.5. The release number of targeted NPs was scant at a pH of 9.5.
The nanoparticle drug release process consists of three stages. Figure 5A shows the initial burst release stage (0~6 h), which was the first stage of the release process with the highest rate [19]. The effective APIs adsorbed or adjacent to the PLGA wall material were freely released into the solution. The cumulative release rates of API in the three buffers were 32.76% (pH 6.5), 20.76% (pH 7.4), and 6.02% (pH 9.5). The second stage (7~27 h) was the release stage in which the drug molecular diffusion and PLGA disintegration occurred together. The mixed API molecules were released synchronously, and the API release rate was significantly lower than that in the first stage. The cumulative release rates of PLGA-TNPs in the three buffers were 39.36% (pH 6.5), 31.09% (pH 7.4), and 6.62% (pH 9.5). In the third stage (28~40 h), with the disintegration of polymers, the API molecules were released, while the release rate approached zero infinitely and finally entered a nearly linear sustained-release state.
The slow-release kinetic equations of the targeted NPs at a pH of 6.5, 7.4, and 9.5 were established using the Fickian model and recorded as Equations (4)–(6), respectively. Table 2 shows the theoretical time and theoretical half-life required for nanoparticles to reach a 90% release rate, as calculated using a semi-empirical formula. Under acidic conditions, at a pH of 6.5, the release rate was lower, and the theoretical half-life of 90% release was 46.0 days. The half-life at a pH of 7.4 was 3.6 days, and the theoretical time to reach a 90% release rate was 15.2 days. The higher the pH value was, the faster the degradation rate of PLGA nanoparticles was. In addition, the API molecules in the nanoparticles were accelerated in an alkaline environment, while an acidic environment impaired the release of drug molecules. The pH of mulberry soil is mainly acidic, which is advantageous for the long-term application effect of nanoparticles in mulberry soil.
Figure 5B–D show a sudden release of the two kinds of drug molecules within 0~6 h, which is the first stage of the release of PLGA-TNPs. MC and CAPE reached the maximum cumulative release rates of the first stage in the three buffer solutions, which were 36.75 and 28.77% (pH 6.5); 17.63 and 23.90% (pH 7.4); and 0.34 and 11.69% (pH 9.5), respectively. The degradation of PLGA particles occurred after 7 h, accompanied by the slow dissolution of MC and CAPE. In the curves of the cumulative release rate and time of the different pH buffer solutions, the release rates of MC and CAPE reached the maximum in the buffer with a pH of 7.4. When the release time was 40 h, the cumulative release rates of MC in the three buffer solutions were 38.55% (pH 6.5), 20.21% (pH 7.4), and 1.54% (pH 9.5), respectively, and the CAPE cumulative release rates were 40.17% (pH 6.5), 46.97% (pH 7.4), and 11.69% (pH 9.5), respectively. From the point of view of the release amount, the cumulative release amount of MC in the sudden release stage of the three buffers was higher than that of CAPE. The release of the effective drug molecule MC is mainly in the first stage. Although MC and CAPE are co-embedded in PLGA-TNPs, the MC alkyl chain is shorter and its affinity with water is stronger than that of CAPE, which may lead to different distributions during emulsification. More MC is adsorbed and embedded in the surface layer of PLGA nanoparticles than CAPE [28]. On the other hand, the drug molecules adsorbed and embedded in the surface layer of PLGA particles are released faster [29], which leads to a slow release of CAPE molecules in the sudden release stage and the stage of drug molecular diffusion and PLGA particle disintegration. In addition, the higher the pH value is, the faster the degradation of PLGA nanoparticles, the release of MC molecules embedded on the surface of PLGA particles with the degradation of PLGA, and the release of MC before entering the stable release period is. Thus, combined with the multiple effects of nanoparticles, the inhibitory effect of compound nanoagents containing MC and CAPE on R. solanacearum not only solved the problem of developing drug resistance but also had the effect of continuous release of drug molecules in batches to cause damage to the cell membrane of R. solanacearum.

2.6. Test Results of Targeting Ability of PLGA-TNPs

Figure 6 shows the verification of the targeting effect of antibody nanoparticles loaded with MC and CAPE on R. solanacearum. The form changes of E. coli and R. solanacearum under the action of targeted agents were observed using SEM, and the targeting of nanoagents to R. solanacearum was proven using Polymerase Chain Reaction (PCR) and electrophoresis. Figure 6A,C shows the cell morphology of non-treated R. solanacearum cells and E. coli, and the cell surface structure of the two bacteria without treatment was intact. Moreover, Figure 6B shows that the cell morphology of E. coli underwent no obvious change when E. coli was treated with targeted nanoparticles, and the surface structure was not deformed or damaged. In addition, targeted nanoagents can also be seen distributed on the surface of cells [30]. However, Figure 6D shows obvious deformation when a cell of R. solanacearum was treated with targeted nanoagents, with sunken cell surfaces and pores. Meanwhile, few targeted nanoparticles were visible on the cell surface of R. solanacearum. Therefore, compared to ordinary nanoparticles, targeted nanoparticles may more easily bind specifically to R. solanacearum and destroy the surface structure of the bacterial membrane, resulting in an overflow of R. solanacearum cell contents, and its antibacterial ability has been proven [31]. Figure 6E shows the electrophoretic results of E. coli and R. solanacearum treated with targeted nanoparticles and cultured under regular conditions. After diluting the cell concentration of each treatment group and control group 10 times, there was no significant change in the brightness and size of the E. coli electrophoretic band and normal electrophoretic band. However, the electrophoretic band of the R. solanacearum treated with targeted nanoparticles alone and a mixed culture of E. coli and R. solanacearum became darker and thinner relative to the normal band. The above experimental results show that the targeted nanoparticles targeted R. solanacearum.

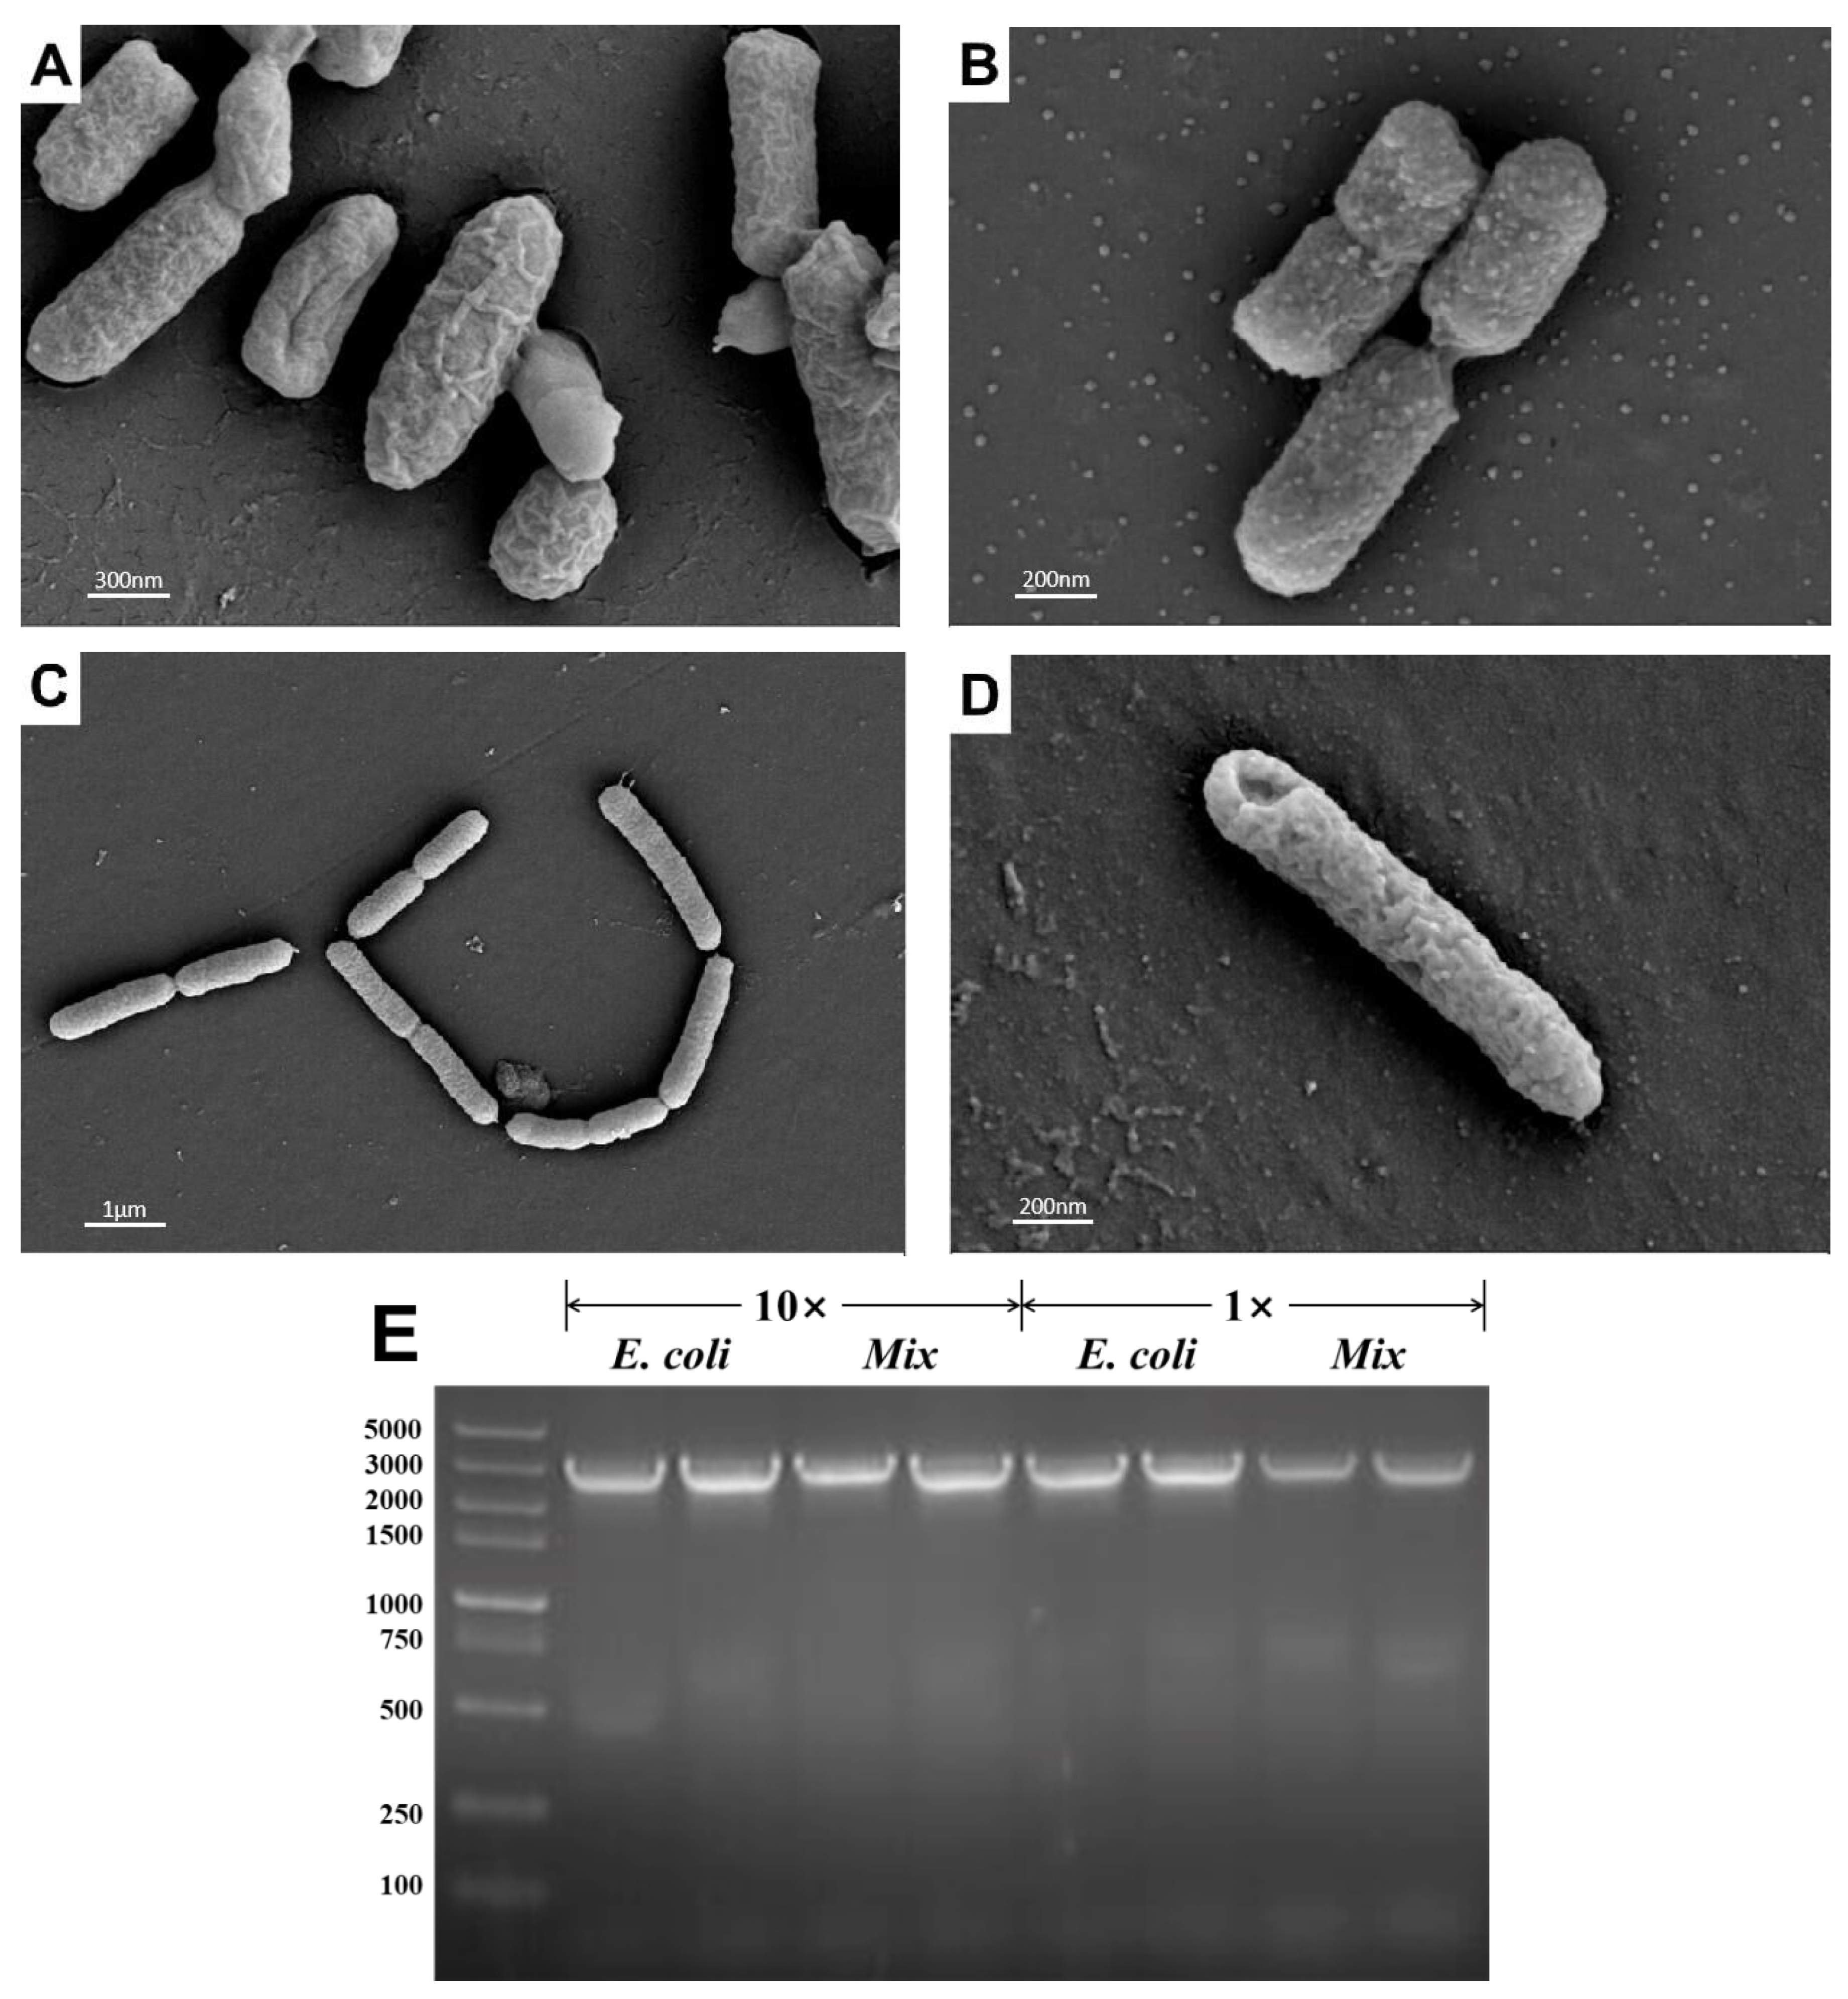
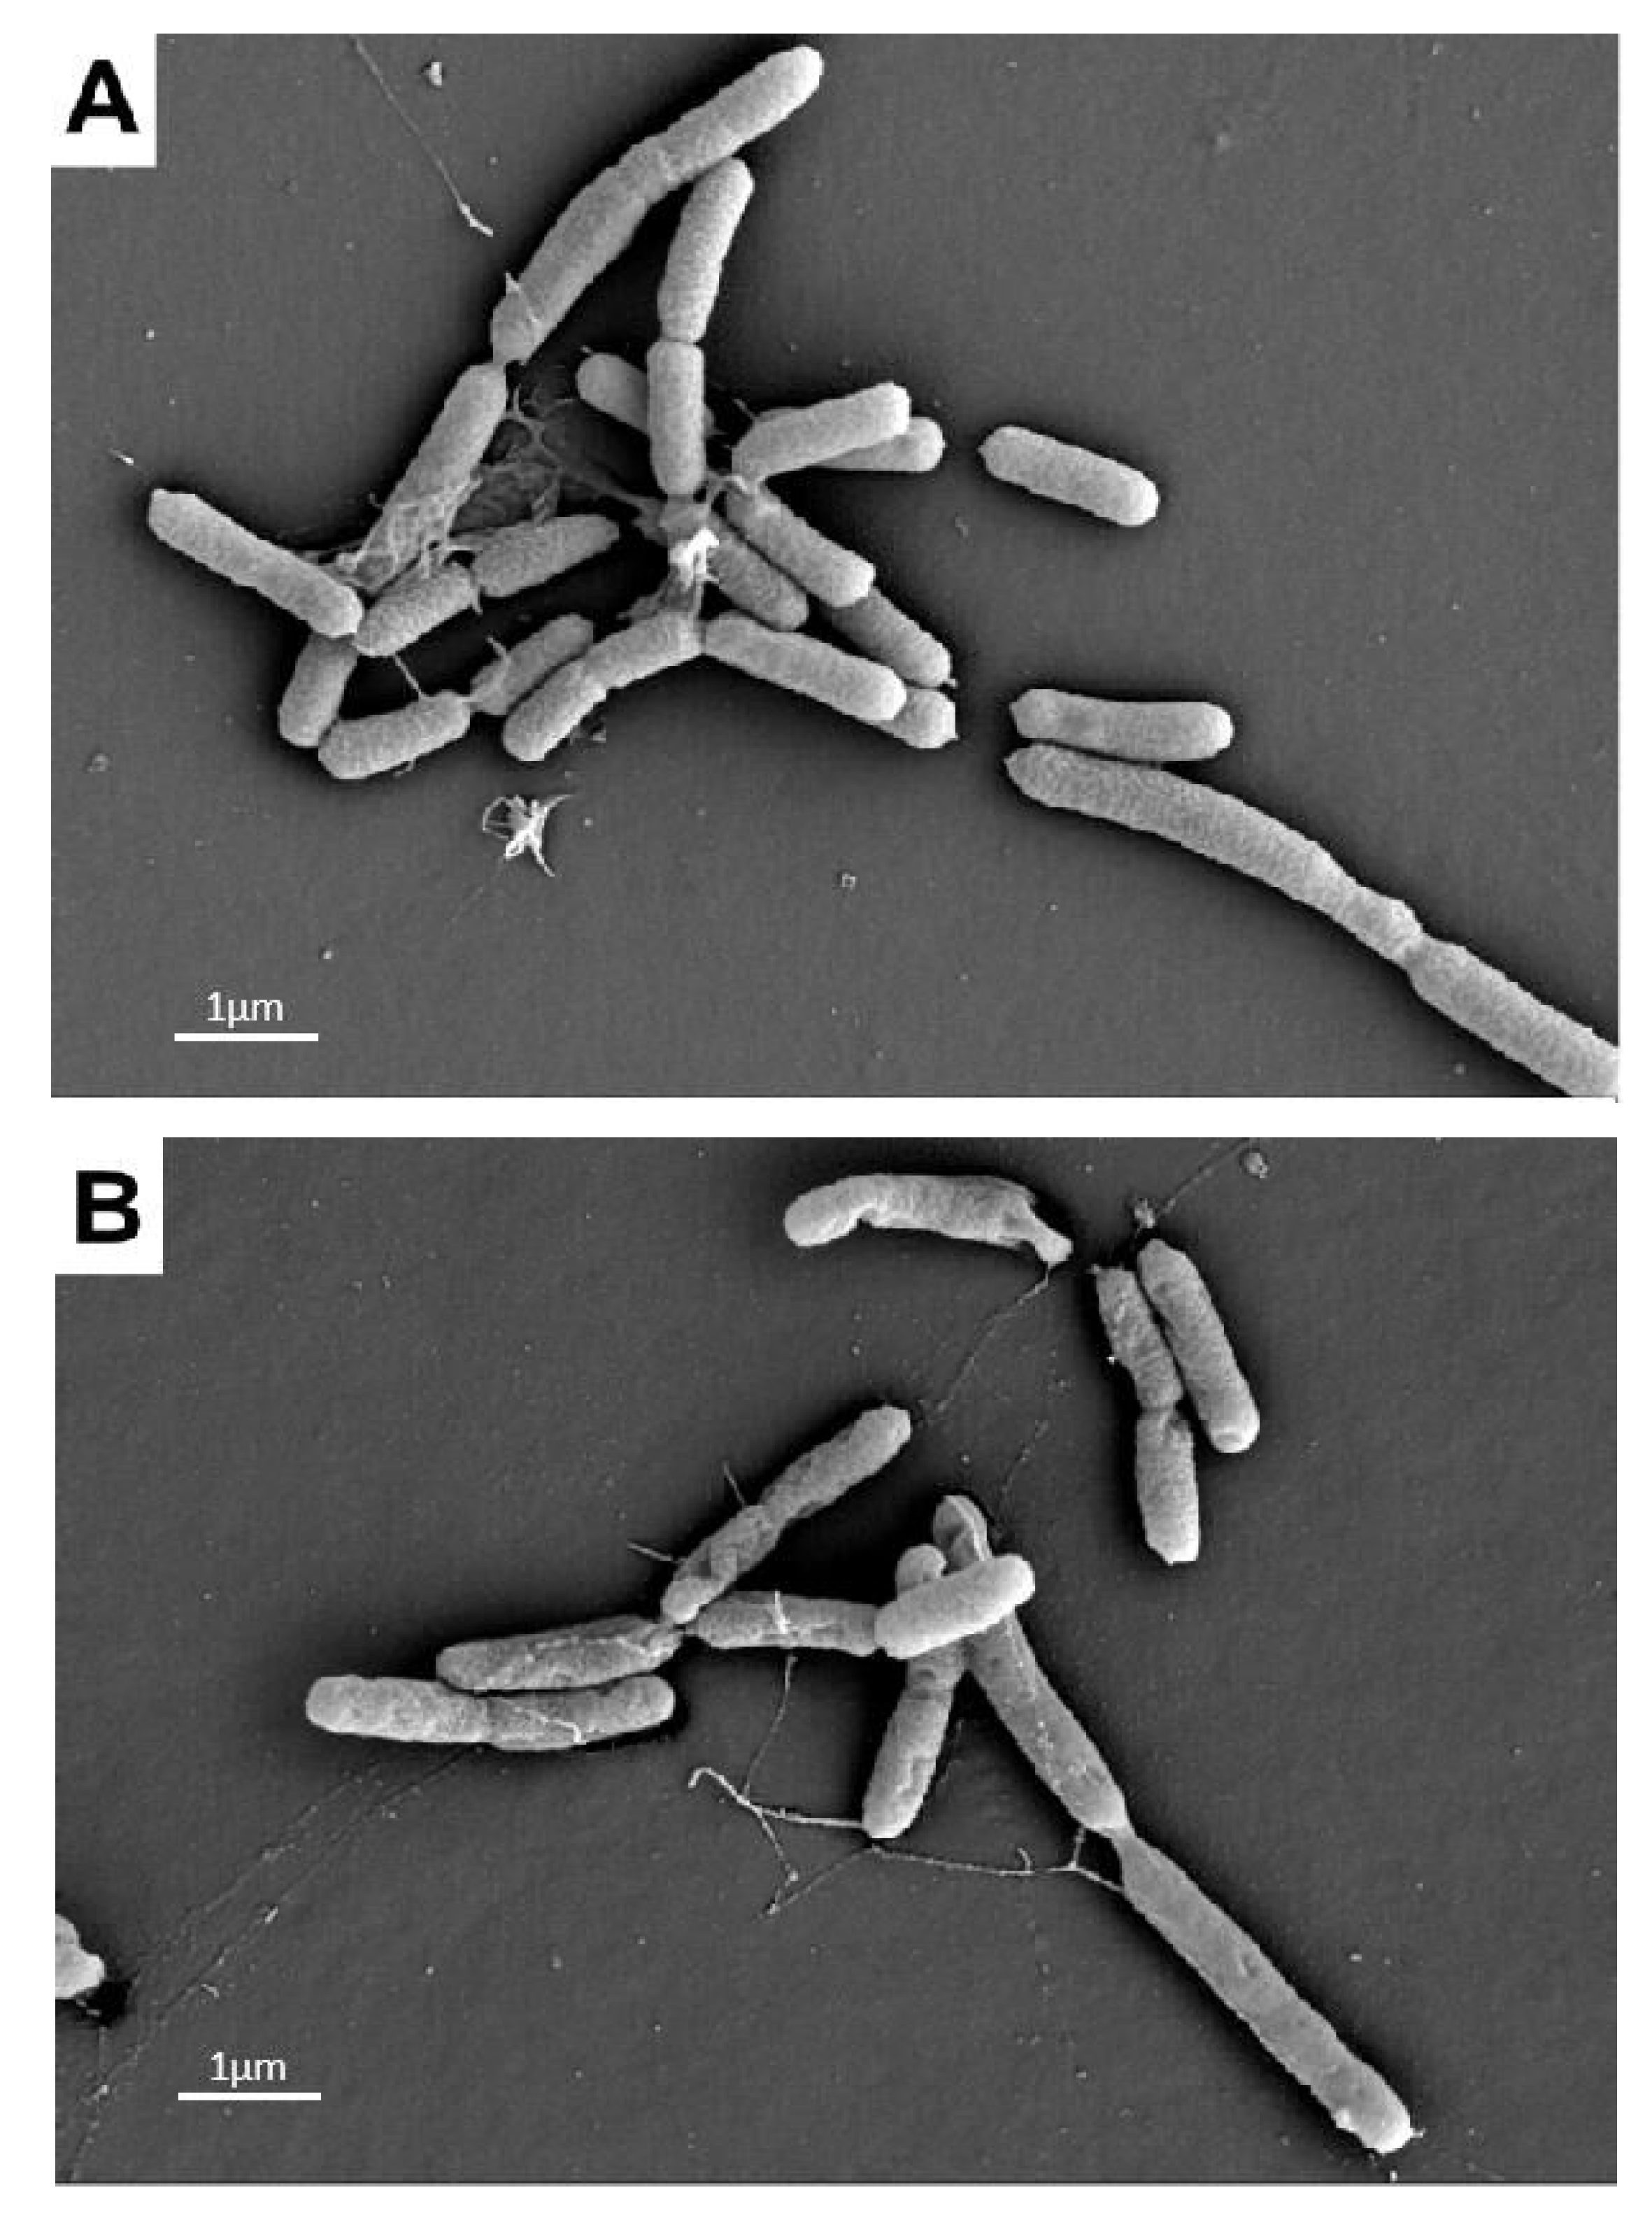
2.7. Electron Micrographs of R. solanacearum Treated with PLGA-TNPs

Figure 7 shows the morphological changes in R. solanacearum treated with ordinary nanoparticles and targeted nanoparticles under a scanning electron microscope. Figure 7A shows the morphology of the treated R. solanacearum strain. Comparing Figure 7B,C shows that the morphology of R. solanacearum treated with ordinary nanoparticles has changed, the surface is relatively uneven, and the flagella structure was destroyed, while the morphology of the R. solanacearum treated with targeted nanoparticles has changed greatly. Due to the targeting effect, the nanoparticles are adsorbed on the surface of the R. solanacearum cell membrane. At the same time, the perforation effect is caused by the contact between the polymer nanoparticles and the cell membrane itself, and combined with the release of MC and CAPE, it may cause circular holes to form in the cell membrane [13]. The reduction in the flagella structure reminded us that the expression of other pathogenicity-related genes of R. solanacearum may also be downregulated. Then, qPCR was employed to detect the expression of pathogenicity-related genes after PLGA-TNP treatment.

2.8. Electron Micrographs of the R. solanacearum Treated with PLGA-TNPs

Figure 8 shows the changes in the expression of pathogenicity-related genes after different treatments. The polygalacturonase gene pehC, motility-related gene pilT, and DNA polymerase-related gene polA are related to the early infection stage of R. solanacearum. The related genes of the core system–phenotypic transformation system regulating the pathogenicity of R. solanacearum, phcA, phcB, and another related gene egl are treated with Triton X-100 as the blank control group. In the group treated with targeted NPs, the expression of related genes decreased significantly.
Among them, the downregulation of the pehC gene was the most obvious, and there were significant differences among the different treatment groups. The expression levels of the control group, API treatment group, and conventional NP treatment group were 20.45, 5.59, and 1.69 times higher than those of the targeted NP treatment group, respectively, hence drug nanocrystallization could inhibit the expression of the pehC gene. Oligo-galacturonic acid is a powerful stimulator of the plant defense response [32]. R. solanacearum could well complete the process of colonization in plants by regulating the environmental tolerance gene pehC, which could destroy the plant defense system, and promote the root invasion and colonization of R. solanacearum. The downregulation of this gene indicates that targeted NPs play a significant role in the prevention and control of bacterial wilt.
In a later stage of infection, the gene expression of the phenotypic transformation system-related genes, phcA and phcB, was significantly downregulated compared to that of the control group, but the gene expression of the control group was 2.76 and 13.38 times higher than that of the targeted NP treatment group, respectively. The downregulation of the egl gene expression was also obvious, and there was a significant difference between the targeted NP treatment group and the control group. The gene expression of the control group was 8.02 times higher than that of the targeted NPs treatment group. PhcA is the core regulatory gene in the phenotypic transformation system, which regulates the pathogenicity of R. solanacearum infection, and regulates the expression of virulence factors such as EPS, a plant cell wall degrading enzyme, motility, and other regulatory elements [33]. The expression of phcA was decreased due to the inhibition of CAPE on various transcription factors and activators [34]. The phcB gene is involved in population signal transduction, and the expression of the phcB gene is significantly lower than that of the phcA and egl genes, resulting in a weakening of the signal that activates the expression of the phcA gene, resulting in a downregulation of phcA expression [6]. In addition, the expression of the phcA gene can regulate the expression of the egl gene, which can confirm the decrease in egl gene expression.
The expression of pathogenicity-related genes egl, phcA, phcB, pilT, polA-238, and pehC in the bacterial cells treated with PLGA-TNPs was downregulated by 78 ± 9, 79 ± 6, 87 ± 5, 61 ± 5, 58 ± 10, and 41% ± 16%, respectively, compared to PLGA-NP treatment. Analysis of the results showed that the targeted NPs mainly acted at a later stage of R. solanacearum infection, but also had a certain inhibitory effect on the invasion and colonization of R. solanacearum in an early stage of the infection.

3. Conclusions

A promising targeted nanoparticle loaded with CAPE and MC was synthesized using emulsification solvent evaporation and the EDC/NHS carboxyl coupling method. Two aspects of the degree of antibody binding and antibacterial rate are taken as indicators to study the coupling process of antibodies and nanomedicines. When the agent was activated for 30 min and the ratio of EDC/NHS was 1:1, the antibody was coupled in a PB buffer with a pH of 7.0 for 40 min and the antibody was diluted 1000 times. The specific binding ability of PLGA-TNPs was verified using the immuno-PCR method and scanning electron microscopy. In addition, the results of the zeta potential analysis of PLGA-TNPs showed that the antibody had successfully bound to the surface of the nanoparticles, and it was also due to the addition of the specific antibody that the EC50 value of the agent was significantly reduced by 92%. Therefore, PLGA-TNPs can target binding to R. solanacearum, continuously release pharmacodynamic molecules, and use the perforating effect of the PLGA-TNPs to disrupt cell membranes and make the contents leak out; meanwhile, it inhibits the expression of encoded flagellar genes and reduces swimming motility. Moreover, it inhibits the expression of the polygalacturonase gene and increases the content of oligogalacturonide, a powerful excitation factor of the plant defense system, to improve the defense ability of plants against R. solanacearum. Therefore, a nanoparticle that has specific targeting effects on R. solanacearum was successfully developed and is potentially valuable in the prevention and treatment of R. solanacearum.

4. Materials and Methods

4.1. Experimental Materials and Strains

The R. solanacearum strain (RS-5) was isolated from diseased mulberry tree leaves and identified with gram staining and a serological response [35]. Antibodies against R. solanacearum strains (Prajna Biology, Shanghai, China), polylactic-co-glycolic acid (PLGA) and polyvinyl alcohol (PVA) 124 (St. Louis, Missouri, American, analytically pure reagent), Tryptone LP0042 (Oxoid, Basingstoke, UK, analytically pure reagent), hydrolyzed casein and methyl caffeate (research group), and phenethyl caffeate (Macleans, Hong Kong, China) [36,37]. 1-Ethyl-3-(3-dimethylaminopropyl) carbodiimide (EDC) and N-hydroxysuccinimide (NHS) (Sinopharm, Shanghai, China, analytically pure reagent). Ltd. DEPC water and isopropanol (Takara). The total RNA extraction reagent TRIzol and PCR kit (Sangon, Shanghai, China). All of the primers were purchased from Shanghai Sangon Biotech. A Roche LightCycler96 real-time fluorescent quantitative PCR instrument (Roche, Shanghai, China).

4.2. Antibody Specificity Verification

According to previous research, the specific capture ability of antibodies can be verified using immuno-PCR methods [14] with slight adjustments. The PCR tube was coated with 50 μL of the serum antibody that had been diluted 1000 times with a CB buffer overnight at 4 °C. A PBST (0.1 M, pH 7.4) buffer was used to wash the PCR tube after the coating process, and the remaining liquid was knocked out after the washing process. The suspensions of R. solanacearum (CPG Culture 30 °C OD600 = 0.8~1) and E. coli (LB Culture 37 °C OD600 = 0.8~1) were diluted 1000 times and added to PCR tubes to perform the incubation process at 37 °C for 2 h. In this stage, the antibody on the surface of the PCR tube reacted with the target protein on the surface of R. solanacearum to specifically adsorb R. solanacearum. The cell of E. coli was not adsorbed due to the absence of the target protein on the cell membrane. After the incubation, the PCR tubes were washed with a PBST buffer, eventually washing out the unreacted strains. The primers, 16S rDNA (27F:5′-AGAGTTTGATCCTGGCTCAG-3′,1492R: 5′-GGTTACCTTGTTACGACTT-3′) and T7(T7:5′-TAATACGACTCACTATAGGG-3′,T7 ter: 5′-TGCTAGTTATTGCTCAGCGG-3′) were used to detect R. solanacearum and E. coli, respectively.

4.3. Preparation of PLGA-TNPs Loaded with MC and CAPE

After the study of the magnetic activation time of PLGA [35] sustained-release targeted compound nanopharmaceuticals, the antibody coupling time, the pH of the PB connection reaction solution, the coupling drug ratio, and the antibody dilution ratio, the preparation method began with the emulsifying solvent volatilization method to produce a compound nanoparticle loaded with CAPE and MC. To conjugate the antibody to the surface of the nanoparticle, an EDC/NHS chemical coupling method was used [38]. The first 2.5 mg of EDC and NHS and 5 mg of compound nanoparticles in the MES solution were activated (10 min, 20 min, 30 min, 40 min, 50 min, and 1 h). The nanoparticles were collected using centrifugation at 8000× g for 5 min. A PB ligation reaction solution (pH = 8.0, 7.5, 7.0, 6.5, 6.0, and 5.7) was added, and the solution was shaken for 2 min. Antibody coupling was performed with different dilutions (1000, 2000, 4000, 8000, 16000) and different antibody binding times (10 min, 20 min, 30 min, 40 min, 50 min, and 1 h). The nanoparticles were then collected using centrifugation and the supernatant was discarded. The nanoparticles were washed once with a PBS buffer solution, centrifuged again, resuspended in a PBS buffer solution, and finally conjugated with the antibody. The nanoparticles were frozen in a refrigerator at −20 °C, lyophilized for 48 h, and stored at −80 °C.

4.4. TMB Chromogenic Reaction of Antibody Hrp

A microplate reader (SpectraMax i3, Silicon Valley, CA, USA) was employed to measure the absorbance after the TMB chromogenic reaction. An Hrp enzyme-linked antibody was used to bind the nanoparticle, and the degree of binding of the antibody and the nanoparticle could be effectively determined through the TMB color reaction. A TMB chromogenic solution was prepared by mixing a dihydrate tetramethylbenzidine solution with a citric acid solution in equal amounts. Then, a 50-microliter TMB chromogenic solution was mixed with a PLGA-TNP solution dissolved in PBS. After a dark reaction occurred for 30 min, 50 μL of 0.5 mol sulfuric acid was added to terminate the chromogenic reaction, and the absorbance was measured at 450 nm.

4.5. Sustained Release Kinetics of PLGA-TNPs

The sustained release kinetics of PLGA-TNPs were evaluated in buffer solutions with pH values of 6.5, 7.4, and 9.5, according to the method previously reported by our research group. The standard curve formula is shown in (1) and (2). The Fickian model [13,39] was used to analyze the release process of PLGA-TNPs, and the release mechanism was described by a semiempirical Equation (3). Formulas (1) and (2) and Equation (3) are as follows:
MC standard curve line: Y = 439950x − 16.277  R2 = 0.9997
CAPE standard curve line: Y = 274620x − 16.708  R2 = 0.9995
Mt M = kx n + α
where Mt represents the quantity of active pharmacodynamic molecules (API) released at time t. M∞ represents the quantity of API released at infinite time, which could be roughly regarded as the total amount of all of the pharmacodynamic molecules contained in the nanoparticle. Moreover, k refers to a kinetic constant, and n is an exponent related to the geometry and release mechanism of NPs. When the release model is spherical, n is equal to 0.43. α is a pharmacodynamic molecule released at time zero, that is, the initial release amount [29]. The API included equimolar CAPE and MC.

4.6. The Characterization of PLGA-TNPs

A Fourier infrared spectrometer was employed to reconfirm the presence of MC and CAPE in the PLGA-TNPs [40]. The zeta potential of the PLGA-TNPs was characterized by optical fiber technology using a Brookhaven NanoBrook particle size and zeta potential analyzer. SEM (GeminiSEM 300, Carl Zeiss AG, Germany) and TEM (CM100, Philips Electronic N.V., The Netherlands) was performed to observe the apparent morphology of targeted nanomedicine after encountering R. solanacearum, and the inhibitory effect of the inhibitor was observed by the morphology of the cell membrane of R. solanacearum [13]. The size of the nanoparticles was detected using transmission electron microscopy.

4.7. Verification of Drug Targeting Performance

R. solanacearum and E. coli were cultured separately and mixed, and further incubated overnight at the optimal temperatures (30 °C for R. solanacearum, 37 °C for E. coli, and 30 °C for the mixed culture). Targeted NPs (4 mg/mL) were added to half of them at a ratio of 2:1, and the same amount of sterile water was added to the control group. After culturing at 30 °C for 24 h, the different treated strains were centrifuged at 8000 rpm for 2 min, and the precipitates were collected. The genomic DNA and plasmid DNA were extracted using a DNA extraction kit (Sangon Biotech, China) and TIAN prep Mini plasmid kit (Tiangen Biotech, China), respectively. The concentration was determined using a microspectrophotometer and the plasmid was amplified using T7 and T7T primers by PCR. The reaction system was 20 μL, which was composed of 10 μL of Taq Mix, 0.5 μL of T7 primer (5.39 nmol/OD), 0.5 μL of T7T primer (5.38 nmol/OD), 8 μL of sterile water, and 1.0 μL of plasmid DNA. The conditions of the PCR reaction were as follows: 95 °C for 5 min, then 95 °C for 30 s, 55 °C for 30 s, 72° C for 90 s for 32 cycles, then 72 °C for 5 min, then stored at 4 °C. After amplification, a DNA loading buffer was added to the product and an agarose gel with a concentration of 1% was prepared, a TAE buffer was used as a separation buffer, followed by loading the DNA marker and samples. Electrophoresis was performed for 20 min at 140 V, 400 mA, and a UV transilluminator was employed to observe the bands. The morphology of R. solanacearum and E. coli under the treatments above was evaluated using SEM.

4.8. Evaluation of Antibacterial Properties of Drugs

A 96-well plate was used to measure the inhibitory effects of antibacterial agents applied in different gradients on R. solanacearum. A 200 μL system constituted of 40 μL of OD600 = 1 R. solanacearum bacterial suspension, 140 μL of CPG medium, and 20 μL of different concentrations of compound nanopharmaceuticals (4, 3.2, 1.6, 0.8, 0.4, 0.2, and 0.1 mg/mL) was added to a 96-well plate; the control group was 40 μL of bacterial suspension, 140 μL of liquid CPG medium, and 20 μL of sterile aqueous solution. After the sample was added, a microplate reader was used to measure the OD600, which was recorded as T0. Subsequently, the 96-well plate was incubated overnight at 30 °C, and after shaking for 5 min, the OD600 was measured and recorded as TF. The antibacterial rate of the PLGA-TNPs was calculated according to the following Formula (4) [15]:
Inhibition ( % ) = [ 1 TFsample T 0 sample TFblank T 0 blank ) ] × 100 %
where TFsample and T0sample, respectively, represent the OD600 absorbance value of the bacterial solution before and after addition of the compound nanomedicine, and TFblank and T0blank, respectively, represent the OD600 readings of the bacterial solution before and after the culture of the control group.

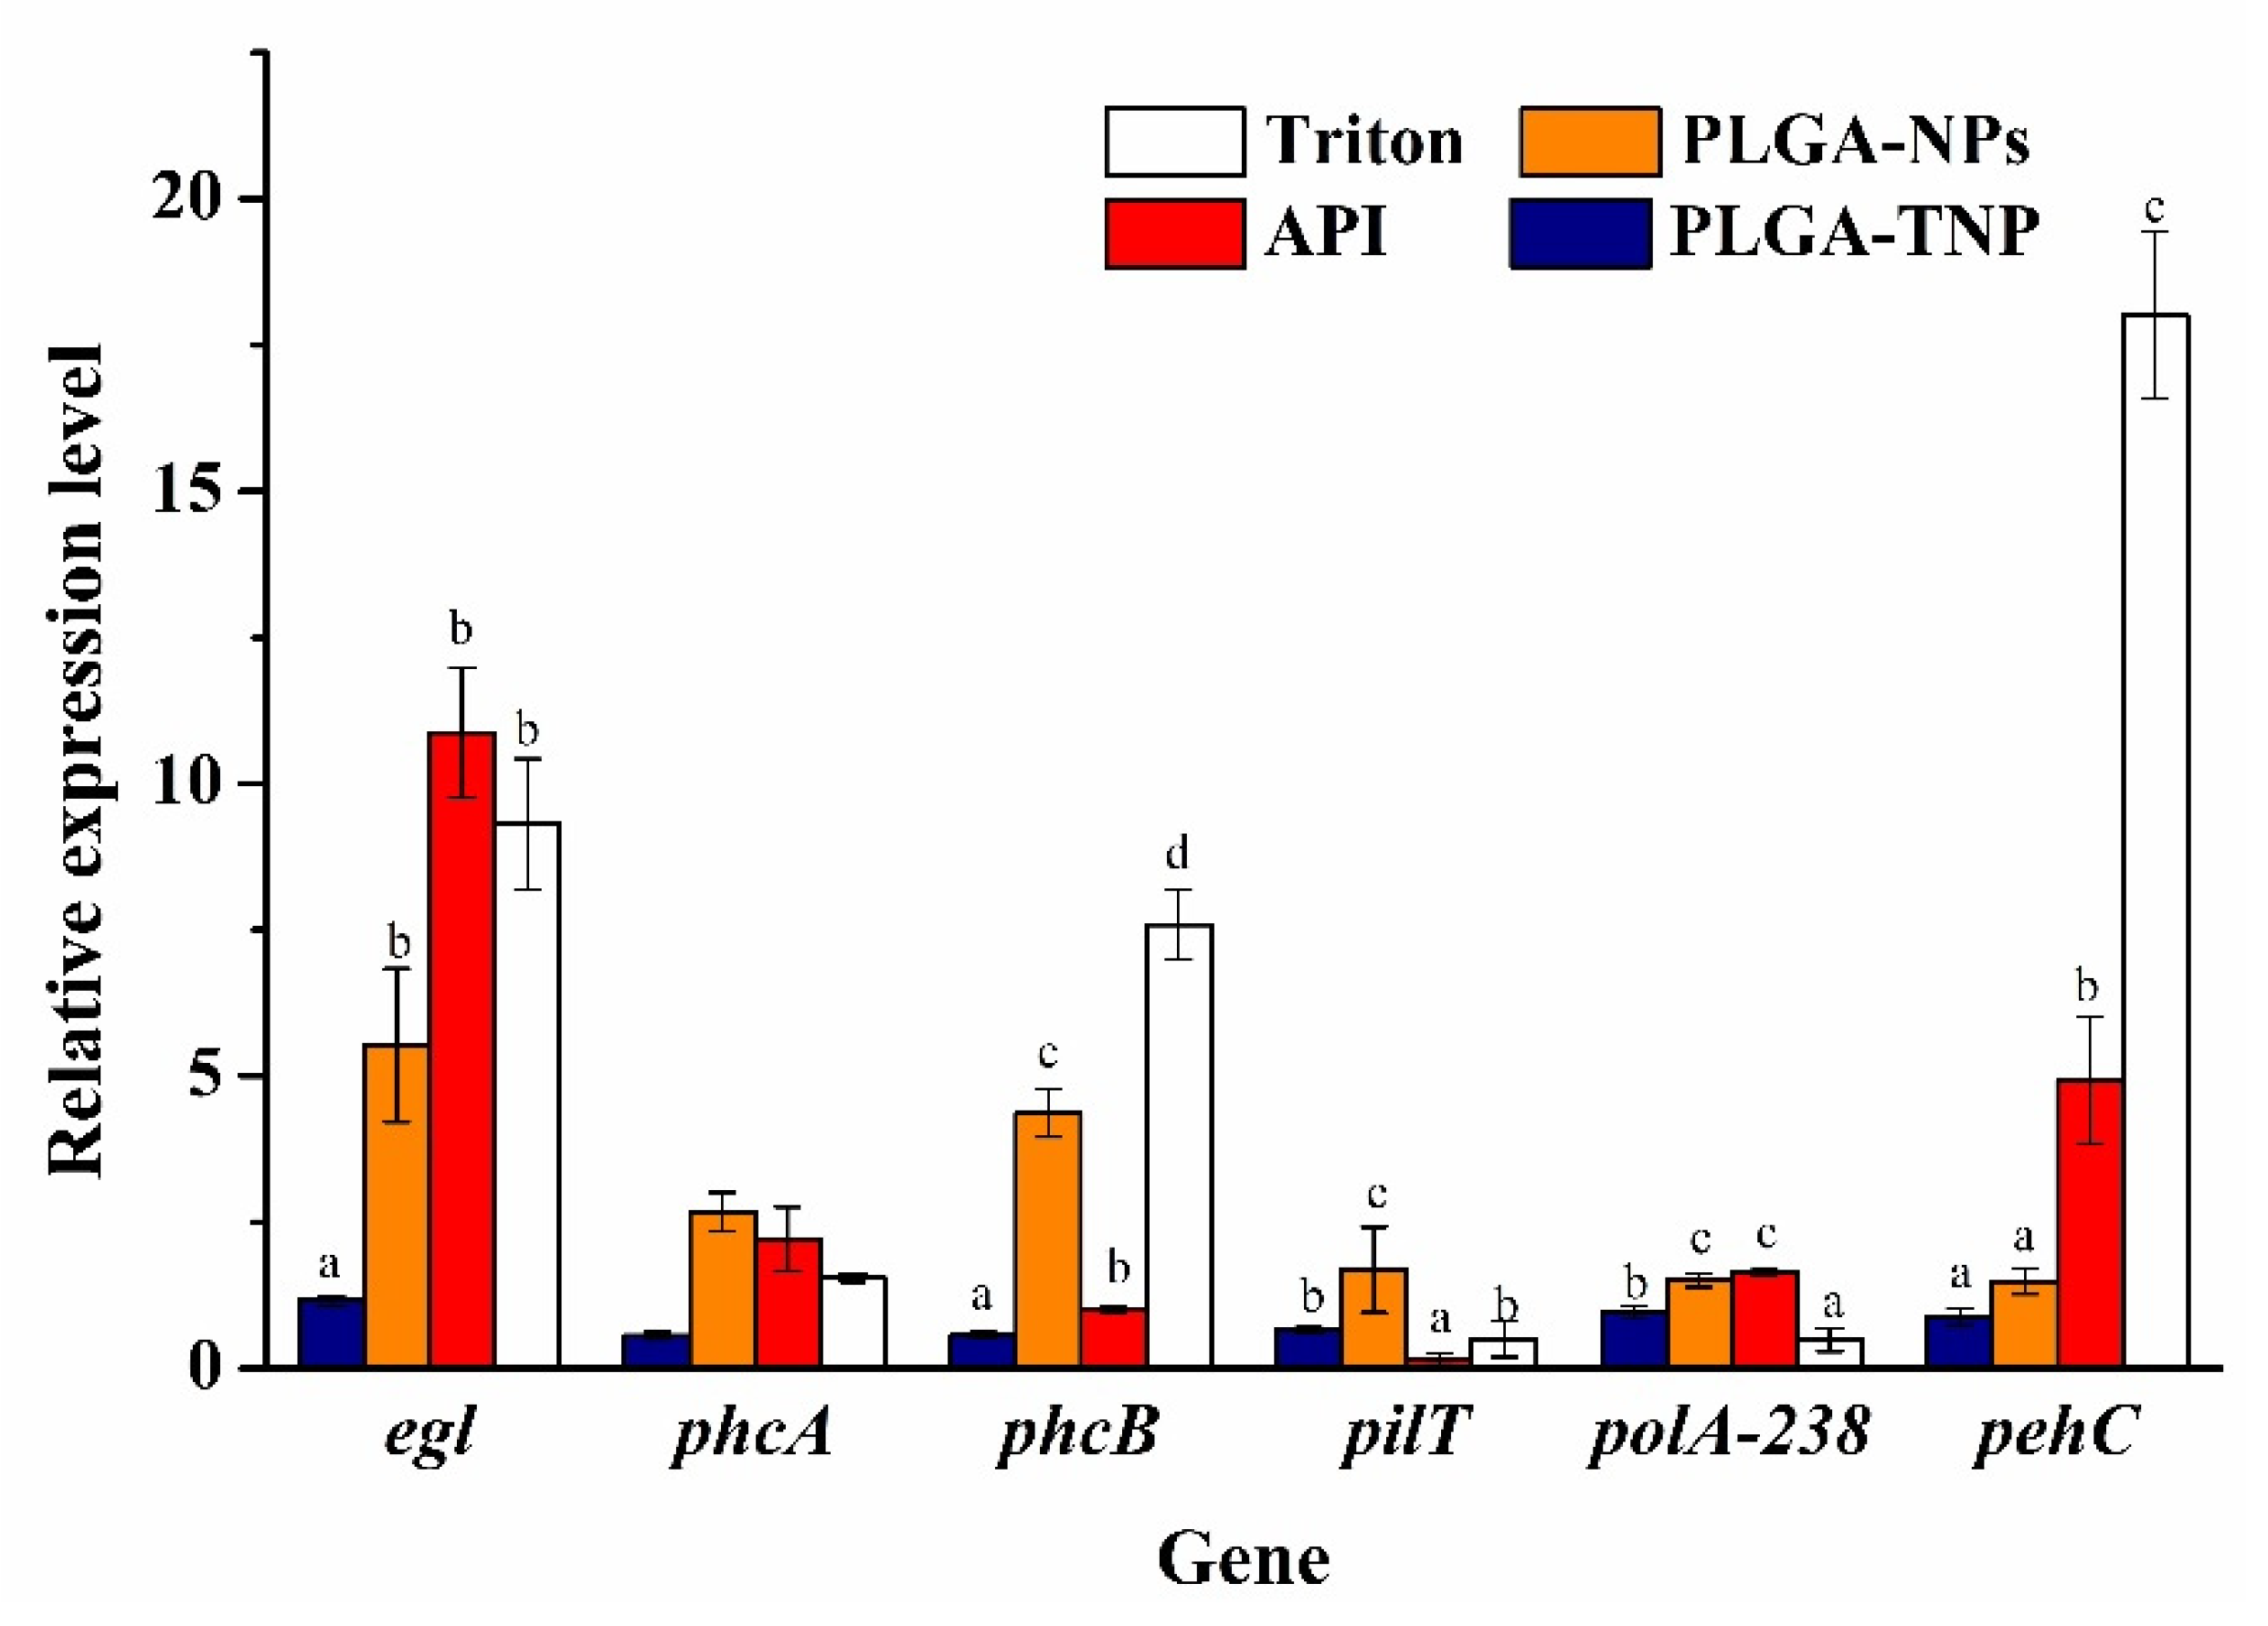
4.9. Pathogenicity-Related Gene Expression in R. solanacearum

PLGA-TNPs (4 mg/mL), PLGA-NPs (4 mg/mL), active pharmacodynamic molecules (APIs, 4 mg/mL), and Triton X-100 were added to the bacterial solution (OD600 = 0.8–1) at a volume ratio of 1:2 and incubated at 30 °C for 24 h. The relative expression levels of pathogenicity-related genes were measured using a LightCycler 96 real-time fluorescence quantitative PCR system (Roche, Switzerland) as described in the previous study [13]. Specifically, each reaction system (20 μL) contained 10 μL of TB Green, 0.8 μL of upstream primers, 0.8 μL of downstream primers, 6.4 μL of RNase-free double-distilled water, and 2 μL of cDNA (998 ng/μL). The reaction conditions were 94 °C for 5 min; 94 °C for 15 s, 60 °C for 30 s, and 72 °C for 30 s, for 45 cycles; and 95 °C for 10 s, 65 °C for 60 s, and 97 °C for 1s. The pathogenicity-related genes of R. solanacearum were selected according to previous research [41]. The 16S rRNA of R. solanacearum was used as an internal reference gene, and all of the experiments were repeated three times at the experimental level.

4.10. Statistical Analysis

The significant differences between the treatments were assessed by ANOVA, using Duncan’s multiple range test. Data were subjected to a two-way ANOVA test using intercropping and crop type as sources of a variable. ANOVA tests were performed using SPSS version 19. Based on OTU data, redundancy analysis was performed using Canoco for Windows 4.5, and Venn diagram, hierarchical cluster analysis, distance heatmap, redundancy analysis, and variation partition analysis were performed using Ri386. Significant level analysis was conducted using Duncan’s multiple range test, and an EC50 calculation was completed. The significant differences between the treatments were assessed using analysis of variance. All of the experimental data are in triplicate, and the results are reflected in the error bars of the graph.

Author Contributions

Conceptualization, J.W. and S.S.; methodology, X.-J.Y. and L.-T.G.; software, X.-J.Y. and S.S.; validation, X.-J.Y. and S.S.; data curation, X.-Y.X. and X.-Y.S.; writing—original draft preparation, X.-J.Y. and L.-T.G.; writing—review and editing, J.W. and F.-A.W.; project administration, J.W. and F.-A.W.; funding acquisition, X.-J.Y.; All authors have read and agreed to the published version of the manuscript.

Funding

This study was financially supported by the Undergraduate Innovation Project of Jiangsu Province (grant number: 201910289052Y, 202010289029Z), and the Undergraduate Innovation Project of Jiangsu University of Science and Technology.

Institutional Review Board Statement

Not applicable.

Informed Consent Statement

Not applicable.

Acknowledgments

Thanks to Yan Xu for providing evaluation method of antibacterial activity, and thanks to Jin-Zheng Wang, Tian-Qi Wang for language polishing and helpful suggestion.

Conflicts of Interest

The authors declare no conflict of interest.

References

  1. Jiang, G.; Wei, Z.; Xu, J.; Chen, H.L.; Zhang, Y.; She, X.M.; Macho, A.P.; Ding, W. Bacterial wilt in China: History, current status, and future perspectives. Front. Plant Sci. 2017, 8, 1549. [Google Scholar] [CrossRef]
  2. Huet, G. Breeding for resistances to Ralstonia solanacearum. Front. Plant Sci. 2014, 5, 715. [Google Scholar] [CrossRef] [Green Version]
  3. Boucher, C.A.; Gough, C.L.; Arlat, M. Molecular genetics of pathogenicity determinants of Pseudomonas solanacearum with special emphasis on hrp genes. Annu. Rev. Phytopathol. 2003, 30, 443–461. [Google Scholar] [CrossRef]
  4. Hikichi, Y.; Mori, Y.; Ishikawa, S.; Hayashi, K.O.; Kouhei, K.; Akinori, K. Regulation involved in colonization of intercellular spaces of host plants in Ralstonia solanacearum. Front. Plant Sci. 2017, 8, 967. [Google Scholar] [CrossRef] [Green Version]
  5. Gonzalez, E.T.; Allen, C. Characterization of a Ralstonia solanacearum operon required for polygalacturonate degradation and uptake of galacturonic acid. Mol. Plant-Microbe Interact. 2003, 16, 536–544. [Google Scholar] [CrossRef]
  6. Brumbley, S.M.; Carney, B.; Denny, T. Phenotype conversion in Pseudomonas solanacearum due to spontaneous inactivation of PhcA, a putative LysR transcriptional regulator. J. Bacteriol. 1993, 175, 5477–5487. [Google Scholar] [CrossRef] [PubMed] [Green Version]
  7. Saravanan, S.; Malathi, S.; Sesh, P.S.L.; Selvasubramanian, S.; Balasubramanian, V. Hydrophilic poly (ethylene glycol) capped poly (lactic-co-glycolic) acid nanoparticles for subcutaneous delivery of insulin in diabetic rats. Int. J. Biol. 2016, 95, 1190–1198. [Google Scholar]
  8. Danhier, F.; Ansorena, E.; Silva, J.M.; Coco, R.L.; Breton, A.; Preat, V. PLGA-based nanoparticles: An overview of biomedical applications. J. Control. Release 2012, 161, 505–522. [Google Scholar] [CrossRef]
  9. Cheng, H.J.; Wang, H.; Zhang, J.Z. Phytofabrication of silver nanoparticles using three flower extracts and their antibacterial activities against pathogen Ralstonia solanacearum strain YY06 of bacterial wilt. Front. Microbiol. 2020, 11, 2110. [Google Scholar] [CrossRef]
  10. Cai, L.; Chen, J.N.; Liu, Z.W.; Wang, H.C.; Yang, H.K.; Ding, W. Magnesium oxide nanoparticles: Effective agricultural antibacterial agent against Ralstonia solanacearum. Front. Microbiol. 2018, 9, 790. [Google Scholar] [CrossRef] [PubMed]
  11. Durak, S.; Arasoglu, T.; Ates, S.C.; Derman, S. Enhanced antibacterial and antiparasitic activity of multifunctional polymeric nanoparticles. Nanotechnology 2020, 31, 5705. [Google Scholar] [CrossRef]
  12. Song, X.R.; Zhao, Y.; Hou, S.X.; Xu, F.Y.; Zhao, R.; He, J.Y.; Cai, Z.L.; Yuan, B.; Chen, Q.H. Dual agents loaded PLGA nanoparticles: Systematic study of particle size and drug entrapment efficiency. Eur. J. Pharm. Biopharm. 2008, 69, 445–453. [Google Scholar] [CrossRef]
  13. Wang, J.Z.; Yan, C.H.; Zhang, X.R.; Tu, Q.B.; Xu, Y.; Sheng, S.; Wu, F.A.; Wang, J. A novel nanoparticle loaded with methyl caffeate and caffeic acid phenethyl ester against Ralstonia solanacearum—a plant pathogenic bacteria. RSC Adv. 2020, 10, 3978–3990. [Google Scholar] [CrossRef] [Green Version]
  14. Ito, S.; Ushuima, Y.; Fujii, T.; Tanaka, S.; Iwaki, M.K.; Yhiwara, S.; Kishi, F. Detection of viable cells of Ralstonia solanacearum in soil using a semiselective medium and a PCR technique. J. Phytopathol. 2010, 146, 379–384. [Google Scholar] [CrossRef]
  15. Lee, J.M.; Edwards, H.H.L.; Pereira, C.A.; Samii, S.I. Crosslinking of tissue-derived biomaterials in 1-ethyl-3-(3-dimethylaminopropyl)-carbodiimide (EDC). J. Mater. Sci. 1996, 7, 531–541. [Google Scholar] [CrossRef]
  16. Nam, K.; Kimura, T.; Kishida, A. Controlling Coupling Reaction of EDC and NHS for Preparation of Collagen Gels Using Ethanol/Water Co-Solvents. Macromol. Biosci. 2008, 8, 32–37. [Google Scholar] [CrossRef]
  17. Olde, D.L.; Dijkstra, P.J.; Luyn, M.J.; Nieuwenhuis, P.; Feijen, J. In vitro degradation of dermal sheep collagen cross-linked using a water-solublecarbodiimide. Biomaterials 1996, 17, 679–684. [Google Scholar]
  18. Piegat, A.; Goszczyńska, A.; Idzik, T.; Idzik, T.; Niemczyk, A. The Importance of Reaction Conditions on the Chemical Structure of N,O-Acylated Chitosan Derivatives. Molecules 2019, 24, 3047. [Google Scholar] [CrossRef] [PubMed] [Green Version]
  19. Kelestemur, S.; Altunbek, M.; Culha, M. Influence of EDC/NHS coupling chemistry on stability and cytotoxicity of ZnO nanoparticles modified with proteins. Appl. Surf. Sci. 2017, 403, 455–463. [Google Scholar] [CrossRef]
  20. Wang, X.P.; Li, X.; Ito, A.; Yu, S.; Ohno, T. Biodegradable metal Ion-doped Mesoporous Silica nanospheres stimulate anticancer Th1 immune response in vivo. ACS Appl. Mater. Interfaces 2017, 9, 43538–43544. [Google Scholar] [CrossRef]
  21. Zhang, W.; Ang, W.T.; Xue, C.Y.; Yang, K.L. Minimizing Nonspecific Protein Adsorption in Liquid Crystal Immunoassays by Using Surfactants. ACS Appl. Mater. Interfaces 2011, 3, 3496–3500. [Google Scholar] [CrossRef]
  22. Acharya, S.; Dilnawaz, F.; Sahoo, S.K. Targeted epidermal growth factor receptor nanoparticle bioconjugates for breast cancer therapy. Biomaterials 2009, 30, 5737–5750. [Google Scholar] [CrossRef]
  23. Suleiman, E.; Mayer, J.; Lehner, E.; Kohlhauser, B.; Katholnig, A.; Batzoni, M.; Damm, D.; Temchura, V.; Wagner, A.; Ueberla, K.; et al. Conjugation of native-like HIV-1 envelope trimers onto liposomes using EDC/Sulfo-NHS chemistry: Requirements and limitations. Pharmaceutics 2020, 12, 979. [Google Scholar] [CrossRef] [PubMed]
  24. Nath, K.A.; Croatt, A.J.; Likely, S.; Behrens, T.W.; Warden, D. Renal oxidant injury and oxidant response induced by mercury. Kidney Int. 1996, 50, 1032–1043. [Google Scholar] [CrossRef] [PubMed] [Green Version]
  25. Chen, H.; Wang, Y. Enhanced anti-tumor efficacy by co-delivery of doxorubicin and paclitaxel with amphiphilic methoxy PEG-PLGA copolymer nanoparticles. Biomaterials 2011, 32, 8281–8290. [Google Scholar]
  26. Serap, D. Caffeic Acid Phenethyl Ester Loaded PLGA Nanoparticles: Effect of Various Process Parameters on Reaction Yield, Encapsulation Efficiency, and Particle Size. J. Nanomater. 2015, 10, 1–12. [Google Scholar]
  27. Pyo, M.K.; Lee, Y.Y.; Yun-Choi, H.S. Anti-platelet effect of the constituents isolated from the barks and fruits of Magnolia obovata. Arch. Pharm. Res 2002, 25, 325–328. [Google Scholar] [CrossRef]
  28. Seju, U.; Kumar, A.; Sawant, K.K. Development and evaluation of olanzapine-loaded PLGA nanoparticles for nose-to-brain delivery: In vitro and in vivo studies. Acta Biomater. 2011, 7, 4169–4176. [Google Scholar] [CrossRef]
  29. Pedram, R.; Azita, H. Docetaxel-loaded PLGA and PLGA-PEG nanoparticles for intravenous application: Pharmacokinetics and biodistribution profile. Int. J. Nanomed. 2017, 12, 935–947. [Google Scholar]
  30. Li, W.R.; Xie, X.B.; Shi, Q.S.; Zeng, H.Y.; Ou-Yang, Y.S.; Chen, Y.B. Antibacterial activity and mechanism of silver nanoparticles on Escherichia coli. Appl. Microbiol. Biotechnol. 2010, 85, 1115. [Google Scholar] [CrossRef]
  31. Roque, L.; Duarte, N.; Bronze, M.R.; Garcia, C.; Alopaeus, J.; Molpeceres, J.; Hagesaether, E.; Tho, I.; Rijo, P.; Reis, C. Development of a bioadhesive nanoformulation with Glycyrrhiza glabra L. extract against Candida albicans. Biofouling 2018, 34, 880–892. [Google Scholar] [CrossRef]
  32. Barber, C.E.; Tang, J.L.; Feng, J.X.; Pan, M.Q.; Daniels, M.J. A novel regulatory system required for pathogenicity of Xanthomonas campestris is mediated by a small diffusible signal molecule. Mol. Microbiol. 2010, 24, 555–566. [Google Scholar] [CrossRef]
  33. Garg, R.P.; Huang, J. Multicomponent transcriptional regulation at the complex promoter of the exopolysaccharide I biosynthetic operon of Ralstonia solanacearum. J. Bacteriol. 2000, 182, 6659–6666. [Google Scholar] [CrossRef] [Green Version]
  34. Murtaza, G.; Sajjad, A.; Mehmood, Z.; Shah, S.H.; Siddiqi, A.R. Possible molecular targets for therapeutic applications of caffeic acid phenethyl ester in inflammation and cancer. J. Food Drug Anal. 2015, 23, 11–18. [Google Scholar] [CrossRef] [Green Version]
  35. Fonseca, C.; Sim, E.S.; Gaspar, R. Paclitaxel-loaded PLGA nanoparticles: Preparation, physicochemical characterization and in vitro anti-tumoral activity. J. Control. Release 2002, 83, 273–286. [Google Scholar] [CrossRef] [Green Version]
  36. Xu, Y.; Sheng, S.; Liu, X.; Chao, W.; Wei, X.; Wang, J.; Wu, F.A. Cooperative Reinforcement of Ionic Liquid and Reactive Solvent on Enzymatic Synthesis of Caffeic Acid Phenethyl Ester as an In Vitro Inhibitor of Plant Pathogenic Bacteria. Molecules 2017, 22, 72. [Google Scholar] [CrossRef] [PubMed] [Green Version]
  37. Wang, J.Z.; Gu, S.S.; Pang, N.; Wang, F.Q.; Wu, F.A. A study of esterification of caffeic acid with methanol using p-toluenesulfonic acid as a catalyst. J. Serb. Chem. Soc. 2013, 78, 1023–1034. [Google Scholar] [CrossRef]
  38. Wissink, M.J.B.; Beernink, R.; Pieper, J.S.; Poot, A.A.; Feijen, J. Immobilization of heparin to EDC/NHS-crosslinked collagen. Characterization and in vitro evaluation. Biomaterials 2001, 22, 151–163. [Google Scholar] [CrossRef]
  39. Budhian, A.; Siegel, S.J.; Winey, K.I. Controlling the in vitro release profiles for a system of haloperidol-loaded PLGA nanoparticles. Int. J. Pharm. 2008, 346, 151–159. [Google Scholar] [CrossRef] [PubMed]
  40. Derman, S.; Mustafaeva, Z.A.; Abamor, E.S.; Bagirova, M.; Allahverdiyev, A. Preparation, characterization and immunological evaluation: Canine parvovirus synthetic peptide loaded PLGA nanoparticles. J. Biomed. Sci. 2015, 22, 89. [Google Scholar] [CrossRef] [PubMed] [Green Version]
  41. Addy, H.S.; Askora, A.; Kawasaki, T.; Fujie, M.; Yamada, T. Loss of virulence of the phytopathogen Ralstonia solanacearum through infection by ΦRSM filamentous phages. Phytopathology 2012, 102, 469–477. [Google Scholar] [CrossRef] [PubMed] [Green Version]
Figure 1. Immuno-PCR was used to detect the specific targeting effect of the antibody on R. solanacearum. Test templates of water and R. solanacearum bacterial solution were used as the negative control (N) and the positive control (P), respectively.
Agronomy 11 01159 g001
Figure 2. TMB chromogenic reaction based on ELISA principles was employed to detect the binding effect of an antibody and PLGA-NPs. The effects of the ratio of EDC to NHS (A), activation time (B), pH value of the buffer (C), and antibody binding time (D) on the binding degree of the antibody were investigated. Error bars represent the standard error of at least three independent trials.
Agronomy 11 01159 g002
Figure 3. Investigation of the effects of the antibody and PLGA-NP coupling process on antibacterial performance. The effects of the ratio of EDC to NHS (A), activation time (B), pH value (C), binding time (D), and antibody usage (E) on the inhibition rate were investigated. Error bars represent the standard error of at least three independent trials.
Agronomy 11 01159 g003
Figure 4. The prepared PLGA-TNPs were characterized using Fourier-transform infrared spectroscopy (A), zeta potential analysis (B), particle size distribution (C), and transmission electron microscopy (D).
Agronomy 11 01159 g004
Figure 5. Sustained-release performance of PLGA-TNPs loaded with MC and CAPE (A) and release curves of MC and CAPE at a pH of 6.5 (B), 7.4 (C), and 9.5 (D). PLGA-NPs were prepared at a 1:1 ratio of EDC to NHS, with 30 min of activation time, a pH of 7, and 40 min of antibody binding time.
Agronomy 11 01159 g005
Figure 6. Evaluation of the targeting effect of PLGA-TNPs loaded with MC and CAPE on R. solanacearum. Normal electron micrographs of E. coli (A) and R. solanacearum (C) are presented. The PLGA-TNP treatment groups of E. coli and R. solanacearum are presented in (B) and (D). Bacterial universal primers were employed to perform PCR detection on a bacterial solution of E. coli and R. solanacearum and generate a gel image (E).
Agronomy 11 01159 g006
Figure 7. Scanning electron micrographs of the bacteriostatic treatment of R. solanacearum. (A). The strains incubated at 30 °C for 24 h were designated the blank control group at 1000 K× magnification. (B). The strains treated with 4 mg/mL PLGA-NPs loaded with MC and CAPE were designated the treatment group at 1000 K× magnification. (C). The strains treated with 4 mg/mL PLGA-TNPs loaded with MC and CAPE were designated the treatment group at 10.75 K× magnification.
Agronomy 11 01159 g007aAgronomy 11 01159 g007b
Figure 8. Effect of PLGA-TNPs loaded with MC and CAPE on the virulence-related gene expression of R. solanacearum. Those treatments were designated the PLGA-TNP, PLGA-NP, API, and Triton groups, respectively. The Triton group was used as the blank group. The gene expression levels of egl, phcA, phcB, pilT, polA-238, and pehC were obtained in the R. solanacearum treated with bacteriostatic agents for 24 h. The letters in the columns indicate the differences between the different treatment groups, the same letter indicates that the difference is not significant (p > 0.05), and completely different letters indicate a significant difference (p < 0.05).
Agronomy 11 01159 g008
Table 1. EC50 at different dosage forms of antibacterial agents against R. solanacearum and the quality of MC and CAPE required.
Antibacterial AgentsEC50 (mg/mL)
MC0.310
CAPE0.165
API0.248
PLGA-TNP0.021
PLGA-NP0.285
Table 2. The theoretical half-life of antibody nanoparticles loaded with MC and CAPE and theoretical time required to reach a 90% release rate.
pH of BufferHalf-Life (Days)Time to Reach 90% Release Rate (Days)
6.54.846.0
7.43.615.2
Note: The drug dosage was 1 mg/mL.
Publisher’s Note: MDPI stays neutral with regard to jurisdictional claims in published maps and institutional affiliations.

