Article

Monitoring of Natural Occurrence and Severity of Leaf and Glume Blotch Diseases of Winter Wheat and Winter Triticale Incited by Necrotrophic Fungi Parastagonospora spp. and Zymoseptoria tritici

by
Sławomir Franciszek Bartosiak
1,*,
Edward Arseniuk
1,
Magdalena Szechyńska-Hebda
1,2 and
Ewa Bartosiak
1
1
Plant Breeding and Acclimatization Institute–National Research Institute, 05-870 Błonie, Poland
2
The Franciszek Górski Institute of Plant Physiology, Polish Academy of Sciences, 30-239 Kraków, Poland
*
Author to whom correspondence should be addressed.
Agronomy 2021, 11(5), 967; https://doi.org/10.3390/agronomy11050967
Submission received: 31 March 2021 / Revised: 4 May 2021 / Accepted: 6 May 2021 / Published: 13 May 2021
(This article belongs to the Section Pest and Disease Management)

Abstract

:
The occurrence of necrotrophic winter wheat and triticale pathogens in eight geographical regions of Poland was studied between 2015 and 2020. Over a period of six years, the incidence of the following pathogens was monitored: Parastagonospora nodorum, Parastagonospora avenae and Zymoseptoria tritici. The significant effect of meteorological factors on the incidence of pathogens was determined. The relationship between late-season and early-season factors associated with temperature and precipitation on the severity of diseases incited by the pathogens was statistically significant. Statistical models estimating the natural occurrence and severity of diseases caused by the pathogens were developed with the random forest (RF) algorithm based on 10,412 cases of the diseases. The data were randomly divided into training and test datasets and the accuracy of models was determined by the root mean squared error (RMSE) and Pearson correlation coefficient (r). The most promising model was developed for Z. tritici with the following test metrics: RMSE = 57.5 and r = 0.862. The model can be used to link disease severity to weather and predict low severity years and high severity years. Over the period of 2015–2020, the most significant winter wheat pathogen showed to be Z. tritici, while on winter triticale P. nodorum incited disease symptoms on the largest number of leaves. The occurrence of P. avenae f. sp. triticea on winter wheat and winter triticale was the least frequent and on average was below the economic threshold.

1. Introduction

Phaeosphaeria nodorum (E. Müller) (anamorph: Parastagonospora nodorum (Berk.), Phaeosphaeria avenaria (G. F. Weber) (anamorph: Parastagonospora avenae (A. B. Frank) and Mycosphaerella graminicola (Fuckel) (anamorph: Zymoseptoria tritici (Desm.) cause fungal necrotrophic diseases of wheat and triticale [1,2,3,4,5,6,7,8,9,10]. These pathogens are considered the most devastating pathogens in the small-grain cereals [3,11,12,13]. Diseases caused by Parastagonospora spp. and Zymoseptoria tritici can lead to significant quantitative and qualitative grain yield losses in wheat (Triticum aestivum L.) and triticale (× Triticosecale Wittm.) production [14,15,16]. Parastagonospora nodorum blotch (syn. Stagonospora nodorum blotch, SNB) can cause grain yield losses in wheat up to 31% [11], while Zymoseptoria tritici blotch (syn. Septoria tritici blotch, STB) can cause yield losses up to as much as 50% [16]. Głazek et al. [17] found a significant impact of P. nodorum on winter wheat yield reduction in mid-southern Poland, while Arseniuk et al. [18] reported a negative impact of Parastagonospora spp./Z. tritici complex on the quality and quantity of wheat and triticale grain. P. avenae f. sp. triticea is considered as a minor pathogen of wheat [3,19,20] and triticale [3]. Two special forms of P. avenae were identified. First, one, the P. avenae f. sp. triticea (NCBI: txid54790: Parastagonospora avenae f. sp. tritici) causes the most severe symptoms in the wheat. The second one, the P. avenae f. sp. avenaria (NCBI: txid215456: Parastagonospora avenae f. sp. avenae), is dangerous to oats [10]. In later studies, McDonald et al. [21], determined genetic differences in groups of isolates of Phaeosphaeria spp. and 5 phylogenetically distinct clades were identified: Pat1, Pat3, Pat4, Pat5 and Pat6. In Poland, P. avenaria f.sp. triticea isolates Pat2 and some homothallic P. avenaria f.sp. triticea isolates Pat1 occurred on foxtail barley (Hordeum jubatum) [6]. Some oat, wheat, rye and triticale isolates from Poland also appeared to be Pat1 [5]. In their study, the isolates of the Pat5 clade were avirulent to susceptible wheat cultivars [21].
The occurrence of P. nodorum, Z. tritici and P. avenae depends on multiple factors, among which climatic conditions are of key importance [22,23,24,25,26,27,28]. The occurrence of Z. tritici was prevalent in warm geographical regions. The impact of Z. tritici increased in Europe under moderate climatic conditions due to the introduction of semidwarf wheat cultivars and the intensification of their cultivation [3,10]. In the early 1980s, P. nodorum was considered as the most common necrotrophic pathogen in Europe; however, in the late 1980s, a number of countries in Europe noted a decrease in the occurrence of P. nodorum [10,12,13]. Researchers considered the putative factors of this phenomenon such as contamination by airborne sulphur compounds [12,29], climatic changes [26], resistance breeding [30] and the adaptation of Z. tritici to fungicides [31]. Arseniuk et al. [18], in their research conducted in Poland, determined that P. nodorum was the most frequently isolated pathogen causing P. nodorum contamination of triticale and wheat, while the occurrence of Z. tritici was not observed on triticale. Research on the monitoring of wheat Parastagonospora spp. and Z. tritici pathogens in Latvia suggests that Z. tritici was the most frequently observed pathogen among the Septoria pathogens [32]. P. nodorum is a common pathogen in Australia [20,33], Canada [28], Norway [13] and in the state of North Carolina in the United States of America and is often met in continental climate of Mid-Eastern and Eastern Europe [19,27,30,34,35]. The majority of researchers, however, consider Z. tritici as the most devastating among the Septoria pathogens in the humid climate and this climatic region includes Northern France and Germany, as well as the UK [27,36].
Rainfalls during the vegetative season [22,23,24,25] and especially the early-season rainfalls [3] are among the most important factors which affect the occurrence of P. nodorum. In Poland, according to Głazek et al. [17], rainfalls in June have the most significant impact on disease development. Other studies showed that the release of Phaeosphaeria spp. ascospores was favoured by temperatures above 0 °C, rainfalls above 1 mm and by high relative atmospheric humidity, whereas temperature above 25 °C hampered the release of ascospores [22]. The release of P. nodorum conidial spores was impaired by temperatures below 5 °C. According to Arseniuk et al. [22], a drop in the number of ascospores in the air was observed during prolonged drought and periods of high temperatures in June and July, while the maximum release of ascospores was observed in September. Heavy rainfalls during the prolonged periods of drought did not have any impact on the amount of ascospore deposition [22].
Worldwide occurrence of Z. tritici showed to be influenced by the following factors: geographical latitude, geographical longitude and early-season parameters concerning rainfalls [3,37,38]. According to Leath et al. [3], the occurrence of P. nodorum was positively correlated with geographical latitude, while a negative correlation of the occurrence with geographical latitude was observed for Z. tritici. Studies conducted in 1994–2004 in Germany showed an increase of P. nodorum blotch latent period with increasing geographical latitude [38]. In studies by Henze et al. [38], the impact of meteorological factors on the outbreak of P. nodorum was determined. An average temperature of 13.62 ± 2.3 °C, leaf wetness at 92.39 ± 4.15% and precipitation of 0.04 ± 0.1 mm per day were observed 20 days before epidemic outbreaks [38]. Surprisingly, influential factors can be the non-growing season precipitation and the application of phosphorus fertiliser. Additionally, reduced or minimum tillage was shown to be negatively associated with disease levels, an effect opposite to that reported for other pathosystems under long-term controlled conditions. [3]. Nitrogen fertilisation increased the severity of Z. tritici [39].
Recently, the attention of researchers and a number of studies was focused on Z. tritici, while studies on Parastagonospora spp. were slightly less frequent [10,12]. However, changes in the severity and occurrence of fungal necrotrophic pathogens are highly dynamic [3,10,12,40] in time and space, namely that they are strongly time-dependent and vary greatly among different regions. Therefore, the monitoring of the Parastagonospora spp./Zymoseptoria tritici disease complex is crucial for prioritising and optimising breeding programs and for the support of cereal production systems. The research in this paper was based on data collected from 2015 to 2020 and it provides important insight into the natural occurrence of Parastagonospora spp. and Zymoseptoria tritici, which are the most common necrotrophic pathogens of wheat and triticale worldwide and especially in Poland [9,18,22]. The purpose of the research was to determine the spatial and temporal distribution of Parastagonospora spp. and Z. tritici under natural conditions on wheat and triticale along with the occurrence risk assessment of the pathogens and the analyses of host-pathogen interactions.

2. Materials and Methods

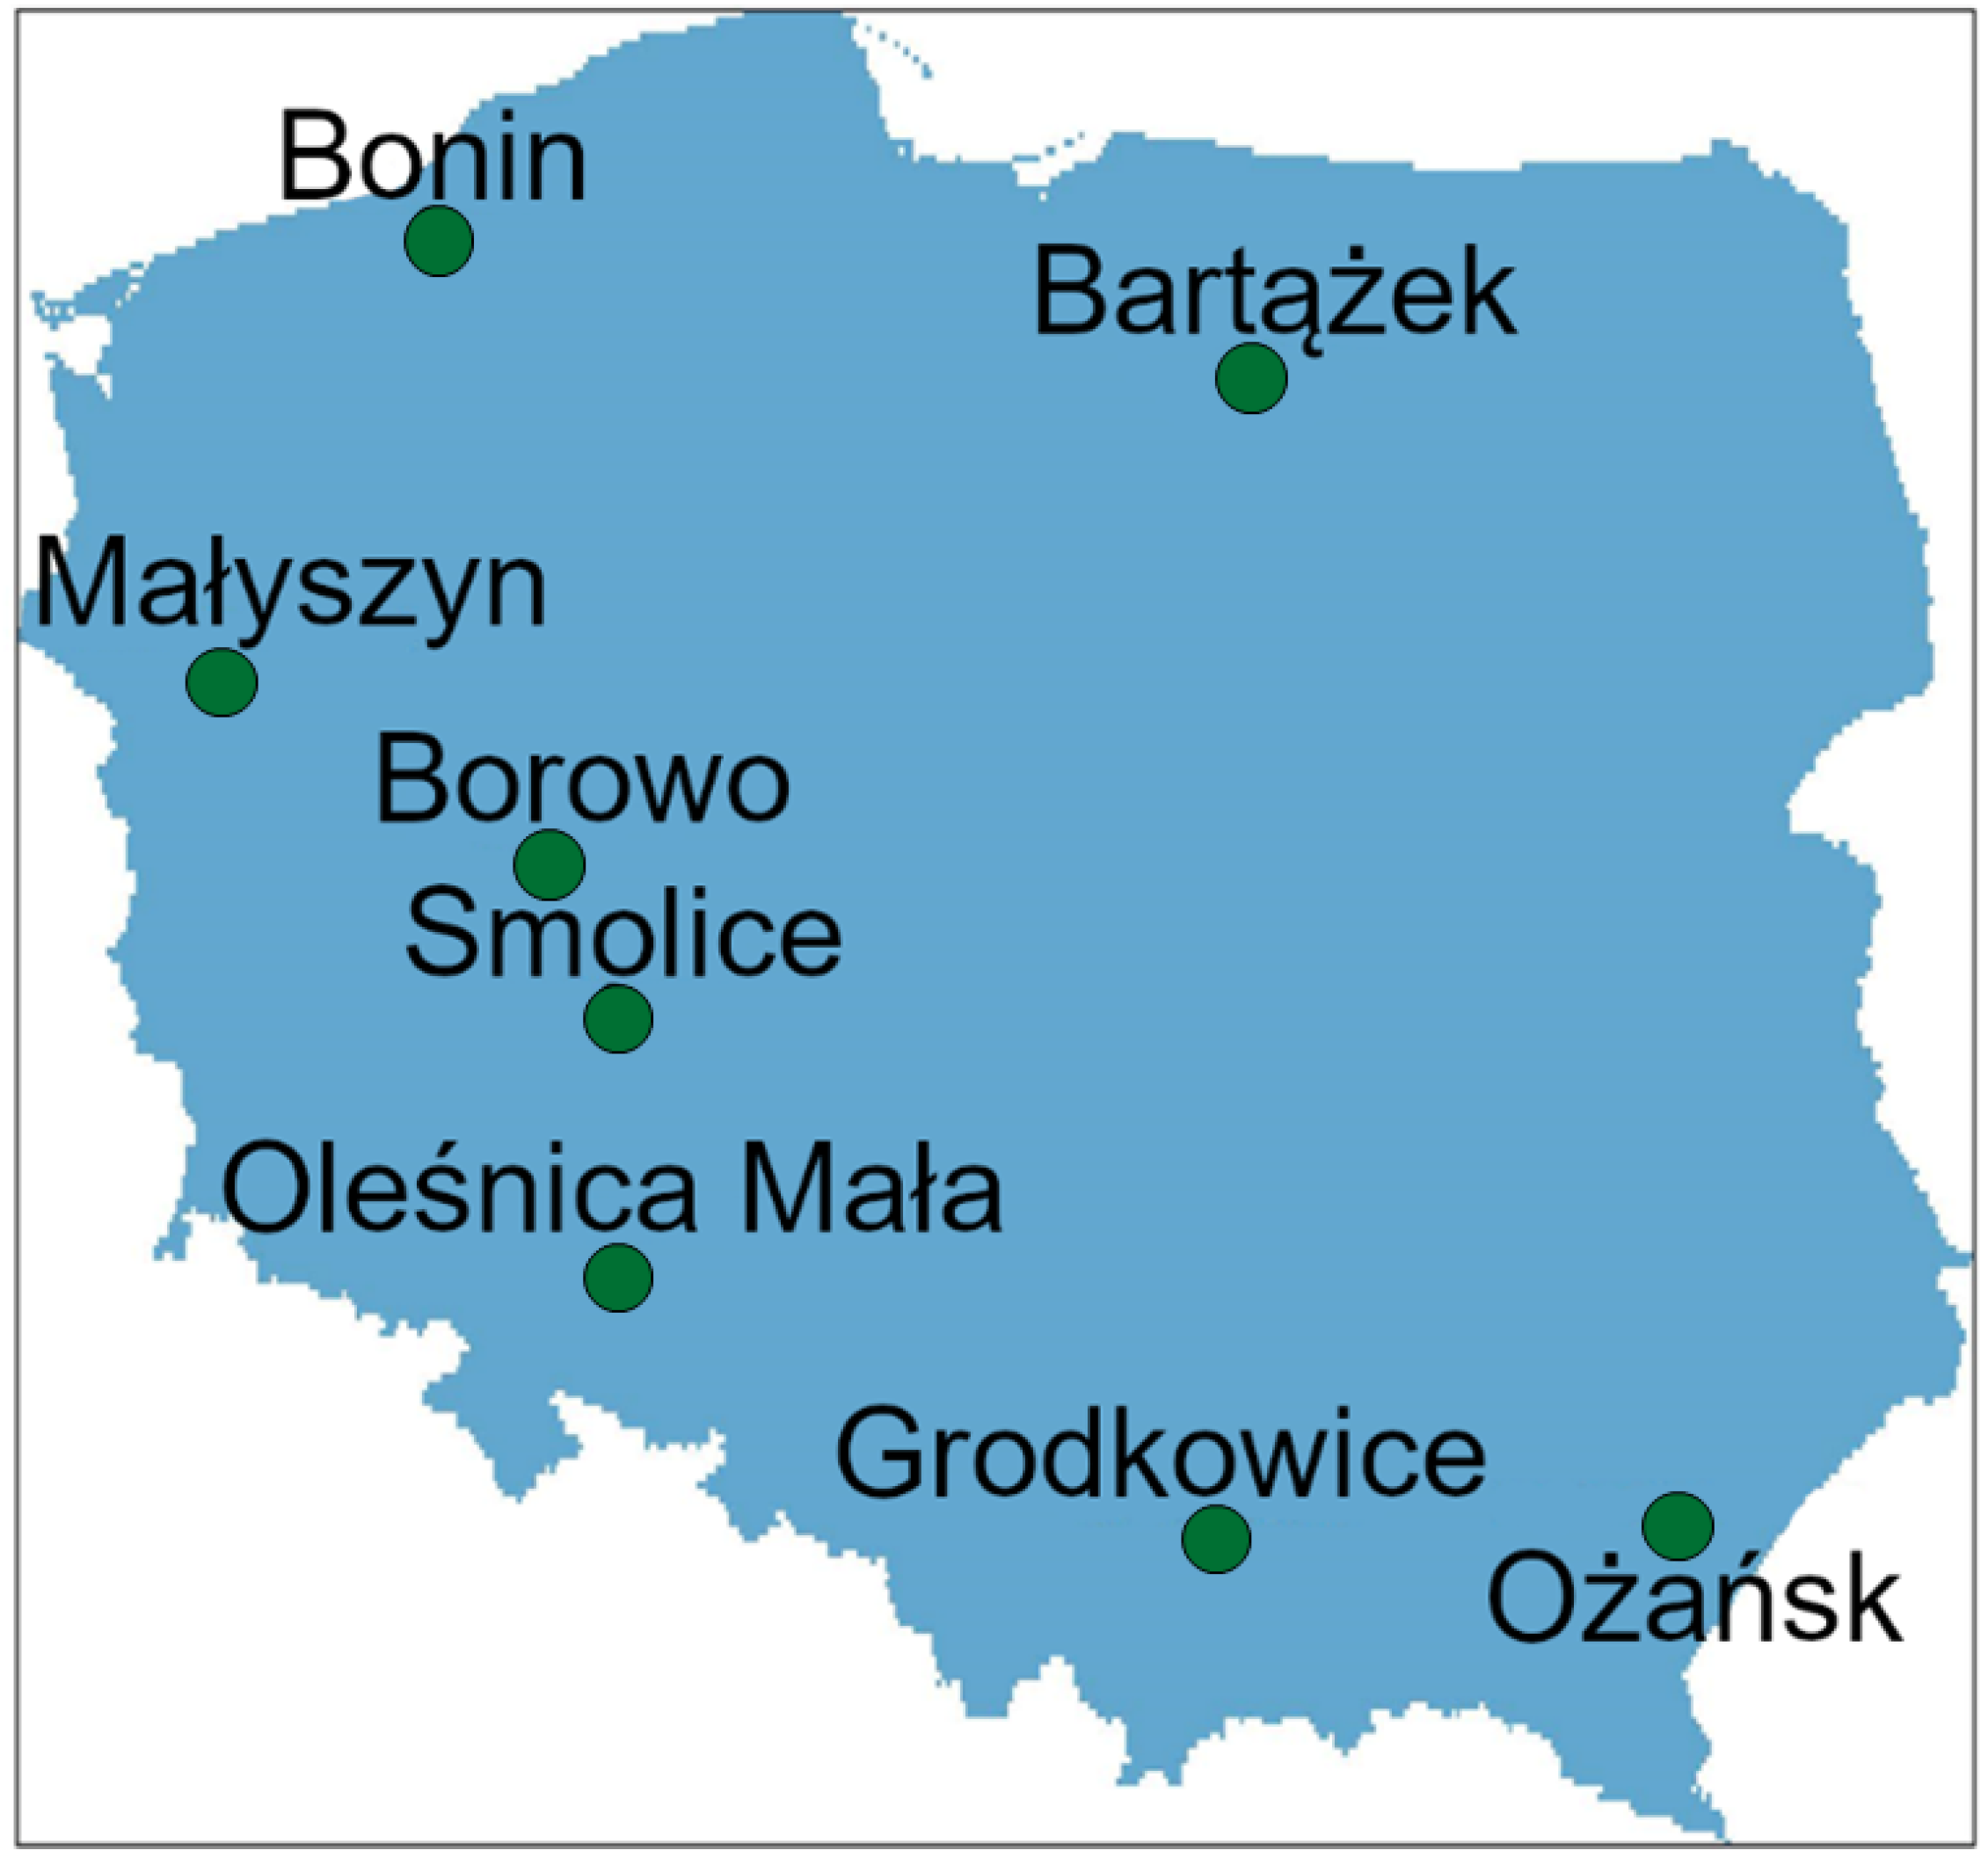
2.1. Plant Materials and Field Experiments

The studies were conducted in 8 experimental locations in Poland (Figure 1, Bartążek: 20.482843° E 53.71086° N, Bonin: 16.2477° E 54.153613° N, Borowo: 16.790134° E 52.114888° N, Grodkowice: 20.27488° E 49.970209° N, Małyszyn: 15.174479° E 52.744631° N, Oleśnica Mała: 17.260902° E 50.847896° N, Smolice: 17.183084° E 51.691261° N and Ożańsk: 15.17448° E 52.74463° N) during the years 2015–2020. The experiments consisted of 10 winter wheat varieties: Sailor, Medalistka, Bogatka, Fidelius, Florus, Muszelka, Hondia, Natula, Ostroga and Tonacja; and 10 winter triticale varieties: Elpaso, Cyrkon, Algoso, Baltiko, Borwo, Atletico, Alekto, Salto, Pigmej and Fredro, all of which are from the National Register of Cultivars. The cultivars varied in their susceptibility to P. nodorum and to Z. tritici. The seeds were sown in experimental plots (1 × 10 m) with a randomised block design. Standard tillage was applied and the plants were not chemically protected (cultivated without the application of fungicides). After the preliminary visual assessment, potentially affected leaves and heads were collected from the experimental plots for detailed analysis of symptoms of fungal diseases. From each experimental plot, flag leaves, leaves below the flag leaves and diseased heads were collected. From each plot, 35 leaves were collected. In total, 350 leaf samples and additionally infected heads from 10 plots × 8 locations × 2 species, i.e., winter wheat and winter triticale, were analysed. The collected samples were stored until analysis in a refrigerator at 2–3 °C.

2.2. Mycological Analyses

Lesions on leaves and glumes were inspected using a binocular microscope (25×). Mature pycnidia were transferred onto an agar solid medium using a sterile preparation needle. The pycnidia were squashed and cirrhi was spread evenly over the surface of the agar medium using a preparation needle. Conidia were measured using a digital microscope camera and relevant software (Delta Optical DLT-Cam PRO 5MP). Individual spores were isolated using an inverted microscope (Nikon Eclipse TS 100) and micromanipulator. A handmade preparation needle (⌀ ≈ 2 µm), was made of a glass rod for the purpose of spore isolations.
Isolates were identified to the species level based on the following taxonomic criteria: visual assessment of disease symptoms, morphology and dimension of conidia, morphology of colony on artificial solid media (in vitro). Individual conidia had a dimension of 25–45 × 3–4 µm for P. avenae f. sp. triticea, 15–32 × 2–4 µm for P. nodorum [1] and 35–98 × 1–3 µm for Z. tritici [41]. Individual conidia were transferred onto the solid media: V8 juice-PDA was used for the growth of Parastagonospora spp. [42] and YMDA was used for the growth of Z. tritici [43]. The morphology of each colony was assessed and spores were isolated from the mature fruiting bodies that had formed on the solid media. P. nodorum is a heterothallic fungus [33] and on the solid media it formed only conidial spores, while homothallic P. avenae f. sp. triticea [44] formed asci with ascospores. Isolates of P. nodorum and P. avenae f. sp. triticea, sporulated abundantly under near-ultraviolet (NUV) light at 22 °C. The number of diseased leaves was calculated and deposited in the developed Excel database.

2.3. Statistical Analysis

The t-student test for independent samples was used to determine significant differences in pathogen occurrence. Measurement and observation data sets from the ground weather stations collected in the database of the Institute of Meteorology and Water Management–NRI (IMGW-PIB) were used for further statistical analysis (Data S1, Tables S1–S3). For each month, two different types of meteorological factors were selected: those showing the statistical effect of the influence of average air temperatures in given months and those describing the impact of extreme temperatures over the course of a short time (usually 1 day). The set of selected parameters include absolute maximum temperature (°C), average maximum temperature (°C), absolute minimum temperature (°C), average minimum temperature (°C), monthly average temperature (°C), minimum near-surface temperature (°C), monthly sum of rainfall (mm), maximum daily rainfall (mm), first day of maximum rainfall, number of days with snow cover, number of days with rainfall and number of days with snowfall. The interpolation of data for each experimental location was estimated using the Python programming language and the following modules: scikit-learn [45], pandas [46], geopandas, numpy [47] and matplotlib. The training data set was expanded by rotation matrix of two-dimensional geographical coordinates in Euclidean space using the following equation [48]:
[ x y ] = [ c o s θ s i n θ s i n θ c o s θ ] [ x y ]
where
x—longitude, y—latitude, x’—rotated longitude, y’—rotated latitude, θ —rotation angle.
The root mean squared error (RMSE) performance metric was used for the interpolation model selection and hyperparameters tuning. The final interpolation was estimated on the full dataset. The KNeighborsRegressor scikit-learn method was used for the features of regression models [45]. Performance of the models was estimated using 5-fold cross-validation and negative mean squared error (MSE) as a cost function. The following hyperparameters were used for regularisation of the models: n_neighbors–number of neighbours, metric–Euclidean distance and weights–inverse distance; nearer neighbours have a greater impact (weight) than those neighbours which are further away [45].
Pearson correlation coefficients between the meteorological factors and the sum of diseased leaves by each pathogen in the experimental locations in the years 2015–2020 were calculated. The samples were collected at the end of June or the beginning of July; therefore, the Pearson correlation coefficients were calculated between the meteorological factors collected from July to December as early-season factors and the diseased leaf numbers collected in the next year. The months from January to June were considered as late-season meteorological factors and the Pearson correlation coefficients were calculated between the occurrence of the monitored pathogens and the meteorological factors in the same year. Statistically significant (with a p-value less than 0.05) meteorological factors were used as predictor variables of the models estimating the number of diseased leaves for each pathogen. The data were divided into training (80%) and test (20%) subsets. The RandomForestRegressor scikit-learn method and the cross-validation technique with negative MSE as a cost function for the performance of model optimisation were used [45]. The following hyperparameters were tuned in the Random Forest (RF) regression models using 5-fold cross-validation: n_estimators–number of trees in the forest, max_features–number of features to consider the best split and max depth–the maximum depth of the tree [45]. The maps for visualisation of the model estimating the number of winter wheat and winter triticale leaves affected by pathogens for each year were created using three RF models.

3. Results and Discussion

3.1. Occurrence of Pathogens on Wheat and Triticale

In the study conducted over 2015–2020, the most frequent average occurrence of Z. tritici on the studied plant species genotypes was that observed on the winter wheat (Figure S4). The difference in the average number of isolations of Z. tritici was statistically significant between P. nodorum (p < 0.001) and P. avenae f. sp. triticea (p < 0.001) (Table 1). The occurrence of P. avenae f. sp. triticea was 86 times less frequent than that of Z. tritici, while P. nodorum was isolated 10 times less often in comparison to Z. tritici. The occurrence of P. avenae f. sp. triticea on winter wheat was 8 times less frequent than that of P. nodorum.
The most frequently isolated pathogen from winter triticale was P. nodorum (Figure 2B). The difference between the average number of P. nodorum isolations from winter triticale in experimental plots over the period of 2015–2020 and the average number of isolations of P. avenae f. sp. triticea and Z. tritici was statistically significant (p < 0.001). However, the difference in the average occurrence of P. avenae f. sp. triticea (Figure 2C) and Z. tritici (Figure 2A) was not statistically significant. The mean number of isolations of P. avenae f. sp. triticea was 6.8 and the average number of isolations of Z. tritici was 7.7. According to previous studies, P. nodorum and P. avenae f. sp. triticea were considered as less host-specific pathogens, while the Z. tritici host specificity to wheat was more distinct [2,7,49]. In the research conducted by Arseniuk et al. [2], Tian et al. [7] and Sapkota et al. [50], wheat was determined as the primary Z. tritici host, while the occurrence of Z. tritici on triticale was not observed at all or it was observed only very rarely [4].
Lesions with mature pycnidia of P. nodorum on glumes of winter wheat and winter triticale were observed very rarely, i.e., in 53 cases on winter wheat and in 28 cases on winter triticale. Surprisingly, in 12 cases, Z. tritici symptoms were identified on winter wheat heads (cvs. Fidelius, Bogatka, Ostroga, Muszelka), while they were observed only one time on winter triticale cv. Cyrkon. The latter phenomenon is not common, although it was already reported by Jones and Cooke [50]. There were also symptoms of P. avenae f. sp. triticea on heads of triticale cultivars Baltiko and Atletico (n = 5 isolations). The most probable explanation for the rare appearance of P. nodorum on glumes could be attributed to breeding for resistance [30] or climatic changes [26]. In the studies by Arseniuk et al. [51], necrotrophic effector genes were identified in populations of breeding lines and cultivars; 57% of triticale lines and 30% of winter wheat cultivars were susceptible to the SnTox3 necrotrophic effector. The other effectors, namely SnTox1, SnTox5 and SnToxA had a negligible effect on the susceptibility of lines at seedling and adult plant growth stages. In the present study, the average isolation number of P. nodorum from winter triticale amounted to 25 times, while on winter wheat it amounted to 16 times only (Table 1).
In the present study the fact that Z. tritici occurs on wheat glumes is surprising although in other studies employing more sensitive monitoring methods the pathogen was detected even without clearly visible lesions on spikes [7]. In studies of Tian et al. [7] the antigen amount of Z. tritici was measured using BA-ELISA test, there was a greater quantity of antigen in F-1 than in flag leaves, while minimal amounts of antigen were detected in glumes and none in grains. Similar results were achieved in the research of Shaw et al. [29] employing real-time PCR method on a large number of samples of M. graminicola, no DNA was detected in grain samples of wheat. However, the natural formation of mature pycnidia of Z. tritici on spikes was never observed. However, it is worth noting that in presently reported research, this phenomenon manifests on very susceptible varieties (cvs. Fidelius, Bogatka, Ostroga, Muszelka). It is suspected that this is due to the fact that the disease progresses very quickly on leaves and on spikes it is produced when glumes are still green and quite soft, what facilitates the penetration of tissue by the pathogen. The pathogen then has time to develop symptoms on glumes. P. nodorum can easily cause lesions on both, glumes and leaves under favourable conditions. In research reported by Shaw et al. [29], a strong correlation between Phaeosphaeria nodorum abundance on wheat grains and leaves was found (r = 0.7). The pathogen was more detrimental on the ears in comparison to leaves, because spores can easily be transferred with seed and no airborne spores would be necessary to begin a disease outbreak in consecutive years [29]. There also is always a high risk of grain quality deterioration in the following years.

3.2. Correlation between Meteorological Factors and Occurrence of Pathogens

Pearson correlation coefficients were calculated between meteorological factors and the occurrence of the studied pathogens. In total, 137 meteorological factors were considered during 12 months (Table 2, Table 3, Table 4 and Table 5, Tables S1–S3).

3.2.1. Correlation between Meteorological Factors and Occurrence of P. nodorum

The occurrence of P. nodorum was significantly correlated with 19 factors presented in Table 2 (p < 0.05). The meteorological factors associated with rainfall and temperature were of particular significance for the occurrence of this pathogen.
The majority of the factors were associated with rainfalls in winter, spring and autumn. The most significant winter and autumn months in regard to rainfall were February and November. A positive linear correlation between P. nodorum occurrence and the number of days with rainfall (r = 0.247) or the first day of maximum rainfall (r = 0.225) were observed in February, while the monthly sum of rainfall was a significant factor (r = 0.281) in November. The most significant late-spring months in regard to rainfall were May and June. A positive correlation was determined for the first day of maximum rainfall (r = 0.328) in May, while in June, both the daily maximum sum of rainfall and the monthly sum of rainfall were significantly correlated to the occurrence of P. nodorum (r = 0.290 and r = 0.287, respectively). Numerous studies confirmed the relationship between the frequency of rainfalls and successful infection by P. nodorum, leading to the development of disease symptoms of glume and leaf blotch [3,22,23]. According to Głazek et al. [17], rainfalls in June were of key importance in Poland. It was also shown that the liberation of ascospores was favoured by air temperature above 0°C, rainfall greater than 1 mm and high relative humidity [18,22].
The majority of factors correlating with the natural occurrence of P. nodorum were associated with air temperature in the period from July to December. This phenomenon may suggest that a primary inoculum emergence and/or infection process in the early spring or late autumn period can influence P. nodorum severity. The study by Arseniuk et al. [22] on the release of Phaeosphaeria spp. ascospores suggests that ascospores are present in the air from March to January, while the largest number of ascospores was observed from in the fall August to November. In fall ascospores are formed on plant debris. The latter authors reported that temperatures above 25 °C and below 0 °C had a negative impact on the release of ascospores [18,22]. A similar phenomenon was observed in the present study. In June and October, a negative correlation between the incidence of P. nodorum and the average maximum temperature (r = −0.267 and r = −0.253) as well as that of the monthly average temperature (r = −0.276 and r = −0.272) was calculated. Additionally, in October, the absolute maximum temperature significantly influenced the occurrence of P. nodorum (r = −0.431). It can be concluded that the impact of high air temperatures on the severity of P. nodorum may be caused by unsuitable conditions for the release of ascospores and thus it causes the inhibition of the early infection process. The average maximum temperature range in 2015–2020 was between 21 °C and 24 °C at different locations. According to Arseniuk et al. [22], this temperature range is close to the threshold for the release of ascospores. Furthermore, the present study showed that low temperatures in December had a negative impact on P. nodorum severity, in the result of which a positive relationship between (maximum, r = 0.276; minimum, r = 0.285; and monthly r = 0.297) average temperatures and P. nodorum occurrence was observed (as higher temperature as higher P. nodorum occurrence).
Furthermore, a positive linear correlation between the occurrence of P. nodorum and the number of days with snowfall in November was determined. Arseniuk et al. [22] also reported the impact of rainfalls frequency and prolonged dew periods on the release of ascospores to be positive and statistically significant. Green plant parts need to be wet for disease development and for this of importance is prolonged wetness of infected plant organs. Therefore, frequency of low but frequent rainfalls about 1mm is required [22]. However, even prolonged rainfall does not change much in development of disease into epidemics. Presently reported results suggest the importance of primary inoculum and early infection processes on the natural occurrence and disease severity incited by P. nodorum. In contrast, the number of days with snowfall in December had a negative impact on the incidence of P. nodorum, while for January, the correlation of the number of days with snow cover was positive. This relationship may suggest that in months with a wide variation of air temperature from negative to positive and the snow cover can facilitate the overwintering of P. nodorum (Table 2).
Statistically significant differences were not observed between the occurrence of P. nodorum and geographical longitude, but there was a significant positive linear relationship between geographical latitude and the number of P. nodorum lesions. Similar results were achieved in other studies, although they were conducted in different geographical regions [52,53]. There is a spatial pattern of P. nodorum distribution even on a local scale; in Europe, the occurrence of P. nodorum is more frequent in northern latitudes, e.g., in Norway [13]. The range of P. nodorum hosts is relatively wide. According to other studies, P. nodorum can infect wheat, triticale, durum wheat and other small-grain cereals, including barley, rye and grasses [2,7,49]. In the present study, no statistically significant differences were found between the number of wheat and triticale leaves affected by P. nodorum.

3.2.2. Correlation between Meteorological Factors and Occurrence of P. avenae f. sp. triticea

The occurrence of P. avenae f.sp. triticea was relatively rare and on average was harmful below the economic threshold for grain production of winter wheat and winter triticale in the studied experimental locations and generally in Poland. Despite the low severity of the pathogen under natural conditions, statistically significant factors associated with its occurrence were found (Table 3). In total, 29 factors (p < 0.05) were identified, of which 11 were of statistical significance during the period from January to June and 17 during the period from July to December.
The majority of factors associated with rainfall (8) positively correlated with the occurrence of P. avenae f.sp. triticea in February (r from 0.208 to 0.293), March (r = 0.264) and May (r = 0.296) (Table 3). The opposite effect (i.e., a negative correlation) was observed in August (r from −0.298 to −0.325), September (r = −0.235) and October (r = −0.209).
A large number of meteorological factors describing the temperature have affected the occurrence of P. avenae f.sp. triticea. The majority of factors positively correlated with the occurrence of this pathogen in the period from December to September (from r = 0.205 in case of the absolute maximum temperature in June, to r = 0.368 for the average maximum temperature in August). The only exception was a negative correlation between the occurrence of P. avenae f.sp. triticea and the minimum near-surface temperature (r = −0.268). In a fashion similar to parameters related to rainfall, all meteorological factors associated with temperature had a negative correlation coefficient with the occurrence of P. avenae f. sp. triticea in October.
The number of days with snowfall and low temperatures in December had a negative impact on the severity of P. avenae f.sp. triticea. Similar results were obtained for the occurrence of P. nodorum; therefore, meteorological factors from June to December may be associated with the P. avenaria release mechanism of ascospores.
The specialization of P. avenae f.sp. triticea to wheat and triticale was less distinct than in the case of the P. nodorum pathogen. Considering P. avenae f. sp. triticea, the pathogen had a slightly greater affinity for triticale (r = 0.307). According to Arseniuk et al. [47], triticale was slightly more susceptible to necrotrophic effectors. P. avenae f. sp. triticea can have the SnToxA necrotrophic effector gene [21,54], which causes an elevated susceptibility of triticale to P. avenae f. sp. triticea.

3.2.3. Correlation between Meteorological Factors and Occurrence of Z. tritici

Z. tritici fungus was the most common pathogen of winter wheat among the studied pathogens (Figure 2). In the period of 2015–2020, the disease caused by this pathogen occurred in high severity in all experimental locations. Latitude and longitude did not have an impact on the occurrence of Z. tritici in the studied areas. However, when considering worldwide distribution, geographical latitude had an impact on the incidence of Z. tritici [3]. In other studies, geographical coordinates were useful features in the modelling of the onset of necrotrophic fungal diseases [52,53,55]. In the present study, 12 meteorological factors correlated linearly with the Z. tritici incidence, seven significant factors were identified from January to June and 5 factors were associated with the early-season months from July through December (Table 4).
The monthly sum of rainfall in February was the only factor associated with precipitation that was positively correlated with the occurrence of Z. tritici (r = 0.206), while the number of days with rainfall in August was the only factor associated with precipitation that was negatively correlated with occurrence of the pathogen (r = −0.332).
The monthly average temperature in January (r = −0.208) as well as the average minimum temperature in January and October (r = −0.218 and r = −0.201) had a negative impact on the occurrence of Z. tritici. On the contrary, a positive correlation of Z. tritici occurrence with air temperature factors such as the average maximum temperature, the monthly average temperature and the average minimum temperature was observed in February, June, August and September (r values from 0.232 to 0.262). In the studies of Chaloner et al. [55], temperature- and wetness-dependent germination was one of the most important factors associated with the growth rate of Z. tritici mycelium. The results of these studies were used to build a Z. tritici risk assessment model [55]. Model predictions varied from year to year; the accuracy of the model was measured by correlation coefficient and ranged from r = 0.065 to r = 0.623 [55]. It appears that air temperature is the factor explaining the large proportion of variance in the severity of Z. tritici. In other studies [24,56], temperature and rainfall appeared to be significant factors in the modelling of Z. tritici severity. Researchers emphasise the role of meteorological factors in winter, spring and summer on primary inoculum release. Although the climate in Poland differs from the climate in England, a qualitative model using winter temperature (January/February) efficiently predicted the presence or absence of Z. tritici to about the first node of detectable growth stage. For sites above the disease threshold, a quantitative model predicted the severity of Z. tritici using rainfall during stem elongation. According to studies by Mirzwa-Mróz et al. [23], the pseudothecia of M. graminicola emerged from June to January under favourable climatic conditions. Henze et al. [38] in Germany, in 1995–2003, determined the impact of humidity, rainfall and temperature on outbreaks of Z. tritici.
It was determined that the most significant factor of the occurrence of Z. tritici was host specialisation. Winter wheat was the most susceptible (r = −0.710) among the studied host genotypes. Z. tritici symptoms on several winter triticale cultivars, i.e., Fredro and Cyrkon, were relatively rare, but winter triticale is no longer fully resistant to Z. tritici. According to a majority of the studies, Z. tritici occurrence on triticale was not observed [2,7,9,49]. Currently, Z. tritici poses no threat to winter triticale production, but the observations in this study suggest a gradual increase in the susceptibility of triticale to this necrotrophic fungus in Poland.

3.2.4. Summary of Correlation between Meteorological Factors and Occurrence of Pathogens

The early-season, as well as the late-season meteorological factors had an impact on the natural occurrence of the studied pathogens under the climatic conditions of Poland. The rainfall and air temperature factors explained the large proportion of the variability of the incidence of P. nodorum, Z. tritici and P. avenae f. sp. triticea. P. nodorum and P. avenae are close relatives [54]. Both pathogens have similar life cycles and origin; therefore, eight common meteorological factors were identified among those pathogens, while there were no common significant meteorological factors between P. nodorum and Z. tritici. The number of days with snowfall correlated negatively with Parastagonospora spp. occurrence in cold winter months with low minimum temperatures. Snow cover was beneficial in overwintering of P. nodorum putatively due to the thermal isolation of infected plant debris from extremely low temperatures. The occurrence of Z. tritici was mainly associated with temperature factors, while the incidence of Parastagonospora spp. was related to both temperature and rainfall factors. Especially in the late-season period, rainfall factors were significant for P. nodorum and P. avenae f. sp. triticea severity. Historically, the occurrence of P. nodroum was related to high precipitation during the growing season (R2 = 0.43), while Z. tritici was particularly common in warm and relatively dry regions, especially with low nongrowing season precipitation (R2 = −0.58) [3]. Monitoring of Z. tritici employing sensitive molecular methods in the UK showed short peaks in Z. tritici occurrence from 1840 to 1860 and from 1980 to 2000 [29]. Before 1980, Z. tritici was not common in the UK and therefore probably also not common in Europe, especially in regions on a similar geographical latitude.
The early-season factors might be related to the release of primary inoculum, to ascospores dispersed by wind- and to an early infection process facilitating the progression of the monitored diseases. The negative correlation of rainfall factors in the period after harvest (number of days with rainfall in July and August) suggests that a dry environment is necessary to increase the severity of P. avenae f. sp. triticea and Z. tritici in the following seasons, while the positive correlation of factors related to rainfall might facilitate the rain-splash dispersal of pycnidiospores usually from low to upper and also neighbouring leaves what progresses development of the diseases. The negative correlation of factors related to temperature in October for all the studied pathogens was proven. In general, higher temperatures in the winter period enhanced the range of occurrence of Parastagonospora spp., while the opposite effect was observed in the autumn. On the other hand, lower temperatures in January and higher temperatures in February, June, August and September increased the severity of Z. tritici.

3.3. The Pathogen Occurrence Models

The random forest (RF) algorithm was used to calculate multiple regression models based on the meteorological factors as a predictor variables for the studied pathogens’ occurrence predictions. The numbers of isolations of P. nodorum, P. avenae f. sp. triticea and Z. tritici were used as the explanatory variables. The Z. tritici occurrence model had the best performance metrics among the developed predictive models in this study. The test RMSE for this model equalled 60.2 and the test correlation coefficient of the predictions and empiric data equalled 0.84 (Table 5). In the studies by Chaloner et al. [55], the predictive models were developed based on data collected over the period of 2002–2016. The performance of the models was measured by Pearson correlation coefficient. The correlation between model outputs and the observed Z. tritici disease ranged from r = 0.065 to r = 0.623, in dependence upon the growing season. Pietravalle et al. [24] developed a model for the prediction of Zymoseptoria tritici on winter wheat (cv. Riband) using multiple linear regression. Nine best-weather functions related to rainfalls, leaf wetness (%) and minimum temperature were used as explanatory variables in all years and for all experimental sites. The model achieved a performance of R2 = 0.77 of predicted Z. tritici severity at the mid-milk growth stage of wheat. Both findings in this research and the literature suggest that statistical modelling is a useful tool in Z. tritici risk assessment.
In the present studies, the models for P. nodorum and P. avenae f. sp. triticea occurrence had lower performance and the error of the predictions was relatively high in comparison to the Z. tritici model, although there is a possibility to implement these models in the risk estimations of the severity of diseases caused by the Parastagonospora species. The dataset collected over the years 2015–2020 was relatively small (n = 96); therefore, improvement of the models’ performance was observed after expanding the training dataset from 80% to 90% (Table 5). The models based on a 90% training dataset had a lower test RMSE, while the r increased. The relatively large differences in P. nodorum and P. avenae f. sp. triticea models between test and train metrics may indicate a high generalisation error and an overfitting of the models to the training dataset, causing the lower models’ performance based on unseen data, although further regularisation of the models decreased both the train and the test performance metrics (RMSE), creating an even worse generalisation. Additional training data might increase the efficiency of the developed models. There is also a possibility that meteorological factors were not sufficient to explain the variability in the occurrence of Parastagonospora spp. pathogens. In other studies, researchers determined, inter alia, the impact of wheat residues from the previous crop in a crop-rotation field and of the tillage type on the occurrence of P. nodorum [52,53,56]. These factors might be crucial determinants for the natural occurrence of Parastagonospora spp., since the latter pathogens appeared to be relatively less severe in comparison to Z. tritici. The P. nodorum classification models developed by Mehra et al. [53] in 2017, using the RF algorithm based on the aforementioned factors explained 79% of total data variability. In the study, they examined machine learning algorithms in predicting the pre-planting risk of pathogen in wheat. Preplanting factors tested as potential predictor variables were cultivar resistance, latitude, longitude, previous crop, seeding rate, seed treatment, tillage type and wheat residue. Ten years earlier Shaw et al. [29] developed multiple regression models based on meteorological factors for Phaeosphaeria nodorum and Mycosphaerella graminicola DNA abundance in leaf and stem, which explained, respectively, 55% and 47% of the variance. To date, there were not presented statistical models based on prediction data for Parastagonospora spp. and Z. tritici occurrence on wheat and triticale in Poland. The developed models take into account not only wheat as a host, but also triticale which is of key importance fodder cereal species for animal feeding.
The models for the occurrence of Z. tritici, P. nodorum and P. avenae f. sp. triticea on winter wheat were visualised based on the full dataset (Figure 3 and Figures S1–S4). The most promising model based on the occurrence of Z. tritici on winter wheat is presented in Figure 3. The performance of this model could increase slightly given that the full dataset was used in the final grid estimations, but after this operation there was no possibility to measure the test performance metrics. The model is sufficient for the spatial distribution analysis of the occurrence of Z. tritici in the period of 2015–2020. Extrapolation beyond the above indicated research period should be possible, with good accuracy for several years. Further improvement of the performance of the model requires future data collecting and model updating. The Z. tritici model shows variability in the occurrence of Z. tritici from year to year and in the spatial distribution of the pathogen in growing seasons. The climatic conditions in the 2015 growing season were the least favourable to the occurrence of Z. tritici. The predictive models for P. nodorum and P. avenae are sufficient for an assessment of disease risks the pathogens cause, which, at present, is unknown from season to season.

4. Conclusions

Climate change, is known to be regionally and seasonally specific. It has become one of the foremost factors which affects agricultural production and food security. Most simulations of climate change impacts on agricultural production focus on potential yields, despite actual yields being largely affected by climate-dependent pathogens. The purpose of this research was to make estimations and the impact of climatic factors on the occurrence and severity under natural infections by the pathogens causing leaf and glume blotch diseases of winter wheat and winter triticale in Poland. The complexity of climatic factors, which affect to a large extent the plant–pathogen–climate interactions. These were highlighted over 2015–2020 by the correlation of a bunch of climatic factors measured in different geographical regions of Poland with the natural occurrence of the pathogens. Z. tritici also flourishes in more humid climatic regions and this climatic region includes Northern France and Germany, as well as the UK [27,36]. The most frequent occurrence, measured by the number of isolations of P. nodorum and P. avenae f.sp. triticea from naturally diseased plants was found to be on winter triticale, while Z. tritici on winter wheat. The rainfalls positively correlated with P. nodorum, P. avenae f.sp. triticea and Z. tritici, mainly in February. The rainfall differently influenced the occurrence of monitored pathogens in the following months: in May and June the rainfalls affected the occurrence of P. nodorum; slightly earlier, i.e., in March and May the rainfalls affected P. avenae f.sp. triticea, while the period from March to June had the least effect on occurrence of Z. tritici. In contrast, a negative correlation in autumn was not observed for P. nodorum; P. avenae f.sp. triticea was influenced negatively by rainfalls from August to October and rainfalls affect Z. tritici in August. A positive correlation between temperature and occurrence of P. nodorum was found in May and December. whereas for P. avenae f. sp. triticea and Z. tritici mainly in June and August. Additionally, P. nodorum and P. avenae occurrence was negatively correlated with temperature in October and in January with Z. tritici incidence. Geographical latitude was important only in the case of P. nodorum occurrence. The use of our model was a way to address these complexities and go beyond qualitative analyses. The developed models were implemented to visualise a spatial distribution of diseases severity in the 2015–2020 period. The developed models can also be used in an occurrence risk assessment of P. nodorum, P. avenae f. sp. triticea and Z. tritici on winter wheat and winter triticale. Supplementary data are important in the training the models and influence the models’ sensitivity and specificity. Therefore, the development of the models and their performance improvement can be achieved through the introduction of data set related to the occurrence of the pathogens in the upcoming years. There is also a possibility to combine models for all described pathogens to predict overall disease burden by addition of models outputs since all observations were made on the same scale (35 leaves × plot−1 = 350 leaves × 100 m−2) facilitating disease risk assessment.

Supplementary Materials

The following are available online at https://www.mdpi.com/article/10.3390/agronomy11050967/s1, Data S1: Meteorological data; Table S1: Linear correlation coefficient between the Parastagosnopora nodorum occurrence and meteorological factors; Table S2: Linear correlation coefficient between the Parastagosnopora avenae occurrence and meteorological factors; Table S3: Linear correlation coefficient between the Zymoseptoria tritici occurrence and meteorological factors; Figure S1: Visualisation of the model estimating number of winter wheat and winter triticale leaves affected by P. nodorum; Figure S2: Visualisation of the model estimating number of winter wheat leaves (A) and winter triticale leaves (B) affected by P. avenae; Figure S3: Visualisation of the model estimating number of winter triticale leaves affected by Z. tritici; Figure S4: Z. tritici pycnidia on glumes of winter wheat cultivar Fidelius (A, B, C, D), conidia (E) and pycnidia on a leaf (F).

Author Contributions

Conceptualization, S.F.B. and E.A.; methodology, S.F.B. and E.A.; software, S.F.B.; formal analysis, S.F.B., E.A., M.S.-H.; investigation, S.F.B., E.B.; resources, E.A.; data curation, S.F.B., E.B.; writing—original draft preparation, S.F.B.; writing—review and editing, S.F.B., M.S.-H., E.A., E.B.; visualization, S.F.B.; supervision, S.F.B., M.S.-H., E.A.; project administration, S.F.B., E.A.; funding acquisition, E.A. All authors have read and agreed to the published version of the manuscript.

Funding

This research was funded by the Ministry of Agriculture and Rural Development within the Multiannual Programme 2015–2020 no 3.3.

Institutional Review Board Statement

Not applicable.

Informed Consent Statement

Not applicable.

Data Availability Statement

Acknowledgments

Acknowledgments to the Institute of Meteorology and Water Management–National Research Institute for providing meteorological data.

Conflicts of Interest

The authors declare no conflict of interest.

References

  1. Johnson, T. A form of leptosphaeria avenaria on wheat in canada. Can. J. Res. 1947, 25, 259–270. [Google Scholar] [CrossRef]
  2. Arseniuk, E.; Fried, P.M.; Winzeler, H.; Czembor, H.J. Comparison of resistance of triticale, wheat and spelt to Septoria nodorum blotch at the seedling and adult plant stages. Euphytica 1991, 55, 43–48. [Google Scholar] [CrossRef]
  3. Leath, S.; Scharen, A.L.; Lund, R.E.; Dietz-Holmes, M.E. Factors associated with global occurrences of Septoria nodorum blotch and Septoria tritici blotch of wheat. Plant Dis. 1993, 77, 1266–1270. [Google Scholar] [CrossRef]
  4. El Harrak, A.; Mergoum, M.; Saadaoui, E. Major Foliar Diseases of Triticale in Morocco; CIMMYT: Mexico City, Mexico, 1997; pp. 150–156. [Google Scholar]
  5. Małkus, A.; Reszka, E.; Chang, C.J.; Arseniuk, E.; Linda Chang, P.L.; Ueng, P.P. Sequence diversity of β-tubulin (tubA) gene in Phaeosphaeria nodorum and P. avenaria. FEMS Microbiol. Lett. 2005, 249, 49–56. [Google Scholar] [CrossRef] [Green Version]
  6. Reszka, E.; Chung, K.R.; Tekauz, A.; Malkus, A.; Arseniuk, E.; Krupinsky, J.M.; Tsang, H.; Ueng, P.P. Presence of β-glucosidase (bgl1) gene in Phaeosphaeria nodorum and Phaeosphaeria avenaria f.sp. triticea. Can. J. Bot. 2005, 83, 1001–1014. [Google Scholar] [CrossRef]
  7. Tian, S.; Wolf, G.A.; Weinert, J. Accurate Assessment of Wheat and Triticale Cultivar Resistance to Septoria tritici and Stagonospora nodorum Infection by Biotin/Avidin ELISA. Plant Dis. 2005, 89, 1229–1234. [Google Scholar] [CrossRef] [PubMed] [Green Version]
  8. Quaedvlieg, W.; Verkley, G.; Shin, H.-D.; Barreto, R.; Alfenas, A.; Swart, W.; Groenewald, J.; Crous, P. Sizing up Septoria. Stud. Mycol. 2013, 75, 307–390. [Google Scholar] [CrossRef] [Green Version]
  9. Gilon, M.; Arseniuk, E. Natural field infections of wheat and triticale by fungi from the complex of fungi Stagonospora nodorum/Septoria tritici under climatic conditions of Poland. Commun. Agric. Appl. Biol. Sci. 2014, 79, 216–227. [Google Scholar] [PubMed]
  10. Downie, R.C.; Lin, M.; Corsi, B.; Ficke, A.; Lillemo, M.; Oliver, R.P.; Phan, H.; Tan, K.-C.; Cockram, J. Septoria nodorum blotch of wheat: Disease management and resistance breeding in the face of shifting disease dynamics and a changing environment. Phytopathology 2020. [Google Scholar] [CrossRef]
  11. Bhathal, J.; Loughman, R.; Speijers, J. Yield Reduction in Wheat in Relation to Leaf Disease From Yellow (tan) Spot and Septoria Nodorum Blotch. Eur. J. Plant Pathol. 2003, 109, 435–443. [Google Scholar] [CrossRef]
  12. Bearchell, S.J.; Fraaije, B.A.; Shaw, M.W.; Fitt, B.D.L. Wheat archive links long-term fungal pathogen population dynamics to air pollution. Proc. Natl. Acad. Sci. USA 2005, 102, 5438–5442. [Google Scholar] [CrossRef] [Green Version]
  13. Lin, M.; Ficke, A.; Cockram, J.; Lillemo, M. Genetic Structure of the Norwegian Parastagonospora nodorum Population. Front. Microbiol. 2020, 11, 1280. [Google Scholar] [CrossRef]
  14. Hekuran, V.; Belul, G.; Foto, K.; Halit, S.; Thanas, R. The Relationship between diseases index of septoria leaf blotch, leaf rust and yield losses in bread wheat cultivar in Albania. J. Environ. Sci. Eng. B 2012, 1, 957–965. [Google Scholar]
  15. Witkowska, K.; Śmiałowski, T.; Witkowski, E. Dependence of the Yield of Winter Wheat Sows on the Degree of Infection by Stagonospora Nodorum and Puccinia Triticina under Different Field Conditions. J. Bull. Plant Breed. Acclim. Inst. 2011, 262, 47–57. [Google Scholar]
  16. Torriani, S.F.; Melichar, J.P.; Mills, C.; Pain, N.; Sierotzki, H.; Courbot, M. Zymoseptoria tritici: A major threat to wheat production, integrated approaches to control. Fungal Genet. Biol. 2015, 79, 8–12. [Google Scholar] [CrossRef] [PubMed]
  17. Głazek, M.; Krzyzińska, B.; Maczyńska, A. Occurrence of Stagonospora nodorum glume blotch of wheat in the region of middle-southern Poland. Acta Agrobot. 2012, 58, 23–28. [Google Scholar] [CrossRef] [Green Version]
  18. Arseniuk, E.; Gilon, M. Monitoring of pathogenicity changes in populations of necrotrophic pathogens of cereals (Stagonospora spp.; Septoria tritici). Monographs and Scientific Papers. In Improving the Plant for Sustainable Agro-Ecosystems, High-Quality Food and Non-Food Plant Production; Monographs and Scientific Papers IHAR-PIB: Błonie, Poland, 2014; Volume 48, pp. 272–278. [Google Scholar]
  19. Cowger, C.; Silva-Rojas, H.V. Frequency of Phaeosphaeria nodorum, the Sexual Stage of Stagonospora nodorum, on Winter Wheat in North Carolina. Phytopathology 2006, 96, 860–866. [Google Scholar] [CrossRef] [PubMed] [Green Version]
  20. Solomon, P.S.; Lowe, R.G.T.; Tan, K.-C.; Waters, O.D.C.; Oliver, R.P. Stagonospora nodorum: Cause of stagonospora nodorum blotch of wheat. Mol. Plant Pathol. 2006, 7, 147–156. [Google Scholar] [CrossRef] [PubMed]
  21. McDonald, M.C.; Razavi, M.; Friesen, T.L.; Brunner, P.C.; McDonald, B.A. Phylogenetic and population genetic analyses of Phaeosphaeria nodorum and its close relatives indicate cryptic species and an origin in the Fertile Crescent. Fungal Genet. Biol. 2012, 49, 882–895. [Google Scholar] [CrossRef]
  22. Arseniuk, E.; Góral, T.; Scharen, A.L. Seasonal Patterns of Spore Dispersal of Phaeosphaeria spp. and Stagonospora spp. Plant Dis. 1998, 82, 187–194. [Google Scholar] [CrossRef] [Green Version]
  23. Mirzwa-Mróz, E.; Tvaruzek, L.; Zamorski Cz Nowicki, B. Research on the development of Mycosphaerella graminicola (Fuckel) Schroeter telemorph on wheat leaves from Poland and Czech Republic. Acta Agrobot. 2005, 58, 59–65. [Google Scholar] [CrossRef] [Green Version]
  24. Pietravalle, S.; Shaw, M.W.; Parker, S.R.; Bosch, F.V.D. Modeling of Relationships Between Weather and Septoria tritici Epidemics on Winter Wheat: A Critical Approach. Phytopathology 2003, 93, 1329–1339. [Google Scholar] [CrossRef] [PubMed] [Green Version]
  25. Mahtour, A.; El Jarroudi, M.; Delobbe, L.; Hoffmann, L.; Maraite, H.; Tychon, B. Site-Specific Septoria Leaf Blotch Risk Assessment in Winter Wheat Using Weather-Radar Rainfall Estimates. Plant Dis. 2011, 95, 384–393. [Google Scholar] [CrossRef] [PubMed]
  26. West, J.S.; Townsend, J.A.; Stevens, M.; Fitt, B.D. Comparative biology of different plant pathogens to estimate effects of climate change on crop diseases in European. J. Plant Pathol. 2012, 133, 315–331. [Google Scholar] [CrossRef] [Green Version]
  27. Fones, H.; Gurr, S. The impact of Septoria tritici Blotch disease on wheat: An EU perspective. Fungal Genet. Biol. 2015, 79, 3–7. [Google Scholar] [CrossRef] [Green Version]
  28. Fernandez, M.R.; Stevenson, C.F.; Hodge, K.; Dokken-Bouchard, F.; Pearse, P.G.; Waelchli, F.; Brown, A.; Peluola, C. Assessing Effects of Climatic Change, Region and Agronomic Practices on Leaf Spotting of Bread and Durum Wheat in the Western Canadian Prairies, from 2001 to 2012. Agron. J. 2016, 108, 1180–1195. [Google Scholar] [CrossRef] [Green Version]
  29. Shaw, M.W.; Bearchell, S.J.; Fitt BD, L.; Fraaije, B.A. Long-term relationships between environment and abundance in wheat of Phaeosphaeria nodorum and Mycosphaerella graminicola. New Phytol. Found. 2007, 77, 229–238. [Google Scholar] [CrossRef] [PubMed]
  30. Crook, A.D.; Friesen, T.L.; Liu, Z.H.; Ojiambo, P.S.; Cowger, C. Novel Necrotrophic Effectors from Stagonospora nodorum and Corresponding Host Sensitivities in Winter Wheat Germplasm in the Southeastern United States. Phytopathology 2012, 102, 498–505. [Google Scholar] [CrossRef] [Green Version]
  31. Heick, T.M.; Fejer, A.; Nistrup Jørgensen, J.L. Resistance of wheat pathogen Zymoseptoria tritici to DMI and QoI fungicides in the Nordic-Baltic region-a status. Eur. J. Plant Pathol. 2017, 149, 669–682. [Google Scholar] [CrossRef]
  32. Semaskiene, R.; Ronis, A. Leaf spotting diseases in winter and spring wheat and resistance to fungicides in Mycosphaerella graminicola. In Proceedings of the 8th International Symposium on Mycosphaerella and Stagonospora Diseases of Cereals, Mexico City, Mexico, 19 September 2011. [Google Scholar]
  33. Solomon, P.; Parker, K.; Loughman, R.; Oliver, R. Both Mating types of Phaeosphaeria (anamorph Stagonospora) nodorum are Present in Western Australia. Eur. J. Plant Pathol. 2004, 110, 763–766. [Google Scholar] [CrossRef]
  34. Shaner, G.; Buechley, C. Epidemiology of leaf blotch of soft red winter wheat caused by Septoria tritici and Stagonospora nodorum. Plant Dis. 1995, 19, 928–938. [Google Scholar] [CrossRef]
  35. Shaw, M.W.; Royle, D.J. Factors determining the severity of epidemics of Mycosphaerella graminicola (Septoria tritici) on winter wheat in the UK. Plant Pathol. 1993, 42, 882–899. [Google Scholar] [CrossRef]
  36. Bouma, E. Development of comparable agro-climatic zones for the international exchange of data on the efficacy and crop safety of plant protection products. Bulletin OEPP/EPPO 2005, 35, 233–238. [Google Scholar] [CrossRef]
  37. Hailemariam, B.N.; Kidane, Y.G.; Ayalew, A. Epidemiological factors of Septoria triticim blotch (Zymoseptoria tritici) in durum wheat (Triticum turgidum) in the highlands of Wollo, Ethiopia. Ecol. Process. 2020, 9, 61. [Google Scholar] [CrossRef]
  38. Henze, M.; Beyer, M.; Klink, H.; Verreet, J.-A. Characterizing Meteorological Scenarios Favorable for Septoria tritici Infections in Wheat and Estimation of Latent Periods. Plant Dis. 2007, 91, 1445–1449. [Google Scholar] [CrossRef] [PubMed] [Green Version]
  39. McDonald, B.A.; Mundt, C.C. How Knowledge of Pathogen Population Biology Informs Management of Septoria tritici Blotch. Phytopathology 2016, 106, 948–955. [Google Scholar] [CrossRef] [PubMed] [Green Version]
  40. Shearer, B.L.; Zadoks, J.C. Observations on the host range of an isolate of Septoria nodorum from wheat. Eur. J. Plant Pathol. 1972, 78, 153–159. [Google Scholar] [CrossRef]
  41. Eyal, Z.; Scharen, A.L.; Prescott, J.M.; van Ginkel, M. The Septoria Diseases of Wheat: Concepts and Methods of Disease Management; CIMMYT: Mexico City, Mexico, 1987. [Google Scholar]
  42. John, E.; Lopez-Ruiz, F.; Rybak, K.; Mousley, C.J.; Oliver, R.P.; Tan, K.-C. Dissecting the role of histidine kinase and HOG1 mitogen-activated protein kinase signalling in stress tolerance and pathogenicity of Parastagonospora nodorum on wheat. Microbiology 2016, 162, 1023–1036. [Google Scholar] [CrossRef]
  43. Saidi, A.; Eslahi, M.R.; Safaie, N. Efficiency of Septoria tritici sporulation on different culture media. Trakia J. Sci. 2012, 3, 15–18. [Google Scholar]
  44. Czembor, P.C.; Arseniuk, E. Study of genetic variability among monopycnidial and monopycnidiospore isolates derived from single pycnidia of Stagonospora ssp. and Septoria tritici with the use of RAPD-PCR, MP-PCR and rep-PCR Techniques. J. Phytopathol. 2008, 147, 539–546. [Google Scholar] [CrossRef]
  45. Pedregosa, F.; Varoquaux, G.; Gramfort, A.V.M.; Thirion, B.; Grisel, O.; Blondel, M.; Prettenhofer, P.; Weiss, R.; Dubourg, V.; Vanderplas, J.; et al. Scikit-learn: Machine Learning in Python. J. Mach. Learn. Res. 2011, 12, 2825–2830. [Google Scholar]
  46. The Pandas Development Team. Pandas-Dev/Pandas: Pandas; Zenodo: Geneva, Switzerland, 2020. [Google Scholar] [CrossRef]
  47. Harris, C.R.; Millman, K.J.; Van Der Walt, S.J.; Gommers, R.; Virtanen, P.; Cournapeau, D.; Wieser, E.; Taylor, J.; Berg, S.; Smith, N.J.; et al. Array programming with NumPy. Nature 2020, 585, 357–362. [Google Scholar] [CrossRef]
  48. Deisenroth, M.P.; Faisal, A.A.; Ong, C.S. Mathematics for Machine Learning; Cambridge University Press: Cambridge, UK, 2020. [Google Scholar]
  49. Sapkota, R.; Knorr, K.; Jørgensen, L.N.; O’Hanlon, K.A.; Nicolaisen, M. Host genotype is an important determinant of the cereal phyllosphere mycobiome. New Phytol. 2015, 207, 1134–1144. [Google Scholar] [CrossRef]
  50. Jones, D.G.; Cooke, B. The Epidemiology of Septoria tritici and S. nodorum: I. A tentative key for assessing Septoria tritici infection on wheat heads. Trans. Br. Mycol. Soc. 1969, 53, 39–46. [Google Scholar] [CrossRef]
  51. Arseniuk, E.; Walczewski, J.; Ochodzki, P. Protein toxins of Parastagonospora nodorum and their relation to pathogenicity and resistance of triticale and wheat to leaf and glume blotch. Commun. Agric. Appl. Biol. Sci. 2019, 286, 71–73. [Google Scholar]
  52. Mehra, L.K.; Cowger, C.; Gross, K.; Ojiambo, P.S. Predicting Pre-planting Risk of Stagonospora nodorum blotch in Winter Wheat Using Machine Learning Models. Front. Plant Sci. 2016, 7, 390. [Google Scholar] [CrossRef] [PubMed]
  53. Mehra, L.K.; Cowger, C.; Ojiambo, P.S. A Model for Predicting Onset of Stagonospora nodorum Blotch in Winter Wheat Based on Preplanting and Weather Factors. Phytopathology 2017, 107, 635–644. [Google Scholar] [CrossRef] [PubMed] [Green Version]
  54. Ghaderi, F.; Sharifnabi, B.; Javan-Nikkhah, M.; Brunner, P.C.; McDonald, B.A. SnToxA, SNTox1 and SnTox3 originated in Parastagonospora nodorum in the Fertile Crescent. Plant Pathol. 2020, 69, 1482–1491. [Google Scholar] [CrossRef]
  55. Chaloner, T.M.; Fones, H.; Varma, N.V.; Bebber, D.P.; Gurr, S.J. A new mechanistic model of weather-dependent Septoria tritici blotch disease risk. Philos. Trans. B 2019, 374, 20180266. [Google Scholar] [CrossRef] [Green Version]
  56. Eyal, Z. The Septoria tritici and Stagonospora Nodorum Blotch Diseases of Wheat. Eur. J. Plant Pathol. 1999, 105, 629–641. [Google Scholar] [CrossRef]
Figure 1. Locations of experimental fields in Poland.
Agronomy 11 00967 g001
Figure 2. Number of Z. tritici (A), P. nodorum (B) and P. avenae (C) isolations (occurrence) from the leaves of winter wheat and triticale in experimental sites (Bartążek, Bonin, Borowo, Grodkowice: Małyszyn, Oleśnica Mała, Smolice and Ożańsk) over the period of 2015–2020.
Agronomy 11 00967 g002
Figure 3. Visualisation of the model estimating number of winter wheat leaves affected by Z. tritici. Grey scale bar of the occurrence: 350 leaves = 100%, 300 leaves = 86%, 240 leaves = 69%, 180 leaves = 51%, 120 leaves = 34%, 60 leaves = 17% in the 2015–2020 period.
Agronomy 11 00967 g003
Table 1. T-student test for the number of isolations calculated between pairs of different necrotrophic pathogens. Three combinations of pathogen pairs are presented for both, winter wheat and winter triticale.
Grouping VariablePathogen PairsMean Number of Isolationstdfp
Winter wheatZ. triticiP. nodorum159.316.0−8.8940.000
Z. triticiP. avenae159.31.8−10.2940.000
P. nodorumP. avenae16.01.82.9940.005
Winter triticaleZ. triticiP. nodorum7.825.23.2940.002
Z. triticiP. avenae7.86.8−0.5940.647
P. nodorumP. avenae25.26.83.4940.001
Table 2. Pearson correlation coefficients (r) and p-values (n = 96) for P. nodorum occurrence and meteorological factors in the following months of the year.
MonthMeteorological Factorsrp
1Number of days with snow cover0.2020.049
2Number of days with rainfall0.2470.015
2First day of maximum rainfall0.2250.028
5Absolute maximum temperature0.2320.023
5First day of maximum rainfall0.3280.001
6Daily maximum sum of rainfall0.2900.004
6Monthly sum of rainfall0.2870.005
7 *Average maximum temperature−0.2670.009
7 *Monthly average temperature−0.2760.006
10 *Absolute maximum temperature−0.4310.000
10 *Average maximum temperature−0.2530.013
10 *Monthly average temperature−0.2720.007
11 *Number of days with snowfall0.2570.012
11 *Monthly sum of rainfall0.2810.006
12 *Number of days with snowfall−0.2470.015
12 *Average maximum temperature0.2760.006
12 *Monthly average temperature0.2970.003
12 *Average minimum temperature0.2850.005
-Geographical latitude0.2920.004
* early-season factors.
Table 3. Pearson correlation coefficients (r) and p-values (n = 96) for P. avenae occurrence and meteorological factors in the following months of the year.
MonthMeteorological Factorsrp
2Absolute minimum temperature0.2140.036
2Number of days with rainfall0.2920.004
2Daily maximum sum of rainfall0.2080.042
2Monthly sum of rainfall0.2490.015
2Minimum near-surface temperature0.2870.005
2First day of maximum rainfall0.2930.004
2Monthly average temperature0.2270.026
2Average minimum temperature0.2410.018
3Number of days with rainfall0.2640.009
5First day of maximum rainfall0.2960.003
6Absolute maximum temperature0.2050.045
7 *Minimum near-surface temperature−0.2680.008
8 *Absolute maximum temperature0.3410.001
8 *Number of days with rainfall−0.3250.001
8 *Monthly sum of rainfall−0.2980.003
8 *Average maximum temperature0.3680.000
8 *Monthly average temperature0.3500.000
8 *Average minimum temperature0.2670.009
9 *Absolute maximum temperature0.3420.001
9 *Daily maximum sum of rainfall−0.2350.021
10 *Monthly sum of rainfall−0.2090.041
10 *Monthly average temperature−0.2580.011
10 *Average minimum temperature−0.2790.006
12 *Absolute maximum temperature0.2640.009
12 *Number of days with snowfall−0.2940.004
12 *Average maximum temperature0.3990.000
12 *Monthly average temperature0.3940.000
12 *Average minimum temperature0.3620.000
-Plant species (host)0.3070.002
* early-season factors.
Table 4. Pearson correlation coefficients (r) and p-values (n = 96) for Z. tritici occurrence and meteorological factors in the following months of the year.
MonthMeteorological Factorsrp
1Monthly average temperature−0.2080.042
1Average minimum temperature−0.2180.033
2Absolute maximum temperature0.2430.017
2Monthly sum of rainfall0.2060.044
6Average maximum temperature0.2370.020
6Monthly average temperature0.2620.010
6Average minimum temperature0.2520.013
8 *Number of days with rainfall−0.3320.001
8 *Average maximum temperature0.2520.013
8 *Monthly average temperature0.2320.023
9 *Absolute maximum temperature0.2500.014
10 *Average minimum temperature−0.2010.049
-Plant species (host)−0.7100.000
* early-season factors.
Table 5. Results of cross-validation for the models: RMSE and Pearson correlation coefficients (r). Results are the average values of 100 models.
Size of Training DatasetModel for PathogenRMSEr
Train DatasetTest DatasetTrain DatasetTest Dataset
80%P. nodorum16.8630.430.880.58
P. avenae2.947.200.950.50
Z. tritici44.1160.190.910.84
90%P. nodorum17.2327.620.870.62
P. avenae2.826.860.950.53
Z. tritici47.7153.800.890.88
Data was randomly divided and models trained 100 times due to the small dataset and the risk of large random error.
Publisher’s Note: MDPI stays neutral with regard to jurisdictional claims in published maps and institutional affiliations.

