Article

Effect of Nitrogen Fertilisation and Inoculation with Bradyrhizobium japonicum on the Fatty Acid Profile of Soybean (Glycine max (L.) Merrill) Seeds

by
Ewa Szpunar-Krok
1,*,
Anna Wondołowska-Grabowska
2,
Dorota Bobrecka-Jamro
1,
Marta Jańczak-Pieniążek
1,
Andrzej Kotecki
2 and
Marcin Kozak
2
1
Department of Crop Production, University of Rzeszow, Zelwerowicza 4 St., 35-601 Rzeszów, Poland
2
Institute of Agroecology and Plant Production, Wrocław University of Environmental and Life Sciences, Grunwaldzki Sq. 24A, 50-363 Wrocław, Poland
*
Author to whom correspondence should be addressed.
Agronomy 2021, 11(5), 941; https://doi.org/10.3390/agronomy11050941
Submission received: 1 April 2021 / Revised: 27 April 2021 / Accepted: 4 May 2021 / Published: 10 May 2021

Abstract

:
Soybean is a valuable protein and oilseed crop ranked among the most significant of the major crops. Field experiments were carried out in 2016–2019 in South-East Poland. The influence of soybean cultivars (Aldana, Annushka), nitrogen fertilizer (0, 30, 60 kg∙ha−1 N) and inoculation with B. japonicum (control, HiStick® Soy, Nitragina) on the content of fatty acids (FA) in soybean seeds was investigated in a three-factorial experiment. This study confirms the genetic determinants of fatty acid composition in soybean seeds and their differential accumulation levels for C16:0, C16:1, C18:1n9, C18:2, C18:3, and C20:0 as well saturated (SFA), monounsaturated (MUFA), and polyunsaturated (PUFA) fatty acids. Increasing the rate from 30 to 60 kg ha−1 N did not produce the expected changes, suggesting the use of only a “starter” rate of 30 kg ha−1 N. Inoculation of soybean seeds with a strain of Bradyrhizobium japonicum (HiStick® Soy, BASF, Littlehampton, UK and Nitragina, Institute of Soil Science and Plant Cultivation–State Research Institute, Puławy, Poland) is recommended as it will cause a decrease in SFA and C16:0 acid levels. This is considered nutritionally beneficial as its contribution to total fatty acids determines the hypercholesterolemic index, and it is the third most accumulated fatty acid in soybean seeds. The interaction of cultivars and inoculation formulation on fatty acid content of soybean seeds was demonstrated. An increase in the value of C16:0 content resulted in a decrease in the accumulation of C18:1, C18:2, and C18:3 acids. The content of each decreased by almost one unit for every 1% increase in C16:0 content. The dominant effect of weather conditions on the FA profile and C18:2n6/C18:3n3 ratio was demonstrated. This suggests a need for further evaluation of the genetic progress of soybean cultivars with respect to fatty acid composition and content under varying habitat conditions.

1. Introduction

Legume seeds, along with cereals, are one of the most widely consumed foods worldwide [1] and are a valuable source of plant protein especially in impoverished areas where meat, fish and dairy are economically unavailable [2]. They are traditionally included in the diets of various cultures, appropriate in a variety of diets and widely studied for their effects on human health [3,4,5,6]. Soybean (Glycine max (L.) Merrill) is one of the major oil and protein crops grown worldwide. In terms of acreage under cultivation, it is the world’s fourth crop after wheat, corn, and rice. In 2019, world soybean production was 333.6 million tons; Brazil was the largest producer with a production of 114.27 million tons and a cultivated area of 35.9 million hectares, followed by the USA with a production of 96.8 million tons and an area of 30.4 million hectares [7].
Soybean seeds contain about 380–450 g kg−1 protein with favorable amino acid composition, 180–230 g kg−1 oil, and 200–260 g kg−1 carbohydrates. In addition, they are a source of many valuable compounds such as fiber, lecithin, mineral salts (P, K, Ca, Mn, Zn, Fe, and B), vitamins (A, B, and D) and antioxidants [8,9,10,11,12,13,14]. Soy protein contains essential amino acids important in human and animal nutrition [15,16,17], in proportions similar to the reference protein (chicken eggs) [18]. In addition, soybean seeds are a valuable raw material for the food (oil) and feed (post-extraction meal) industries. Soybean is second after palm (Elaeis guineensis Jacq.) worldwide as a source for vegetable oil production and consumption [19]. Approximately 29% of the global supply of consumer vegetable oil is produced from soybeans [20]. The fatty acid (FA) content of the oil is a quality indicator used to classify, among other things, soybean varieties and soybean-based products and is a key factor in determining its final use [21,22]. Soybean oil contains saturated FA (palmitic acid (16:0) and stearic acid (18:0)), unsaturated FA (C18:1n9, linoleic acid (18:2) and 18:3 acids), and polyunsaturated FA (linolenic acid (18:3n6) and C18:3n3 acid [12,23]. Soybean oil does not contain cholesterol and 85% of its content is unsaturated FA, which are valuable in human nutrition [16]. Soybean is low in saturated FA [23,24,25]. Higher concentrations of polyunsaturated FA, such as 18:3 acid, are needed in human nutrition [26].
A higher concentration of C18:1n9 acid in oil is a desirable characteristic because it affects the long shelf life and stability of oil for industrial purposes [26]. This FA is not very susceptible to oxidative modifications during processing, storage, and frying. Therefore, the food industry is now interested in producing soybean seeds containing high concentrations of C18:1n9 acid [27,28,29]. Soybean oil with higher levels of this acid is also desirable for biofuel production due to its higher oxidative stability and lubricating properties [30].
The presence of FAs in the human diet is desirable. C18:1 acid is considered to be effective in lowering cholesterol levels, reduces the incidence of cardiovascular disease, and features anti-diabetic and anti-inflammatory properties [31]. C18:2n6 acid is an essential omega-6 polyunsaturated FA (PUFA) that can reduce the incidence of diabetes mellitus and will have an effect on lowering blood pressure [32]. C18:0 acid is a saturated FA and has no effect on blood cholesterol [33], but when combined with C16:0 acid, it shows antimicrobial properties against Staphylococcus aureus and Helicobacter pylori, the latter additionally against Streptococcus pyogenes [34].
The formation of nutrients in soybean seeds (protein, oil, fatty acids, soluble sugars, and isoflavones) is strongly influenced by various factors such as genotype, location, climate, water, and earliness group [12,35,36,37]. Studies on soybean cultivars from different countries show significant differences in FA content and composition. The variable contents include C16:0, C18:3n6, C18:0, C18:1n9, and C18:2n6 acids, but the greatest variation in FA composition was found in C18:3 acid [12,23]. This is due to the strong influence of environmental and agro technical conditions on the metabolic pathways in plants [29,38,39,40].
Very significant intervarietal differences are found in FA composition in different earliness classes of cultivar. Higher contents of C16:0, C 18:0, and C18:1 acids were observed in earlier maturing cultivars, while higher levels of C18:2 and C18:3 acids were observed in late maturing ones [36]. The greatest variation in FAs composition was found in C18:3 content, and C18:2 acid content varied the most among cultivars [23]. C18:0 and C18:1 acids showed more variation than C16:0, C18:2, and C18:3 acids [36]. In the study [41] all FAs showed differences between cultivars.
In addition to nutritional considerations, the cultivation of legumes, including soybean, provides additional economic and ecological benefits. Further noteworthy is the high phenotypic plasticity of soybean plants depending on thermal and rainfall factors [42]. The presence of legumes in crop rotations is especially desirable in organic and sustainable farming system due to their ability to fix atmospheric nitrogen in symbiosis with papillary bacteria [43], which reduces the demand for mineral nitrogen and contributes to improving soil fertility [44,45]. This is also supported by other studies showing that Rhizobium leguminosarum can completely replace chemical fertilizer in common bean [46], and inoculation of pigeon pea Cajanus cajan (L.) Huth with Bradyrhizobium bacteria resulted in the same or higher yield than did the use of mineral nitrogen fertilizer [47].
Soybean is capable of fixing atmospheric nitrogen in symbiosis with Bradyrhizobium japonicum bacteria. Since these bacteria are not found in European soils, soybean seeds must be inoculated with Bradyrhizobium strains before sowing in order to fix nitrogen and realize their yield potential [48]. Inoculation with papillary bacteria of legumes is a reliable agronomic practice to increase production levels, protect the environment and provide quality food for humans and animals. Inoculation can also cause changes in the chemical composition of seeds of different legume species. It has been shown to increase the antioxidant potential and content of some bioactive compounds such as phenols, flavonoids, organic acids, proteins, and FAs. Therefore, studies on the effect of inoculation with papillary bacteria on the content of bioactive compounds in soybean plants are gaining considerable interest [10,49]. Soybean participates in symbiosis with several species of nitrogen-fixing bacteria, mainly belonging to the genus Bradyrhizobium, including B. japonicum, which has beneficial effects on plant growth, seed yield, and nitrogen content of this legume [50,51,52]. As a result, soybean has low mineral fertilizer requirements and this further increases the yield of subsequent crops such as cereals [53].
Inoculation alleviates drought stress and increases yield and fat content in soybean [54], with plant drought tolerance being associated with nutrient accumulation [55,56] and potential improvement in water uptake by plants in symbiosis with papillary bacteria [55]. Inoculation with B. japonicum induces metabolic changes in the soybean plant, the most studied of which so far being an increase in protein content [57]. It also causes an increase in the FA content in the seed [10]. In field studies, soybean has been shown to be able to fix large amounts of nitrogen, ranging from 0 to 337 kg ha−1 N [48,58], and biological nitrogen fixation by legumes decreases as the proportion of native soil nitrogen supply increases and vice versa [59]. However, some level of application of nitrogen may be needed during early plant development to overcome nitrogen deficiency at a time when the source of N contained in cotyledons is depleted and plants have not yet formed papillae capable of supplying the plant with symbiotically bound N2 [60]. Soybean requires an average of 80 kg N in above-ground dry matter per ton of seed produced [59,61]. In practice, nitrogen fertilizer is applied to soybean crops in small amounts as a “starter” at sowing. However, research indicates that in the absence of nitrogen fertilizer, biological N2 fixation is not sufficient to meet the N demand of the growing crop from early in the season up to the beginning of seed filling, and yield increases in high-yielding soybean production systems require increased biological N2 fixation, a greater supply of N from soil or fertilizer, or a relaxed trade-off between these two nitrogen sources to meet plant demand [62,63].
The effects application of nitrogen fertilizer on soybean seed yield, protein, and oil content have been extensively documented [64,65,66], but there are few studies on oil composition and its response to nitrogen fertilizer that extensively discuss its effects on FA profile [64,65,66]. Some studies have shown that the level of nitrogen fertilizer applied had no effect on the FA composition of soybean seeds [53], and the content of palmitic (C16:1), oleic (C18:1n9), and linoleic (C18:2n6) acids in seeds did not depend on either years or nitrogen fertilization [41,67]. Moreover, varying fertilizer application rates did not modify the fatty acid composition of soybean [53].
Therefore, an important issue is whether and to what extent inoculation of soybean seeds with symbiotic bacteria combined with varying doses of nitrogen fertilizer can change the FA composition of soybean seeds after harvest and what is the impact of the choice of cultivar.

2. Materials and Methods

2.1. Experimental Design

Field experiments were carried out in 2016–2019 at the Experiment Station for Cultivar Assessment in Przecław (south east Poland, 50°11′ N, 21°29′ E; altitude 185 m).
The experiment was a three-factorial split-plot design with four replications and 72 plots (plot size 13 m × 1.5 m = 19.5 m2). The research factors were as follows:
I.
Soybean (Glycine max (L.) Merrill) cultivars: Aldana (maintainer Plant Breeding Strzelce Sp. z o.o. IHAR group, Poland) and Annushka (maintainer Scientific Research Centre for Soya Development ”AgeSoya” Sp. z o.o., Poland) which belonged to the very early maturity group.
II.
Nitrogen fertilizer: 0, 30, 60 kg∙ha−1 N.
III.
Bacterial inoculant (which contains Bradyrhizobium japonicum, symbiotic bacteria for soybean seeds): without inoculation, HiStick®Soy (BASF, Littlehampton, UK), Nitragina (Institute of Soil Science and Plant Cultivation–State Research Institute, Puławy, Poland).
Each inoculant was applied in a timely manner, according to the manufacturer’s recommendations.
Soybean was grown according to the principles of integrated crop management The agricultural practices carried out in particular years of the study are presented in Table 1. The seeds were sown at the turn of April and May, row distance—15 cm, and sowing density—90 seeds per 1 m2, depth—ca. 3–4 cm. The experiment was conducted in the experimental field where soybean had not previously been grown so far. The preceding crop was spring wheat. A pre-sowing fertilizer with P and K was applied at 15.3, and 78.9 kg∙ha−1, respectively.

2.2. Soil Conditions

The soil in the study location originated from silt loam (SiL) [19] classified as a Fluvic Cambisol (CMfv) according to the WRB FAO classification [68]. The following chemical characteristics were determined in the soil samples: soil pH—pH in 1 mol dm−3 KCl—potentiometrically, soil organic carbon (SOC) content-oxidometrically [69]. The contents of available P and K were determined according to the Egner-Riehm method, Mg—Schachtschabel method [70], while the remaining elements were analyzed by the AAS method (Hitachi Z-2000). The soil was slightly acidic (2016, 2018, and 2019) and neutral in 2017. The soil was characterized by very high phosphorus content, very high (2017) or medium (2016, 2018, and 2019) potassium content, very high (2017, 2018, and 2019) or high (2016) magnesium content, medium manganese and zinc content, and high (2017 and 2019) and average (2016 and 2018) copper content (Table 2).

2.3. Weather Conditions

The air temperature and precipitation were measured at the Experimental Station for Cultivar Assessment in Przecław (South-East Poland). Meteorological conditions in the soya bean growing seasons (2016–2019) were evaluated on the basis of monthly precipitation totals, average air temperatures (Figure 1), and Sielianinov’s hydrothermal index (K). The K index, known as the water supply factor for plants, was calculated according to the formula [71]:
K = P 0.1 Σ t
where K—value of hydrothermal coefficient, P—signifies the monthly sum of rainfall, ∑t—monthly sum of air temperatures >0 °C from a given month.
Weather conditions during the soybean growing period varied depending on the year of research, as well as in particular months (Figure 1 and Figure 2). In accordance with the value ranges proposed by Skowera et al. [71], hydrothermal conditions in the soybean growing season (April–September) were optimal in 2016, defined as humid in 2017, relatively dry in 2018, and relatively humid in 2019. The most unfavourable, extremely dry hydrothermal conditions were in April 2018 and June 2019, while July 2016, and May and September 2017 were very humid, and April 2017 and May 2019 were extremely humid.

2.4. Analytical Methods

Determination of FA profiles was performed chromatographically. A sample of approximately 0.250 g of air-milled dry seeds was weighed (at 90 °C for 4 h) and boiled (water bath) for 30 min with 2 mL of 10% BF3 in methanol at 72 °C ± 0.2 °C (the sample was heated under a reflux condenser). Then 2 mL of hexane and 2 mL of water were added to the cooled sample and vortexed for 2 min. After deposition, the hexane layer was dried over anhydrous sodium sulfate, and a 1 μL aliquot was injected onto a gas chromatograph capillary column for qualitative and quantitative analysis.
The FA profile of soybean seeds was determined by gas chromatography with flame ionisation detection FID (Clarus 580, Perkin-Elmer, Shelton, WA, USA) using a ZB-WAX column (30 m × 0.25 mm i.d., 0.25 μm film thickness). The analysis was carried out under the following conditions: carrier gas—helium, flowing at 20 m s−1, injection chamber temperature—250 °C, detector temperature—270 °C. The temperature program of column operation was 80 °C for 1 min, temperature increments to 140 °C at the rate of 25 °C min−1, temperature increments to 200 °C at the rate of 10 °C min−1, temperature increment to 250 °C at the rate of 10 °C min−1, temperature of 250 °C held for 5 min. the total analysis time was 28.40 min. The qualitative interpretation of chromatograms was performed by comparing the retention times of the fatty acid methyl esters of the test sample with the retention times of Supelco 37 fatty acid methyl ester templates.
The FA composition was expressed as a percentage of total fatty acids. The data obtained were grouped according to the type of FAs: saturated (SFA), unsaturated (UFA), monounsaturated (MUFA), polyunsaturated (PUFA), and the ratio of SFA/UFA and C18:2n6/C18:3n3 was determined.

2.5. Statistical Analyses

The results of the study were statistically analysed by applying analysis of variance (ANOVA) and using TIBCO Statistica 13.3.0 (TIBCO Software Inc., Palo Alto, CA, USA). The least significant difference was calculated with the Tukey test at p ≤ 0.05. Pearson′s correlations at p = 0.05 and multiple regression analysis with backward selection of variables for the parameters examined were calculated. For the calculation of FAs important from a nutritional point of view, the analysis included all the variables and, on this basis, gave the best regression models. The regression equation was formed as follows (Equation (2)):
y = a0 + a1 x1,i + a2 x2,i + ... + apxp,i,
where a0—intercept; a1, a2, ..., ap—regression coefficients; and y—estimated value of dependent variable.

3. Results and Discussion

Soybean seeds are an important source of FAs [72,73,74]. In addition to environmental conditions, the FA profile in soybean seeds is strongly related to their genetics [75,76,77]. In soybean the following acids can beidentified: lauric acid (C12:0), tridecylic acid (C13:0), myristic acid (C14:0), myristoleic acid (C14:1), pentadecanoic acid (C15:0), cis-10-pentadecenoic (C15:1), C16:0, palmitoleic acid (C16:1), margaric acid (C17:0), heptadecenoic acid (C17:1), C 18:0, C18:1n9, C18:2n6, C18:3n3, C18:3n6, arachidic acid (C20:0), eicosenoic acid (C20:1) eicosedienoic acid (C20:2), dihomo-g-linolenic (C20:3n6), eicosatrienoic acid (C20:3n3), arachidonic acid (C20:4n6), eicosapentaenoic acid (C20:5n3), heneicosanoic acid (C21:0), heneicosylic acid (C21:1), erucic acid (C22:1n9), eicosadienoic acid (C22:2), docosaheptaenoic acid (C22:6n3), tricosanoic acid (C23:0), lignoceric acid (C24:0), nervonic acid (C24:1) [10,78]. C16:0, C18:0, C18:1, C18:2n6, and C18:3n3 acids are most commonly considered in studies [41,57]. C18:0 and C18:3 acid levels are used for strain selection in crossbreeding selection and lineage evaluation [79].
In the experiment conducted, a total of 34 fatty acids were identified in soybean seeds, including butyric acid (C4:0), caproic acid (C6:0), caprylic acid (C8:0), capric acid (C10:0), and undecylic acid (C11:0) not reported by the above authors (Table 3). The manuscript discusses the FAs with higher content and greater importance in seeds.
The experiment showed a significant effect of cultivar on the fatty acid profile of soybean seeds. Out of the FAs identified, the seeds of soybean cultivars accumulated the highest value of C18:2n6 and C18:1n9 acids, which together accounted for 71.8% of the total FAs (Table 4). Statistical analysis showed a significant effect of cultivar, nitrogen fertilizer, bacterial inoculation of seeds, as well as weather conditions on the profile of FAs in soybean seeds. The seeds of the Annushka cultivar had a significantly higher content of C18:0, C18:2n6, C18:3n3, C16:0, and C20:0 acids and smaller amounts of C18:1n9 and C16:1 acids compared to the Aldana cultivar. Moreover, other authors [36,72,73,74,75,80], indicate that soybean varieties vary in their C18:0, C18:1, and C18:2 acid content.
The ranges of individual fatty acid contents determined in soybean are significant and can range as follows: C16:0 (13.7–68.1g 100 g seeds−1), C16:1 (0.67–15.2 g 100 g seeds−1), C 18:0 (3.05–67.1 g 100 g seeds−1), C18:1 (9.66–63.0 g 100 g seeds−1), C18:2 (32.5–69.85 g 100 g seeds−1), and C18:3 (0.90–12.9 g 100 g seeds−1) [10,41,79,81].
Abdelghany et al. [40], evaluating 1025 soybean cultivars of different origins, stressed significant differences in C16:0, C 18:0, C18:1, C18:2, and C18:3 acid contents. The average contents of these acids were 12.2; 3.8; 21.5; 54.2, and 8.3 g 100 g seeds−1, respectively. On average, higher levels of C16:0 and C18:3 acids were observed in Russian cultivars (12.31 and 8.15 g 100 g seeds−1, respectively). Higher levels of C 18:0 and C18:1 acids were found in Chinese cultivars (3.95 and 21.95 g 100 g seeds−1, respectively), while the highest level of C18:2 acid was recorded in cultivars from the USA. In some Polish cultivars, the content of C16:0 acid can amount 10.85–14.1 g 100 g seeds−1, C 18:0 acid 4.15–5.12 g 100 g seeds−1, C18:1 acid 21.0–27.18 g 100 g seeds−1, C18:2 45.3–53.24 g 100 g seeds−1, and C18:3 acid can be 7.21–9.86 g 100 g seeds−1 [78,82,83]. This is consistent with the results of the experiment conducted, with lower contents of C 18:0 (3.14–3.28 g 100 g seeds−1) and C18:1 (20.0–18.1 g 100 g seeds−1).
Lack of nitrogen fertilizer promoted the accumulation of C18:0, C20:0, and C20:1 acids in seeds, while seeds accumulated less C16:0 and C16:1 acids. Nitrogen fertilizer at the rates of 30 and 60 kg ha−1 N significantly reduced seed acid C20:0 by 12.2 and 12.5%, C20:1 by 14.1%, and C18:0 by 2.5%, respectively. However, application of nitrogen at a rate of 60 kg ha−1 N increased C16:0 count by 5.2% and that of C16:1 acids by 11.3% with respect to the control. However, nitrogen fertilizer had no significant effect on seed accumulation of C18:1n9, C18:2n6, C18:3n6, C18:3n3, and C14:0 acids.
According to [67], C18:3 unsaturated FA did not show significant changes in response to nitrogen fertilizer and the study of [41] shows that C16:0, C18:1, and C18:2 acids content in seeds did not depend on nitrogen fertilizer. In a study by Rahim et al. [66] application rate of 100 kg ha−1 N significantly increased the C18:2 and C18:1 acid content, while lower rates of 25 and 50 kg ha−1 N showed no significant differences. Similar observations are reported by [82], where application of nitrogen fertilizer at rates of 0, 30, 60 kg ha−1 N did not affect FA composition of soybean. In the study of [81], application of 75 kg urea per 1 ha increased linoleic acid content by 6.22%, 3.86%, and 0.8% compared to the application of 0 and 25 and 50 kg urea per 1 ha, respectively. There was no significant difference between the application of urea at 50 and 75 kg ha−1.
In another study [41] C18:0 acid was the only major FA showing a slight decrease in content from 3.84 g FA 100 g oil−1 in the cultivar fertilized with 670 kg ha−1 N rate to 3.63 g FA 100 g oil−1 in the unfertilized cultivar. Moreover, C18:1n9 and C18:2n6 acid contents varied from 5% to 11% and the ratio of monounsaturated to polyunsaturated FA was 18%, but this was not due to application of nitrogen fertilizer. Only the content of C18:0 acid was significantly modified by application at the rate of 670 kg ha−1 N.
Silva et al. [10] reported that inoculation with B. japonicum increases the FA content of soybean seeds. Taking into account that soybean provides various bioactive compounds, including FAs, which form functional foods included in nutraceutical products [1,43,50,84,85,86,87,88,89,90] seed grafting is desirable. In the experiment, there was no significant effect of seed inoculation on the content of FAs analyzed, except for 16:0 acid. The seeds inoculated with Nitragina reduced C16:0 acid content by about 3.68% and HiStick®Soy by 6.6% compared to the variant without inoculation. The study of Rahim et al. [67] only confirms the decrease in C16:0 acid content under inoculation, while it reports different observations related to decrease in C 18:0 and also an increase in C18:2 and C18:1 acids under inoculation. In addition, the unsaturated FA C18:3 did not show significant changes in response to inoculation. Sharifi et al. [81] showed that the content of saturated FSs C16:0 and C 18:0 decreased in seeds after Bradyrhizobium inoculation compared to the variant without inoculation, while unsaturated FAs C18:1, C18:2, and C18:3 increased. Similar results were obtained for particular acids by Rahim at al. [67] except for C18:3 acid, whose content did not change significantly under inoculation.
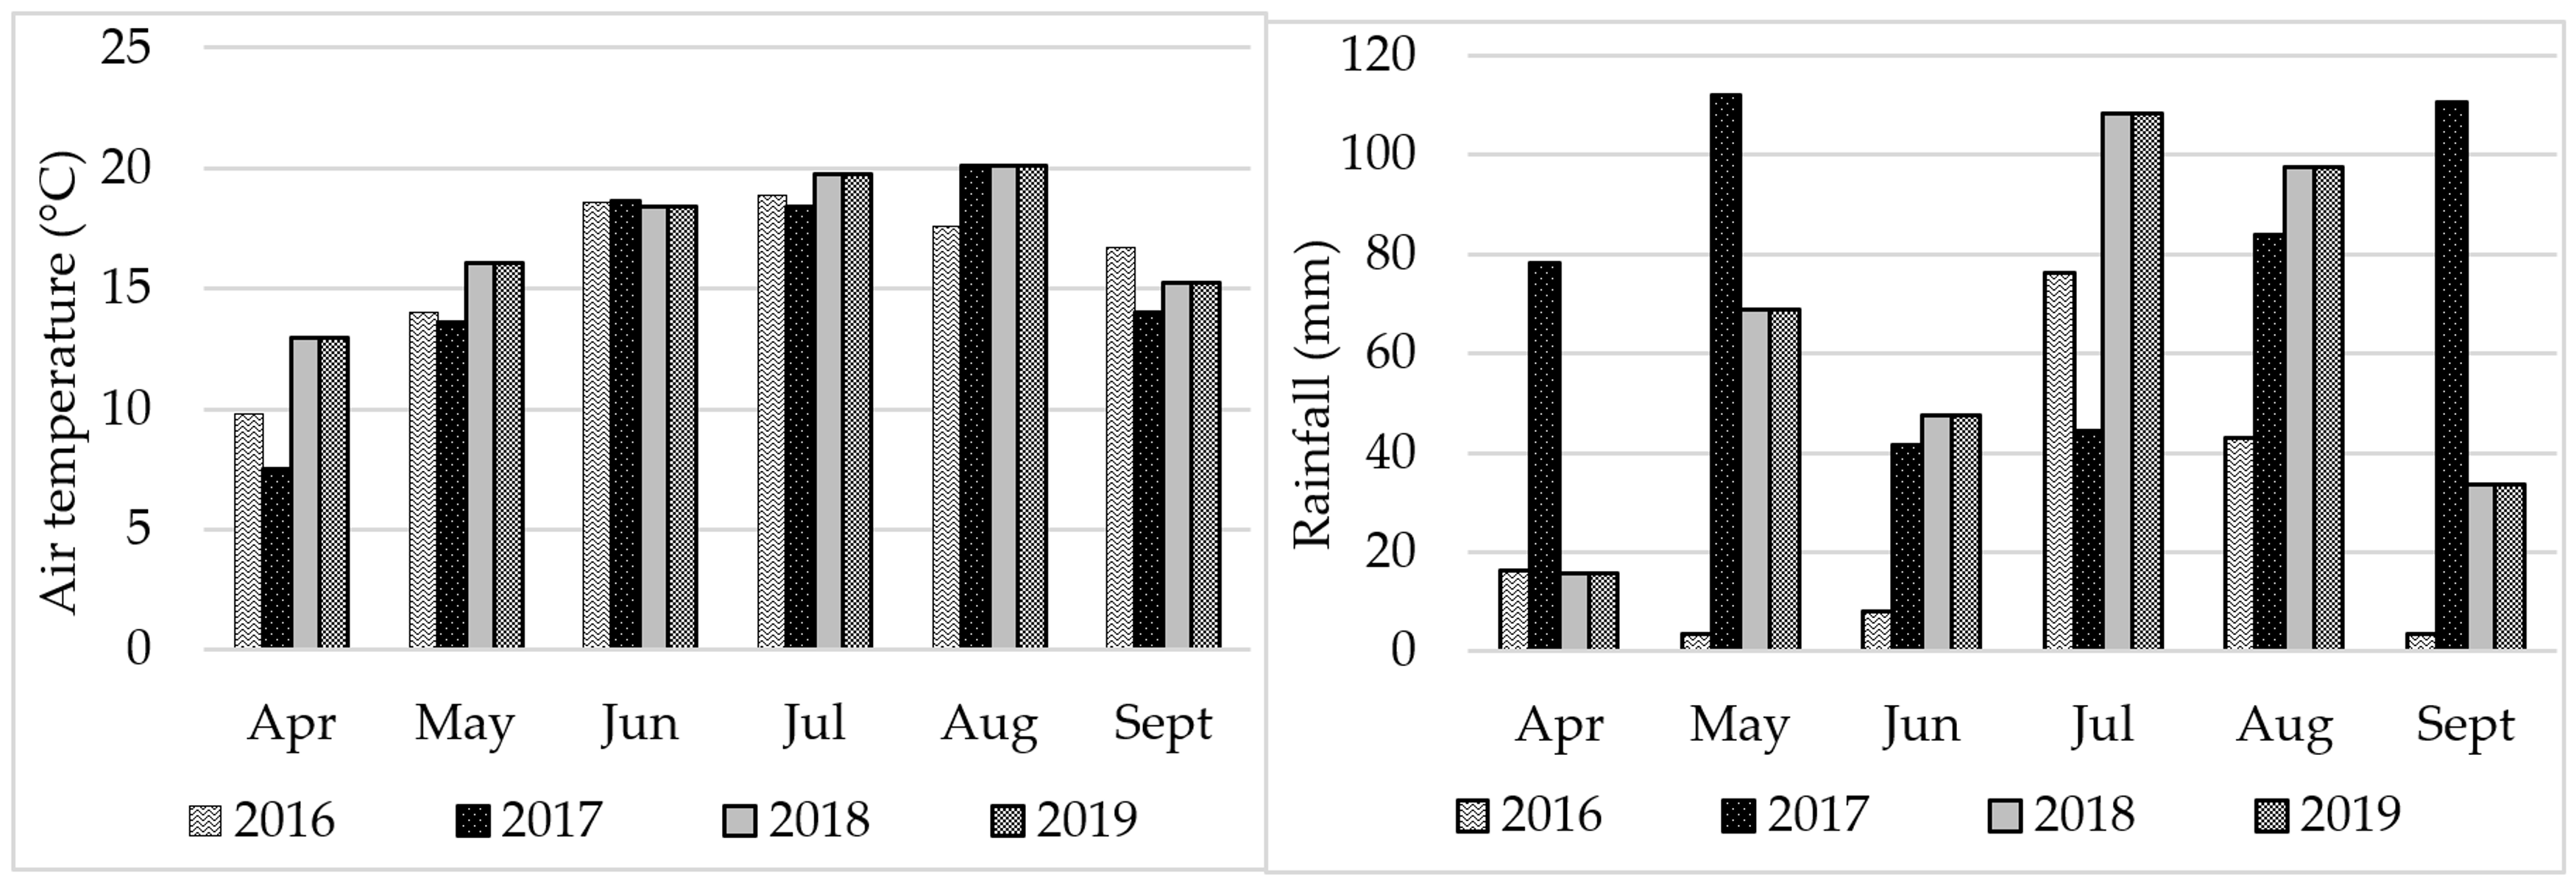
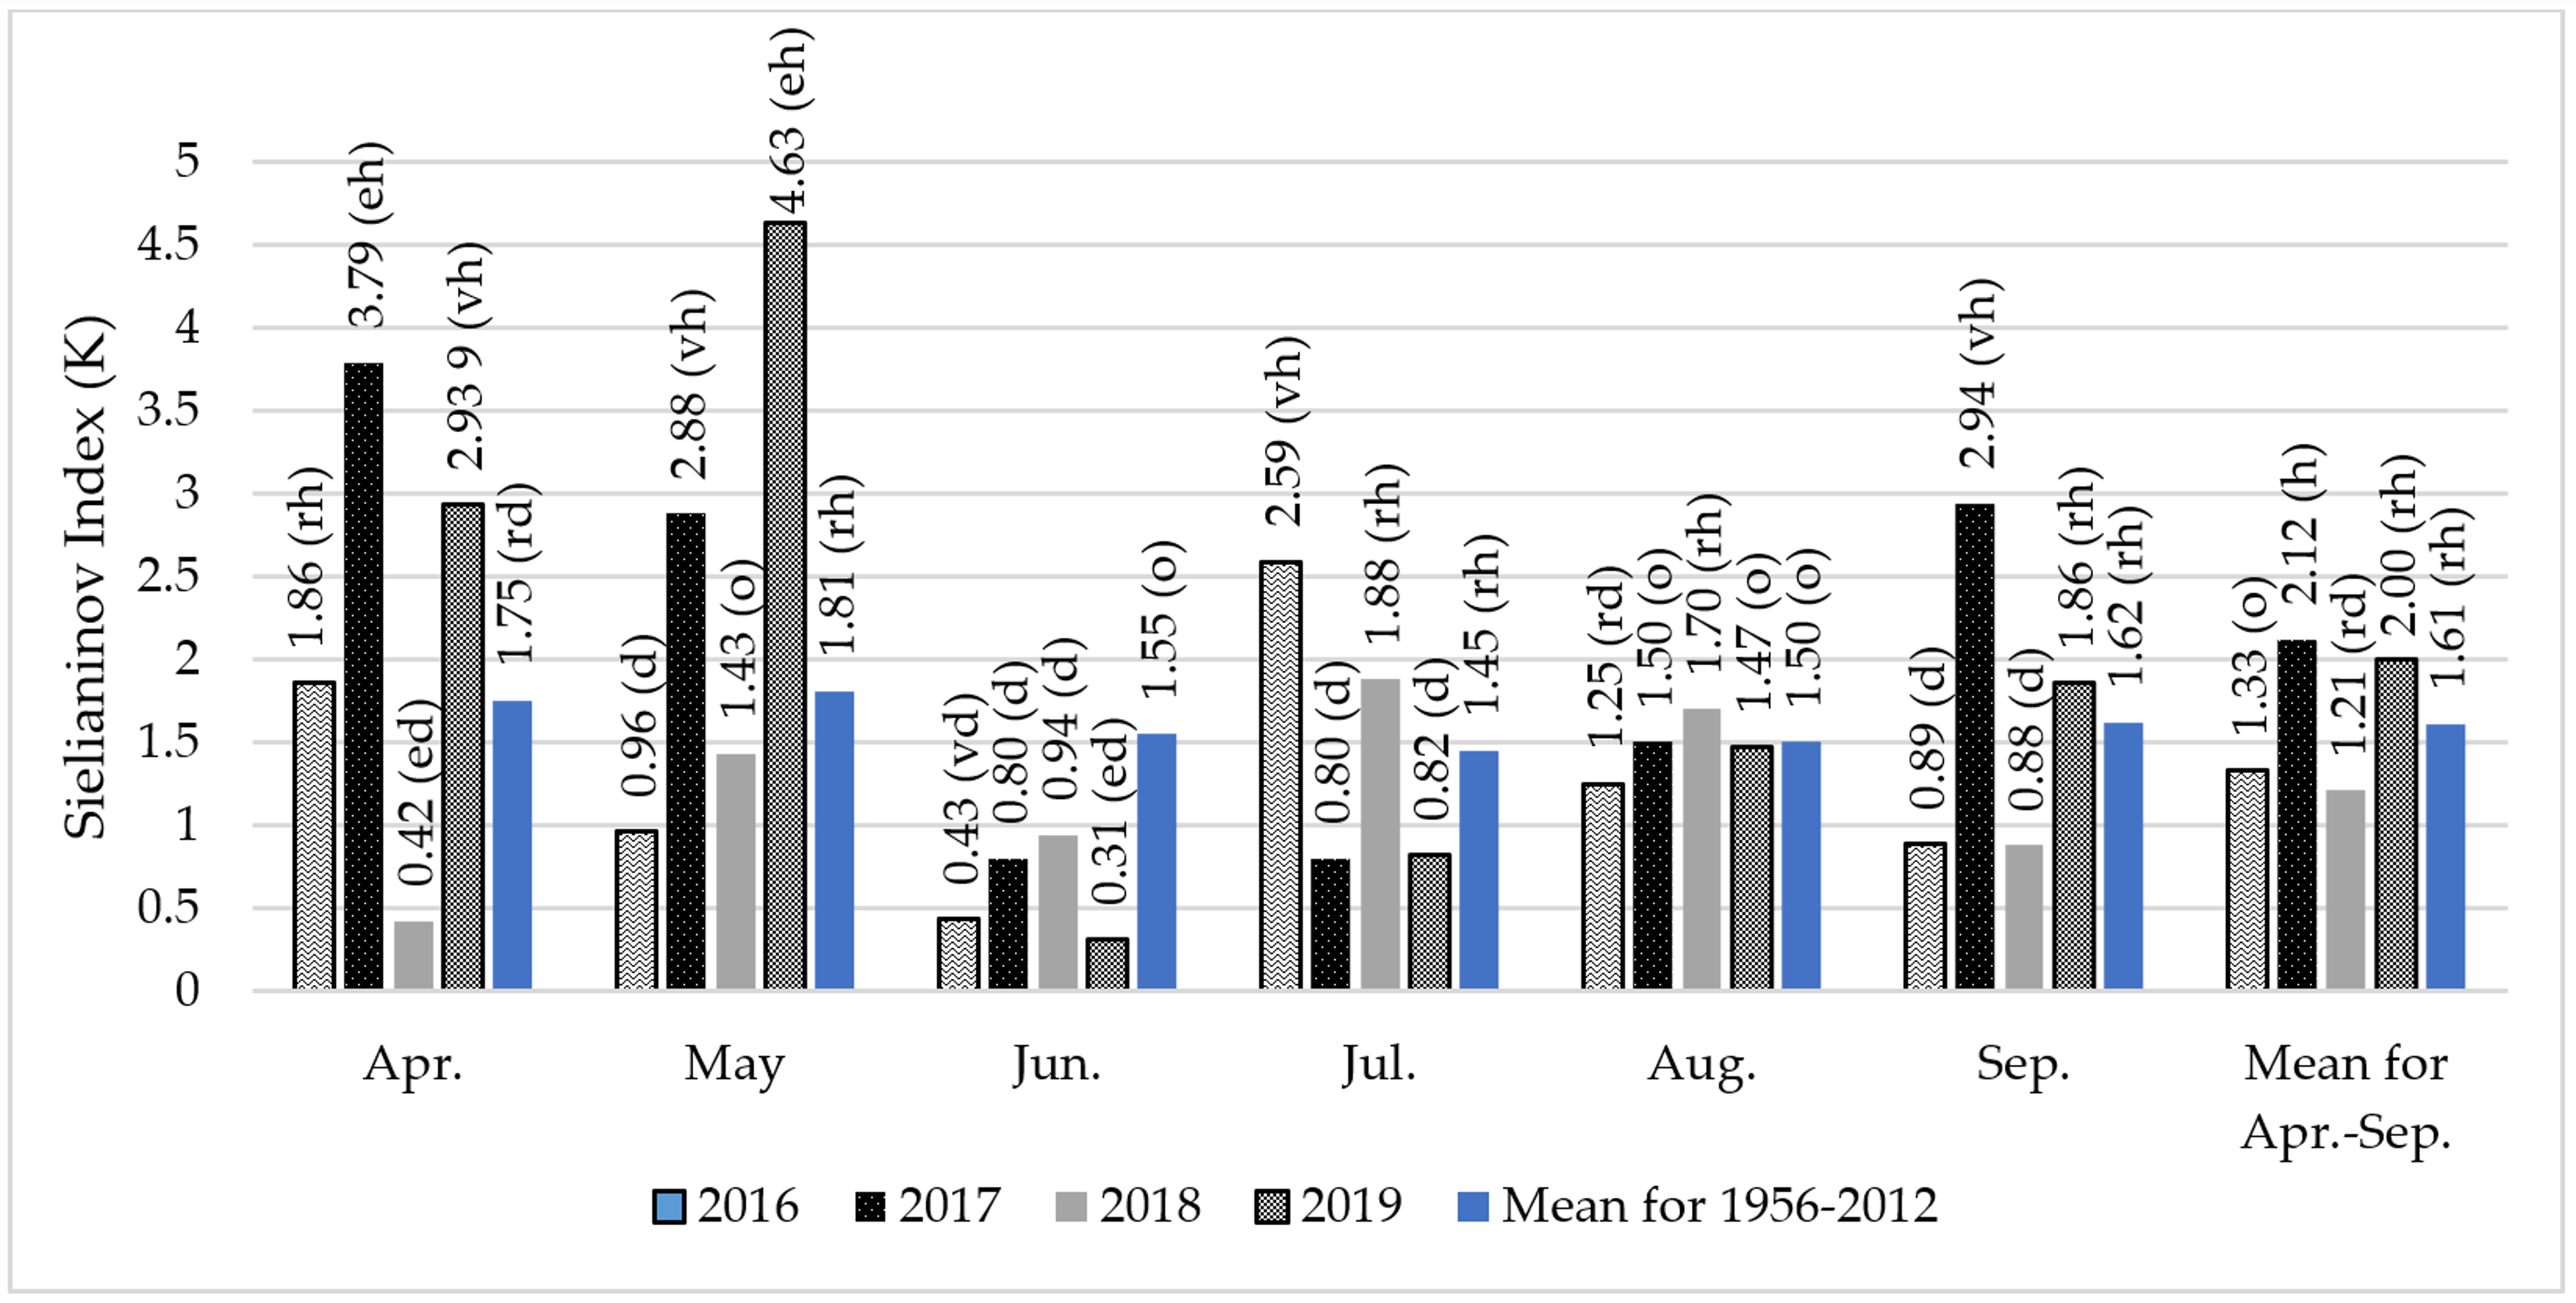
The content of FAs in soybean seeds is modified by the course of weather and environmental conditions [91,92], which was confirmed in the experiment that was carried out. Weather patterns strongly modified the fatty acid profile of soybean seeds. Seeds in 2017 contained the most C18:0, C18:3n6, C14:0, C16:0, C16:1, C20:0, and 20:1 acids. Seeds harvested in 2016 had high C18:2n6 acid content, and in 2018. C18:1n9. The C16:1 acid content of the seeds remained similar except for 2016, when it was the lowest by a significant margin. It was observed that a wet and cool year promoted the accumulation of not only C16:0 and C18:0, but also C18:3n6, C14:0, C16:1, sC20:0 and 20:1 acid in soybean seeds. Different results were obtained by [41], which showed that the C16:0, C18:1 and C18:2 oil content in seeds did not depend on years. Moreover, Abdelghany at al. [40], evaluating 1025 soybean cultivars collected from different ecoregions and grown in different locations and in different years, showed significant differences in FA content, but different from the experiment presented, they found no differences in saturated C16:0 acid content. In another experiment [67], not only did C16:0 acid not change, but no significant differences were found in C18:0 acid content either.
Statistical analysis indicates a significant interaction of cultivar and years of experiment in shaping the FA profile of soybean seeds (Table 5). Significant interaction of these experimental factors was found for six acids: C18:0, C18:1n9, C18:2n6, C18:3n3, C14:0, and C16:0. Seeds of the Annushka cultivar had the highest C18:0 acid content in 2017 and 2019, significantly higher than 2018 by 16.5 and 15%, respectively. Seeds of this cultivar also contained significantly the highest C18:2n6 acid in 2016 and C16:0 in 2017. In contrast, seeds of the cultivar Aldana were distinguished by significantly the highest content of C18:1n9 acid in 2018 and C14:0 acid in 2017.
The cold year 2017 was favorable for the increase in the content of C14:0 saturated acids in the Aldana cultivar, and C16:0 and C18:0 in the Annushka cultivar, while in the warm years higher levels were recorded for the C18:3n3 and C18:2n6 acids in Annushka seeds and C18:1n9 in Aldana seeds. Despite the significance of the interaction cultivar x fertilizer used, no logical and unambiguous relationships were found. There is only a noticeable tendency for cultivars to accumulate saturated acid in seeds in cold years, and unsaturated acids in years with warmer weather conditions.
The experiment also showed a significant effect of interaction between cultivar and inoculation of seeds with B. japonicum on the FA profile (Table 6). Such a relationship was found for three FAs: C18:3n6, C14:0, and C20:0. Seed inoculation with HiStick®Soy resulted in a significant 32.7% increase in C18:3n6 acid content in the Annushka cultivar compared to the bacterial preparation Nitragina. In total 18.3% more C20:0 acid accumulated in the seeds of the Annushka cultivar after inoculation with HiStick®Soy compared to the seeds of the Aldana cultivar inoculated with Nitragina. It was also reported that the C14:0 acid content in the seeds of the cultivar Aldana after inoculated with Nitragina was significantly higher by 37.6% compared to the variant without inoculation, and also higher by 43.8% compared to the seeds of the cultivar Annushka inoculated with Nitragina.
The research conducted indicates variation in the effect of the interaction of the cultivars and the inoculation preparation used on the content of some fatty acids in soybeans. The Aldana cultivar obtained more favorable results in cooperation with Nitragina, while the Annushka cultivar with the HiStick® Soy preparation. This suggests that more research is needed with different inoculations and different cultivars.
However, statistical analysis of the results of the four-year study, shows no significant effect of the interaction of cultivar and nitrogen fertilizer (Table S1), nitrogen fertilization and seed inoculation with B. japonicum (Table S2), or inoculation and years of study (Table S3) on the formation of the profile of FAs analyzed.
In the present study, SFA averaged 18.0 g, MUFA 19.5 g, UFA 81.7 g, and PUFA 62.2 g FA 100 g seeds−1 in soybean seeds (Table 7). For the years of study, the Aldana cultivar seeds accumulated on average significantly more MUFA (by 9.8%), while the Annushka cultivar seeds contained significantly higher amounts of SFA and PUFA (by 3.3 and 2.1%, respectively). On the other hand, no significant differentiation of cultivars was found in terms of UFA content in seed. Application of the highest dose of nitrogen fertilizer of 60 kg N ha−1 caused a significant 3.3% increase in the content of SFA in seeds compared to the control, while an opposite relation was obtained for UFA and PUFA. The content of UFA and PUFA in the non-fertilized variant was significantly higher than in the highest nitrogen dose by 5.5 and 9.5%, respectively. However, the rate of nitrogen fertilizer application did not determine the content of MUFA and UFA.
In the current study, inoculation had no effect on UFA, MUFA, PUFA, and the formation of SFA/UFA ratios of soybean seeds. It only had an effect on SFA. The least favorable SFA content occurred in non-treated seeds, and a favorable decrease by 1.09% in its content was observed with Nitragina treatment and 3.3% after HiStick®Soy treatment. Different results were obtained by Luís et al. [10], who reported that inoculation with B. japonicum increases the content of unsaturated fatty acids in soybean seeds. Similar results were reported by Silva et al. [10] showing that inoculation of B. japonicum sv glycinearum, increased the content of total FAs and this was due to an increase in MUFA and PUFA. SFA accounted for 73% and 65% of the total FA content in the inoculated and control samples, respectively. Among them, C18:0 acid was the major compound in both samples, accounting for 55% and 34% of the total SFA content in inoculated and control seeds, respectively [10].
Soybean seeds had the highest SFA content in 2017, MUFA and UFA in 2018 and PUFA in 2016.
The cultivar, nitrogen fertilizer application and inoculation had no effect on the formation of SFA/UFA and C18:2n6/C18:3n3 ratios. The experiment showed that the cultivar did not determine these ratios, but the proportion of MUFA and the proportion of PUFA were significant in cultivars. Similarly, this was also seen in another experiment where the percentage of MUFA differed between cultivars by more than 27% and the percentage of PUFA ranged from 59.61–60.12% and differed cultivars by 3.5% [82].
C18:2 and C18:3 acids are essential fatty acids in the human diet, and the ratio between them determines the nutritional value [28,29]. In our study, there was no effect of inoculation on this relationship and the average ratio was 5:1, which was more favorable than that calculated in the study by Pisulewska et al. [78], which was 7:1.
The course of weather conditions during the study years had a significant impact on these matters. In 2017, the value of SFA/UFA ratio in soybean seeds was significantly higher from 8,0% to 20% compared to the other study years, while the value of the C18:2n6/C18:3n3 ratio was then significantly lower than in 2017 and 2018 (by 13.9 and 14.2%, respectively). A relatively humid and cold 2017 year contributed to an increase in the SFA/UFA ratio, while the value of the C18:2n6/C18:3n3 acid ratio was significantly lower in warm years with optimal humidity or relatively humid years. In the experiment of Tamagno et al. [41], the ratio of C18:1n9 acid to PUFA did not vary with year.
In the experiment, significant interaction between cultivar and years of testing on MUFA and PUFA, as well as the ratio of C18:2n6/C18:3n3 acids content in soybean seeds was noted (Table 8). Seeds of the cultivar Aldana contained significantly more MUFA (by 33.9%) and less PUFA (by 9,1%) in 2018 compared to seeds of the cultivar Annushka collected in 2016 and also showed a significantly lower value of C18:2n6/C18:3n3 ratio compared to seeds of both cultivars obtained in 2019. However, soybean seeds of both cultivars in 2017 and 2018 contained—the significantly lowest amount of PUFAs.
However, based on the experiment, there was no significant interaction between cultivar and nitrogen fertilizer application (Table S4), cultivar and B. japonicum inoculation (Table S5), inoculation and years of testing (Table S6) on SFA content, MUFA, UFA, and PUFA, as well as the formation of SFA/UFA and C18:2n6/C18:3n3 acids ratios.
The multiple regression method with backward selection was used to evaluate the effect of selected fatty acids on the measured FA content. The possibility of eliminating irrelevant variables in stepwise multiple regression calculations allows one to narrow down the number of independent variables. Therefore, the results of the calculations allow us to determine which fatty acids interacted with the levels of C16:0, C18:0, C18:1n9, C18:2n6, and C18:3n3 acids and to what extent (Table 9). The models showed good correlation with the explanatory variables. In the equations presented, the values indicate the significance of the estimated regression parameters. The equations obtained have high coefficients of determination R2. This allows us to conclude that the amount of C20:2 and C21:0 acid accumulated in soybeans has the greatest effect on C14:0 acid content. The amount of accumulated C16:0 acid is most affected by C15:1 and C24:0. C18:1n9 acid has the least effect on C16:1 content. A 1% increase in C20:1 acid will cause a 3.20 unit decrease in C18:0 acid, while a one unit increase in C15:1 acid will cause a 2.718 unit decrease in C18:3n3/C18:1n9 acids which is described by 99% of the independent variables.

4. Conclusions

This study confirms the genetic determinants of fatty acid composition in soybean seeds and the variation in their levels of accumulation for C16:0, C16:1, C18:1n9, C18:2, C18:3, and C20:0 as well as SFA, MUFA, and PUFA. This suggests that it is desirable that further is carried out work on the genetic improvement of soybean cultivars to obtain advantageous fatty acid composition and content.
Application of nitrogen fertilizer at a rate of 30 kg ha−1 contributed to an increase in the content of C16:0, C16:1, and SFA acids with a simultaneous decrease in the content of C18:0 and C20:0 acids. Increasing the nitrogen rate to 60 kg ha−1 N did not result in the expected changes, which may be an indication that it is only necessary to use a “starter” rate not exceeding 30 kg ha−1 N.
Inoculation of soybean seeds with B. japonicum (HiStick®Soy and Nitragina), resulted in a decrease in the content of SFA and C16:0 acid. From a nutritional point of view, this is beneficial because the proportion of C16:0 acid in the total fatty acids determines the hypercholesterolemic index, and in terms of content, it is the third most accumulated fatty acid in soybean seeds. An increase in C16:0 acid content had a negative effect on the accumulation of C18:1, C18:2, and C18:3 acids. There was a decrease in the content of each of these acids by almost one unit for every 1% increase in C16:0 content.
The study indicates the importance of the interaction of cultivar and inoculation treatment in modifying the fatty acid profile of C14:0, C18:3n6, and C20:0. Inoculation resulted in an increase in C14:0 acid content in both cultivars, while with the Aldana cultivar an increase in C18:3n6 was recorded as was a decrease in C20:0. Significantly higher C18:3n6 and C20:0 acid contents were recorded after HiStick®Soy application.
Further noteworthy is the dominant effect of environmental conditions on changes in the composition of fatty acids and their mutual proportions, which may be an indication that there is a need for further research on the use of inoculation and nitrogen fertilizer in the cultivation of cultivars belonging to different earliness groups and growing regions.

Supplementary Materials

The following are available online at https://www.mdpi.com/article/10.3390/agronomy11050941/s1, Table S1: FAs composition of G. max seeds (g FA 100 g seeds−1), mean values for interaction cultivar × fertilization. Table S2: FAs composition of G. max seeds (g FA 100 g seeds−1), mean values for interaction fertilization × inoculation. Table S3. FAs composition of G. max seeds (g FA 100 g seeds−1), mean values for interaction inoculation × years. Table S4. Content of SFA, UFA, MUFA and PUFA (g FA 100 g seeds−1) as well as the ratio of SFA/UFA and C18:2n6/C18:3n3 in G. max seeds, mean values for interaction cultivar × fertilization. Table S5. Content of SFA, UFA, MUFA, and PUFA (g FA 100 g seeds−1) as well as the ratio of SFA/UFA and C18:2n6/C18:3n3 in G. max seeds, mean values for interaction cultivar × inoculation. Table S6. Content of SFA, UFA, MUFA, and PUFA (g FA 100 g seeds−1) as well as the ratio of SFA/UFA and C18:2n6/C18:3n3 in G. max seeds, mean values for interaction inoculation × years.

Author Contributions

E.S.-K. and A.W.-G. have contributed in developing the research ideas, analyzing the data, conducting the research and writing the manuscript; investigation, E.S.-K., A.W.-G., D.B.-J., M.J.-P., A.K., and M.K.; writing—review and editing, E.S.-K., A.W.-G., and D.B.-J. All authors have read and agreed to the published version of the manuscript.

Funding

The field research was made possible by a grant from the Polish Ministry of Agriculture and Rural Development, Project: Improving domestic sources of plant protein, their production, trading and use in animal feed, project No. HOR 3.6/2016–2020. This project was financed by the program of the Minister of Science and Higher Education named “Regional Initiative of Excellence” in the years 2019–2022, project number 026/RID/2018/19, the amount of financing PLN 9 542 500.00 and by the Ministry of Science and Higher Education, Poland.

Institutional Review Board Statement

Not applicable.

Informed Consent Statement

Not applicable.

Data Availability Statement

The data presented in this study are available in Supplementary Materials.

Conflicts of Interest

The authors declare no conflict of interest.

References

  1. Mudryj, A.; Yu, N.; Aukema, H. Nutritional and health benefits of pulses. Appl. Physiol. Nutr. Metab. 2014, 9, 1197–1204. [Google Scholar] [CrossRef] [PubMed]
  2. Boye, J.; Zare, F.; Pletch, A. Pulse proteins: Processing, characterization, functional properties and applications in food and feed. Food Res. Int. 2010, 43, 414–431. [Google Scholar] [CrossRef]
  3. Foyer, C.H.; Lam, H.M.; Nguyen, H.T.; Siddique, K.H.M.; Varshney, R.K.; Colmer, T.D.; Cowling, W.; Bramley, H.; Mori, T.A.; Hodgson, J.M.; et al. Neglecting legumes has compromised human health and sustainable food production. Nat. Plants 2016, 2, 1–10. [Google Scholar] [CrossRef] [PubMed]
  4. Marventano, S.; Izquierdo Pulido, M.; Sánchez-González, C.; Godos, J.; Speciani, A.; Galvano, F.; Grosso, G. Legume consumption and CVD risk: A systematic review and meta-analysis. Public Health Nutr. 2017, 20, 245–254. [Google Scholar] [CrossRef] [Green Version]
  5. Rebello, C.J.; Greenway, F.L.; Finley, J.W. A review of the nutritional value of legumes and their effects on obesity and its related co-morbidities. Obes. Rev. 2014, 15, 392–407. [Google Scholar] [CrossRef]
  6. Singhal, P.; Kaushik, G.; Mathur, P. Antidiabetic Potential of Commonly Consumed Legumes: A Review. Crit. Rev. Food Sci. Nutr. 2014, 54, 655–672. [Google Scholar] [CrossRef]
  7. FAOSTAT. 2019. Available online: http://www.fao.org/faostat/en/#data/QC/visualize (accessed on 20 March 2021).
  8. Hymowitz, T.; Singh, R.; Kollinpara, K. The genomes of the glycine. Plant Breed Rev. 1998, 16, 289–311. [Google Scholar]
  9. Abbasi, M.; Tahir, M.; Azam, W.; Abbas, Z.; Rahim, N. Soybean yield and chemical composition in response to phosphorus—Potassium nutrition in Kashmir. Agron. J. 2012, 104, 1476–1484. [Google Scholar] [CrossRef] [Green Version]
  10. Silva, L.R.; Pereira, M.J.; Azevedo, J.; Mulas, R.; Velazquez, E.; Gonzalez-Andres, F.; Valentao, P.; Andrade, P.B. Inoculation with Bradyrhizobium japonicum enhances the organic and fatty acids content of soybean (Glycine max (L.) Merrill) seeds. Food Chem. 2013, 141, 3636–3648. [Google Scholar] [CrossRef]
  11. Bellaloui, N.; Bruns, H.A.; Abbas, H.K.; Mengistu, A.; Fisher, D.K.; Reddy, K.N. Agricultural practices altered soybean seed protein, oil, fatty acids, sugars, and minerals in the Midsouth USA. Front. Plant Sci. 2015, 6, 1–14. [Google Scholar] [CrossRef]
  12. Azam, M.; Zhang, S.; Qi, J.; Abdelghany, A.M.; Shaibu, A.S.; Ghosh, S.; Feng, Y.; Huai, Y.; Gebregziabher, B.S.; Li, J.; et al. Profiling and associations of seed nutritional characteristics in Chinese and USA soybean cultivars. J. Food Compos. Anal. 2021, 98, 103803. [Google Scholar] [CrossRef]
  13. Kocira, S.; Szparaga, A.; Kocira, A.; Czerwińska, E.; Depo, K.; Erlichowska, B.; Deszcz, E. Effect of applying a biostimulant containing seaweed and amino acids on the content of fiber fractions in three soybean cultivars. Legum. Res. 2019, 42, 341–347. [Google Scholar] [CrossRef] [Green Version]
  14. Singh, B.P.; Yadav, D.; Vij, S. Soybean bioactive molecules: Current trend and future prospective. In Bioactive Molecules in Food; Springer International Publishing: Berlin/Heidelberg, Germany, 2017; pp. 1–29. [Google Scholar] [CrossRef]
  15. Raei, E.; Sedghi, M.; Sharifi, S. Effect of Bradyrhizobium inoculation, application of nitrogen and weeding on growth and seed filling rate in soybean. JWSS. 2008, 12, 81–91. Available online: https://jstnar.iut.ac.ir/browse.php?a_code=A-10-2-821&slc_lang=en&sid=1 (accessed on 3 March 2021).
  16. Anwar, F.; Kamal, G.M.; Nadeem, F.; Shabir, G. Variations of quality characteristics among oils of different soybean varieties. J. King Saud Univ. Sci. 2016, 28, 332–338. [Google Scholar] [CrossRef] [Green Version]
  17. Graham, P.; Vance, C. Legumes: Importance and constraints to greater use. Plant Physiol. 2003, 131, 872–877. [Google Scholar] [CrossRef] [Green Version]
  18. Krishnan, H.B. Engineering soybean for enhanced sulfur amino acid content. Crop Sci. 2005, 45, 454–461. [Google Scholar] [CrossRef]
  19. Ditzler, C.; Scheffe, K.; Monger, H.C. (Eds.) Soil Science Division Staff: Soil Survey Manual; USDA Handbook 18; Government Printing Office: Washington, Distribution Center, USA, 2017. [Google Scholar]
  20. SOYSTATS. 2019. Available online: http://soystats.com/international-world-vegetable-oil-consumption/ (accessed on 26 March 2021).
  21. Rowntree, S.C.; Suhre, J.J.; Weidenbenner, N.H.; Wilson, E.W.; Davis, V.M.; Naeve, S.L.; Casteel, S.N.; Diers, B.W.; Esker, P.D.; Conley, S.P. Physiological and phenological responses of historical soybean cultivar releases to earlier planting. Crop Sci. 2014, 54, 804–816. [Google Scholar] [CrossRef]
  22. Lee, H.; Cho, B.K.; Kim, M.S.; Lee, W.H.; Tewari, J.; Bae, H.; Sohn, S.I.; Chi, H.Y. Prediction of crude protein and oil content of soybeans using Raman spectroscopy. Sens. Actuators B: Chem. 2013, 185, 694–700. [Google Scholar] [CrossRef] [Green Version]
  23. Abdelghany, A.M.; Zhang, S.; Azam, M.; Shaibu, A.S.; Feng, Y.; Qi, J.; Li, Y.; Tian, Y.; Hong, H.; Li, B.; et al. Natural Variation in Fatty Acid Composition of Diverse World Soybean Germplasms Grown in China. Agronomy 2020, 10, 24. [Google Scholar] [CrossRef] [Green Version]
  24. Hartman, G.L.; West, E.D.; Herman, T.K. Crops that feed the World 2. Soybean-worldwide production, use, and constraints caused by pathogens and pests. Food Sec. 2011, 3, 5–17. [Google Scholar] [CrossRef]
  25. Clemente, T.E.; Cahoon, E.B. Soybean oil: Genetic approaches for modification of functionality and total content. Plant Physiol. 2009, 151, 1030–1040. [Google Scholar] [CrossRef] [PubMed] [Green Version]
  26. Bellaloui, N. Effect of water stress and foliar boron application on seed protein, oil, fatty acids, and nitrogen metabolism in soybean. Am. J. Plant Sci. 2011, 2, 692–701. [Google Scholar] [CrossRef] [Green Version]
  27. Rahman, S.M.; Kinoshita, T.; Anai, T.; Takagi, Y. Combining ability in loci for high oleic and low linolenic acids in soybean. Crop Sci. 2001, 41, 26–29. [Google Scholar] [CrossRef]
  28. Carrera, C.S.; Dardanelli, J.L. Water deficit modulates the relationship between temperature and unsaturated fatty acid profile in soybean seed oil. Crop Sci. 2017, 57, 3179–3189. [Google Scholar] [CrossRef]
  29. Gao, J.; Hao, X.; Thelen, K.D.; Robertson, G.P. Agronomic management system and precipitation effects on soybean oil and fatty acid profiles. Crop Sci. 2009, 49, 1049–1057. [Google Scholar] [CrossRef]
  30. Graef, G.; Lavallee, B.J.; Tenopir, P.; Tat, M.; Schweiger, B.; Kinney, A.J.; Van Gerpen, J.H.; Clemente, T.E. A high-oleic-acid and low-palmitic-acid soybean: Agronomic performance and evaluation as a feedstock for biodiesel. Plant Biotechnol. J. 2009, 7, 411–421. [Google Scholar] [CrossRef]
  31. Oliveira, A.P.; Silva, L.R.; Andrade, P.B.; Valentao, P.; Silva, B.M.; Gonc-Alves, R.F.; Pereira, J.A.; De Pinho, P.G. Further insight into the latex metabolite profile of ficus carica. J. Agric. Food Chem. 2010, 58, 10855–10863. [Google Scholar] [CrossRef]
  32. Harris, W.S.; Mozaffarian, D.; Rimm, E.; Kris-Etherton, P.; Rudel, L.L.; Appel, L.J.; Engler, M.M.; Engler, M.B.; Sacks, F. Omega-6 fatty acids and risk for cardiovascular disease: A science advisory from the American Heart Association nutrition subcommittee of the council on nutrition, physical activity, and metabolism; council on cardiovascular nursing; and council on epidemiology and prevention. Circulation 2009, 119, 902–907. [Google Scholar] [CrossRef] [Green Version]
  33. Dubois, V.; Breton, S.; Linder, M.; Fanni, J.; Parmentier, M. Fatty acid profiles of 80 vegetable oils with regard to their nutritional potential. Eur. J. Lipid Sci. Technol. 2007, 109, 710–732. [Google Scholar] [CrossRef]
  34. Zheng, C.J.; Yoo, J.S.; Lee, T.G.; Cho, H.Y.; Kim, Y.H.; Kim, W.G. Fatty acid synthesis is a target for antibacterial activity of unsaturated fatty acids. FEBS Lett. 2005, 579, 5157–5162. [Google Scholar] [CrossRef] [Green Version]
  35. Bellaloui, N.; Smith, J.R.; Ray, J.D.; Gillen, A.M. Effect of maturity on seed composition in the early soybean production system as measured on near-isogenic soybean lines. Crop Sci. 2009, 49, 608–620. [Google Scholar] [CrossRef] [Green Version]
  36. Ishikawa, G.; Hasegawa, H.; Takagi, Y.; Tanisaka, T. The accumulation pattern in developing seeds and its relation to fatty acid variation in soybean. Plant Breed. 2001, 120, 417–423. [Google Scholar] [CrossRef]
  37. Assefa, Y.; Purcell, L.C.; Salmeron, M.; Naeve, S.; Casteel, S.N.; Kovács, P.; Archontoulis, S.; Licht, M.; Below, F.; Kandel, H.; et al. Assessing variation in us soybean seed composition (protein and oil). Front. Plant Sci. 2019, 10. [Google Scholar] [CrossRef]
  38. Carrera, C.; Martínez, M.J.; Dardanelli, J.; Balzarini, M. Water deficit effect on the relationship between temperature during the seed fill period and soybean seed oil and protein concentrations. Crop Sci. 2009, 49, 990–998. [Google Scholar] [CrossRef]
  39. Scilewski Da Costa Zanatta, T.; Manica-Berto, R.; Ferreira, C.D.; Cardozo, M.M.C.; Rombaldi, C.V.; Zambiazi, R.C.; Dias, Á.R.G. Phosphate fertilizer and growing environment change the phytochemicals, oil quality, and nutritional composition of roundup ready genetically modified and conventional soybean. J. Agric. Food Chem. 2017, 65, 2661–2669. [Google Scholar] [CrossRef]
  40. Abdelghany, A.M.; Zhang, S.; Azam, M.; Shaibu, A.S.; Feng, Y.; Li, Y.; Tian, Y.; Hong, H.; Li, B.; Sun, J. Profiling of seed fatty acid composition in 1025 Chinese soybean accessions from diverse ecoregions. Crop J. 2020, 8, 635–644. [Google Scholar] [CrossRef]
  41. Tamagno, S.; Aznar-Moreno, J.A.; Durrett, T.P.; Vara Prasad, P.V.; Rotundo, J.L.; Ciampitti, I.A. Dynamics of oil and fatty acid accumulation during seed development in historical soybean varieties. Field Crops Res. 2020, 248, 107719. [Google Scholar] [CrossRef]
  42. Jańczak-Pieniążek, M.; Buczek, J.; Bobrecka-Jamro, D.; Szpunar-Krok, E.; Tobiasz-Salach, R. Morphophysiology, productivity and quality of soybean (Glycine max (L.) Merr.) cv. Merlin in response to row spacing and seeding systems. Agronomy 2021, 11, 403. [Google Scholar] [CrossRef]
  43. Silva, L.R.; Bento, C.; Carolina Gonçalves, A.; David Flores-Félix, J.; Helena Ramírez-Bahena, M.; Peix, A.; Velázquez, E. Legume bioactive compounds: Influence of rhizobial inoculation. AIMS Microbiol. 2017, 3, 267–278. [Google Scholar] [CrossRef] [Green Version]
  44. Jez, J.M.; Lee, S.G.; Sherp, A.M. The next green movement: Plant biology for the environment and sustainability. Science. 2016, 353, 1241–1244. [Google Scholar] [CrossRef] [Green Version]
  45. Rubiales, D.; Mikic, A. Introduction: Legumes in Sustainable Agriculture. Crit. Rev. Plant Sci. 2015, 34, 2–3. [Google Scholar] [CrossRef] [Green Version]
  46. Mulas, D.; García-Fraile, P.; Carro, L.; Ramírez-Bahena, M.H.; Casquero, P.; Velázquez, E.; González-Andrés, F. Distribution and efficiency of Rhizobium leguminosarum strains nodulating Phaseolus vulgaris in Northern Spanish soils: Selection of native strains that replace conventional N fertilization. Soil Biol. Biochem. 2011, 43, 2283–2293. [Google Scholar] [CrossRef]
  47. Araujo, J.; Díaz-Alcántara, C.A.; Velázquez, E.; Urbano, B.; González-Andrés, F. Bradyrhizobium yuanmingense related strains form nitrogen-fixing symbiosis with Cajanus cajan L. in Dominican Republic and are efficient biofertilizers to replace N fertilization. Sci. Hortic. 2015, 192, 421–428. [Google Scholar] [CrossRef]
  48. Zimmer, S.; Messmer, M.; Haase, T.; Piepho, H.P.; Mindermann, A.; Schulz, H.; Habekuß, A.; Ordon, F.; Wilbois, K.P.; Heß, J. Effects of soybean variety and Bradyrhizobium strains on yield, protein content and biological nitrogen fixation under cool growing conditions in Germany. Eur. J. Agron. 2016, 72, 38–46. [Google Scholar] [CrossRef]
  49. Carbonaro, M.; Maselli, P.; Nucara, A. Structural aspects of legume proteins and nutraceutical properties. Food Res. Int. 2015, 76, 19–30. [Google Scholar] [CrossRef]
  50. Couto, C.; Silva, L.R.; Valentão, P.; Velázquez, E.; Peix, A.; Andrade, P.B. Effects induced by the nodulation with Bradyrhizobium japonicum on Glycine max (soybean) metabolism and antioxidant potential. Food Chem. 2011, 127, 1487–1495. [Google Scholar] [CrossRef]
  51. Egamberdiyeva, D.; Qarshieva, D.; Davranov, K. The use of Bradyrhizobium to enhance growth and yield of soybean in calcareous soil in Uzbekistan. J. Plant Growth Regul. 2004, 23, 54–57. [Google Scholar] [CrossRef]
  52. El-Shaarawi, A.F.I.; Sabh, A.Z.; Abou-Taleb, S.M.; Ghoniem, A.E. Effect of inorganic nitrogen and Bradyrhizobium japonicum inoculation on growth and yield of soybean. Aust. J. Basic Appl. Sci. 2011, 5, 436–447. [Google Scholar]
  53. Martyniuk, S. Scientific and practical aspects of legumes symbiosis with root-nodule bacteria. Polish J. Agron. 2012, 9, 17–22. [Google Scholar] [CrossRef]
  54. Igiehon, N.O.; Babalola, O.O.; Cheseto, X.; Torto, B. Effects of rhizobia and arbuscular mycorrhizal fungi on yield, size distribution and fatty acid of soybean seeds grown under drought stress. Microbiol. Res. 2021, 242, 126640. [Google Scholar] [CrossRef] [PubMed]
  55. Aliasgharzad, N.; Neyshabouri, M.R.; Salimi, G. Effects of arbuscular mycorrhizal fungi and Bradyrhizobium japonicum on drought stress of soybean. Biologia 2006, 61, S324–S328. [Google Scholar] [CrossRef]
  56. Augé, R.M.; Moore, J.L.; Cho, K.; Stutz, J.C.; Sylvia, D.M.; Al-Agely, A.K.; Arnold, M. Relating foliar dehydration tolerance of mycorrhizal Phaseolus vulgaris to soil and root colonization by hyphae. J. Plant Physiol. 2003, 160, 1147–1156. [Google Scholar] [CrossRef] [PubMed] [Green Version]
  57. Marro, N.; Cofré, N.; Grilli, G.; Alvarez, C.; Labuckas, D.; Maestri, D.; Urcelay, C. Soybean yield, protein content and oil quality in response to interaction of arbuscular mycorrhizal fungi and native microbial populations from mono- and rotation-cropped soils. Appl. Soil Ecol. 2020, 152, 103575. [Google Scholar] [CrossRef]
  58. Sulieman, S.; Ha, C.V.; Esfahani, M.N.; Watanabe, Y.; Nishiyama, R.; Pham, C.T.B.; Nguyen, D.V.; Tran, L.S.P. DT2008: A promising new genetic resource for improved drought tolerance in soybean when solely dependent on symbiotic N2 fixation. BioMed Res. Int. 2015, 687213. [Google Scholar] [CrossRef] [Green Version]
  59. Salvagiotti, F.; Cassman, K.G.; Specht, J.E.; Walters, D.T.; Weiss, A.; Dobermann, A. Nitrogen uptake, fixation and response to fertilizer N in soybeans: A review. Field Crop. Res. 2008, 108, 1–13. [Google Scholar] [CrossRef] [Green Version]
  60. Jensen, E.S. Seasonal patterns of growth and nitrogen fixation in field-grown pea. Plant Soil 1987, 101, 29–37. [Google Scholar] [CrossRef]
  61. Tamagno, S.; Balboa, G.R.; Assefa, Y.; Kovács, P.; Casteel, S.N.; Salvagiotti, F.; García, F.O.; Stewart, W.M.; Ciampitti, I.A. Nutrient partitioning and stoichiometry in soybean: A synthesis-analysis. Field Crops Res. 2017, 200, 18–27. [Google Scholar] [CrossRef]
  62. Cafaro La Menza, N.; Monzon, J.P.; Specht, J.E.; Lindquist, J.L.; Arkebauer, T.J.; Graef, G.; Grassini, P. Nitrogen limitation in high-yield soybean: Seed yield, N accumulation, and N-use efficiency. Field Crops Res. 2019, 237, 74–81. [Google Scholar] [CrossRef]
  63. Cafaro La Menza, N.; Monzon, J.P.; Lindquist, J.L.; Arkebauer, T.J.; Knops, J.M.H.; Unkovich, M.; Specht, J.E.; Grassini, P. Insufficient nitrogen supply from symbiotic fixation reduces seasonal crop growth and nitrogen mobilization to seed in highly productive soybean crops. Plant Cell Environ. 2020, 43, 1958–1972. [Google Scholar] [CrossRef]
  64. Cafaro La Menza, N.; Monzon, J.P.; Specht, J.E.; Grassini, P. Is soybean yield limited by nitrogen supply? Field Crops Res. 2017, 213, 204–212. [Google Scholar] [CrossRef]
  65. Mourtzinis, S.; Kaur, G.; Orlowski, J.M.; Shapiro, C.A.; Lee, C.D.; Wortmann, C.; Holshouser, D.; Nafziger, E.D.; Kandel, H.; Niekamp, J.; et al. Soybean response to nitrogen application across the United States: A synthesis-analysis. Field Crops Res. 2018, 215, 74–82. [Google Scholar] [CrossRef]
  66. Ortez, O.A.; Salvagiotti, F.; Enrico, J.M.; Prasad, P.V.V.; Armstrong, P.; Ciampitti, I.A. Exploring nitrogen limitation for historical and modern soybean genotypes. Agron. J. 2018, 110, 2080–2090. [Google Scholar] [CrossRef] [Green Version]
  67. Rahim, N.; Kaleem Abbasi, M.; Hameed, S. Soybean seed quality characteristics in response to indigenous Bradyrhizobium inoculation and N fertilization in Kashmir-Pakistan. JAOCS, J. Am. Oil Chem. Soc. 2015, 92, 1165–1174. [Google Scholar] [CrossRef]
  68. IUSS Working Group WRB World Reference Base for Soil Resources 2014, First Update. 2015. Available online: https://icdc.cen.uni-hamburg.de/fileadmin/user_upload/icdc_Dokumente/WorldSoilResources_a-i3794e.pdf (accessed on 7 March 2021).
  69. Šimanský, V.; Bajčan, D.; Ducsay, L. The effect of organic matter on aggregation under different soil management practices in a vineyard in an extremely humid year. Catena 2013, 101, 108–113. [Google Scholar] [CrossRef]
  70. Lityński, T.; Jurkowska, H.; Gorlach, E. Agro- Chemical Analysis. Methodical Guide for Soils and Fertilizers’ Analysis; PWRiL: Warsaw, Poland, 1976. (In Polish) [Google Scholar]
  71. Skowera, B.; Jędrszczyk, E.; Kopcińska, J.; Ambroszczyk, A.M.; Kołton, A. The effects of hydrothermal conditions during vegetation period on fruit quality of processing tomatoes. Polish J. Environ. Stud. 2014, 23, 195–202. (In Polish). Available online: http://www.pjoes.com/The-Effects-of-Hydrothermal-Conditions-r-nduring-Vegetation-Period-on-Fruit-Quality,89183,0,2.html (accessed on 24 March 2021).
  72. Fernández-Marín, B.; Milla, R.; Martín-Robles, N.; Arc, E.; Kranner, I.; Becerril, J.M.; García-Plazaola, J.I. Side-effects of domestication: Cultivated legume seeds contain similar tocopherols and fatty acids but less carotenoids than their wild counterparts. BMC Plant Biol. 2014, 14, 1–11. [Google Scholar] [CrossRef] [Green Version]
  73. Yang, G.; Liu, N.; Lu, W.; Wang, S.; Kan, H.; Zhang, Y.; Xu, L.; Chen, Y. The interaction between arbuscular mycorrhizal fungi and soil phosphorus availability influences plant community productivity and ecosystem stability. J. Ecol. 2014, 102, 1072–1082. [Google Scholar] [CrossRef]
  74. Kalogeropoulos, N.; Chiou, A.; Ioannou, M.; Karathanos, V.T.; Hassapidou, M.; Andrikopoulos, N.K. Nutritional evaluation and bioactive microconstituents (phytosterols, tocopherols, polyphenols, triterpenic acids) in cooked dry legumes usually consumed in the Mediterranean countries. Food Chem. 2010, 121, 682–690. [Google Scholar] [CrossRef]
  75. Medic, J.; Atkinson, C.; Hurburgh, C.R. Current knowledge in soybean composition. J. Am. Oil Chem. Soc. 2014, 91, 363–384. [Google Scholar] [CrossRef]
  76. Howell, R.W.; Collins, F.I. Factors affecting linolenic and linoleic acid content of soybean oil. Agron. J. 1957, 49, 593–597. [Google Scholar] [CrossRef]
  77. Lee, J.D.; Woolard, M.; Sleper, D.A.; Smith, J.R.; Pantalone, V.R.; Nyinyi, C.N.; Cardinal, A.; Shannon, J.G. Environmental effects on oleic acid in soybean seed oil of plant introductions with elevated oleic concentration. Crop Sci. 2009, 49, 1762–1768. [Google Scholar] [CrossRef] [Green Version]
  78. Pisulewska, E.; Lorenc-Kozik, A.M.; Borowiec, F. Effect of nitrogen fertilisation level on seed yield, fat content and fatty acids composition of two soybean cultivars. Oilseed Crops 1999, 20, 511–520. (In Polish). Available online: http://biblioteka.ihar.edu.pl/oilseed_crops.php?field[slowa_kluczowe]=&field[autor]=&id=14&idd=417&podzial_id=2&podzial_idd=#lib (accessed on 9 March 2021).
  79. Bueno, R.D.; God, P.I.V.G.; Prata, I.O.; Pereira, P.H.S.; Teixeira, A.I.; Piovesan, N.D.; de Barros, E.G. Association of candidate genes for fatty acid content in soybean by temperature-switch PCR (TSP) genotyping. Crop Breed. Appl. Biotechnol. 2018, 18, 244–251. [Google Scholar] [CrossRef] [Green Version]
  80. Chapman, K.D.; Ohlrogge, J.B. Compartmentation of triacylglycerol accumulation in plants. J. Biol. Chem. 2012, 287, 2288–2294. [Google Scholar] [CrossRef] [Green Version]
  81. Sharifi, R.S.; Abtahi, S.M.; Ghaseminejad, P. Integrated fertilization systems effects on yield, nodulation state and fatty acids composition of soybean (Glycine max). Indian J. Agric. Sci. 2016, 86, 1010–1015. [Google Scholar]
  82. Szostak, B.; Głowacka, A.; Kasiczak, A.; Kiełtyka-Dadasiewicz, A.; Bąkowski, M. Nutritional value of soybeans and the yield of protein and fat depending on a cultivar and the level of nitrogen application. J. Elem. 2020, 25, 45–57. [Google Scholar] [CrossRef]
  83. Jaśkiewicz, T.; Sagan, A.; Masłowski, A. Effect of autoclaving time on the content of reactive lysine in autoclaved seeds of local soybean varieties. Food. Sci. Technol. Qual. 2010, 4, 73–80. (In Polish). Available online: http://www.pttz.org/zyw/wyd/czas/2010,%204(71)/06_Jaskiewicz.pdf (accessed on 3 March 2021).
  84. Kumar, V.; Rani, A.; Dixit, A.K.; Bhatnagar, D.; Chauhan, G.S. Relative changes in tocopherols, isoflavones, total phenolic content, and antioxidative activity in soybean seeds at different reproductive stages. J. Agric. Food Chem. 2009, 57, 2705–2710. [Google Scholar] [CrossRef]
  85. Subramanian, S.; Stacey, G.; Yu, O. Distinct, crucial roles of flavonoids during legume nodulation. Trends Plant Sci. 2007, 12, 282–285. [Google Scholar] [CrossRef] [Green Version]
  86. Zock, P.L.; Blom, W.A.M.; Nettleton, J.A.; Hornstra, G. Progressing insights into the role of dietary fats in the prevention of cardiovascular disease. Curr. Cardiol. Rep. 2016, 18. [Google Scholar] [CrossRef] [Green Version]
  87. Carter, D.A.; Thompson, W.R.; Taylor, C.E.; Pemberton, J.E. 2.2.49. Falling ball viscometer method. Eur. PHARMACOPOEIA 5.0. 2005, 3, 80–81. [Google Scholar]
  88. Boue, S.; Shih, B.Y.; Carter-Wientjes, C.H.; Cleveland, T.E.C. Identification of volatile compounds in soybean at various developmental stages using solid phase microextraction. J. Agric. Food Chem. 2003, 51, 4873–4876. [Google Scholar] [CrossRef]
  89. Cornara, L.; Xiao, J.; Burlando, B. Therapeutic potential of temperate forage legumes. Crit. Rev. Food Sci. Nutr. 2016, 56, 149–161. [Google Scholar] [CrossRef]
  90. Dąbrowski, K.J.; Sosulski, F.W. Composition of free and hydrolyzable phenolic acids in defatted flours of ten oilseeds. J. Agric. Food Chem. 1984, 32, 128–130. [Google Scholar] [CrossRef]
  91. Rennie, B.D.; Tanner, J.W. Fatty acid composition of oil from soybean leaves grown at extreme temperatures. J. Am. Oil Chem. Soc. 1991, 68, 1622–1624. [Google Scholar] [CrossRef]
  92. Carrera, C.; Martínez, M.J.; Dardanelli, J.; Balzarini, M. Environmental variation and correlation of seed components in nontransgenic soybeans: Protein, oil, unsaturated fatty acids, tocopherols, and isoflavones. Crop Sci. 2011, 51, 800–809. [Google Scholar] [CrossRef]
Figure 1. Weather conditions during soya bean growing season in the years 2016–2019.
Agronomy 11 00941 g001
Figure 2. The hydrothermal Sielianinov Index (K) during the growing season of soyabean (April–September) in 2016–2019: K ≤ 0.4 extremely dry (ed); 0.4 < K ≤ 0.7 very dry (vd); 0.7 < K ≤ 1.0 dry (d); 1.0 < K ≤ 1.3 relatively dry (rd); 1.3 < K ≤ 1.6 optimal (o); 1.6 < K ≤ 2.0 relatively humid (rh); 2.0 < K ≤ 2.5 humid (h); 2.5 < K ≤ 3.0 very humid (vh); K > 3.0 extremely humid (eh).
Agronomy 11 00941 g002
Table 1. Agricultural practices in experiment—type and date of treatments.
Treatment2016201720182019
Sowing29 April02 May24 April25 April
Herbicide spraying29 April02 May24 April26 April
Sencor Liquid 600SC (metribuzin 600 g dm3) dose 0.5 dm3 ha−1Boxer 800EC (prosulfocarb 800 g dm3) dose 4.0 dm3 ha−1
Insecticide spraying---10.06 Cyperkil Max 500EC (cypermethrin 500 g L−1) dose 1.5 L ha−1
Harvesting time29 August—Annushka and Aldana30 August—Annushka01 September—Aldana07 September—Annushka10 Septembe—Aldana27 August—Annushka and Aldana
Table 2. Characteristics of the soil prior to setting up the experiment at a depth of 0–25 cm.
Parametr2016201720182019
pH in 1 M KCl6.386.826.006.10
Soil Organic Carbon (SOC) (%)0.861.130.601.46
Content of available formsPhosphorus (mg kg−1)101162153214
Potassium (mg kg−1)201273163128
Magnesium (mg kg−1)134243106189
Iron (mg kg−1)1712303410452129
Manganese (mg kg−1)200402118307
Zinc (mg kg−1)12.113.810.713.0
Copper (mg kg−1)7.2611.63.827.26
Table 3. Fatty acids (FA) composition of G. max seeds (g FA 100 g seeds−1).
Fatty AcidsMean (g FA۰100 g seeds−1)±SD
Butyric acidC4:00.4300.329
Caproic acidC6:00.1170.080
Caprylic acidC8:00.1240.090
Capric acidC10:00.0510.050
Undecylic acidC11:00.1090.077
Lauric acidC12:00.0510.044
Tridecylic acidC13:00.0670.060
Myristic acidC14:00.1620.095
Myristoleic acidC14:10.0040.010
Pentadecanoic acidC15:00.0450.023
cis-10-PentadecenoicC15:10.0340.025
Palmitic acidC16:013.11.34
Palmitoleic acidC16:10.1480.034
Margaric acidC17:00.1160.019
Heptadecenoic acidC17:10.0910.059
Stearic acidC18:03.210.235
Oleic acidC18:1n919.02.59
Linoleic acidC18:2n652.81.64
α-linolenic acidC18:3n38.940.764
γ-linolenic acidC18:3n60.0830.047
Arachidic acidC20:00.2710.052
Eicosenoic acidC20:10.1810.041
Eicosedienoic acidC20:20.0900.025
Dihomo-g-linolenicC20:3n60.0240.028
Eicosatrienoic acidC20:3n30.0170.018
Arachidonic acidC20:4n60.0280.030
Eicosapentaenoic acidC20:5n30.1420.090
Heneicosanoic acidC21:00.0500.024
Erucic acidC22:1n90.0070.009
Eicosadienoic acidC22:20.0560.032
Docosaheptaenoic acidC22:6n30.0210.042
Tricosanoic acidC23:00.0630.033
Lignoceric acidC24:00.0830.076
Nervonic acidC24:10.0090.020
Table 4. Fatty acids (FA) composition of G. max seeds (g FA 100 g seeds−1), mean values for factors.
FactorsC14:0C16:0C16:1C18:0C18:1n9C18:2n6C18:3n3C18:3n6C20:020:1
Cultivars
Aldana0.165 ± 0.09512.9 b ± 1.350.157 a ± 0.0363.14 b * ± 0.1820.0 a ± 2.7452.3 b ± 1.528.85 b ± 0.720.080 ± 0.0480.259 b ± 0.0390.178 ± 0.036
Annushka0.159 ± 0.07713.4 a ± 1.300.139 b ± 0.0313.28 a ± 0.2618.1 b ± 2.0253.2 a ± 1.559.03 a ± 0.800.0860 ± 0.0460.283 a ± 0.0600.183 ± 0.047
Fertilization (kg∙ha−1 N)
00.168 ± 0.11212.7 b ± 1.690.141 b ± 0.0273.26 a ± 0.2319.2 ± 2.8952.8 ± 1.438.98 ± 0.680.083 ± 0.0490.295 a ± 0.0630.198 a ± 0.048
300.165 ± 0.08513.2 ab ± 1.280.143 ab ± 0.0233.18 b ± 0.2618.8 ± 2.2752.9 ± 1.548.97 ± 0.770.088 ± 0.0460.259 b ± 0.0480.170 b ± 0.038
600.153 ± 0.08813.4 a ± 0.890.159 a ± 0.0463.19 b ± 0.2219.1 ± 2.6652.5 ± 1.958.87 ± 0.860.077 ± 0.0470.258 b ± 0.0330.176 b ± 0.034
Inoculated
Without inoculation0.155 ± 0.08313.6 a ± 1.310.148 ± 0.0313.20 ± 0.2218.8 ± 2.4852.8 ± 1.198.98 ± 0.710.080 ± 0.0440.264 ± 0.0470.176 ± 0.037
HiStick®Soy0.166 ± 0.08612.7 b ± 1.510.148 ± 0.0433.25 ± 0.2119.4 ± 3.0352.7 ± 1.858.90 ± 0.880.090 ± 0.0510.282 ± 0.0630.188 ± 0.047
Nitragina0.164 ±0.11513.1 ab ± 1.100.148 ±0.0293.19 ± 0.2718.9 ± 2.2552.7 ± 1.868.94 ± 0.720.079 ± 0.0460.266 ± 0.0440.179 ± 0.040
Years
20160.161 b ± 0.03713.5 a ± 0.390.126 b ± 0.0153.16 b ± 0.1217.1 d ± 1.1954.6 a ± 0.739.35 b ± 0.250.098 ab ± 0.0410.259 bc ± 0.0150.168 bc ± 0.014
20170.251 a ± 0.08513.5 a ± 0.530.157 a ± 0.0223.39 a ± 0.1518.7 b ± 0.7552.2 c ± 0.558.36 c ± 0.250.115 a ±0.0510.300 a ± 0.0380.210 a ± 0.037
20180.161 b ± 0.08712.2 b ± 1.100.151 a ± 0.0522.95 c ± 0.1822.6 a ± 2.4251.4 d ± 1.828.21 c ± 0.510.064 b ± 0.0440.277 ab ± 0.0780.193 ab ± 0.051
20190.074 c ± 0.06913.4 a ± 1.140.159 a ±0.0283.35 a ± 0.1717.8 c ± 0.9052.9 b ± 1.049.85 a ± 0.280.054 b ± 0.0180.247 c ± 0.0430.153 c ±0.031
Mean0.162 ± 0.09513.1 ± 1.340.184 ± 0.0343.21 ± 0.2319.0 ± 2.5952.8 ± 1.648.94 ± 0.760.083 ± 0.0470.271 ± 0.0520.181 ± 0.041
CultivarNS***************NS**NS
FertilizationNS****NSNSNSNS*****
InoculationNS**NSNSNSNSNSNSNSNS
Years*****************************
* Values are expressed as mean ± SD. Means in a column followed by different letters show significant differences (p < 0.05) according to the Tukey test. Significance at: *** p  <  0.001; ** p  <  0.01; * p  <  0.05; NS not significant.
Table 5. Fatty acids (FA) composition of G. max seeds (g FA 100 g seeds−1), mean values for interaction cultivar × years.
Cultivar Year C14:0C16:0C16:1C18:0C18:1n9C18:2n6C18:3n6C18:3n3C20:0C20:1
Aldana20160.154 c ± 0.03413.3 ab ± 0.280.138 ± 0.0083.09 c ± 0.1118.2 d ± 0.4354.0 b ± 0.390.098 ± 0.0469.17 c ± 0.200.253 ± 0.013 0.172 ± 0.09
20170.282 a ± 0.10113.1a b ± 0.280.154 ± 0.0203.27 b ± 0.0919.2 c ± 0.5152.4 c ± 0.590.102 ±0.0508.13 e ± 0.120.292 ± 0.0150.218 ± 0.024
20180.162 c ± 0.09911.4 c ± 1.010.167 ± 0.0632.95 d ± 0.2124.3 a ± 1.7550.4 d ± 1.690.071 ± 0.0568.39 d ± 0.610.253 ± 0.0520.177 ± 0.030
20190.061 d ± 0.06513.8 ab ± 0.640.168 ± 0.0193.25 b ± 0.0818.4 cd ± 0.8852.4 c ± 0.970.049 ± 0.0109.72 b ± 0.300.238 ± 0.0440.147 ± 0.033
Annushka20160.166 c ± 0.04013.8 ab ± 0.310.113 ± 0.0103.22 b ± 0.0916.0 f ± 0.3655.2 a ± 0.420.100 ± 0.0389.53 b ± 0.130.265 ± 0.0150.164 ± 0.018
20170.221 b ± 0.05413.9 a ± 0.390.159 ± 0.0253.52 a ± 0.0918.1 d ± 0.5551.9 c ± 0.440.128 ± 0.0508.58 d ± 0.090.309 ± 0.0520.203 ± 0.047
20180.161 c ± 0.07912.9 b ± 1.050.134 ± 0.0322.94 d ± 0.1520.9 b ± 1.6452.4 c ± 1.390.056 ± 0.0298.03 e ± 0.330.301 ± 0.0940.208 ± 0.063
20190.088 d ± 0.07513.0 b ± 1.420.150 ± 0.0333.46 a ± 0.1717.2 e ± 0.5253.5 b ± 0.820.060 ± 0.0239.97 a ± 0.210.256 ± 0.0430.159 ± 0.029
Cultivar × Years ******NS**NSNS
* Values are expressed as mean ± SD. Means in a column followed by different letters show significant differences (p < 0.05) according to the Tukey test. Significance at: ** p  <  0.01; * p  <  0.05; NS not significant.
Table 6. Fatty acids (FA) composition of G. max seeds (g FA 100 g seeds−1), mean values for interaction cultivar × seed inoculation.
Cultivar Inoculated C14:0C16:0C16:1C18:0C18:1n9C18:2n6C18:3n6C18:3n3C20:0C20:1
AldanaWithout inoculation0.131 c ± 0.09213.0 ± 1.420.151 ± 0.0273.15 ± 0.1719.7 ± 2.8852.5 ± 1.130.071 c ± 0.0398.91 ± 0.690.267 ab ± 0.0460.186 ± 0.037
HiStick® Soy0.153 ab ± 0.09512.5 ± 1.590.159 ±0.0523.20 ± 0.1320.4 ± 3.1852.5 ± 1.830.078 c ± 0.0478.85 ± 0.850.263 ab ± 0.0360.177 ± 0.033
Nitragina0.210 a ± 0.13313.2 ± 0.990.160 ± 0.0233.07 ± 0.2219.9 ± 2.2951.8 ± 1.870.090 b ± 0.0589.80 ± 0.680.246 b ± 0.0500.173 ± 0.038
Annush-kaWithout inoculation0.180 ab ± 006914.1 ± 0.920.145 ± 0.0363.25 ± 0.2717.8 ± 1.6053.1 ± 1.220.089 b ± 0.0499.06 ± 0.750.260 ab ± 0.0800.167 ± 0.036
HiStick® Soy0.179 ab ± 0.07913.0 ± 1.450.137 ± 0.0283.30 ± 0.2618.4 ± 2.6652.8 ± 1.930.101 a ± 0.0548.94 ± 0.950.301 a ± 0.0800.199 ± 0.057
Nitragina0.118 c ± 0.07413.0 ± 1.240.133 ± 0.0283.31 ± 0.2717.9 ± 1.7953.7 ± 1.300.068 d ± 0.0299.09 ± 0.760.286 ab ± 0.0430.186 ± 0.043
Cultivar × Inoculation*NSNSNSNSNS*NS*NS
*Values are expressed as mean ± SD. Means in a column followed by different letters show significant differences (p < 0.05) according to the Tukey test. Significance at: * p  <  0.05; NS not significant.
Table 7. The content of SFA, UFA, MUFA, and PUFA (g FA 100 g seeds−1) as well as the ratio of SFA/UFA and C18:2n6/C18:3n3 in G. max seeds, mean values for factors.
FactorSFAMUFAUFAPUFASFA/UFAC18:2n6/C18:3n3
Cultivar
Aldana17.7 b ± 1.7220.5 a ± 2.7682.0 ± 1.7161.5b ± 2.060.22 ± 0.035.94 ± 0.42
Annushka 18.3 a ± 1.6318.5 b ± 2.0581.3 ± 1.6162.8a ± 2.010.23 ± 0.035.93 ± 0.4
Fertilsation (kg ∙ha−1 N)
017.7 b ± 2.1519.6 ± 2.9081.8 ± 1.8962.1 ± 2.360.22 ± 0.035.91 ± 0.38
3018.0 ab ± 1.4519.3 ± 2.2981.4 ± 1.7162.1 ±2.030.23 ± 0.035.93 ± 0.43
6018.3 a ± 1.4119.6 ± 2.6981.8 ± 1.4662.4 ± 2.010.22 ± 0.025.96 ± 0.48
Inoculated
Without inoculation18.3 a ± 1.6319.2 ± 2.4881.6 ± 1.6762.0 ± 2.260.23 ± 0.035.91 ± 0.43
HiStick®Soy17.7 b ± 1.9619.9 ± 3.0781.8 ± 1.5962.1 ± 2.250.22 ±0.025.96 ± 0.46
Nitragina18.1 ab ± 1.4819.4 ± 2.2781.7 ± 1.8562.4 ± 1.890.22 ± 0.035.93 ± 0.40
Years
201617.9 c ± 0.5517.5 d ± 1.1981.8b ± 0.5764.3a ± 0.920.22b ± 0.015.84 b ± 0.11
201719.3 a ± 0.7719.2 b ± 0.7680.3c ± 0.7761.1c ± 0.410.25a ± 0.016.25 a ± 0.21
201816.4 d ± 1.3023.1 a ± 1.4483.1a ± 2.1760.1c ± 2.130.20c ± 0.036.27 a ± 0.35
201918.4 b ± 1.2118.2 c ± 0.8981.4bc ± 1.1763.1b ± 1.230.23ab ± 0.025.38 c ± 0.13
Mean18.0 ± 1.7019.5 ± 2.6181.7 ± 1.6862.2 ± 2.120.23 ± 0.035.93 ± 0.43
Cultivar******NS***NSNS
Fertilization*NSNSNSNSNS
Inoculation*NSNSNSNSNS
Years*****************
* Values are expressed as mean ± SD. Means in a column followed by different letters show significant differences (p < 0.05) according to the Tukey test. Significance levels at: *** p  <  0.001; ** p  <  0.01; * p  <  0.05; NS not significant.
Table 8. The content of SFA, UFA, MUFA, and PUFA (g FA 100 g seeds−1), as well as the ratio of SFA/UFA and C18:2n6/C18:3n3 in G. max seeds. mean values for interaction cultivar × years.
Cultivar Year SFAMUFAUFAPUFASFA/UFAC18:2n6/ C18:3n3
Aldana201617.6 ± 0.4318.6 cd ± 0.63982.1 ± 0.4263.5ab ± 0.410.22 ± 0.015.79 c ± 0.07
201718.8 ± 0.6419.7 c ± 0.5180.8 ± 0.6461.0c ± 0.480.24 ± 0.016.05 b ± 0.06
201815.7 ± 1.2424.8 a ± 1.7784.0 ± 2.1659.2d ± 2.220.19 ± 0.036.53 a ± 0.19
201918.5 ± 0.9318.8 cd ± 0.8981.2 ± 0.9162.4bc ± 1.060.23 ± 0.015.36 d ± 0.09
Annushka201618.2 ± 0.5216.4 e ± 0.3081.5 ± 0.5565.1a ± 0.460.23 ± 0.015.89 bc ± 0.12
201719.8 ± 0.4918.7 cd ± 0.5479.8 ± 0.5461.1c ± 0.340.25 ± 0.016.44 a ± 0.06
201817.2 ± 1.2321.3 b ± 1.6882.6 ± 2.0661.1c ± 1.620.21 ± 0.036.02 b ± 0.29
201918.2 ± 1.4817.7 de ± 0.5381.5 ± 1.4163.8ab ± 0.980.23 ± 0.025.39 d ± 0.17
Cultivar × YearsNS**NS*NS***
* Values are expressed as mean ± SD. Means in a column followed by different letters show significant differences (p < 0.05) according to the Tukey test. Significance at: *** p  < 0 .001; ** p  <  0.01; * p  <  0.05; NS not significant.
Table 9. Regression equation for the profile of selected fatty acids.
DependentsRegression Equation (n = 72)R2FpSe
C14:0y = 0.503 + 0.363 (C13:0) ** + 0.0156 (C16:0) ** + 0.601 (C17:1) *** − 0.62 (C18:3n3) *** − 1.855 (C20:2) *** + 1.770 (C21:0) ***0.78644.5***0.438
C16:0y2 = 95.715 − 1.203 (C4:0) *** − 2.303 (C8:0) *** − 2.130 (C12:0) *** − 1.439 (C14:0) *** − 3.929 (C15:1) *** − 02.277 (C17:1) *** − 1.035 (C18:0) *** − 0.978 (C18:1n9) *** − 0.943 (18:2n6) *** − 0.957 (C18:3n3) *** − 2.254 (C20:0) *** − 2.331 (C24:0) *** − 1.919 (C22:6n3) **0.988453.7***0.146
C16:1y = 1.259 − 0.198 (C6:0) ** + 0.207 (C11:0) ** − 0.007 (C18:1n9) *** − 0.0184(C18:2n6) ***0.56423.9***0.023
C18:0y2 = 32.694 − 1.369 (C8:0) *** − 1.018 (C13:0) *** − 1.381 (C17:0) *** − 0.324 (C18:1n9) *** − 0.319 (C18:2n6) *** − 0.170 (C18:3n3) *** + 2.558 (C20:0) *** − 3.202 (C20:1) *** − 1.009 (C24:0) *** − 0.354 (C16:0) ***0.81031.3***0.102
C18:1n9y2 = 98.689 − 1.114(4:0) *** − 2.964 (C8:0) *** − 1.888 (C10:0) *** − 2.376 (C14:0) *** − 3.155 (C15:1) ** − 1.817 (C17:1) *** − 0.985 (C18:2n6) *** − 1.014 (C18:3n3) *** − 1.919 (C20:0) ** − 2.277 (C24:0) *** − 2.011 (C22:6n3) *** − 0.973 (C16:0) *** − 1.093 (C18:0) ***0.9971686***0.147
C18:2n6y2 = 97485 − 1.161 (C4:0) *** − 3.038 (C8:0) *** − 1.980 (C10:0) *** − 2.894 (C14:0) *** − 3.110 (C15:1) ** − 0.965 (C18:3n3) *** − 2.007 (C20:0) ** − 2.136 (C24:0) *** − 2.154 (C22:6n3) *** − 0.890 (C16:0) *** − 0.939 (C18:0) *** − 0.976 (C18:1n)0.992710.6***0.143
C18:3n3y2 = 87.922 − 1.057 (C4:0) *** − 2.497 (C8:0) *** − 1.801 (C10:0) *** − 2.474 (C14:0) *** − 2.718 (C15:1) ** − 1.495 (C17:1) ** − 2.247 ((C20:0) *** − 1.956 (C24:0) *** − 1.728 (C22:6n3) ** − 0.863 (C16:0) *** − 0.845 (C18:0) *** − 0.893 (C18:1n9) ***−0.866 (C18:2n6) ***0.966147,8***0.140
C18:3n6y = 0.024 + 0.268 (C12:0) *** + 0.385 (C17:1) *** + 0.494 (C22:6n3) ***0.67951.2***0.026
C20:0y = 0.080 − 0.104 (C11:0) ** − 0.3667 (C17:0) ** + 0.086 (C18:0) *** − 0.005 (C18:2n6) ** + 1.001 (C20:1) *** + 0.471 (C21:0) *** − 0.559 (C21:0) *** + 0.215 (C23:0) **0.923116.3***0.014
C20:1y = 0.104 − 0.042 (C18:0) *** + 0.487 (C21:0) *** + 0.691 (C20:0) ***0.885183.6***0.014
Significance at: *** p  <  0.001; ** p  <  0.01.
Publisher’s Note: MDPI stays neutral with regard to jurisdictional claims in published maps and institutional affiliations.

