Article

The Application of Multiple Linear Regression and Artificial Neural Network Models for Yield Prediction of Very Early Potato Cultivars before Harvest

by
Magdalena Piekutowska
1,*,†,
Gniewko Niedbała
2,*,†,
Tomasz Piskier
3,
Tomasz Lenartowicz
4,
Krzysztof Pilarski
2,
Tomasz Wojciechowski
2,
Agnieszka A. Pilarska
5 and
Aneta Czechowska-Kosacka
6
1
Department of Geoecology and Geoinformation, Institute of Biology and Earth Sciences, Pomeranian University in Słupsk, 27 Partyzantów St., 76-200 Słupsk, Poland
2
Department of Biosystems Engineering, Faculty of Environmental and Mechanical Engineering, Poznań University of Life Sciences, Wojska Polskiego 50, 60-627 Poznań, Poland
3
Department of Agrobiotechnology, Faculty of Mechanical Engineering, Koszalin University of Technology, Racławicka 15-17, 75-620 Koszalin, Poland
4
Research Centre for Cultivar Testing (COBORU), 63-022 Słupia Wielka, Poland
5
Department of Plant-Derived Food Technology, Poznań University of Life Sciences, ul. Wojska Polskiego 31, 60-624 Poznań, Poland
6
Department of Environmental Protection Engineering, Faculty of Environmental Engineering, Lublin University of Technology, Nadbystrzycka 40B, 20-618 Lublin, Poland
*
Authors to whom correspondence should be addressed.
These authors contributed equally to this work.
Agronomy 2021, 11(5), 885; https://doi.org/10.3390/agronomy11050885
Submission received: 23 March 2021 / Revised: 26 April 2021 / Accepted: 27 April 2021 / Published: 30 April 2021
(This article belongs to the Special Issue Crop Yield Prediction in Precision Agriculture)

Abstract

:
Yield forecasting is a rational and scientific way of predicting future occurrences in agriculture—the level of production effects. Its main purpose is reducing the risk in the decision-making process affecting the yield in terms of quantity and quality. The aim of the following study was to generate a linear and non-linear model to forecast the tuber yield of three very early potato cultivars: Arielle, Riviera, and Viviana. In order to achieve the set goal of the study, data from the period 2010–2017 were collected, coming from official varietal experiments carried out in northern and northwestern Poland. The linear model has been created based on multiple linear regression analysis (MLR), while the non-linear model has been built using artificial neural networks (ANN). The created models can predict the yield of very early potato varieties on 20th June. Agronomic, phytophenological, and meteorological data were used to prepare the models, and the correctness of their operation was verified on the basis of separate sets of data not participating in the construction of the models. For the proper validation of the model, six forecast error metrics were used: i.e., global relative approximation error (RAE), root mean square error (RMS), mean absolute error (MAE), and mean absolute percentage error (MAPE). As a result of the conducted analyses, the forecast error results for most models did not exceed 15% of MAPE. The predictive neural model NY1 was characterized by better values of quality measures and ex post forecast errors than the regression model RY1.

1. Introduction

Estimating the yield of arable crops can be defined as predicting the size of the final crop yield of a given plant species, assuming that the environmental conditions characterizing a given growing season will be similar to many-year averages. Timely and accurate forecasts of crop yields before harvest are critical to the functioning of food markets. In addition, they are an important element of the organization of agricultural production [1,2,3]. Achieving maximum yields in terms of quantity and quality with a minimum level of inputs is the main goal of all producers in their pursuit of cost-efficient plant production [4]. Early determination of factors disturbing the proper yielding of plants may lead to the reduction of production losses and the achievement of planned profits.
The potato is one of the most popular cultivated plants in the world. In Europe (data from 2018), the average yield from potato cultivation per one hectare of plantation amounted to 22.12 tons. The potato was grown on 4.7 million hectares, with a total of 105 million tons being harvested. In Poland, in the same year, the potato was produced on 297,000 hectares, and the average yield per hectare was 25.13 tons. The total tuber yield reached a value of approximately 7.5 million tons [5]. The production of very early potatoes intended for early harvesting is now becoming more popular. In Poland, it falls on average for a period of 40 days from full sprouting, i.e., 60 to 75 days from planting [6]. According to EUROSTAT data [7], in Europe in 2018, early potato constituted 7.6% of total intra-community exports. Very early and early potatoes, supplied to European markets, are mainly imported from countries outside the European Union, i.e., Egypt and Israel, which accounts for as much as 78.8% of total imports.
An important fact is that the production of potatoes intended for early harvest in Poland is highly threatened by ground frost in the initial stages of plant vegetation. The failure to cultivate such varieties is potentially greater in the region of northern and eastern Poland, where spring appears relatively late [6]. When the temperature drops sharply, the tubers and the first leaves are damaged. To prevent this negative occurrence, covers are used to protect the mother tubers and accelerate the emergence of plants [8,9].
Predicting agricultural events, including crop yield, is a complicated and multidirectional task. In general, the final yield result depends on many factors affecting the cultivation from the beginning of plant vegetation [10,11,12]. Some of the yield-forming factors show high variability during the agronomic season, which makes their formal interpretation difficult [13]. The interactions between the groups of factors influencing the size and quality of the final yield are also important [11,14]. It should be remembered that the ability to forecast any natural phenomenon is associated with perfect knowledge of the research object. The level of yielding of agricultural species depends on many primary factors related to soil (soil abundance in bio-available nutrients, pH, soil type and kind), weather (average daily air temperature, precipitation, insolation, etc.), and genotype [3,12,15]. The secondary factors include the level of organic and mineral fertilization, regulation of soil pH, adopted strategies for protection against diseases, weeds and pests, forecrop species, achievement of subsequent development stages, biomass of soil microorganisms, etc. Practical forecasting of crop yield also uses data related to the measurements carried out during the growing season (vegetation indices, LAI, etc.) [16,17].
Therefore, the choice of independent variables to build a predictive model is a kind of compromise that is done by the maker. First, select data; these are available throughout the forecast period. However, some of the modeling methods, e.g., neural networks, deal with incomplete data, but the full scope of data always has a positive effect—it reduces forecast errors.
Most of the forecasting models, the description and verification of which are the subject of numerous studies of the discussed range, use classic modeling methods. Unfortunately, these models are characterized by low reliability, which means that they do not fully reflect the highly probable outcome of the crop yield. Classic models of plant yielding are mathematical models, the course of which may be both linear and non-linear. The most common models that allow for yield forecasting are regression models. This method allows us to study the relationship between independent variables and the dependent variable. The multiple linear regression (MLR) method is used to predict the yield, because its variability is determined by many independent variables [18,19].
The most commonly modeled processes using classical methods are plant growth, development, and yield. First, the results generated by such a model are of great economic importance. Secondly, the obtained models are often the basis for developing simulations of environmental, climatic or constraint conditions, i.e., effects of pathogens, supply of available nutrients, environmental factors [20]. Known yield models for potato are related to growth, plant development and potential yield: POTATO 1. [21,22], POTATO 2. [23]; and actual yield: SUBSTOR-Potato [24,25,26], LINTUL-POTATO [27], POTATOS [28], NPOTATO [28], CropSystVB-CSPotato [29]. Predictive models and decision support systems are also worth mentioning: PLANT-PLUS makes it possible to predict the occurrence of various diseases in potato cultivation, especially potato blight [30]; MAPP (Management Advisory Package for Potatoes) makes it possible to optimize the planting and harvesting process based on data on the cultivar grown, price and size of seed potatoes, and expected profits [20].
Nowadays, efforts are made to produce more accurate predictive models, such as artificial neural networks (ANN) [31,32,33,34,35]. The mentioned models belong to the non-linear model group that enables the description of complex phenomena and processes occurring in nature. They are characterized by a better quality and accuracy of the forecast, allowing for quick and precise analysis with many input variables, and the use of linguistic (qualitative) parameters [3,12,17,36,37,38]. An important cognitive aspect is to enrich the analyses of neural modeling with the evaluation of factors responsible for the yielding of plants under field conditions. Indicating ranks of individual independent variables is particularly important for those parameters that can be controlled during the growing season before the harvest [38]. Predicting crop yields makes sense only if the forecasts are made before harvest. That is why it is so important to choose the key development stages in terms of yield formation. From the point of view of potato cultivation at a very early stage, the development of yield prognostic models before the planned harvest will significantly facilitate its production and enable control of the harvest date.
The aim of the following work is to develop forecasting models of tuber yield of three very early potato cultivars (Arielle, Riviera, and Viviana) grown in Poland. The forecast takes place on a specific day of the calendar year; i.e., June 20. In the article, the authors compared the prediction accuracy of the regression model (RY1) and the neural model (NY1).

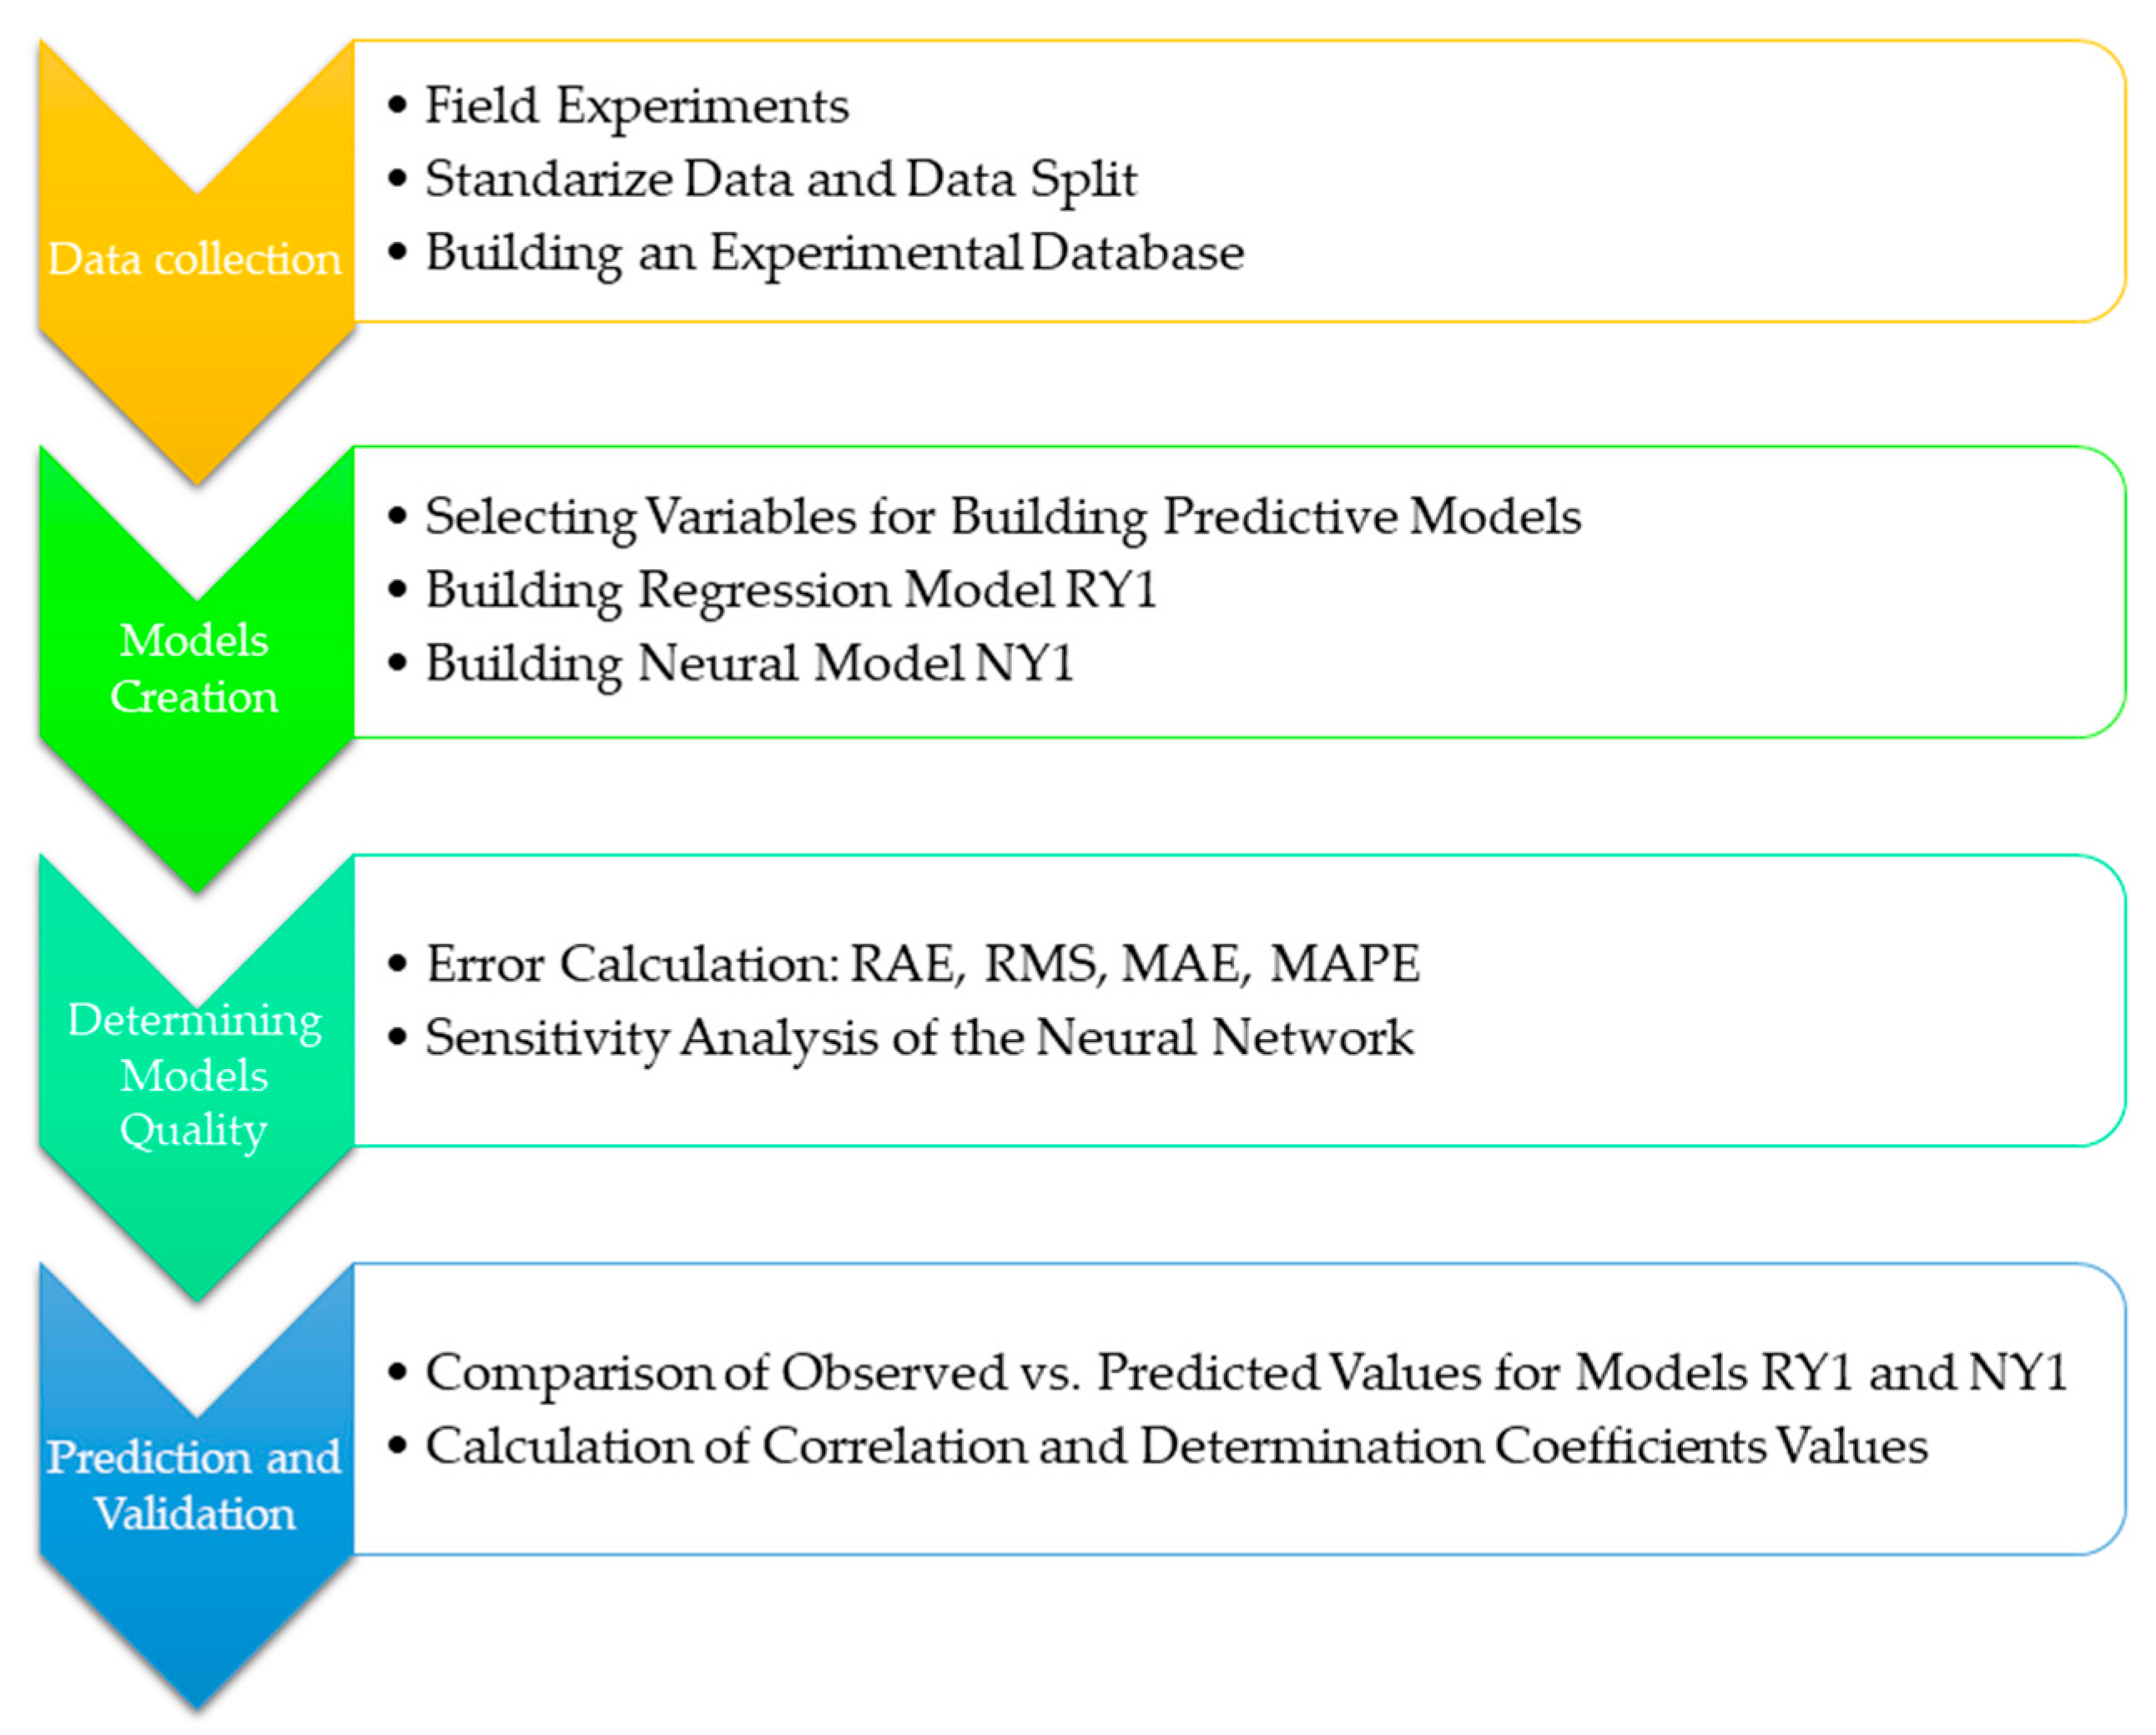
2. Materials and Methods

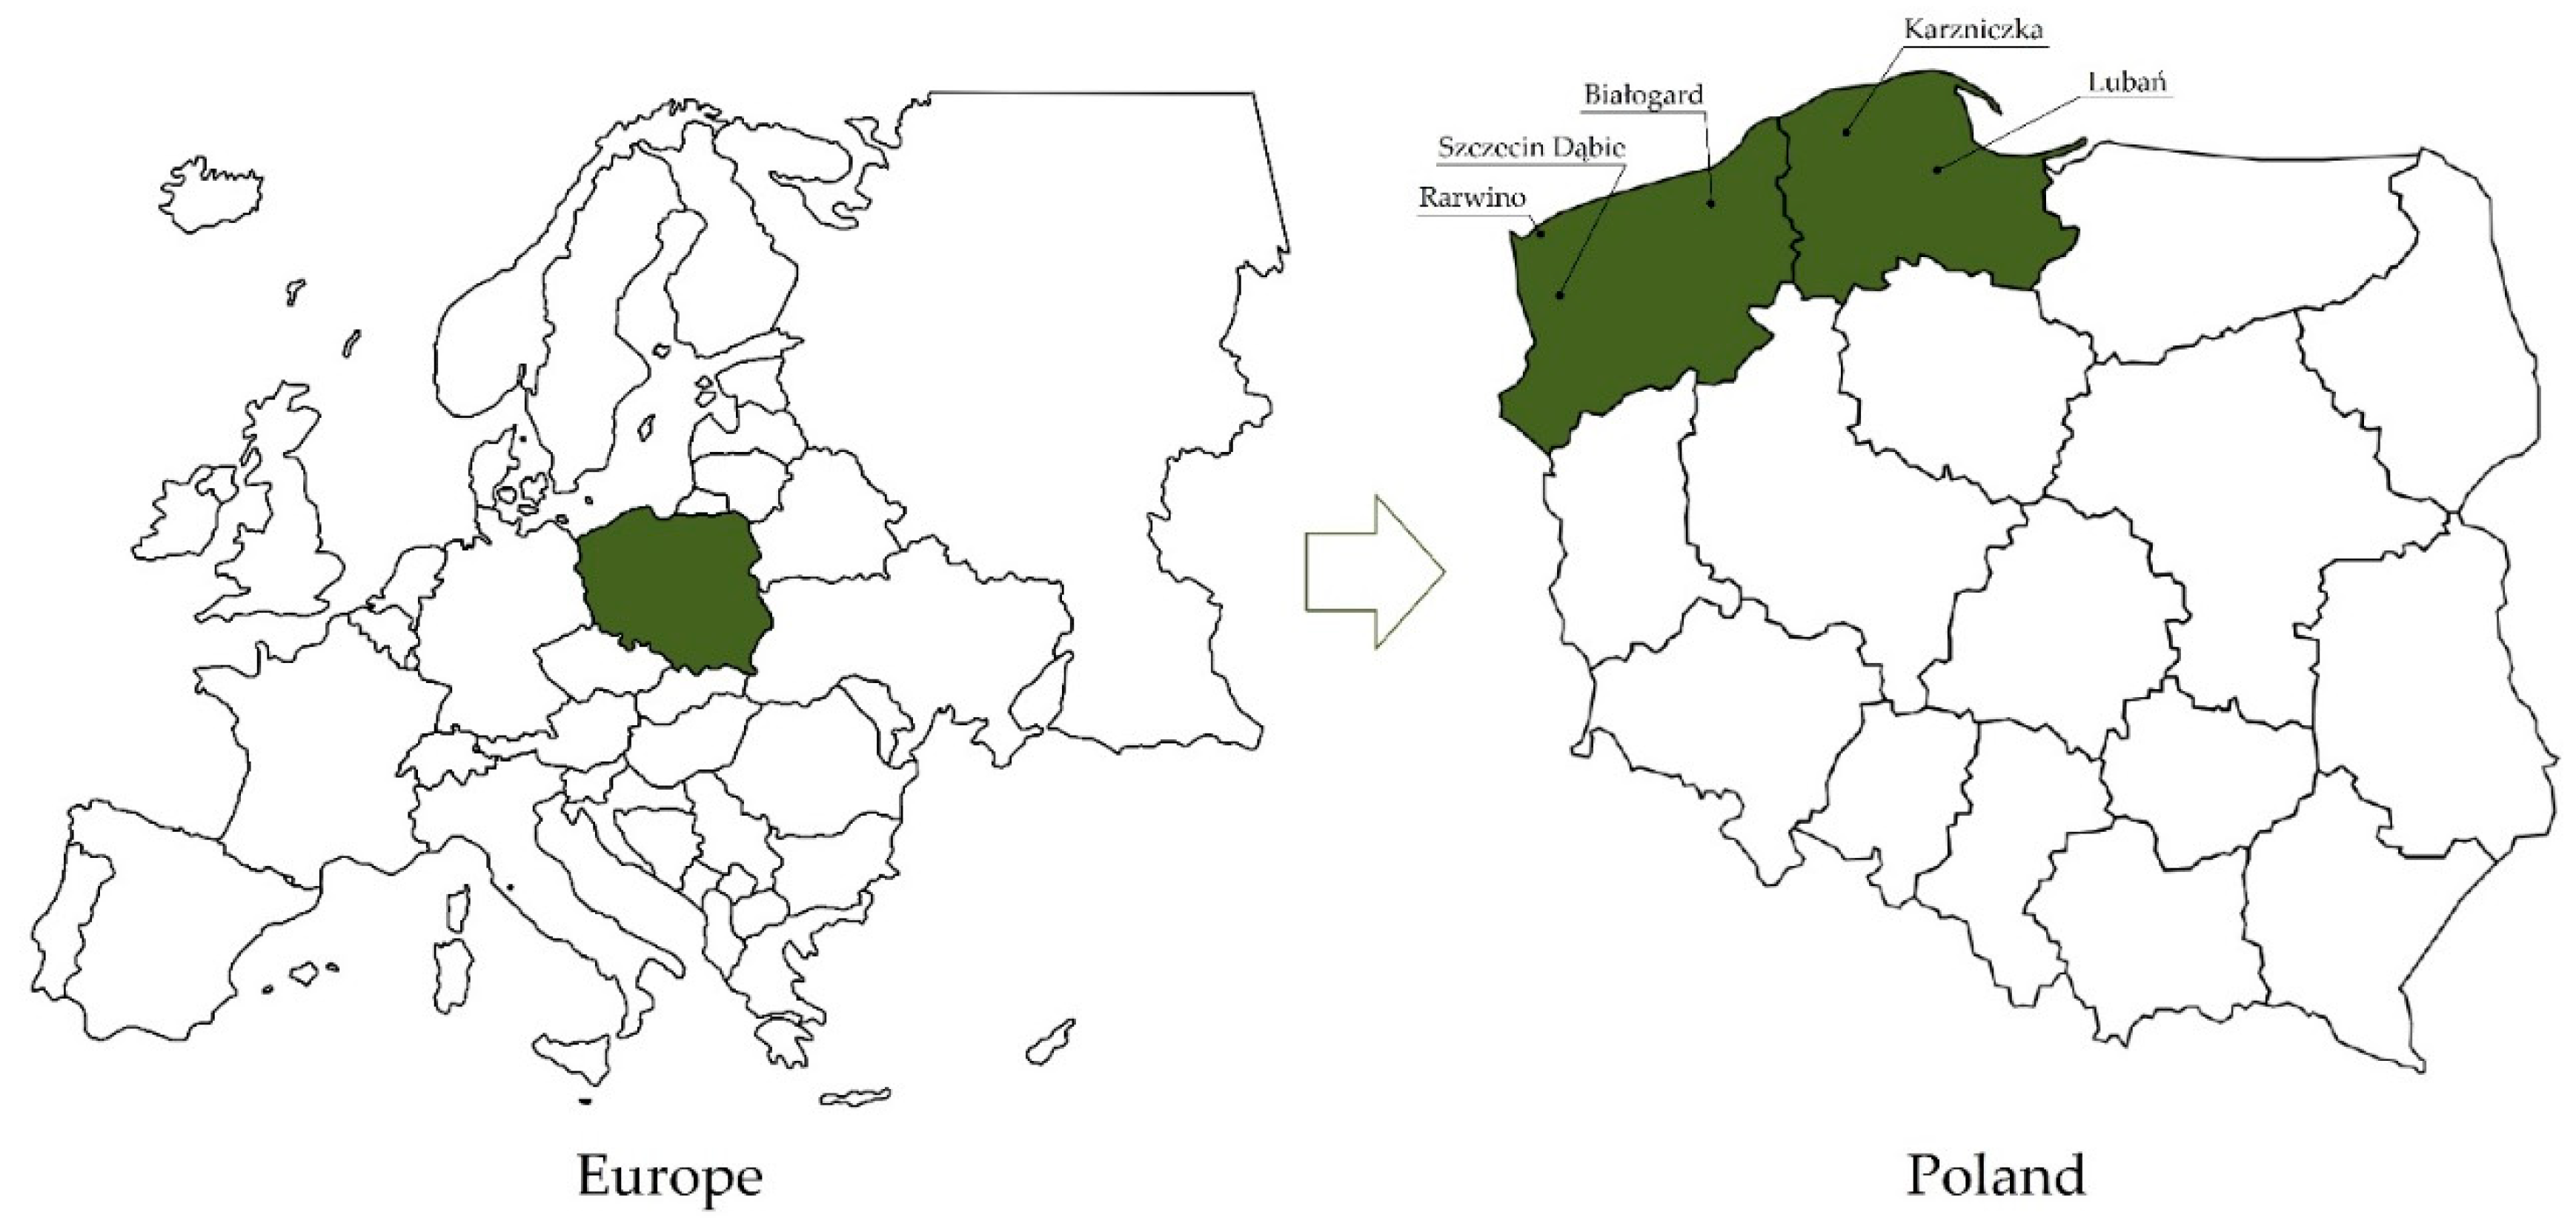
2.1. Experiment Location and Research Material

For the need of performing the research, data from Research Center’s for Cultivar Testing (COBORU) [39,40] system field trial books were used, which were created on the basis of the results of official cultivar experiments with very early potato harvested 40 days after full emergence. Predictive linear and non-linear models were built for three potato varieties: Arielle, Riviera, and Viviana. The mentioned varieties occupy leading positions in potato tubers production in Poland. The field experiments were performed in the field units of the COBORU and the Pomeranian Agricultural Advisory Center in Lubań in 2010–2017. The following research uses data from the area of northern and northwestern Poland (Figure 1), i.e., the Experimental Station for Variety Testing in Karzniczka and Szczecin Dąbie, the Experimental Station for Variety Testing in Rarwino and Białogard, and the Pomeranian Agricultural Advisory Center (PODR) in Lubań. The Central Research Center for Cultivar Testing is a unit responsible for conducting and adapting the system of Polish cultivar experimentation to the market economy and European Union standards. The results used in the presented study come from the fields managed as part of the Post-Registration Variety Testing.
Data for the construction of linear and non-linear models can be divided into several groups. The first one represents agronomic and phytophenological data as well as yielding results. These data were obtained from COBORU’s system field books. The second group contains weather data obtained directly from the electronic database of meteorological phenomena and observations as well as meteorological summary charts registered at each of the research points. In the absence of measurement data from the meteorological stations of the above-mentioned units, for example the insolation sum, observation, and measurement data from the archival resources of the Institute of Meteorology and Water Management—National Research Institute—synoptic and climatic stations located as close as possible to the experimental points were used. If, for some reasons, data on soil abundance in basic nutrients were missing, the results of current reports on soil tests carried out by Regional Chemical-Agricultural Stations were used during the preparation of the data for the models. Figure 2 show the general framework of the paper.

2.2. Field Experiments

The experiments are performed on very early potatoes intended for early harvest in three trials, with each being a separate repetition. For experiments in which the number of tested variants is less than or equal to 15, a randomized complete block system is applied. When the number of objects is greater than 16, the experiment is assumed as incomplete block designs (reducible 1—simple). The area of a single plot is about 15 m2 depending on the adopted spacing between the rows. When using the recommended row spacing of 75 cm, the distance between plants in a row is 33 cm. In a single field, 60 tubers are planted in two adjacent ridges. Harvesting takes place approximately 40 days after full sprouting.

2.3. Building an Experimental Database

The total number of fields for experiments with Arielle, Riviera, and Viviana potato cultivars in the Experimental Station for Variety Testing (SDOO) in Karzniczka and Szczecin Dąbie, ZDOO in Białogard and Rarwino and PODR in Lubań in 2010–2017 amounted to 324 plots. Each plot represented a separate analyzed case. Information from a single plot was the basis for constructing predictive models thanks to separate sets: Ap and Bp. The Ap set (300 cases) contained data that were used to build a linear and nonlinear model. The Bp set (24 cases) did not participate directly in the construction of the models because the data contained therein was used for their validation. It should be also added that the cases included in the Bp set were selected not completely randomly, i.e., from each research year, one case representing each variety was selected. The dependent variable for each of the prognostic models was the tuber yield (t∙ha−1) collected 40 days from full emergence [YIELDP1].
The construction of the linear (RY1: R—regression model, Y—yield, 1—first crop of the year) and non-linear (NY1: N—neural model, Y—yield, 1—first crop of the year) yield prediction model was made on the basis of the expected date of the calendar year, i.e., 20th of June. Analysis of the experimental data from five research points from 2010–2017 showed that the Arielle, Riviera, and Viviana varieties intended for early harvest were collected at the earliest on June 24 and at the latest on July 11. The most common harvest took place on June 30. The suggested date of prediction, which is June 20, is the period of variety full bloom in a typical year. This means that forecasting the yield before the proposed date would be unjustified due to the intensive accumulation of biomass and building of tuber by flowering plants.

2.4. Selecting Variables for Building Predictive Models

Reliable evaluation of the prognostic properties of the developed linear and nonlinear models is possible when these models are created and verified on the basis of the same dependent and independent variables. The detailed definitions of independent variables and dependent variable used in the regression and neural model are presented in Table 1.

2.5. The Method of Building a Linear Forecasting Model (MLR)

Multiple linear regression is the most commonly used form of linear regression. As a predictive tool, it allows us to explain the relationship between many independent variables (X1, X2 Xk) and the tested dependent variable (Y) [41]. The coefficient of determination R2 explains the percentage variability of the dependent variable explained by the model. In other words, it is a measure of the model’s goodness-of-fit.
The computational problem of multiple regression is to fit a straight line to a set of points. The most frequently used method for its implementation is the least squares approach. The method enables the adjustment of the regression equation parameters so that the sum of squared distances of the measurement points from the determined straight line is as small as possible.
The regression line equation takes the form of:
Y = βo + β1 × 1 + β2X2 + βkXk + ε
where
Y—dependent variable (explained variable),
X1, X2…Xk—independent variables (explanatory variable),
βo, β1, β2…βk—equation parameters,
ε—random component (rest of the model).
The construction of the linear model RY1 was performed on the basis of the data contained in the Ap set, whereas verification on the set Bp.

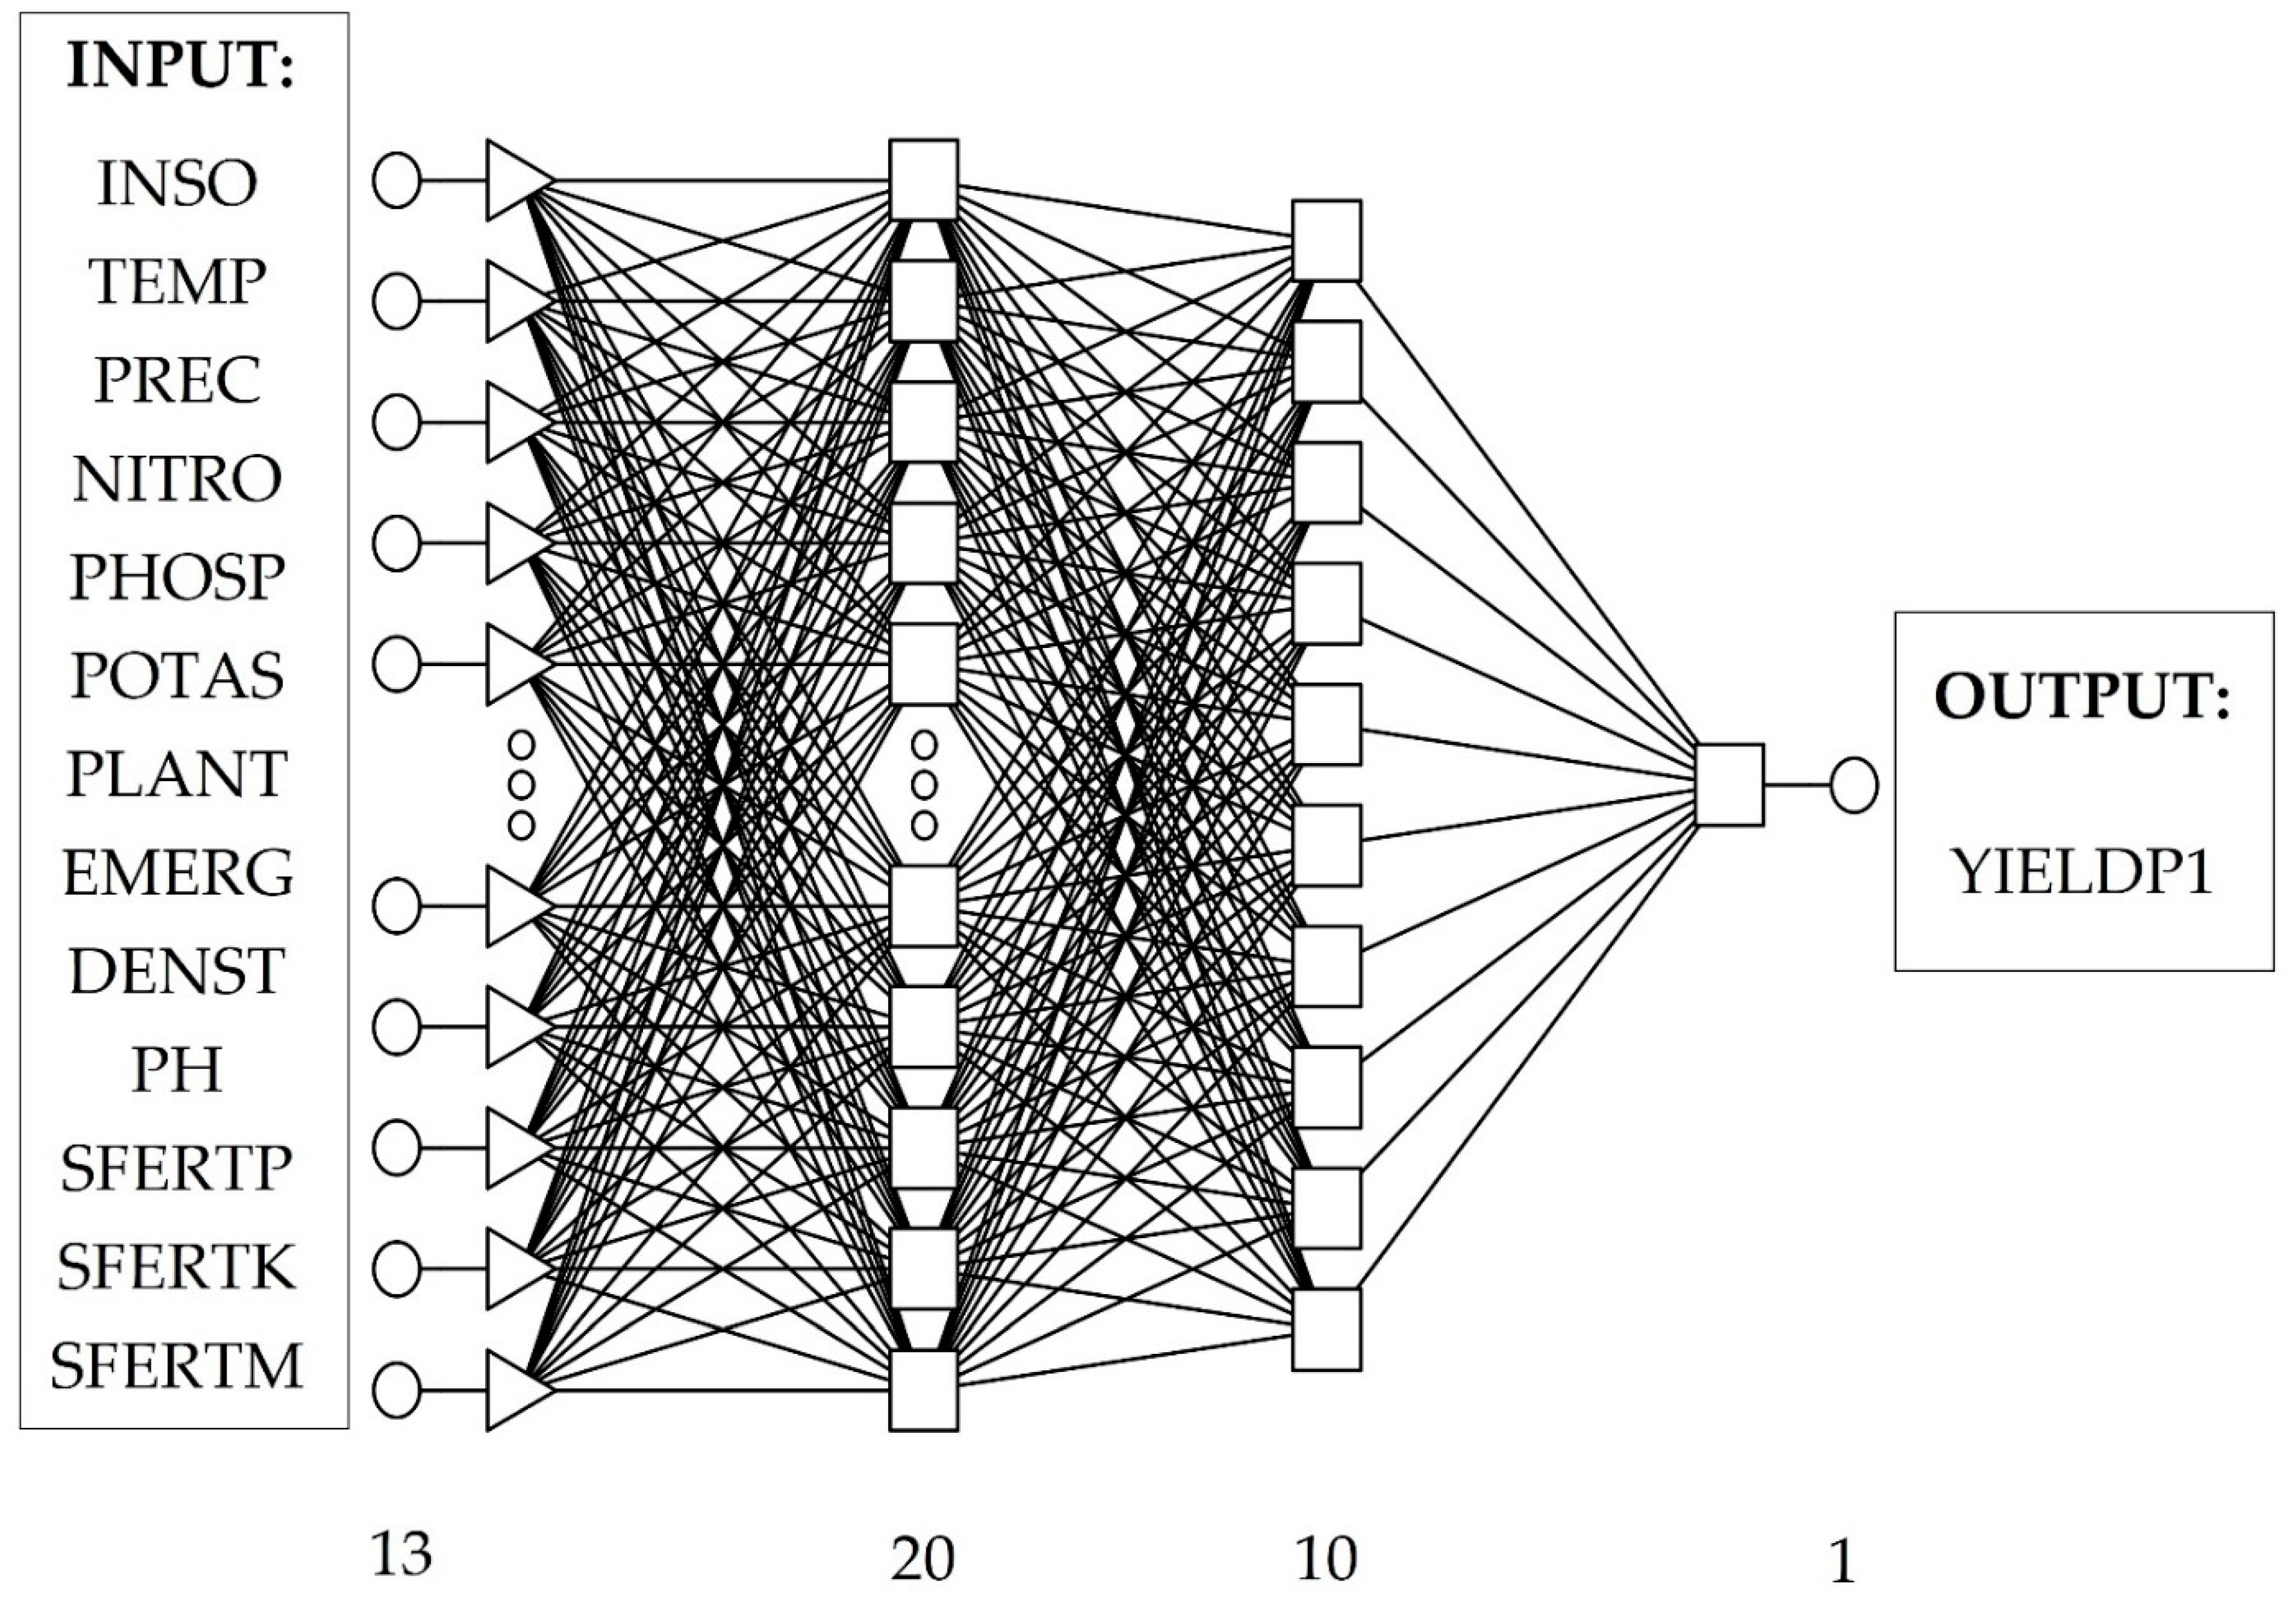
2.6. The Method of Building a Non-Linear Forecasting Model (ANN)

The Bp non-linear forecasting model was built on the basis of the independent variables presented in Table 1. As in the case of linear model, the explained variable by the non-linear model was tuber yield (t∙ha−1) harvested 40 days from full emergence [YIELDP1].
The choice of the best network architecture and the optimal learning method was made on the basis of the assessment of the network’s ability to generalize and approximate, based on the established measures of their quality. It was assumed that the best network can be obtained when the sum error of squared differences is the smallest. Using Statistica v7.1, it was possible to test networks with different architectures. Evaluation of network quality parameters enabled for selection of best network:
σB—standard deviation of the error,
x MB—mean value of the error modules,
Iσ—standard deviation quotient,
r—correlation coefficient,
R2—coefficient of determination.
The Automatic Network Designer (AND) for testing 10,000 networks was used [42,43]. The performed calculations and a detailed analysis of the literature allowed us to select the best type of neural network architecture. For the discussed case, an MLP (Multilayer Perceptron) network with two hidden layers was selected; i.e., 13 neurons in 1 hidden layer, 20 neurons in the second hidden layer, and 1 neuron at the output layer. For the purposes of training and testing the MLP network, the Ap subset, on the basis of which the neural model was built, was randomly divided into training (U), validation (W), and test (T) sets. The number of harvests kept a constant proportion of 50%, −25%, and −25%. The set sizes were as follows: training: 150 cases, validation: 75 cases, test: 75 cases. MLP 13:13-20-10-1:1 neural network was trained using two methods, i.e., backpropagation (100 epochs) and conjugate gradients (135 epochs).
In order to determine the forecast errors of tuber yield of very early potato cultivars, the differences between the actual values and those predicted by the RY1 and NY1 models were used. Determining the accuracy of the forecasts was carried out by calculating the values of the forecasting properties of the models.
RAE—relative approximation error;
R A E = i = 1 n ( y i y ^ i ) 2 i = 1 n ( y i ) 2
RMS—root mean square error;
R M S = i = 1 n ( y i y ^ i ) 2 n
MAE—mean absolute error;
M A E = 1 n i = 1 n | y i y ^ i |
MAPE—mean absolute percentage error;
M A P E = 1 n i = 1 n | y i y ^ i y i | 100 %
where
n—number of observations,
y i —actual values obtained during the tests,
y i ¯ average values,
y ^ i —values determined by the model.

2.7. Neural Network Sensitivity Analysis

The last stage of constructing a NY1 neural model was to perform a sensitivity analysis of the neural network. Such analysis would indicate and broadly interpret the importance (rank) of the explanatory variables in shaping the variability of the explained variable. The result of this test is written in numerical form, and the greater the value assigned to a given independent variable, the more it affects the yield. All values below 1 have a small effect on the yield of the given independent variable. Such a variable can be removed from the model, and then new analyses shall be performed.

3. Results

3.1. Comparing Quality of Forecasting Models of Potato Tuber Yield 40 Days after Full Emergence

The developed RY1 regression model was based on 13 independent variables (Table 1). As in the case of the NY1 model, the dependent variable was the tuber yield harvested 40 days from full emergence. The detailed results of the multiple regression analysis for the presented independent features and dependent feature are presented in Table 2.
The factors for which the statistical significance at the level of α = 0.05 was not confirmed were: TEMP (mean daily air temperature [°C] in the periods: planting—June 20), PHOSP (sum of phosphorus fertilization [kg∙ha−1]), and POTAS (sum of potassium fertilization [kg∙ha−1].
Basing on the results from Table 2, the multiple regression equation was constructed, which took the form (5):
Yield20June = 0.038∙INSO + 0.025∙INSO + 0.087∙NITRO + 1.604∙PLANT − 0.509∙EMERG + 0.414∙DENST + 3.349∙SFERTP − 0.224∙SFERTK − 0.418∙SFERTM.
The selection of the best neural network that forecasts the yield of tubers of three potato varieties—Arielle, Denar, and Viviana—on June 20 was based on the analysis of the values of basic qualitative measures and error values for the training, validation, and test sets. The overall results for the network were taken into account (Table 3).
Figure 3 presents a diagram of the MLP 13:13-20-10-1:1 neural network creating the NY1 model.

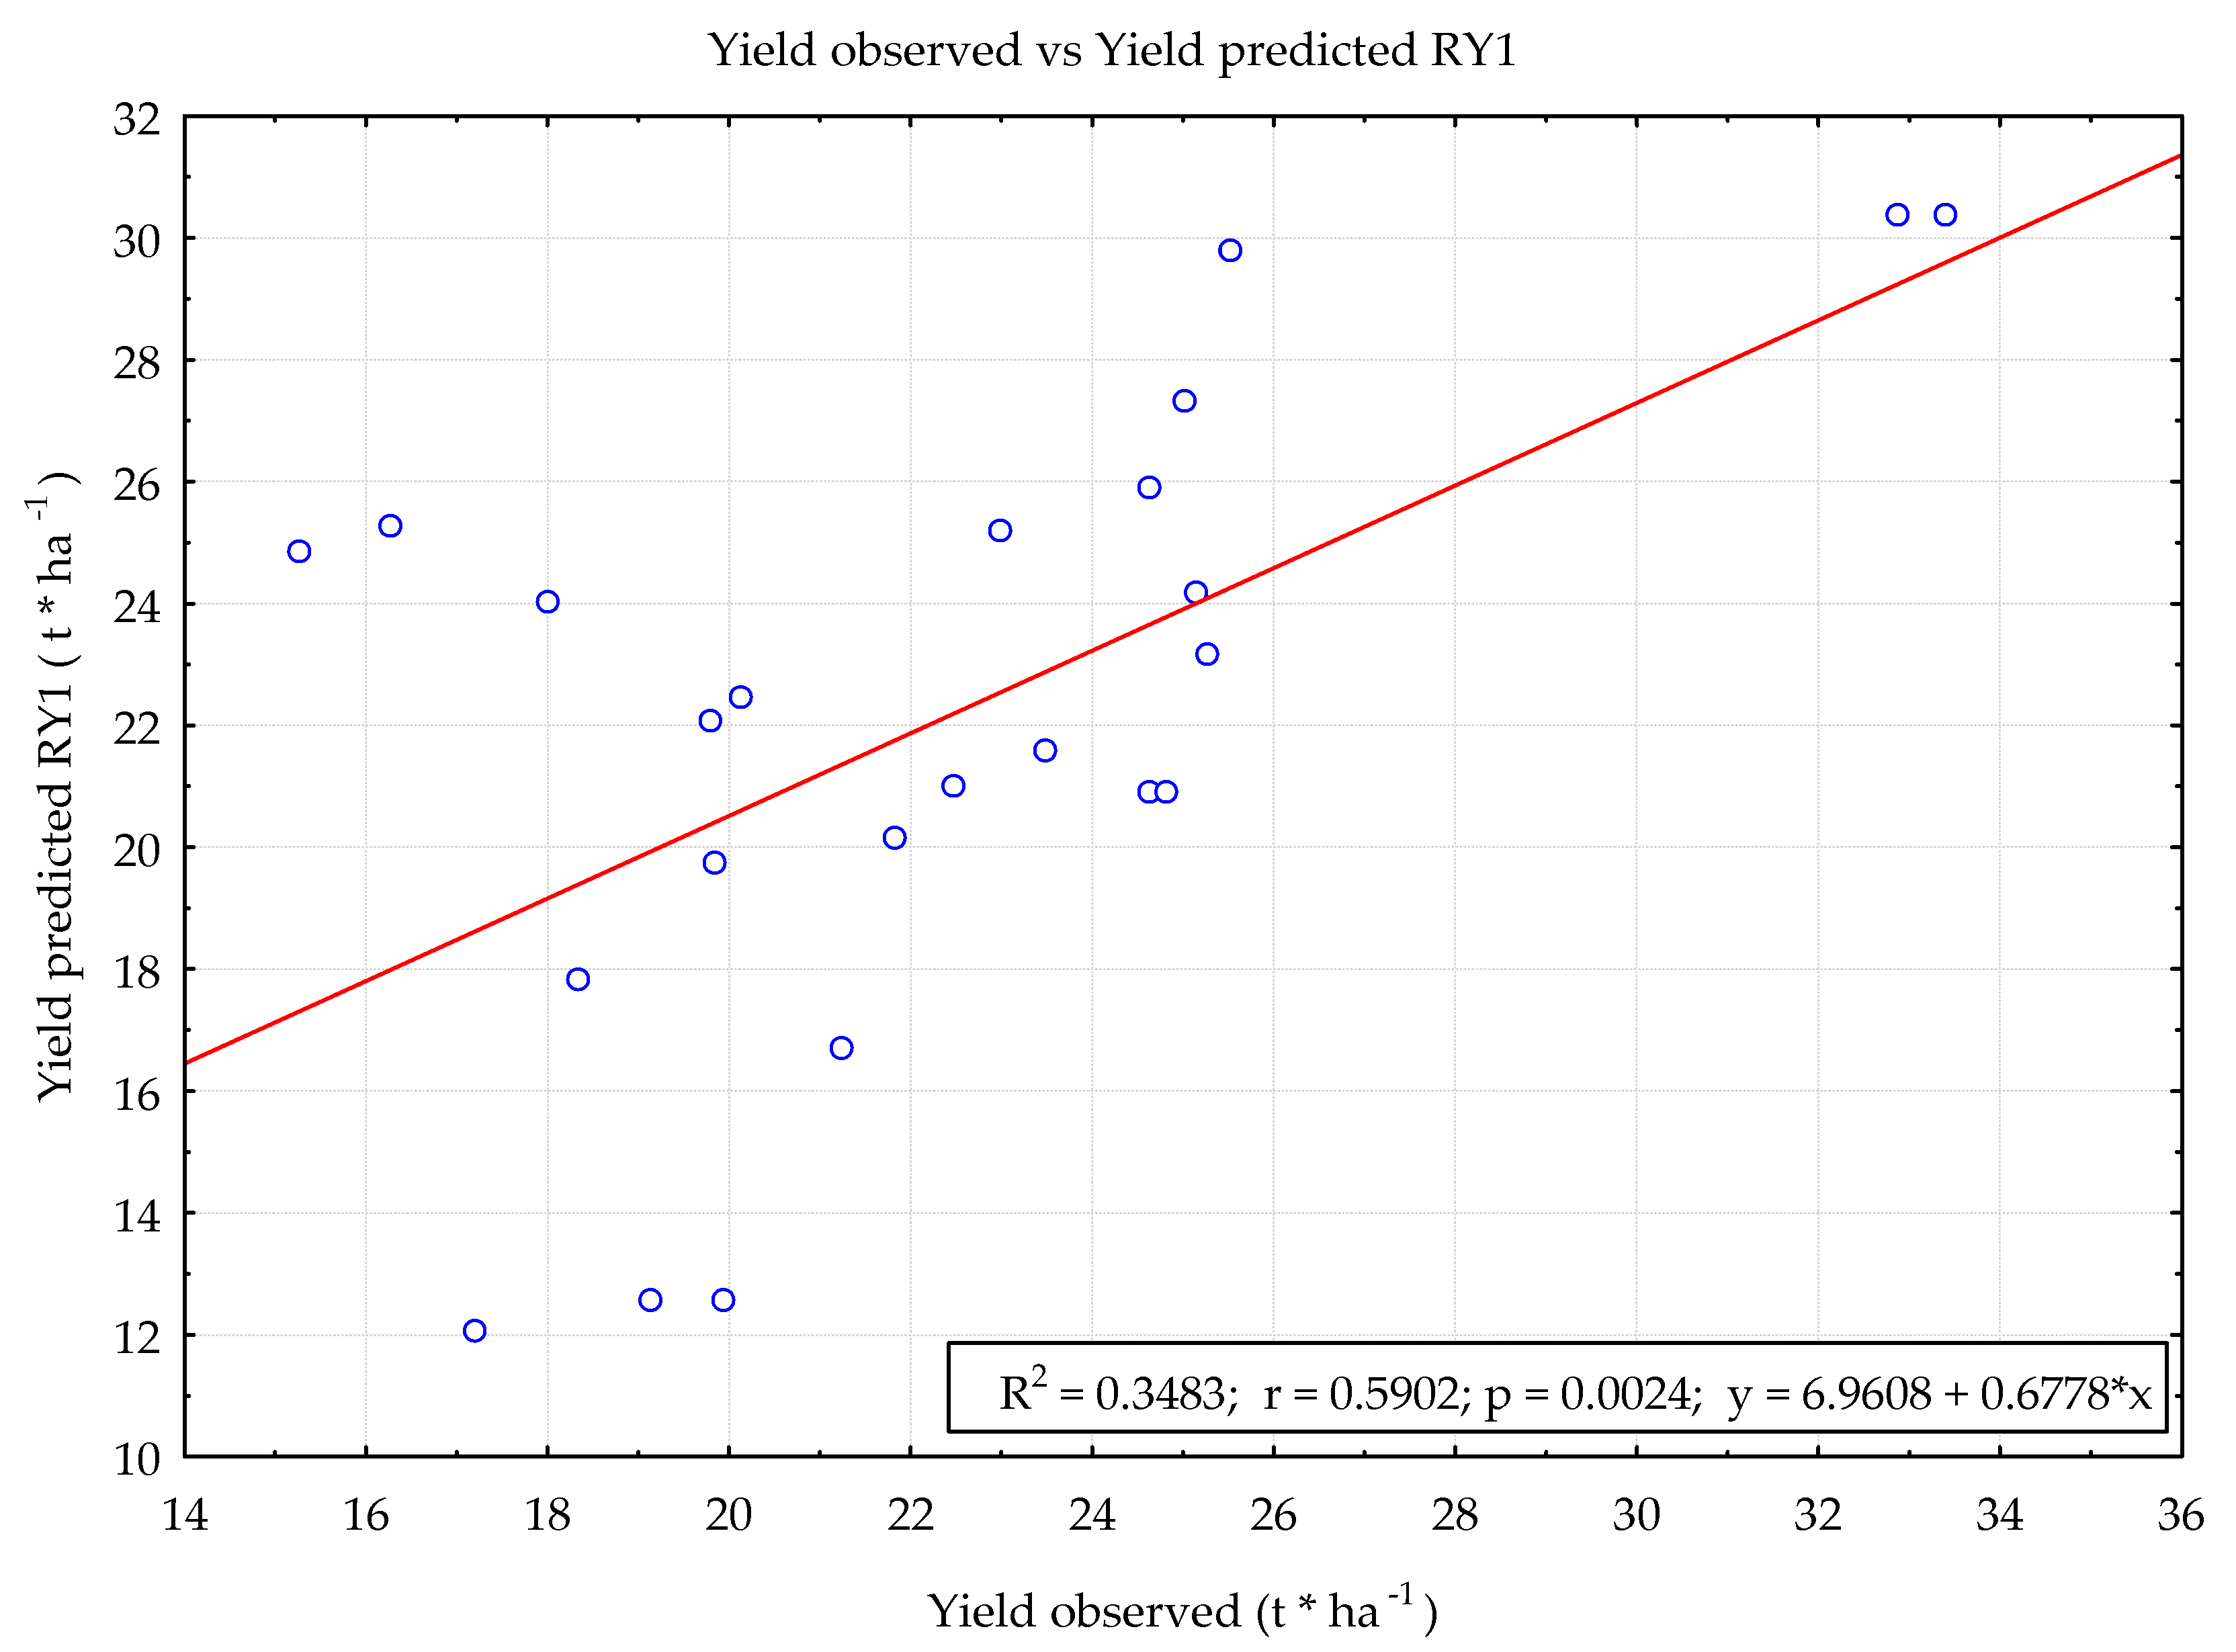
3.2. Forecasting Properties of Linear and Nonlinear Models

The proper functioning of the RY1 and NY1 models was verified by comparing the obtained forecasts with the actual yielding results for Arielle, Riviera, and Viviana tubers. In order to verify the prognostic properties, the data constituting the Bp subset were used. Four measures of forecast accuracy (ex post) were used in the study: relative approximation error (RAE), root mean square error (RMS), absolute mean error (MAE), and mean absolute percentage error (MAPE) (Table 4). Their calculation enabled determining the quality of the models and their usefulness in the realization of crop forecasts harvested 40 days from full emergence.
The results presented in the previous stages were supplemented by additional analyses and visualizations between the values of actual tuber yields achieved 40 days from full emergence and the values forecasted by the RY1 and NY1 models. The results of the analyses are shown in the following Figure 4 and Figure 5.
The NY1 model performed forecasts with greater accuracy. The value of the coefficient of determination R2 was 0.623. For the RY1 model, this parameter was much lower 0.3483.

3.3. The Results of the Sensitivity Analysis of the MLP 13:13-20-10-1:1 Neural Network

Sensitivity analysis, which was carried out for the MLP 13:13-20-10-1:1 neural network, built on the Ap set has shown that the factor with the greatest influence on the yield of three very early potato varieties harvested 40 days from full emergence was the planting date [PLANT] defined in numbers of days from the beginning of the year (Table 5). Removing this variable from the model would increase the cumulative error of the neural network by 1.79 times. The second most significant factor in explaining the variability of the dependent variable was emergence date [EMERG], which was defined in the number of days since the beginning of the year. Removing this model variable would increase the error by 1.57 times. The third important factor was the total dose of nitrogen fertilization [kg∙ha−1] [NITRO].

4. Discussion

The research results presented in the following study show that modeling the yield of very early potato varieties during the growing season is reasonable and brings promising application possibilities. Forecasting models are usually created based on the results collected during many years of field experience. Still, the amount of empirical data included in the modeling remains a controversial issue. In many works, the authors of the models use a lot of independent variables [3,12,44,45] or use classical prognostic models developed exclusively for potato: SUBSTOR-Potato [46,47], LINTUL-Potato-DSS Model [48], etc. In that situation, when the model tries to estimate too many unknowns for the number of observations made, the model’s ability to detect real relationships is severely limited [49]. The presented prognostic models RP1 and NY1 are based on 13 independent variables aiming to explain the variability of the tuber yield of cultivars Arielle, Riviera, and Viviane harvested about 40 days from full emergence. The models are based on the results of varietal experiments carried out in 2010–2017 at five research sites located in northern and northwestern Poland. According to the data of the Voivodeship Inspectorate of Plant Health and Seed Inspection the Arielle, Riviera and Viviana varieties occupy leading positions in the popularity rankings of varieties grown for propagation purposes.
An important aspect in dealing with artificial neural networks is the selection of the right learning method and network topology. The testing stage of network topology showed that the MLP network is the best network for potato tuber yield forecasting, which very well solves prediction problems in agriculture [50,51]. In the presented work, single-direction learning of two-layer MLP neural networks were based on a two-stage process. In the first step, the generated networks were trained using the backward propagation of errors method. The second stage involved learning with the use of the conjugate gradients method. As far as choosing the right network topology for a specific task is not a big issue, it is quite a problematic to determine the optimal number of neurons creating progressive hidden layers. The selection of the number of neurons in successive layers is a key issue that is decisive for the generalizing properties of the network. Determining their optimal number depends mainly on the experience of the network creator. A relatively large number of neurons improves the computing power of the network; however, exceeding a certain number may result in overfitting the neuron network, which is selected on the basis of a detailed analysis of the value of the quality parameters of the neural network having 20 neurons in the first hidden layer and 10 neurons in the second hidden layer. The obtained results allow us to assume that the model’s goodness-of-fit in respect to the data does not always involve the use of many neurons in hidden layers. Applying the right number of neurons is a complicated process, requiring a lot of testing, compromises, and excellent data preparation. Although the complexity of the model depends on the nature of the modeled issue, those neural networks with a relatively simple structure are more desirable and accepted also by other researchers [52,53].
The selection of the network that best fulfills the yield forecasting tasks for three selected potato varieties was based on the results for the following harvests: training, validation, and testing, as well as generalized data for the network. The quality of training, validation, and testing is a measure of accuracy of a trained network. Assessments of neural predictive models can be made on the basis of an analysis of the correspondence between the actual data and those predicted by the model. Such form of presentation of research results can often be found in the literature [54,55]. However, the formulation of more objective conclusions is possible thanks to the quantitative method of model evaluation, taking place in two stages. In the first step, after generating the trained networks, the so-called statistical modeling regression analysis is applied, which include arithmetic mean, calculated on the basis of the database used to build models; standard deviation of the actual data; standard deviation of errors for the dependent variable; mean absolute error; the quotient of the standard deviation of the errors and the standard deviation of actual data; correlation coefficient between actual and forecast values; and determination coefficient, which is a measure of the quality of the model goodness-of-fit with respect to the training data. The results of individual research take into account the values of all regression statistics presented above. One of the most important parameters characterizing the quality of the neural network is the deviation quotient (Iσ) and the value of the determination coefficient (R2). The value of the deviation quotient (Iσ) for the constructed models usually oscillates between 0.1 and 0.7. Values below 0.1 indicate a very good network accuracy, whereas networks with an Iσ value above 0.7 should not be used in modeling. In the case of the MLP 13:13-20-10-1:1 network, the value of the deviation quotient was 0.455, which indicates its satisfactory quality. The value of the determination coefficient R2 is in the range 0–1. The model goodness-of-fit is even better, once the value of R2 is closer to oneness. The value of this parameter for the MLP 13:13-20-10-1:1 network is 0.793 and is greater than for the regression model RY1 (R2 = 0.532).
The forecasting process begins with the determination of predictive values. Once having pairs of actual and forecasted values, the values of forecast errors (ex post) are determined. i.e., RAE, RMS, MAE, and MAPE [56,57,58]. The above measures of predictive properties were calculated separately for the regression model RY1 and the neural model NY1.
A highly effective parameter determining the quality and usefulness of performed forecasts is the mean absolute percentage error (MAPE). It can be interpreted as the average percentage deviation between the forecast value and the actual implementation. Peng et al. [59] provide threshold values for a proper MAPE evaluation. If the error is less than 10%, then the degree of goodness-of-fit of the model is perfect, while a range from 10 to 20% indicates a good fit and 20 to 30% at the level of acceptance. The MAPE above 30% implies poor accuracy of the model and disqualifies it from practical use. In the individual research, MAPE achieved low values. For the RY1 model, it was as much as 15.667%, and for the NY1 model, it was as much as 7.203%. These results prove a model’s goodness-of-fit (especially the neural model) to the real dataset and thus enable great application possibilities. Moreover, the MAPE values are widely used for interpreting the usefulness of predictive models by other researchers [54,60]. For example, the MAPE error values (0.5%) were applied to evaluate the forecasts made by Khoshnevisan et al. [61], who estimated the potato yield on the basis of energy inputs using intelligent systems, based on adaptive neuro-fuzzy inference systems (ANFIS) and artificial neural networks (ANNs). The following interpretation tells us that the discussed model can lead to very reliable forecasts. Bearing in mind the significant influence of random factors on natural processes of discussed modeling, our obtained results of measures of the prognostic properties of neural models are satisfactory, which indicate the possibility of using these tools in practice.
The results of the above studies show that the goodness-of-fit between the actual values and those predicted by the RY1 and NY1 models was statistically significant (α = 0.05). Such a comparison covered 24 cases constituting the Bp verification subset. The relations between the discussed values were described by equations (Figure 4 and Figure 5) and the determination coefficients R2. The NY1 neural model was characterized by a better fit of the generated forecasts in relation to the actual yield (R2 = 0.8623) comparing to the regression model RY1 (R2 = 0.3483). This is another argument in favor of neural modeling over regression methods in yield prediction.
The obtained results by means of sensitivity analysis of the MLP neural network 13:13-20-10-1:1 forming the NY1 model are fully consistent with the available literature. The analysis confirmed the significance of all tested independent variables in explaining the yield variability of Arielle, Riviera, Viviana cultivars. The most important factors in shaping the yields of these genotypes were planting date [PLANT] date of emergence [EMERG] and the total dose of nitrogen fertilization [NITRO]. The performed multiple regression analysis excludes the significance of the daily average air temperature [TEMP], the sum of phosphorus fertilization [PHOSP], and the sum of potassium fertilization [POTAS] in determining the yield at the assumed significance level α = 0.05. Factors unrelated to the inputs in potato cultivation, but—as indicated from individual research, having a great impact on the final yield—are planting date and date of emergence. Many authors emphasize that delaying the planting date has adverse effects on the growth and development of the potato, causing the shortening of successive phases of plant development. Research by Kawakami et al. [62], although conducted in completely different climatic conditions, confirm that early planting promotes an increase in tuber yield. The early planting date for very early potato varieties in the Baltic Sea region carries the risk of reducing the yield of potatoes intended for early harvest. The recommended planting period is the turn of April and May. If during this period, good thermal and humidity conditions occur, the emergence of plants is observed even several days after planting. The results of the conducted research show that among all the nutrients provided to the cultivation of very early potato varieties, nitrogen plays a fundamental role. Maintaining a rational fertilization level with this element is particularly important in the production of varieties intended for early harvest, being a typical yield-forming nutrient, both in quantitative and qualitative terms [63]. According to some authors, each increase in nitrogen dose causes a marked increase in potato productivity compared to the lower dose [64]. In turn, Olivier et al. [65] and Jamaati-e-Somarin et al. [66] report that the increase in tuber yield is observed with respect to certain doses of fertilization; however, after exceeding the upper limit, the increase in yield is no longer statistically significant, and the yield decreases. Moreover, nitrogen deficiency may result in premature aging of plants or a visible reduction in yield [67,68]. On the other hand, increasing doses of nitrogen fertilization lead to a significant deterioration of the quality characteristics of tubers—the reduction of starch content and dry matter content [69]. One should keep in mind that excessive nitrogen application creates environmental problems related to nitrate leaching or run-off [70]. In the case of growing very early and early potato varieties, relatively low doses of nitrogen should be applied. Plants fertilized with high doses of nitrogen absorb it intensively, starting from the early stages of development, but due to the shortened growing season, they do not metabolize it completely. In such cases, nitrates (V) accumulate in tubers intended for harvest.
Growing interest in specialized cultivation of potato, in connection with a declining supply of agricultural land, introduces the need for greater control of plant yield, conscious management of production, and making the right decisions before harvesting [54]. The presented results of individual research show that artificial neural networks are a very useful tool in forecasting the yield of very early potato varieties: Arielle, Viviana, and Riviera. Pre-harvest forecasts are a valuable source of knowledge prior to the harvest, sales, and storage of agricultural produce.

5. Conclusions

The presented modeling methods are an extension of the forecasting models used so far. One of the innovations in the presented concept of yield modeling is the possibility of performing simulations before harvesting in the current agrotechnical season. The presented models can be applied in precision agriculture as an element of decision support systems. Detailed analysis of the values of ex post predictive measures indicate a greater accuracy of the neural model in the implementation of the forecasts than the regression model. The MAPE value for the NY1 model, amounting to 7.203%, proves high-quality prediction.
Working with predictive models, regression and neural models, is burdened with certain limitations. In the case of regression models, it is impossible to use data in qualitative form. For building models, it is recommended to use the full set of experimental data. Some of these limitations also apply to neural models. To be able to fully use the model, it is necessary to obtain complete sets of source files: the set for building the network, the network file, and the verification set. A great advantage of neural models is their ability to deal with incomplete source datasets and their ability to work with qualitative data. Of course, the research results we present relate to an unambiguous cultivation site and specific potato varieties. This, too, is some barrier to universal use of the model. It should be remembered that our research used only those variables that we could obtain from official experiments conducted by COBORU. It is worth mentioning that classic—known models of potato growth, development, and yielding are often not easy to use in practice. They require conducting strict experiments, taking measurements with the use of specialist equipment, etc. So far, no universal model has been elaborated, predicting potato yield for the whole continent, all cultivars admitted to cultivation on a given area, various agrotechnical methods.
Future research on the improvement of neural models in the production of very early potato varieties can be carried out on several levels. First of all, the influence of other equally important independent variables should be carefully considered, often occurring in linguistic form. Secondly, greater number of plots should be taken into account to increase the dataset. This would allow for the implementation of even more accurate forecasts for the adopted research area. Finally, optimization of significant controllable independent factors toward maximizing the tuber yield is needed.

Author Contributions

Conceptualization, M.P. and G.N.; Data curation, M.P., G.N., T.P., T.L. and T.W.; Formal analysis, M.P., G.N., K.P. and A.A.P.; Funding acquisition, G.N.; Investigation, M.P.; Methodology, M.P., G.N., T.P. and T.W.; Project administration, G.N.; Resources, M.P. and T.L.; Software, G.N., K.P. and A.C.-K.; Supervision, M.P.; Validation, M.P., G.N., T.P., K.P. and A.C.-K.; Visualization, G.N. and A.A.P.; Writing—original draft, M.P. and G.N.; Writing—review and editing, M.P., G.N., T.P., T.L. and T.W. All authors have read and agreed to the published version of the manuscript.

Funding

This research received no external funding.

Institutional Review Board Statement

Not applicable.

Informed Consent Statement

Not applicable.

Data Availability Statement

Data are not publicly available.

Acknowledgments

The authors would like to thank the management and employees of the Research Centre for Cultivar Testing for providing data from the varietal trials.

Conflicts of Interest

The authors declare no conflict of interest.

References

  1. Basso, B.; Liu, L. Seasonal crop yield forecast: Methods, applications, and accuracies. Adv. Agron. 2019, 201–255. [Google Scholar] [CrossRef]
  2. Garde, Y.A.; Dhekale, B.S.; Singh, S. Different approaches on pre harvest forecasting of wheat yield. J. Appl. Nat. Sci. 2015, 7, 839–843. [Google Scholar] [CrossRef]
  3. Niedbała, G.; Piekutowska, M.; Weres, J.; Korzeniewicz, R.; Witaszek, K.; Adamski, M.; Pilarski, K.; Czechowska-Kosacka, A.; Krysztofiak-Kaniewska, A. Application of Artificial Neural Networks for Yield Modeling of Winter Rapeseed Based on Combined Quantitative and Qualitative Data. Agronomy 2019, 9, 781. [Google Scholar] [CrossRef] [Green Version]
  4. Struik, P.C.; Kuyper, T.W. Sustainable intensification in agriculture: The richer shade of green. A review. Agron. Sustain. Dev. 2017, 37, 39. [Google Scholar] [CrossRef]
  5. FAO Food and Agriculture Organization of the United Nations (FAO). FAOSTAT Online Statistical Service. 2020. Available online: http://faostat.fao.org (accessed on 15 January 2021).
  6. Kołodziejczyk, M.; Oleksy, A.; Kulig, B.; Lepiarczyk, A. Early potato cultivation using synthetic and biodegradable covers. Plant Soil Environ. 2019, 65, 97–103. [Google Scholar] [CrossRef] [Green Version]
  7. De Cicco, A.; Jeanty, J.-C. The EU Potato Sector-Statistics on Production, Prices and Trade. Available online: https://ec.europa.eu/eurostat/statistics-explained/index.php/The_EU_potato_sector_-_statistics_on_production,_prices_and_trade (accessed on 15 January 2021).
  8. Cholakov, T.L.; Nacheva, E.K. Results from using polypropylene cover in production of early potatoes. Acta Hortic. 2009, 603–608. [Google Scholar] [CrossRef]
  9. Wadas, W.; Kosterna, E.; Sawicki, M. Effect of Perforated Film And Polypropylene Nonwoven Covering On The Marketable Value of Early Potato Yield. Veg. Crop. Res. Bull. 2008, 69. [Google Scholar] [CrossRef]
  10. Jiang, D.; Yang, X.; Clinton, N.; Wang, N. An artificial neural network model for estimating crop yields using remotely sensed information. Int. J. Remote Sens. 2004, 25, 1723–1732. [Google Scholar] [CrossRef]
  11. Heremans, S.; Dong, Q.; Zhang, B.; Bydekerke, L.; Van Orshoven, J. Potential of ensemble tree methods for early-season prediction of winter wheat yield from short time series of remotely sensed normalized difference vegetation index and in situ meteorological data. J. Appl. Remote Sens. 2015, 9. [Google Scholar] [CrossRef]
  12. Niedbała, G.; Nowakowski, K.; Rudowicz-Nawrocka, J.; Piekutowska, M.; Weres, J.; Tomczak, R.J.; Tyksiński, T.; Pinto, A.Á. Multicriteria prediction and simulation of winter wheat yield using extended qualitative and quantitative data based on artificial neural networks. Appl. Sci. 2019, 9, 2773. [Google Scholar] [CrossRef] [Green Version]
  13. Chipanshi, A.; Zhang, Y.; Kouadio, L.; Newlands, N.; Davidson, A.; Hill, H.; Warren, R.; Qian, B.; Daneshfar, B.; Bedard, F.; et al. Evaluation of the Integrated Canadian Crop Yield Forecaster (ICCYF) model for in-season prediction of crop yield across the Canadian agricultural landscape. Agric. For. Meteorol. 2015, 206, 137–150. [Google Scholar] [CrossRef] [Green Version]
  14. Bustos-Korts, D.; Malosetti, M.; Chapman, S.; van Eeuwijk, F. Modelling of Genotype by Environment Interaction and Prediction of Complex Traits across Multiple Environments as a Synthesis of Crop Growth Modelling, Genetics and Statistics. In Crop Systems Biology; Springer International Publishing: Cham, Switzerland, 2016; pp. 55–82. [Google Scholar]
  15. Shahhosseini, M.; Hu, G.; Archontoulis, S.V. Forecasting Corn Yield With Machine Learning Ensembles. Front. Plant Sci. 2020, 11. [Google Scholar] [CrossRef] [PubMed]
  16. Bala, S.K.; Islam, A.S. Correlation between potato yield and MODIS-derived vegetation indices. Int. J. Remote Sens. 2009, 30, 2491–2507. [Google Scholar] [CrossRef]
  17. Abrougui, K.; Gabsi, K.; Mercatoris, B.; Khemis, C.; Amami, R.; Chehaibi, S. Prediction of organic potato yield using tillage systems and soil properties by artificial neural network (ANN) and multiple linear regressions (MLR). Soil Tillage Res. 2019, 190, 202–208. [Google Scholar] [CrossRef]
  18. Reynolds, C.A.; Yitayew, M.; Slack, D.C.; Hutchinson, C.F.; Huete, A.; Petersen, M.S. Estimating crop yields and production by integrating the FAO Crop Specific Water Balance model with real-time satellite data and ground-based ancillary data. Int. J. Remote Sens. 2000, 21, 3487–3508. [Google Scholar] [CrossRef]
  19. Matsumura, K.; Gaitan, C.F.; Sugimoto, K.; Cannon, A.J.; Hsieh, W.W. Maize yield forecasting by linear regression and artificial neural networks in Jilin, China. J. Agric. Sci. 2015, 153, 399–410. [Google Scholar] [CrossRef]
  20. MacKerron, D.K.L. Mathematical Models of Plant Growth and Development. In Potato Biology and Biotechnology; Elsevier: New York, NY, USA, 2007; pp. 753–776. [Google Scholar]
  21. Daccache, A.; Weatherhead, E.K.; Stalham, M.A.; Knox, J.W. Impacts of climate change on irrigated potato production in a humid climate. Agric. For. Meteorol. 2011, 151, 1641–1653. [Google Scholar] [CrossRef]
  22. Van der Zaag, D.E. Simulation of growth and yield of the potato crop. Potato Res. 1984, 27, 305–306. [Google Scholar] [CrossRef]
  23. Aguiar Pinto, P. Computer Simulation Modeling of the Growth and Development of the Potato Crop Under Different Water Regimes; University of California: Los Angeles, CA, USA, 1988. [Google Scholar]
  24. Arora, V.K.; Nath, J.C.; Singh, C.B. Analyzing potato response to irrigation and nitrogen regimes in a sub-tropical environment using SUBSTOR-Potato model. Agric. Water Manag. 2013, 124, 69–76. [Google Scholar] [CrossRef]
  25. Raymundo, R.; Asseng, S.; Prassad, R.; Kleinwechter, U.; Concha, J.; Condori, B.; Bowen, W.; Wolf, J.; Olesen, J.E.; Dong, Q.; et al. Performance of the SUBSTOR-potato model across contrasting growing conditions. Field Crop. Res. 2017, 202, 57–76. [Google Scholar] [CrossRef] [Green Version]
  26. Griffin, T.S.; Bradley, S.J.; Ritchie, J.T. A Simulation Model for Potato Growth and Development: Substor-Potato Version 2.0; University of Honolulu: Honolulu, HI, USA, 1993. [Google Scholar]
  27. Kooman, P.L.; Haverkort, A.J. Modelling Development and Growth of the Potato Crop Influenced by Temperature and Daylength: LINTUL-POTATO; Kluwer Academic Publishers: Amsterdam, The Netherlands, 1995; pp. 41–59. [Google Scholar]
  28. Wolf, J. Comparison of two potato simulation models under climate change. I. Model calibration and sensitivity analyses. Clim. Res. 2002, 21, 173–186. [Google Scholar] [CrossRef] [Green Version]
  29. Alva, A.K.; Marcos, J.; Stockle, C.; Reddy, V.R.; Timlin, D. A Crop Simulation Model for Predicting Yield and Fate of Nitrogen in Irrigated Potato Rotation Cropping System. J. Crop Improv. 2010, 24, 142–152. [Google Scholar] [CrossRef]
  30. MacKerron, D.K.L.; Haverkort, A.J. Decision Support Systems in Potato Production; MacKerron, D.K.L., Haverkort, A.J., Eds.; Wageningen Academic Publishers: Wageningen, The Netherlands, 2004; ISBN 978-90-76998-30-5. [Google Scholar]
  31. Pentoś, K. The methods of extracting the contribution of variables in artificial neural network models—Comparison of inherent instability. Comput. Electron. Agric. 2016, 127, 141–146. [Google Scholar] [CrossRef]
  32. Niazian, M.; Niedbała, G. Machine Learning for Plant Breeding and Biotechnology. Agriculture 2020, 10, 436. [Google Scholar] [CrossRef]
  33. van Klompenburg, T.; Kassahun, A.; Catal, C. Crop yield prediction using machine learning: A systematic literature review. Comput. Electron. Agric. 2020, 177. [Google Scholar] [CrossRef]
  34. Kujawa, S.; Dach, J.; Kozłowski, R.J.; Przybył, K.; Niedbała, G.; Mueller, W.; Tomczak, R.J.; Zaborowicz, M.; Koszela, K. Maturity classification for sewage sludge composted with rapeseed straw using neural image analysis. In Proceedings of the SPIE—The International Society for Optical Engineering, San Diego, CA, USA, 28 August 2016; Volume 10033, p. 100332H. [Google Scholar] [CrossRef]
  35. Wojciechowski, T.; Niedbala, G.; Czechlowski, M.; Nawrocka, J.R.; Piechnik, L.; Niemann, J. Rapeseed seeds quality classification with usage of VIS-NIR fiber optic probe and artificial neural networks. In Proceedings of the 2016 International Conference on Optoelectronics and Image Processing, ICOIP 2016, Warsaw, Poland, 10–12 June 2016. [Google Scholar] [CrossRef]
  36. Pandey, A.; Mishra, A. Application of artificial neural networks in yield prediction of potato crop. Russ. Agric. Sci. 2017, 43, 266–272. [Google Scholar] [CrossRef]
  37. Liu, Y.; Zhang, S.; Chen, X.; Wang, J. Artificial Combined Model Based on Hybrid Nonlinear Neural Network Models and Statistics Linear Models—Research and Application for Wind Speed Forecasting. Sustainability 2018, 10, 4601. [Google Scholar] [CrossRef] [Green Version]
  38. Niedbała, G. Simple model based on artificial neural network for early prediction and simulation winter rapeseed yield. J. Integr. Agric. 2019, 18, 54–61. [Google Scholar] [CrossRef] [Green Version]
  39. Research Centre for Cultivar Testing (COBORU). Available online: https://coboru.gov.pl/ (accessed on 20 April 2021).
  40. Studnicki, M.; Lenartowicz, T.; Noras, K.; Wójcik-Gront, E.; Wyszyński, Z. Assessment of Stability and Adaptation Patterns of White Sugar Yield from Sugar Beet Cultivars in Temperate Climate Environments. Agronomy 2019, 9, 405. [Google Scholar] [CrossRef] [Green Version]
  41. Sellam, V.; Poovammal, E. Prediction of Crop Yield using Regression Analysis. Ind. J. Sci. Technol. 2016, 9. [Google Scholar] [CrossRef]
  42. TIBCO Statistica® Automated Neural Networks. Available online: https://community.tibco.com/wiki/tibco-statistica-automated-neural-networks (accessed on 21 March 2021).
  43. Boozarjomehry, R.B.; Svrcek, W.Y. Automatic design of neural network structures. Comput. Chem. Eng. 2001, 25, 1075–1088. [Google Scholar] [CrossRef]
  44. Qi, A.; Kenter, C.; Hoffmann, C.; Jaggard, K.W. The Broom’s Barn sugar beet growth model and its adaptation to soils with varied available water content. Eur. J. Agron. 2005, 23, 108–122. [Google Scholar] [CrossRef]
  45. Sharifi, A. Yield prediction with machine learning algorithms and satellite images. J. Sci. Food Agric. 2021, 101, 891–896. [Google Scholar] [CrossRef]
  46. Šťastná, M.; Toman, F.; Dufková, J. Usage of SUBSTOR model in potato yield prediction. Agric. Water Manag. 2010, 97, 286–290. [Google Scholar] [CrossRef]
  47. Travasso, M.I.; Caldiz, D.O.; Saluzzo, J.A. Yield prediction using the SUBSTOR-potato model under Argentinian conditions. Potato Res. 1996, 39, 305–312. [Google Scholar] [CrossRef]
  48. Machakaire, A.T.B.; Steyn, J.M.; Caldiz, D.O.; Haverkort, A.J. Forecasting Yield and Tuber Size of Processing Potatoes in South Africa Using the LINTUL-Potato-DSS Model. Potato Res. 2016, 59, 195–206. [Google Scholar] [CrossRef] [Green Version]
  49. Babyak, M.A. What You See May Not Be What You Get: A Brief, Nontechnical Introduction to Overfitting in Regression-Type Models. Psychosom. Med. 2004, 66, 411–421. [Google Scholar] [CrossRef] [Green Version]
  50. Guo, W.W.; Xue, H. Crop yield forecasting using artificial neural networks: A comparison between spatial and temporal models. Math. Probl. Eng. 2014, 2014. [Google Scholar] [CrossRef]
  51. Bhojani, S.H.; Bhatt, N. Wheat crop yield prediction using new activation functions in neural network. Neural Comput. Appl. 2020, 32, 13941–13951. [Google Scholar] [CrossRef]
  52. Niazian, M.; Sadat-Noori, S.A.; Abdipour, M.; Tohidfar, M.; Mortazavian, S.M.M. Image Processing and Artificial Neural Network-Based Models to Measure and Predict Physical Properties of Embryogenic Callus and Number of Somatic Embryos in Ajowan (Trachyspermum ammi (L.) Sprague). Vitr. Cell. Dev. Biol. Plant 2018, 54, 54–68. [Google Scholar] [CrossRef]
  53. Abdipour, M.; Younessi-Hmazekhanlu, M.; Ramazani, S.H.R.; Omidi, A.H. Artificial neural networks and multiple linear regression as potential methods for modeling seed yield of safflower (Carthamus tinctorius L.). Ind. Crops Prod. 2019, 127, 185–194. [Google Scholar] [CrossRef]
  54. Al-Gaadi, K.A.; Hassaballa, A.A.; Tola, E.; Kayad, A.G.; Madugundu, R.; Alblewi, B.; Assiri, F. Prediction of potato crop yield using precision agriculture techniques. PLoS ONE 2016, 11, 1–16. [Google Scholar] [CrossRef]
  55. Cillis, D.; Maestrini, B.; Pezzuolo, A.; Marinello, F.; Sartori, L. Modeling soil organic carbon and carbon dioxide emissions in different tillage systems supported by precision agriculture technologies under current climatic conditions. Soil Tillage Res. 2018, 183, 51–59. [Google Scholar] [CrossRef]
  56. Nevavuori, P.; Narra, N.; Lipping, T. Crop yield prediction with deep convolutional neural networks. Comput. Electron. Agric. 2019, 163. [Google Scholar] [CrossRef]
  57. Niedbała, G.; Kozłowski, R.J. Application of Artificial Neural Networks for Multi-Criteria Yield Prediction of Winter Wheat. J. Agric. Sci. Technol. 2019, 21, 51–61. [Google Scholar]
  58. Zhang, G.P.; Qi, M. Neural network forecasting for seasonal and trend time series. Eur. J. Oper. Res. 2005, 160, 501–514. [Google Scholar] [CrossRef]
  59. Peng, J.; Kim, M.; Kim, Y.; Jo, M.; Kim, B.; Sung, K.; Lv, S. Constructing Italian ryegrass yield prediction model based on climatic data by locations in South Korea. Grassl. Sci. 2017, 63, 184–195. [Google Scholar] [CrossRef]
  60. Kouadio, L.; Newlands, N.; Davidson, A.; Zhang, Y.; Chipanshi, A. Assessing the Performance of MODIS NDVI and EVI for Seasonal Crop Yield Forecasting at the Ecodistrict Scale. Remote Sens. 2014, 6, 10193–10214. [Google Scholar] [CrossRef] [Green Version]
  61. Khoshnevisan, B.; Rafiee, S.; Omid, M.; Mousazadeh, H. Prediction of potato yield based on energy inputs using multi-layer adaptive neuro-fuzzy inference system. Measurement 2014, 47, 521–530. [Google Scholar] [CrossRef]
  62. Kawakami, J.; Iwama, K.; Jitsuyama, Y. Effects of Planting Date on the Growth and Yield of Two Potato Cultivars Grown from Microtubersand Conventional Seed Tubers. Plant Prod. Sci. 2005, 8, 74–78. [Google Scholar] [CrossRef]
  63. Muleta, H.D.; Aga, M.C. Role of nitrogen on potato production: A review. J. Plant Sci. 2019, 7, 36–42. [Google Scholar]
  64. Kołodziejczyk, M. Effect of nitrogen fertilization and microbial preparations on potato yielding. Plant Soil Environ. 2014, 60, 379–386. [Google Scholar] [CrossRef] [Green Version]
  65. Olivier, M.; Goffart, J.-P.; Ledent, J.-F. Threshold Value for Chlorophyll Meter as Decision Tool for Nitrogen Management of Potato. Agron. J. 2006, 98, 496–506. [Google Scholar] [CrossRef]
  66. Jamaati-e-Somarin, S.; Zabihi-e-Mahmoodabad, R.; Yari, A. Yield and yield components of potato (Solanum Tuberosum L.) tuber as affected by nitrogen fertilizer and plant density. Aust. J. Basic Appl. Sci. 2010, 4, 3128–3131. [Google Scholar]
  67. Kleinkopf, G.E.; Westermann, D.T.; Dwelle, R.B. Dry Matter Production and Nitrogen Utilization by Six Potato Cultivars. Agron. J. 1981, 73, 799–802. [Google Scholar] [CrossRef]
  68. Westermann, D.T.; Kleinkopf, G.E. Nitrogen Requirements of Potatoes. Agron. J. 1985, 77, 616–621. [Google Scholar] [CrossRef]
  69. Millard, P.; Marshall, B. Growth, nitrogen uptake and partitioning within the potato (Solatium tuberosum L.) crop, in relation to nitrogen application. J. Agric. Sci. 1986, 107, 421–429. [Google Scholar] [CrossRef]
  70. Westermann, D.T.; Kleinkopf, G.E.; Porter, L.K. Nitrogen fertilizer efficiencies on potatoes. Am. Potato J. 1988, 65, 377–386. [Google Scholar] [CrossRef]
Figure 1. Experiment stations—selected research area.
Agronomy 11 00885 g001
Figure 2. Flowchart of the paper framework.
Agronomy 11 00885 g002
Figure 3. Diagram of MLP 13:13-20-10-1:1 neural network creating the NY1 model with an indication of the number of neurons at the input and output of the network and with two hidden layers.
Agronomy 11 00885 g003
Figure 4. The scatter plot between observed and predicted values according to the RY1 model using Bp subset data.
Agronomy 11 00885 g004
Figure 5. The scatter plot between observed and predicted values according to the NY1 model using Bp subset data.
Agronomy 11 00885 g005
Table 1. Structure and ranges of the most important data in subsets for building and verifying the RY1 and NY1 models.
Quantitative Yield Forecast
Models
RY1 and NY1
Yield Forecast before Harvest
(40 Days from Full Emergence)
Data Range
INSOinsolation sum [h] in the periods: planting—June 20,275.3–711.7
TEMPaverage daily air temperature [°C] in the periods: planting—20 June10.8–15.7
PRECprecipitation [mm] in the periods: planting—20 June38.7–258.2
NITROsum of nitrogen fertilization [kg∙ha−1] in the periods: planting—20 June80–155
PHOSPsum of phosphorus fertilization [kg∙ha−1]28.2–150
POTASsum of potassium fertilization [kg∙ha−1]80–306.5
PLANTplanting date [number of days since the beginning of the year]107–127
EMERGdate of emergence [number of days since the beginning of the year], yield forecast 20th of June130–151
DENSTdensification [plants/plot], yield forecast June 2035–60
PHSoil pH [in 1 mol KCl]5.8–7
SFERTPsoil fertility in phosphorus [mg P2O5∙100 g−1 soil]14–26.2
SFERTKsoil fertility in potassium [mg K2O∙100 g−1 soil]11.7–19.2
SFERTMsoil fertility in magnesium [mg Mg∙100 g−1 soil]3–9.1
YIELDP1tuber yield [t∙ha−1 ], harvest 40 days from full emergence11.6–41.3
Table 2. Regression coefficients, standard errors, and probability levels for the generated RY1 model.
FactorRY1: r = 0.729
R2 = 0.532
Free Term = −151.714
bStandard Error bBetaStandard Error BetapSignificance
PREC0.0380.0090.1950.0490.000103+
INSO0.0250.0040.3390.0640.000000+
TEMP−0.5410.332−0.0970.0590.105023
NITRO0.0870.0160.2570.0480.000000+
PHOSP0.0160.0170.0570.0610.347699
POTAS0.0040.0050.0320.0520.522928
PLANT1.6040.1380.8590.0740.000000+
EMERG−0.5090.096−0.3410.0640.000000+
DENST0.4140.1760.1040.0440.019452+
PH3.3490.6320.2910.0540.000000+
SFERTP0.2870.0590.2250.0460.000002+
SFERTK−0.2240.086−0.1410.0540.009887+
SFERTM−0.4180.163−0.1880.0740.011268+
Determination of the level of statistical significance: − non-significant. + significant for α = 0.05.
Table 3. Quality and structure of the constructed NY1 non-linear model.
NY1
Neural network structureMLP 13:13-20-10-1:1
Learning error0.065
Validation error0.084
Test error0.104
Mean23.417
Standard deviation6.541
Average error−0.008
Deviation error2.978
Mean Absolute error2.241
Quotient deviations0.455
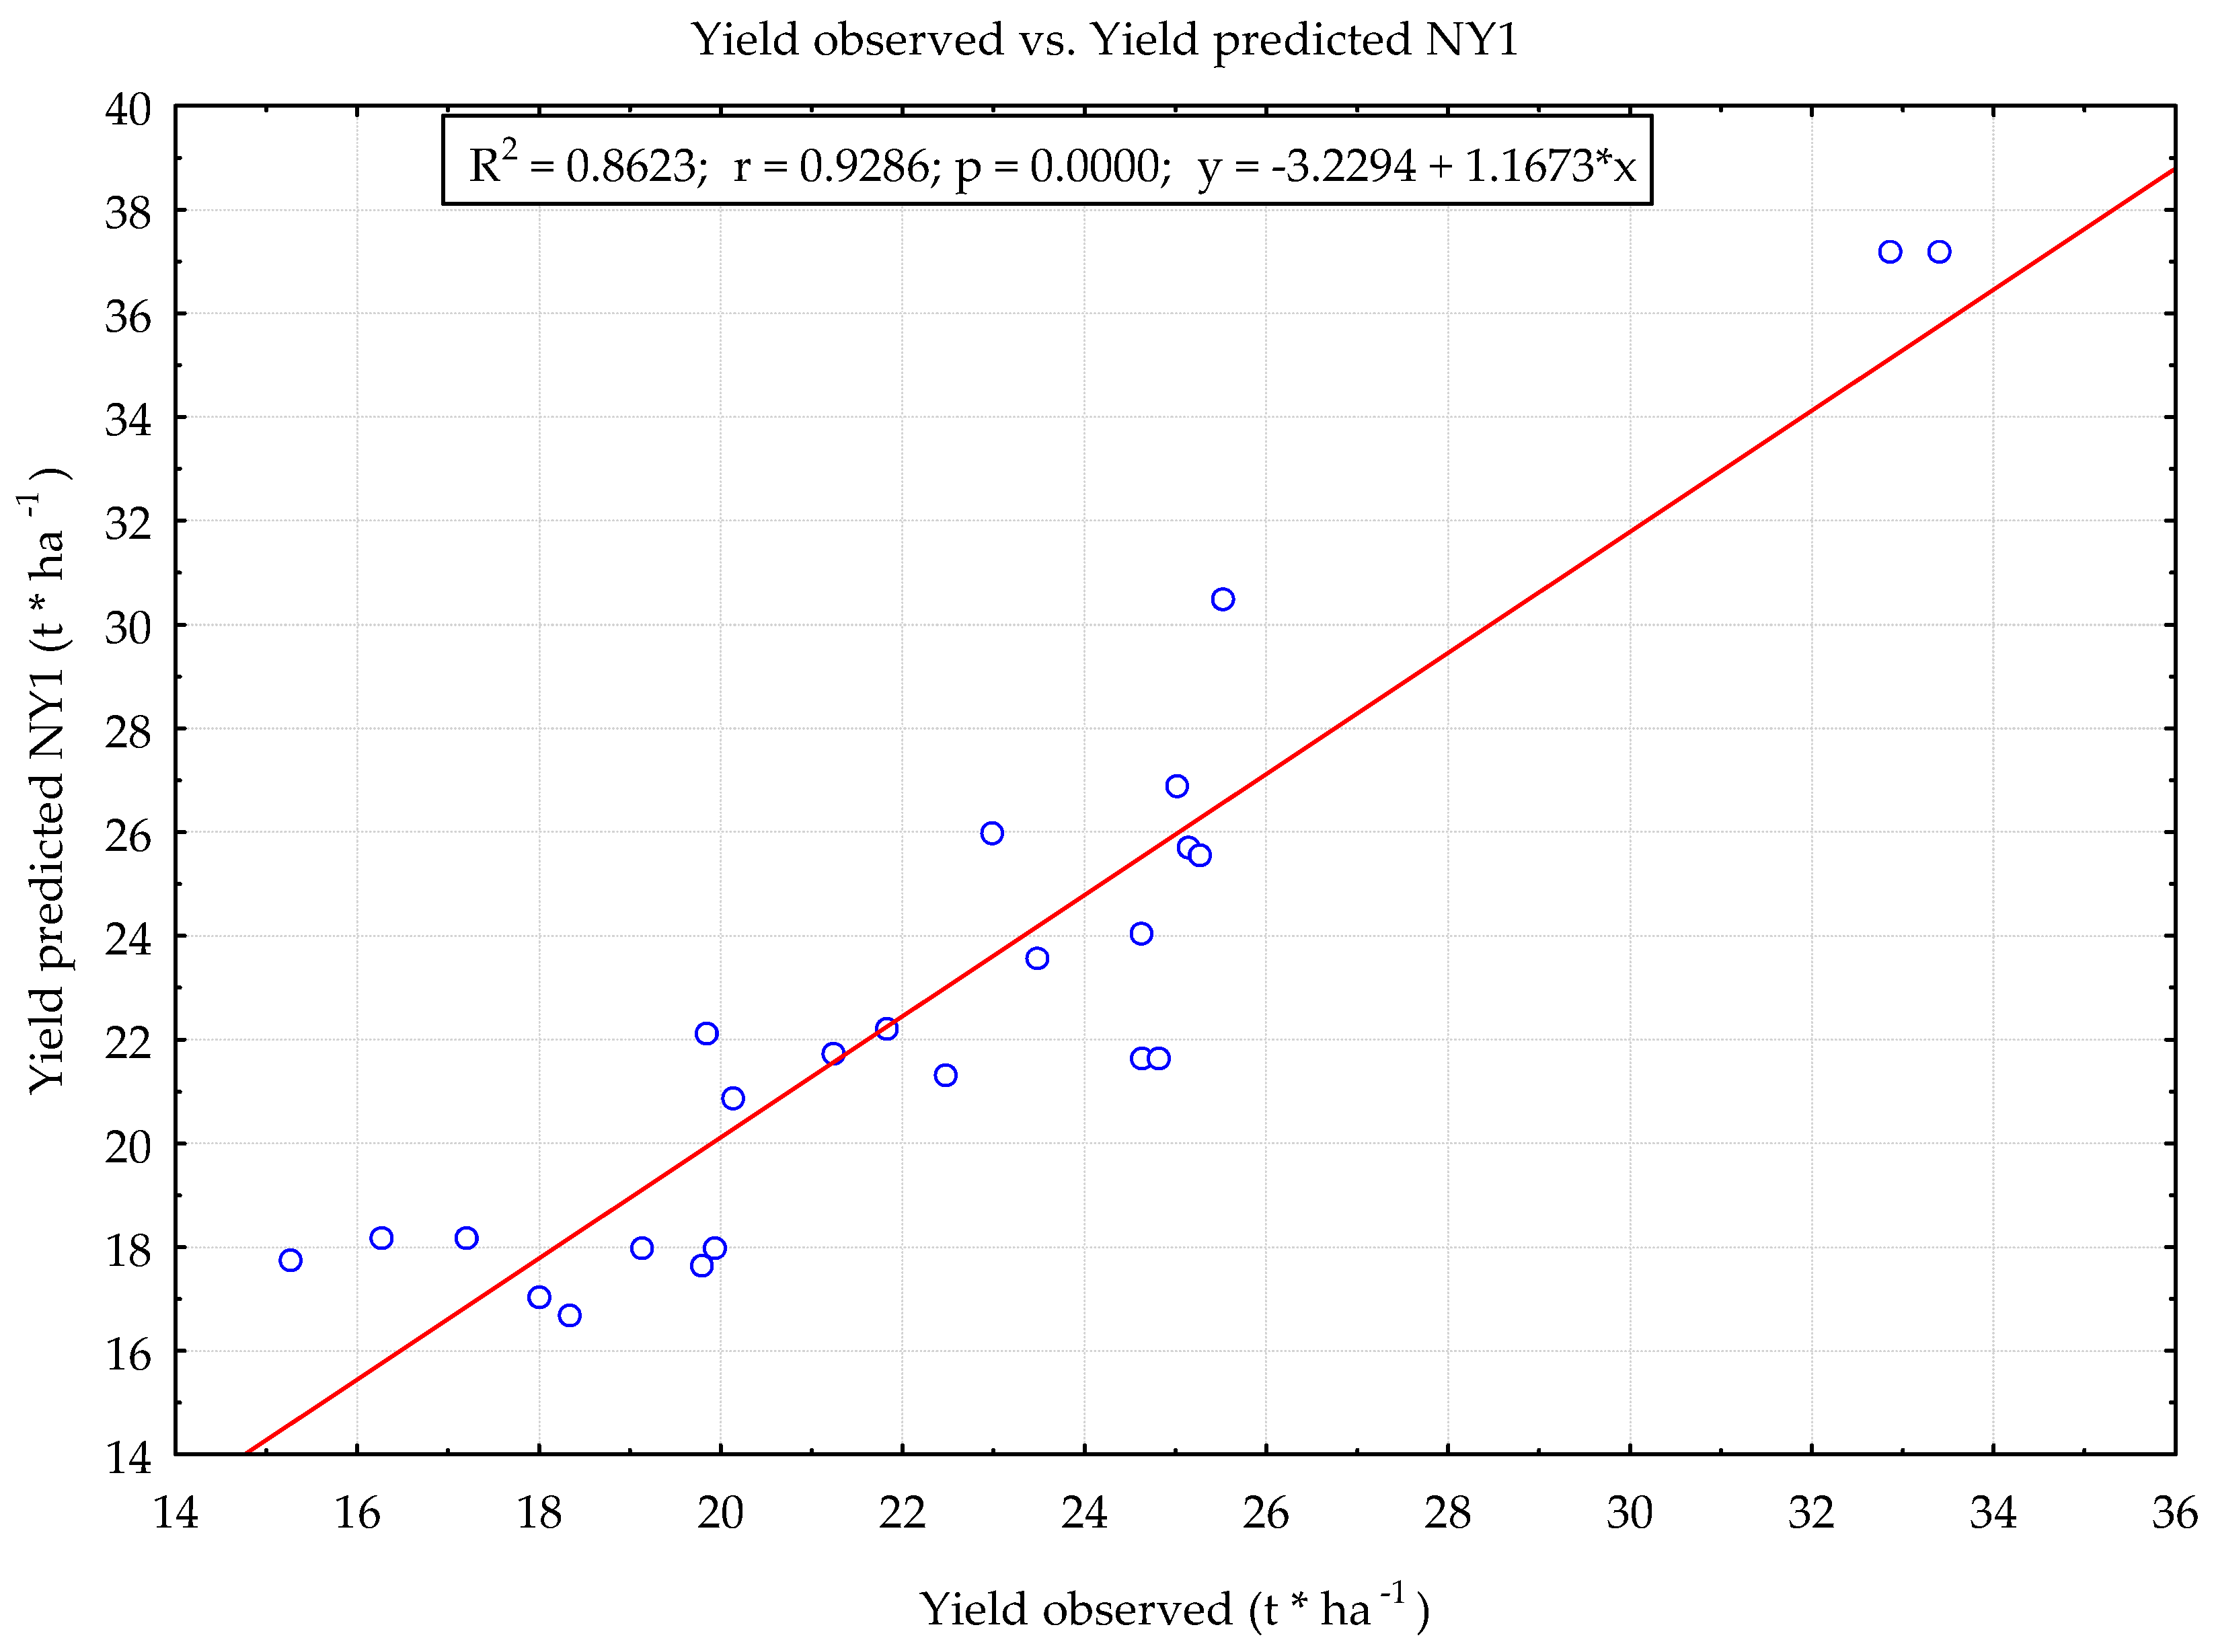
Correlation coefficient—r
Determination coefficient—R2
0.891
0.793
Table 4. Ex post predictive measures in models: RY1 and NY1.
Error TypeModel
RY1NY1
RAE [–]0.9950.099
RMS [t∙ha−1]21.4072.121
MAE [t∙ha−1]3.1371.626
MAPE [%]15.6677.203
Table 5. The results of the sensitivity analysis of the neural network (MLP 13:13-20-10-1:1) realizing the yield forecast on June 20.
VARIABLEPRECINSOTEMPNITROPHOSPPOTASPLANTEMERGDENSTPHSFERTPSFERTKSFERTM
QUOTIENT1.21.241.211.411.131.071.791.571.011.201.161.2911.23
RANK75931112121381046
Publisher’s Note: MDPI stays neutral with regard to jurisdictional claims in published maps and institutional affiliations.

