Article

Identification and Analysis of Strawberries’ Consumer Opinions on Twitter for Marketing Purposes

1
Department of Business and Marketing, Agricultural Economic Research Group Huelva University, 21071 Huelva, Spain
2
Department of Agroforestry Sciences, Huelva University, 21071 Huelva, Spain
*
Author to whom correspondence should be addressed.
Agronomy 2021, 11(4), 809; https://doi.org/10.3390/agronomy11040809
Submission received: 11 March 2021 / Revised: 14 April 2021 / Accepted: 16 April 2021 / Published: 20 April 2021
(This article belongs to the Special Issue Worldwide Trends in Agronomy Research: Bibliometric Studies)

Abstract

:
Data are currently characterized as the world’s most valuable resource and agriculture is responding to this global trend. The challenge in that particular field of study is to create a Digital Agriculture that help the agri-food sector grow in a fair, competitive environment. As automated machine learning techniques and big data are global research trends in agronomy, this paper aims at comparing different marketing techniques based on Content Analysis to determine the feasibility of using Twitter to design marketing strategies and to determine which techniques are more effective, in particular, for the strawberry industry. A total of 2249 hashtags were subjected to Content Analysis using the Word-count technique, Grounded Theory Method (GTM), and Network Analysis (NA). Findings confirm the results of previous studies regarding Twitter’s potential as a useful source of information due to its lower execution and analysis costs. In general, NA is more effective, cheaper, and faster for Content Analysis than that based both on GTM and automated Word-count. This paper reveals the potential of strawberry-related Twitter data for conducting berry consumer studies, useful in increasing the competitiveness of the berry sector and filling an important gap in the literature by providing guidance on the challenge of data science in agronomy.

1. Introduction

Data are currently characterized as the world’s most valuable resource, or the oil of the digital era [1]. Agriculture is responding to the changing environment. It is trying to create digitization strategies that will enable and catalyze a Digital Agriculture and that help the agri-food sector grow in a fair competitive environment. Many companies recognize the need to incorporate a social network strategy as part of their overall marketing efforts [2,3,4]. In fact, 90% of marketing specialists consider Social Networks Sites (SNSs) to be important for their marketing strategy [5], because of their becoming an important channel for communications with consumers due to the large volume of users and the possibility of collecting data directly from them.
Social media marketing is an inexpensive alternative to traditional methods of involving consumers [3,6,7,8]. This is especially significant for small- and medium-sized enterprises since their resources, including marketing budgets, are usually smaller than those of their larger counterparts [9]. Nevertheless, the agribusiness literature still lags in this field [3,10].
The current work focuses on Twitter [11] because it is one of the most popular SNSs on which messages, called tweets, circulate openly, becoming important for both individuals and organizations to broadcast and discuss opinions in real-time [12].
The public characteristic of Twitter allowed the obtaining of data that, duly processed, contributed to the analysis with a solid quantitative foundation in which topics of interest could be identified.
Some authors have analyzed tweets in areas such as consumer food preferences or habits [13,14,15] or communication of Corporate Social Responsibility (CSR) of agri-food companies [16], but on agri-food research it has not been explored as appropriate [14] and, to date, we did not find any research that investigates the usefulness of SNSs media marketing to increase in the competitiveness of the agri-producer sector.
In the context of SNSs, we can understand that the food-related communication of consumers through Twitter can very well reflect their interests and, therefore, serve as a basis for defining the production and marketing strategies of the agri-producer sector.
Besides, for farmers—the lowest power in the agri-food value chain [17]—knowing the interests of consumers is vital in their production strategy.
The European Union (EU) considers digitization of agriculture a key strategy to bring a number of benefits to farmers, such as increased profitability and access to new markets [18] and it is also an excellent lever to accelerate the transition towards a climate-neutral, circular, and more resilient economy [19,20]
One of the most dynamic sectors in the agri-food market is that of fresh products since, in addition to being perishable, they are beneficial for human health.
As it was established in many researches, berries gain more consumers′ attention [21,22,23] as they look out for healthier dietary options [24,25,26,27].
Spain and USA are the main global fresh berry exporters (and producers) followed by Mexico, Chile, and Peru, with USA, Canada, and UK being the largest importers (and consumers) [28,29]. Among all those fresh berries, strawberries are the most consumed by volume [30], and they led the global organic berries market share in 2019 [31].
In addition, as main berry producing and consuming countries are English and Spanish speakers, we analyze the Twitter behavior of these two profiles.
To date, there is still a lack of research’ aspects into the social media marketing that would help berry growers to successfully develop their businesses [32], our paper sheds light on three important issues that are critical for berry firms preparing to start using social marketing strategies. First, our study complements prior research suggesting evidence of the value relevance of engaging in a social media strategy. As long as berry firms are not able to evaluate the consequences of social media strategies on their value, they cannot effectively align such initiatives with their organizational goals. Second, as a communication platform, Twitter may be used to foster relational bonds with berry customers, thus leading to long-term relationships and reliable repeat business, which is consistent with the basic principles of relationship marketing. Finally, while considerable academic research has been carried out to explore social networks, few empirical studies have examined or attempted to compare in term of costs the effectiveness of different marketing research techniques when a SNS is used as a source of information. Thus, the final purpose of this research is to assess the usefulness of consumer-generated content (CGC) from Twitter for berry firms.
Still, research suggests that understanding users’ motives can provide useful insights into how berry consumer behavior. In this context, we develop a theoretical framework for theory building by using and comparing three different techniques used for Content Analysis: Word-count, Grounded Theory Method (GTM), and Network Analysis (NA).
Hence, with the overall aim of using different techniques to discover the main topics included in tweets that included the hashtags #strawberries or #fresas (strawberries in Spanish), and assess the potential of Twitter data for consumer marketing research, we focus on the following research questions: RQ1: “Does the content of hashtags associated with the search criteria reflect the interests of the strawberry consumer?”; RQ2: “Do non-explicit relationships among consumers’ hashtags reflect different and more-or-less relevant topics of interest for berry-industry?”; and RQ3: “Which hashtag Content Analysis technique has been more effective?”
The evidence in relation to these assumptions will shed light on the potential of Twitter data to elucidate berry fruit consumer behavior and, in consequence, to assess the utility for fresh food industry.

2. Literature Review

While most daily decisions are determined by emotional and spontaneous processes [33], current practices in consumer marketing based on direct questions require consumers to reflect before answering [34], which could lead to biases in the answers that compromise the validity of the data obtained [35,36].
Additionally, although consumption studies conducted in supermarkets have been strongly recommended and remain the most common practice [37,38], they have the great inconvenience of their cost in terms of time and money. Resorting to social media analysis methods to study consumer behavior is increasingly frequent since, in addition to increasing efficiency and being cheaper, they are closer to consumer thinking than more traditional techniques such as surveys [39].
Among SNSs, Twitter has become one of the most popular microblogging services and is attracting the interest of marketing and consumer science researchers [40,41] because provides access to instinctive consumer information obtained in real-life situations. Thus, its primary purpose is to allow people to share their immediate thoughts, but it also has the potential to be an important data source regarded consumer behavior related to agri-food products.
Word-count analysis has dominated [40,42] the research with Twitter data related to agricultural food. Manual content analysis is still one of the core methods used in food-related Twitter research [15]. However, in our digitized media environment, Automated Content Analysis (ACA) has gained importance and popularity [43]. Recently, quantitative techniques for extracting intelligence from food-related tweets as sentiment analysis [44,45] using Partition Around Medoids (PAM) and clustering algorithms [46]; or text analysis using Machine Learning (ML) such as Support Vector Machine (SVM) and hierarchical clustering [47], or n-gram [14] are being used.
ACA offers a wide range of text capturing, ML and Natural Language Processing (NLP) techniques for mining intelligence from SNSs [48] that can then be utilized for analysis of keywords, summarization of text or clustering by employing the above techniques [49].
Content analysis approaches can summarize large volumes of text into closely grouped themes [50]. They have also been used in conjunction with NA [51], enabling studies to be conducted whereby visual graphs based on co-occurrence of keywords can be developed [52]. Using such parameters, it may be possible to develop theories surrounding network level attributes [53].
However, it was found that food-related SNS research remains fragmented and, although in the domain of agribusiness is in a preliminary stage, it has lots of potential in terms of theoretical, mathematical, and empirical research. Although rarely used to date with berry fruit-related Twitter data, Word-count, GTM [47,54]—complemented with automated content analysis- and NA [55], will be analyzed in this field of research.

3. Material and Methods

In this study, social tags (hashtags in Twitter) are analyzed, which serve as mechanisms for the semantic unification of concepts within a social network [56,57], as Twitter is based on short messages—less than 280 characters.
We developed a five-stage of theory building based on the following big data-driven research by [58] and text mining model by [59]:
  • Data acquisition: Automatic data acquisition from social media;
  • Data processing: Transformation and cleaning with text meaning;
  • Data understanding: Factor identification with Word-count (term frequency analysis) technique;
  • Theory development: To analyze keywords using GTM to identify association rules among them and major emerging themes;
  • Data Insights: Automated content analysis through NA (community detection and modularity analysis) and visualization techniques to generate deep insights from the textual data.

3.1. Automatic Data Acquisition

To identify which terms to use as a seed for extraction, a previous analysis of the entries on the internet was made. Although the first intention was to use the term ‘berries’ it was decided to use the words ‘strawberries’ and ‘fresas’ as search criteria since they were the terms that contained the most entries in Google. Thus, the criterion for obtaining tweets was particularized for those tweets containing the hashtags #strawberries or #fresas (strawberries in Spanish).
Data were recovered using R software [60] through the Twitter package [61] that provides communication with Twitter Application Programming Interface (API), searches for and collect tweets with specific keywords, and thereby collects the data and stores in a database. This package, which has been previously used to explore consumer perception of different products [62,63], mines data from the information contained in the social network associated with the hashtag.
The extraction did not specify the language of the tweets or the specific geographical location from which they were published, so any tweet (available after authentication on the server) containing the keyword could be retrieved from its public location.
As the number of tweets recovered in previous research has varied considerably, from a few to millions [64,65], a request was made in 30 June 2019 to extract a total of 9999 tweets (excluding both replies and retweets). The automatic data extraction was made twice, with #strawberries and with #fresas, based on all tweets who contained the searched hashtag within them.

3.2. Data Processing: Text Cleaning, Tokenization, and Data Loading

Not all primary datasets may be useful unless the collection is conducted appropriately [66,67]. For example, if tweets are extracted based on hashtags as #strawberries, how does one identify the rest of the keywords objectively which may help to get concepts or categories of concepts?
The processing phase consists of filtering and manipulating tweets to clean and remove a large part of data which do not meaningfully contribute to the research question as retweets [58], or removing terms that do not contain content such as stop words, numbers, and punctuation marks, or converting them to lowercase to eliminate ambiguity.
Analyzing Twitter large data without properly handling social bots has serious implications. For the purpose of this study, we used volume and frequency as criteria to categorize them [68].
Tokenization refers to divide the tweet content into minimal units with their own meaning, that is, words, which for this analysis will be hashtags. Prior to the division of the text, the elements under study were tweets and each was in a row, thus fulfilling the condition of an observation as a record. When performing the tokenization, the element to study becomes each token (hashtag), but several hashtags can be found in the same tweet. To resolve this point, each token list must be unnested, doubling the number of records as many times as hashtags come in the same tweet.
The entire cleaning and tokenization process was automated by designing a function that was implemented in the R script.
This information, after cleaning and filtering elements, was saved in a Comma-separated Values (.csv) format.

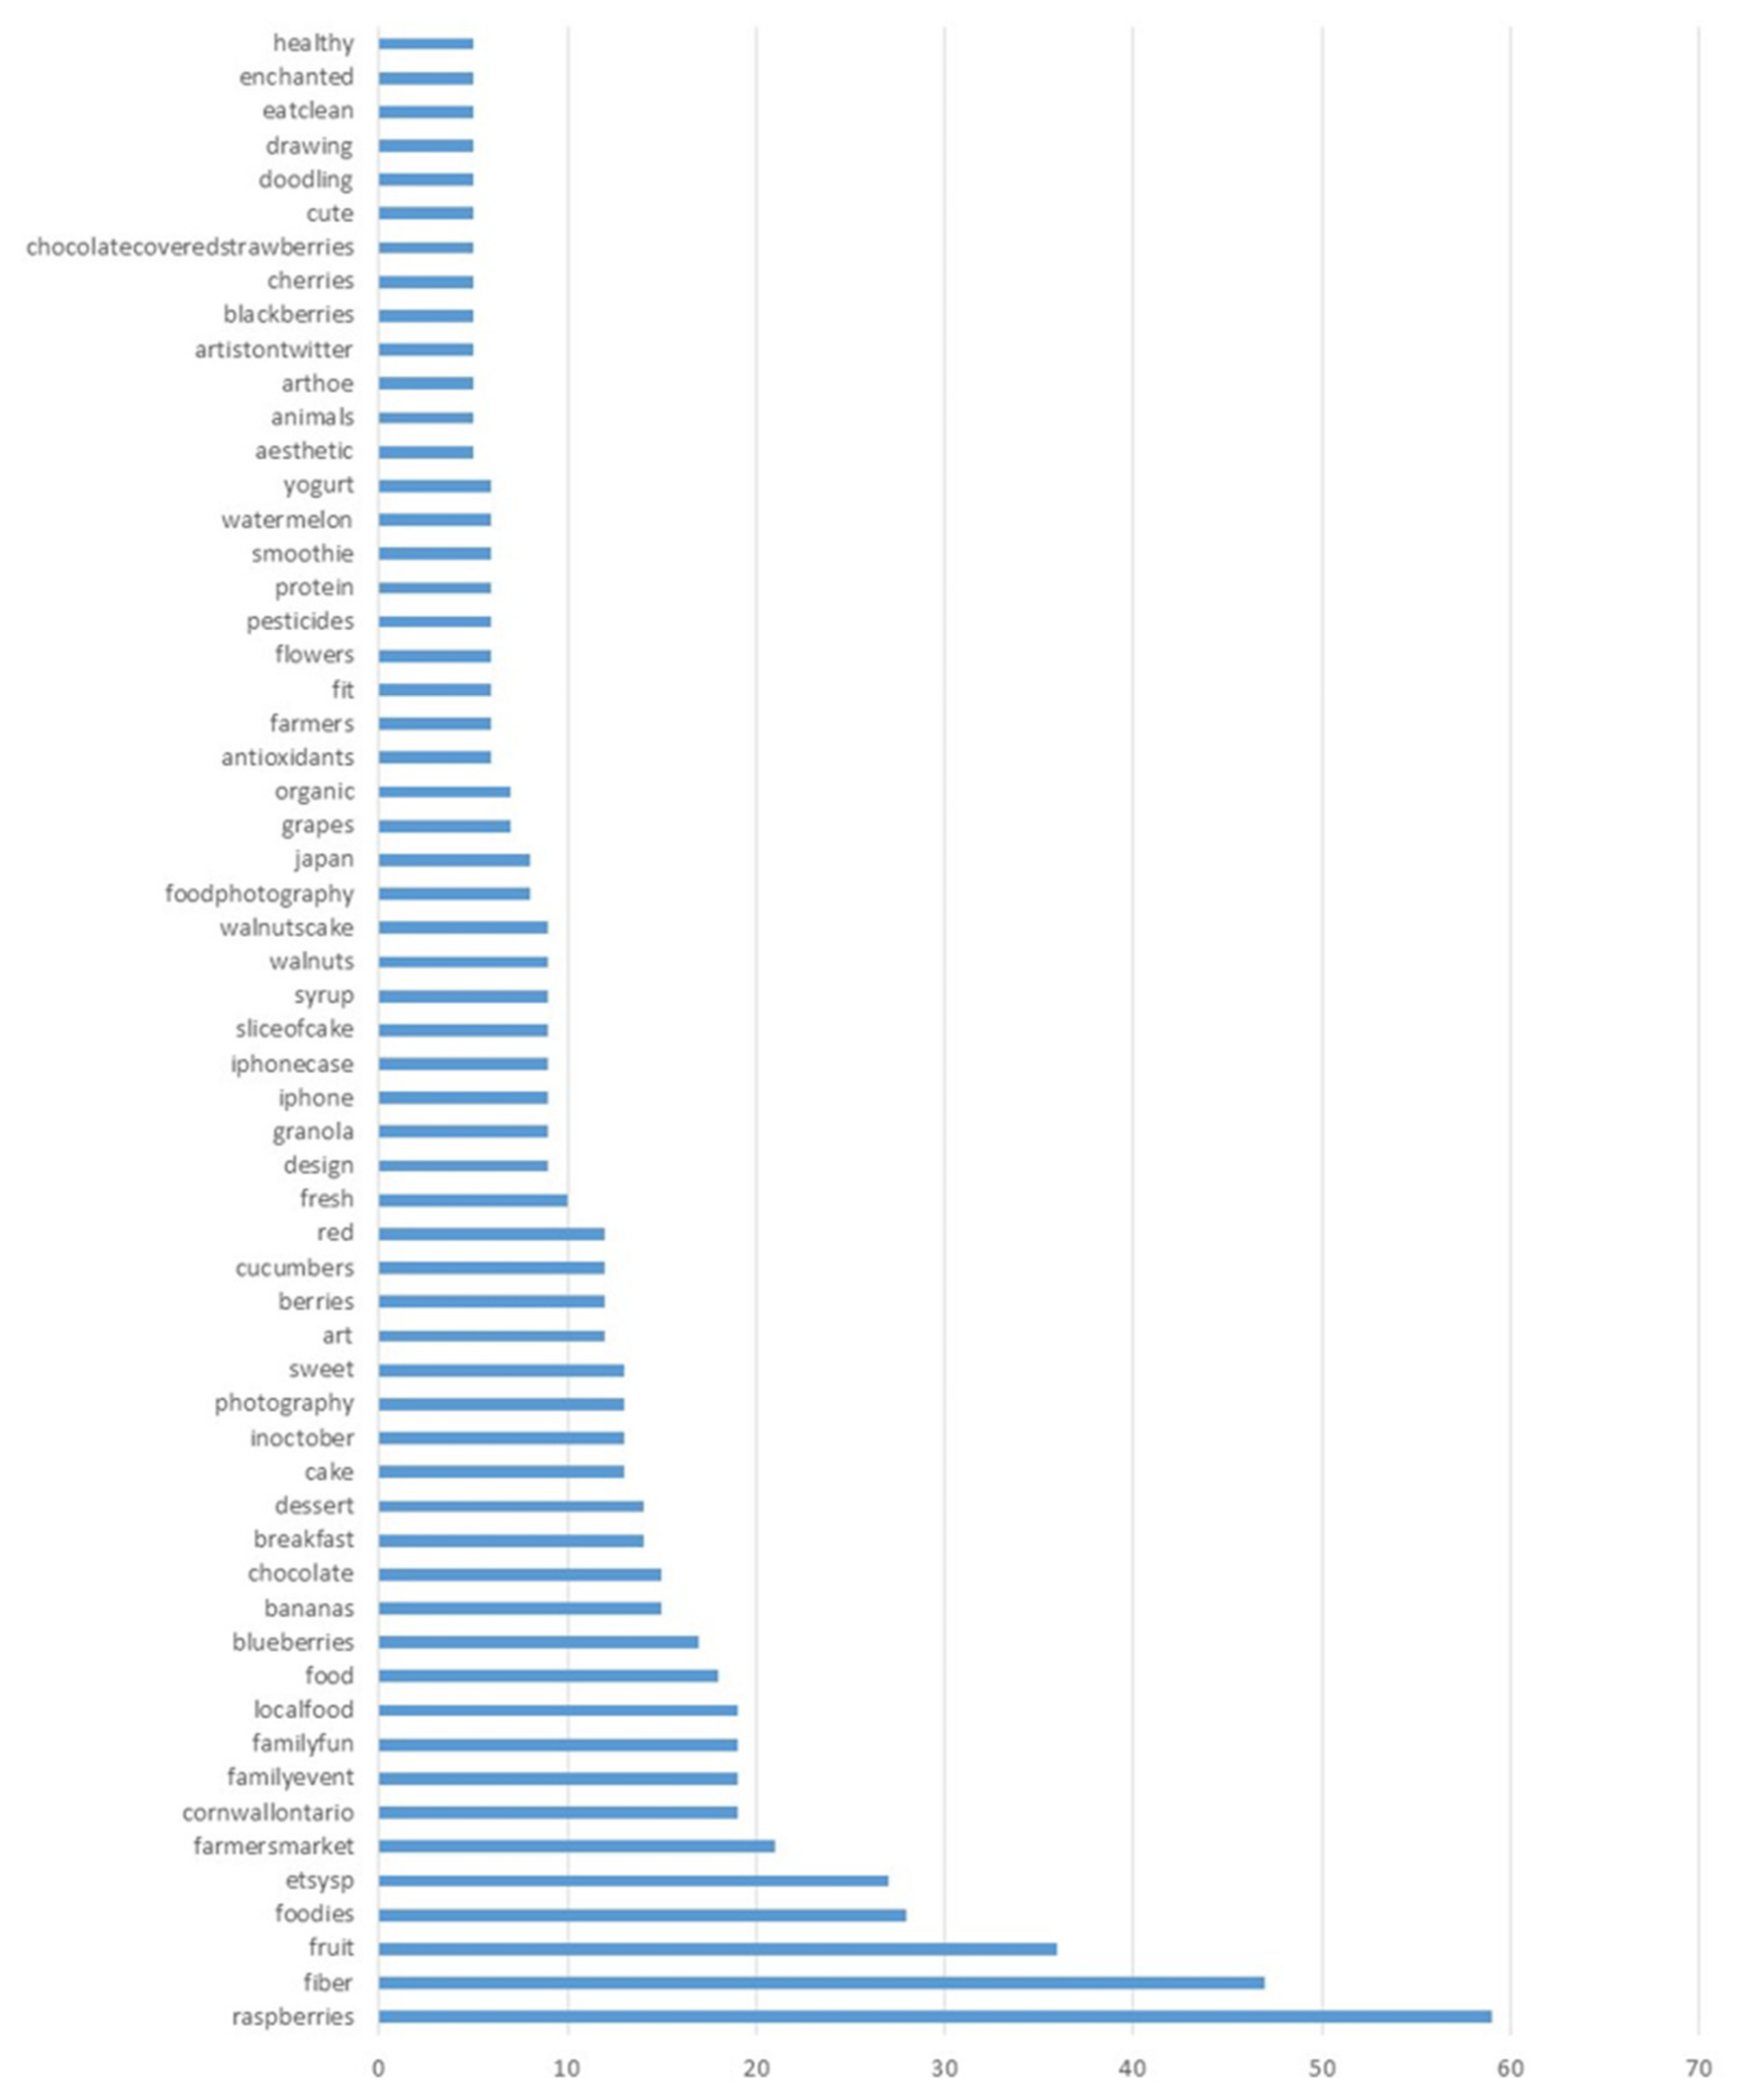
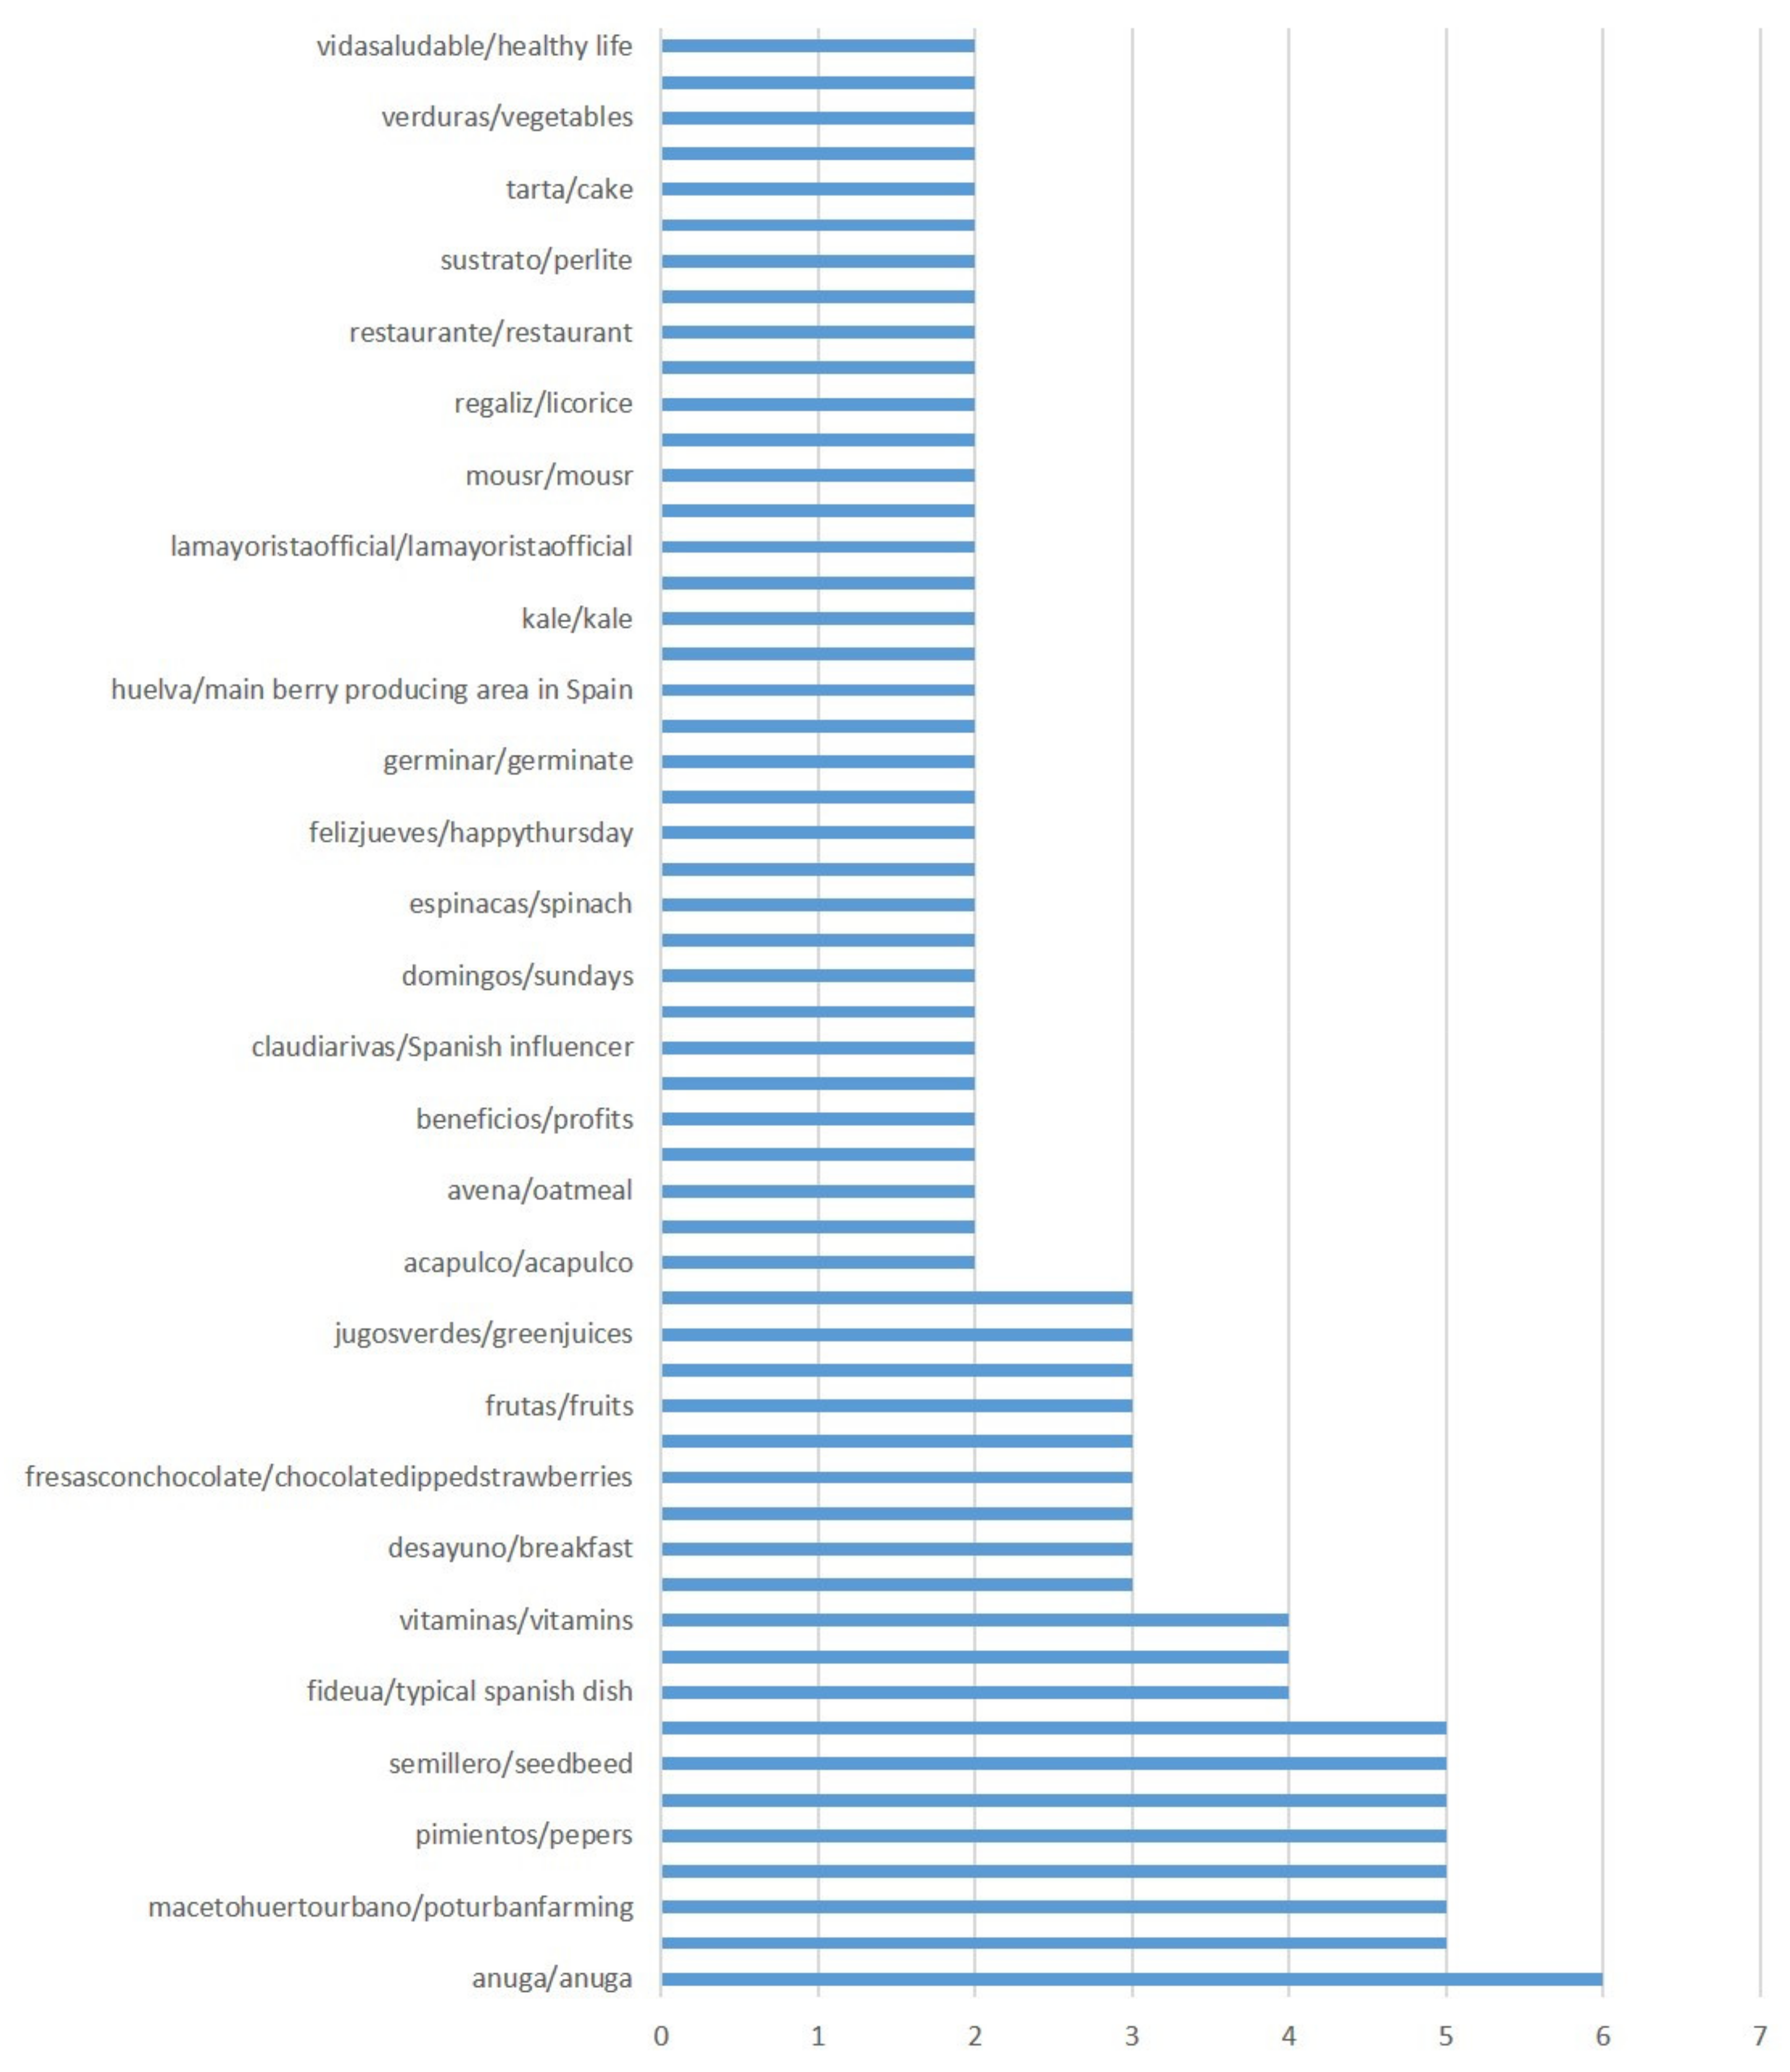
3.3. Data Understanding with Word-Count

Text cleaning and processing are necessary in order to extract intelligence from the unstructured texts (tweets) extracted.
In this study, an automatic text processing method based in tokenization was performed to know hashtag frequencies. The procedure of tokenization splits sentences into words and extracts hashtags that form the basic units of our analysis.
Individual word analysis is often applied to Twitter data analysis, but it is potentially problematic because it ignores the broader context of the tweet. However, such an analysis has the potential to quickly summarize large volumes of data. In this case, because they are words written intentionally to reinforce their meaning, a count of hashtags contained in tweets was made.

3.4. Themes with Grounded Theory Method (GTM)

To improve the transparency of the research, the grounded-theory approach was performed following the [69] methodology.
Following an interpretive, inductive approach, hashtags automatically retrieved were constantly analyzed and manually compared in an iterative process in which hashtags (initial codes)—words with a low level of abstraction—were classified into similar groups by assigning conceptual labels (focused codes) to the units of meaning according to the coding procedure until the discovery of emerging categories and themes with high level abstraction [69,70,71,72].
In our case, we highlight a top-down approach, where two coders, who speak English and Spanish fluently and with more than two years of experience in consumer behavior research, working together in the process of constant comparison of data until reaching a consensus on the establishment of the final topics. They followed a manual process to identify emerging themes through reading each hashtag in the context of the others and their frequency and manually categorizing it through applying a conceptual framework [71].
Constant comparative analysis entails that coders need to make comparisons between empirical data and conceptual labels, between conceptual labels and themes, among data, among conceptual labels, and among different ‘slices of data’ in order to reach higher levels of abstraction and advance with the conceptualization [73]. During the analysis, coders had to be sensitive to data analysis that guided them to what to do next.
Data reduction was achieved by limiting the analysis to those aspects that were relevant with a view to the research questions [74].
Credibility (truth value), transferability (applicability), and dependability (consistency) [75] were used to evaluate the trustworthiness of the grounded theory. In order to increase the credibility of the findings and diminishing the encoder bias, we employed triangulation through interviews with producers and consumers. A total of 20 interviews were conducted with consumers chosen from among university staff (five administrative staff, five professors, five students, and five Erasmus students), and five berry managers from the area were interviewed. To facilitate transferability, authors provided to the coders background data to establish the context of the study to allow comparisons to be made [76]. Finally, consistency was achieved via automatic data extraction.
Therefore, through an inductive and iterative process, using constant comparison of hashtags, emergent categories were discovered [70,72], the topics in the data [77].

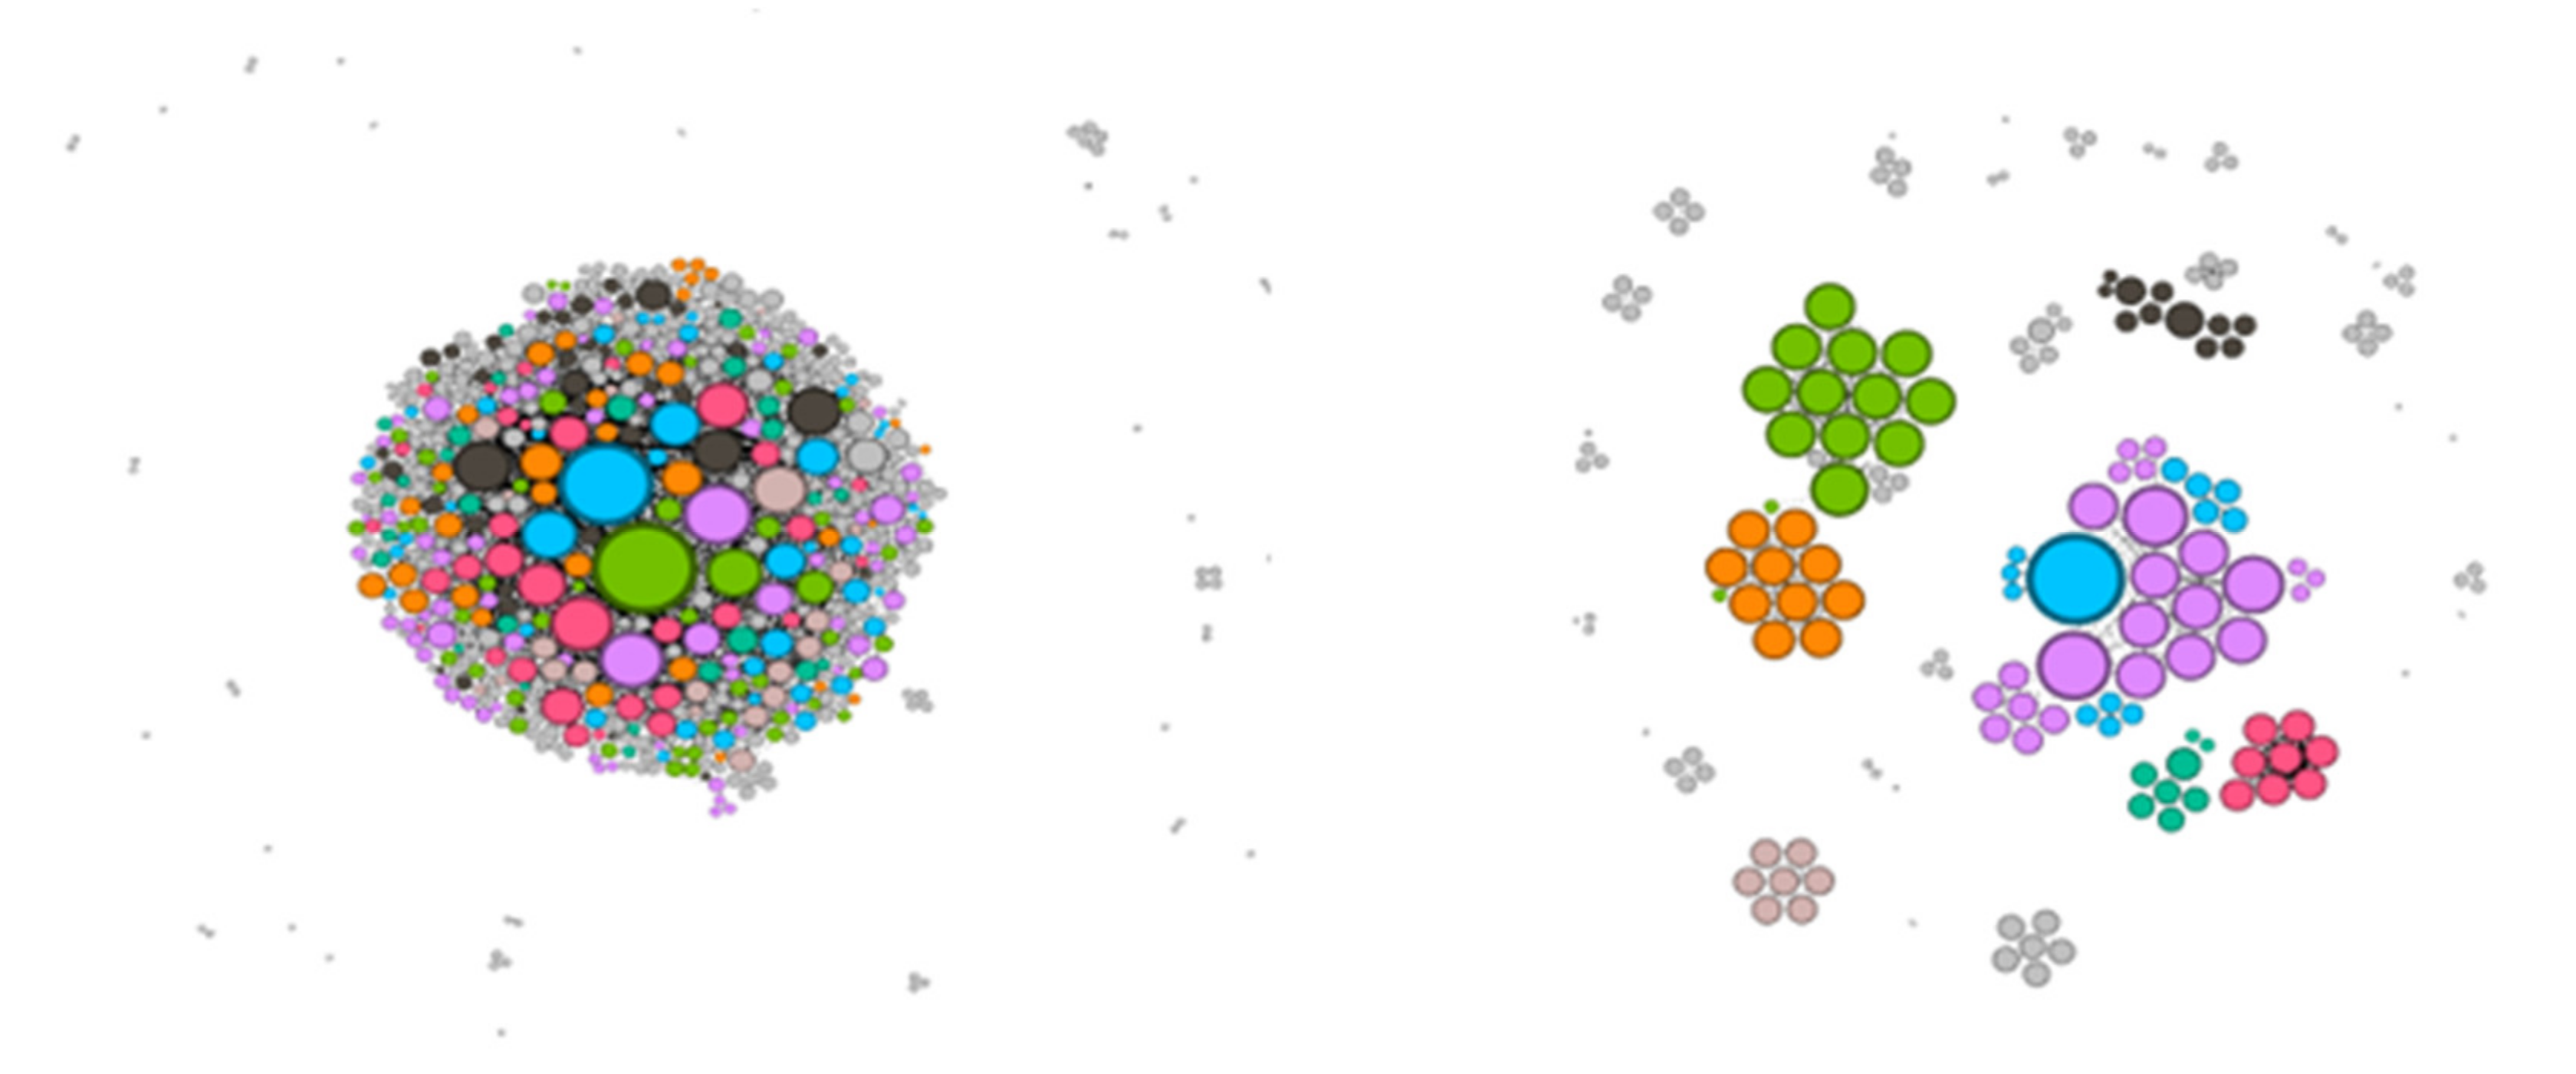
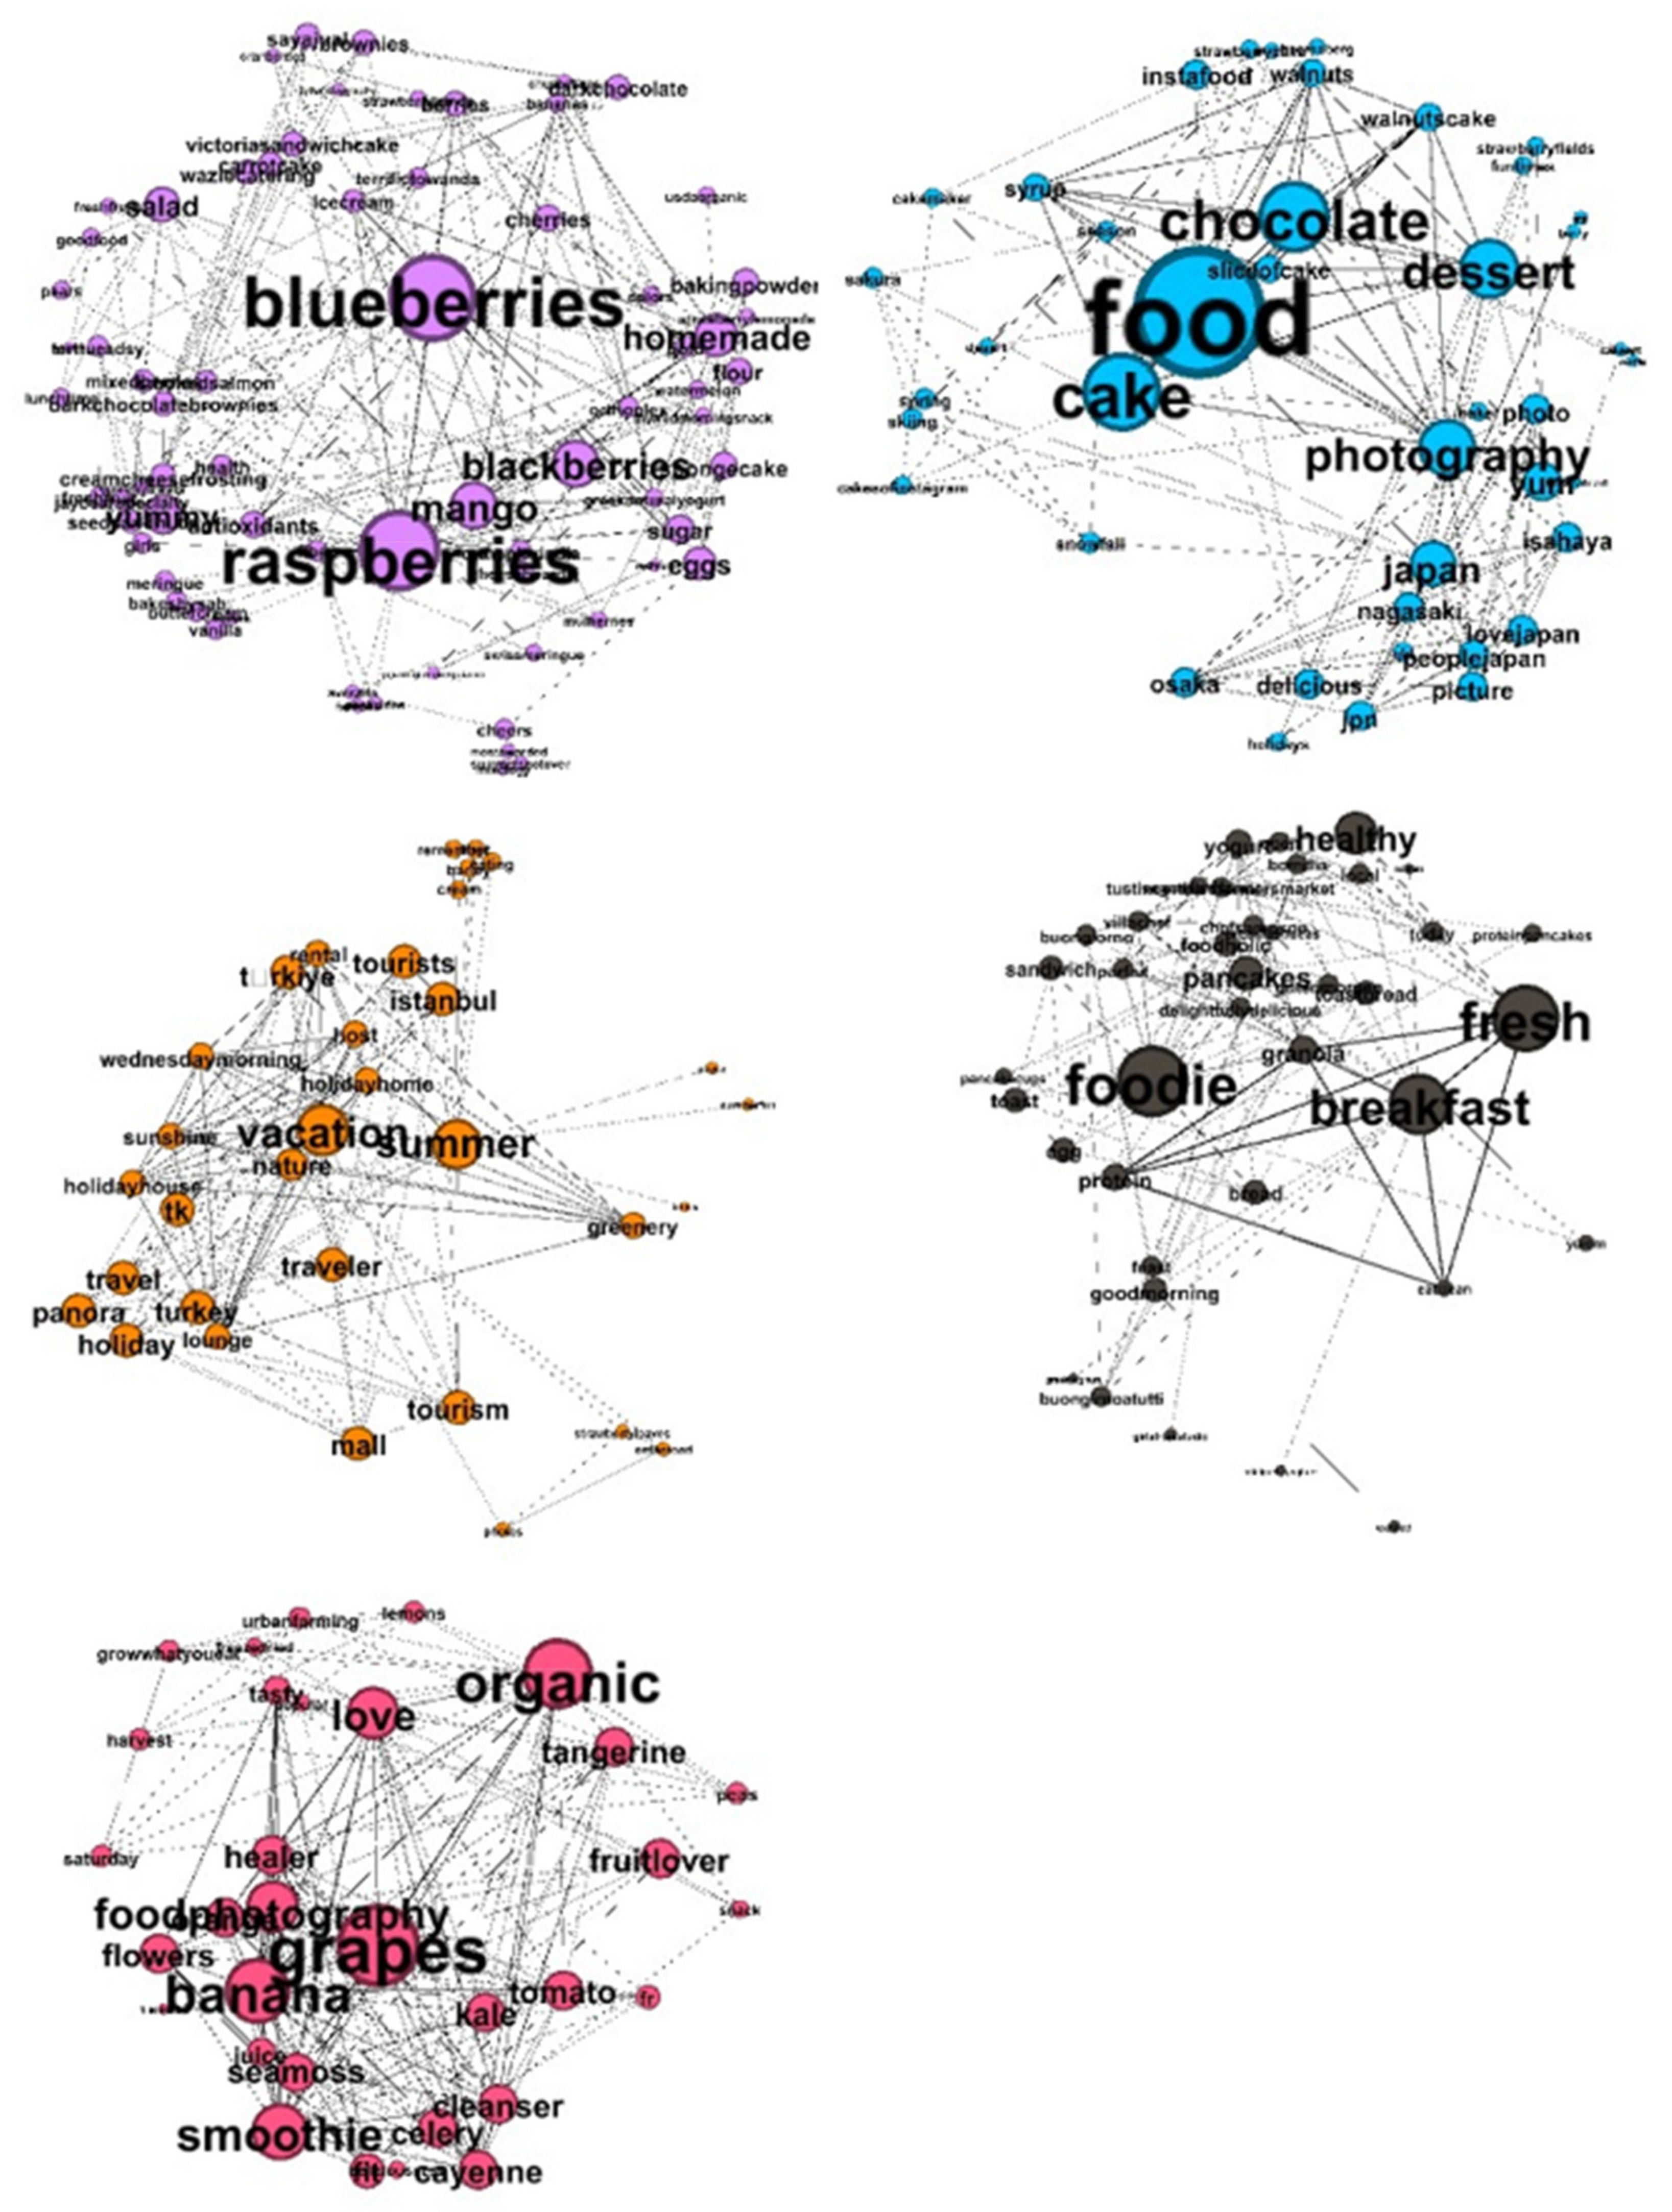
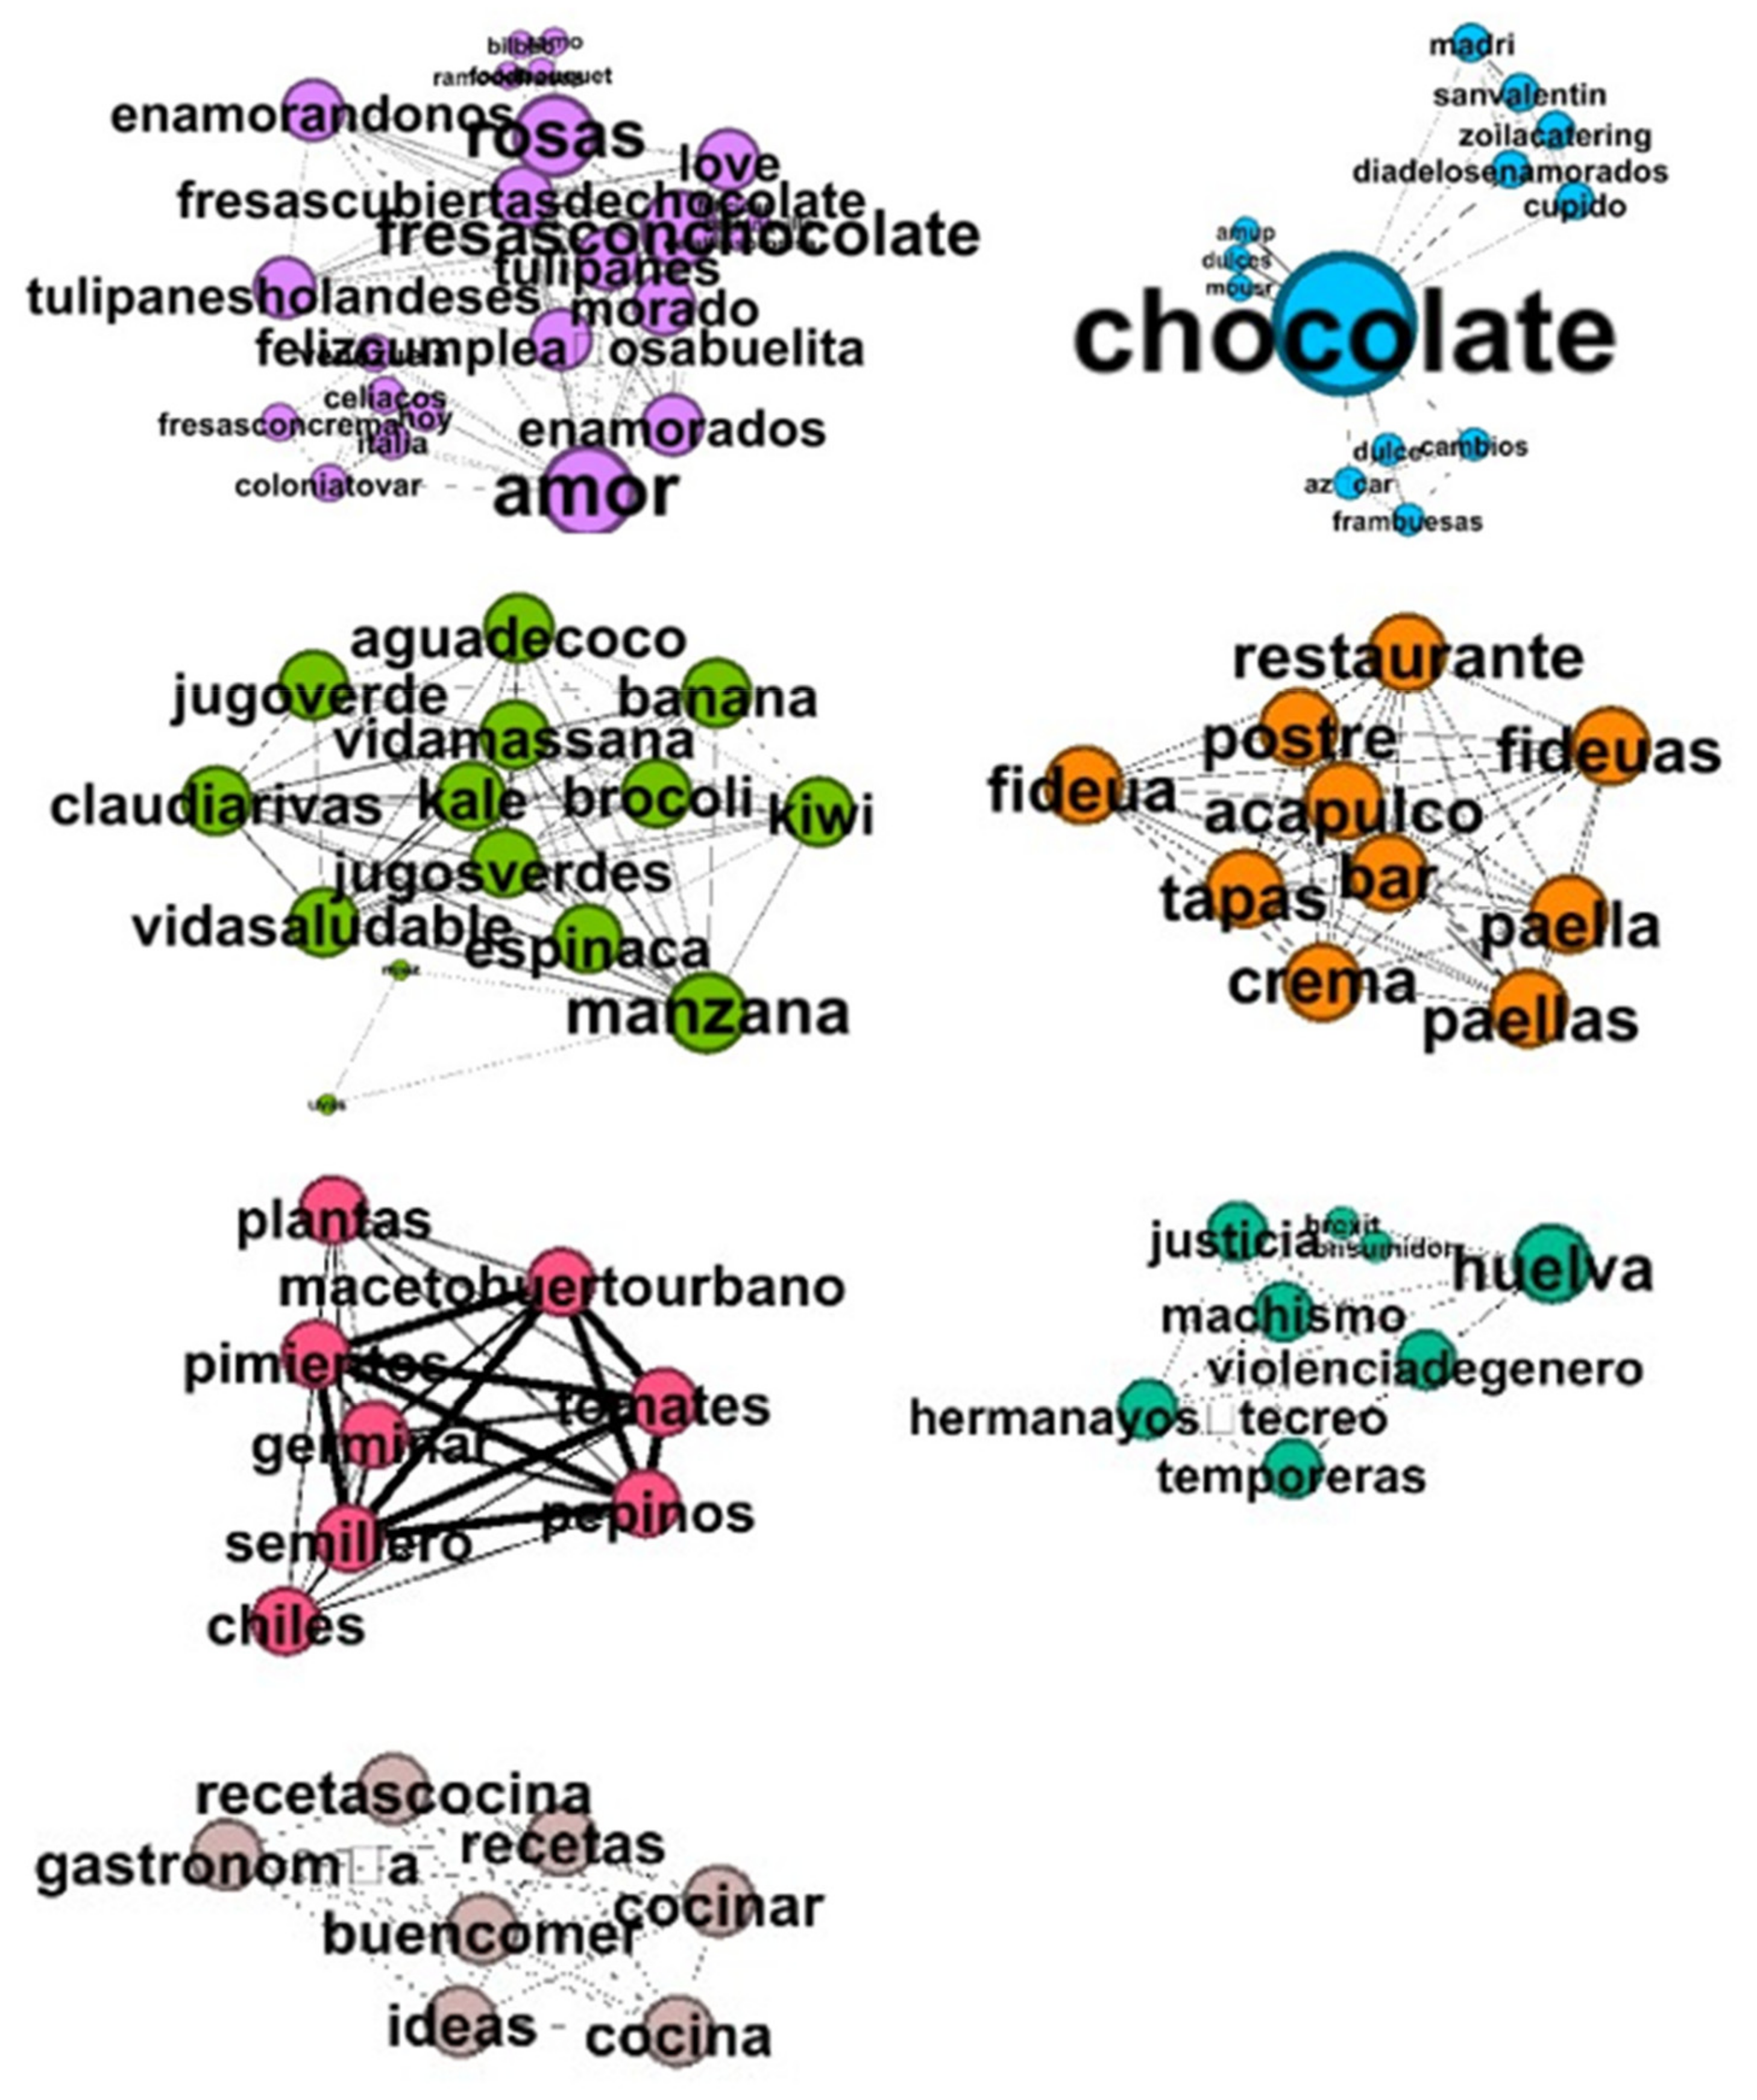
3.5. Insights with Network Analysis (NA)

In recent years, social media research has begun to overcome the quantitative perspective to explore other aspects through network theory.
This study utilizes the overall network structures in order to identify key hashtags and similarities among strawberry-related hashtags. The two network-structural attributes were established as indicators of information flow characteristics: centralization, or contribution of a node according to its location in the network; and modularity, or the division of a network’s force between clusters.
Measurements of centrality have been widely used to capture patterns of information flow in a network [78,79]. Using degree centrality, nodes with more connections are considered more important. Twitter networks are 2-mode, meaning that each link has a direction, from user to hashtag. To analyze hashtags relations, the 2-mode networks were transformed into 1-mode.
The process of identifying the underlying structure of the data in terms of grouping the most similar elements is called clustering. Elements included in the same cluster should be similar, and elements included in different clusters should be dissimilar. The concept of similarity or dissimilarity will depend on some kind of metric. One of the most well-known algorithms for community detection was proposed by [80]. This method for measuring the modularity was modified trying to reduce the computational demands significantly through several new approaches [81,82].
The algorithm selected in this work to choose the most appropriate method for better identifying communities talking on a particular topic (strawberries in this case) was the Louvain modularity [83]. This is a bottom-up algorithm, similar to the earlier method by [81] where initially every vertex belongs to a separate community, and vertices are moved between communities iteratively in a way that maximizes the vertices local contribution to the overall modularity. The algorithm stops when it is not possible to increase this modularity.
This methodological level begins with the .csv file import into the open-source network analysis and visualization software called Gephi [84], written in Java on the NetBeans platform. The 2-mode Twitter network with directed ties indicating links between users and hashtags was transformed into 1-mode network with undirected ties among hashtags.
The Fruchterman–Reingold algorithm, followed by the Force Atlas 2 algorithm were chosen because they allow for the attraction of the most central nodes and separation of those least central. The first has the function of arranging the nodes from the attraction–repulsion relationship of the gravitational force created by the algorithm itself, and the second serves to disperse the groups, creating space for the larger nodes.
Finally, the nodes in the graphs were colored according to the communities to which they belonged calculated according to the Louvain modularity [83], and the size of the node was represented in the graph proportionally to the number of links (degree).

4. Results

We made two extractions with a total of 9999 tweets in 30 June 2019. The script execution first collected the last 9999 tweets that included the hashtag #strawberries and then the other 9999 tweets that included #fresas. In the first case, 2184 tweets contained hashtags other than strawberries and in the second, 1596 tweets contained hashtags other than fresas were obtained. The time period covered by the extraction was about seven months, from 2 December 2018 for #strawberries, and 12 December 2018 for #fresas. Most of the strawberries world production from the main producers is concentrated in this period.
In total, 11,150 hashtags were collected and treated, of which 2249 hashtags were valid for the Content Analysis.
After a filtering, tokenization, and debugging process, a total of 579 unique hashtags for the term ‘strawberries’ and 163 for ‘fresas’ were obtained.
Figure 1 and Table 1 show the extraction procedure as well as some basic statistics about the number of tokens analyzed.
To summarize this large amount of heterogeneous data, only the 50 most frequent hashtags were considered (Figure 2 and Figure 3).
Hashtag frequencies using the word-count technique allowed to discover emerging categories. In that regard, ‘Anuga’ (the Cologne food trade fair) was the word most used in fresas-related tweets, confirming that there are users who use the term in a professional context. There were also cases in which productive practices were described, such as ‘urbanfarming’ and other terms associated with farms (‘seeds’, ‘cucumbers’, ‘peppers’, ‘tomatoes’, ‘spinach’, ‘germinate’, ‘substrate’). The most common words in the tweets related to the moment of the occasion were ‘dessert’ and ‘breakfast.’
‘Chocolate’ was also among the most frequent words, indicating the association with ‘sweets’, although there were also others (‘vitamins’, green juices, healthy life, and healthy lives) more related to ‘health’. The words ‘love’ and ‘lovers’, which also appeared, indicate their association with impulse-buying situations. Without reading tweets in their entirety, the high frequency of appearance of the words ‘fideua’ or ‘paella’ seemed absurd. However, these words reflect how Twitter is often used to list daily activities.
Several of the most used words were related to the specific context of the feeding situations. For example, words like ‘Sunday’ were found with a relatively high frequency, which indicates that people talked about the time of the meal in their tweets. We also found words that refer to special occasions or places (for example, ‘Acapulco’, the city in Mexico), as well as words related to other people involved in the occasion of eating (‘family’ or ‘bestfriends’). Words related to specific agri-food products, such as other fruit (especially ‘blueberries’ and ‘apples’), were also identified.
On the other hand, the hashtags frequency analysis of ‘strawberries’ highlighted the association with other fruit (but this time with ‘raspberries’ in addition to ‘blueberries’ and ‘bananas’, and to a lesser extent with ‘blackberries’, ‘grapes’, and ‘watermelon’), health (but this time as ‘fiber’ and with many more terms like ‘organic’, ‘antioxidants’, ‘fit’, ‘eatclean’, and ‘healthy’), sweets (‘chocolate’, ‘cake’, ‘sweet’), and acquaintances or family (‘familyevent’ and ‘familyfun’).
Finally, there are mentions of times and modes of consumption (‘breakfast’ and ‘dessert’). A total of three new associations appear, one referring to local consumption (‘localfood’ and ‘farmersmarket’), another to art (‘photography’, ‘art’, ‘design’), and the third to consumption mode (‘smoothie’ and ‘yogurt’). The reference to love appears to a lesser extent (‘flowers’) and urban production does not appear.
In total, 13 focused codes (categories) were built (as numbers). In the Spanish data analysis, categories 10–12 do not exist, and in the analysis of strawberries, the category seven was not built (Table 2).
The manual coding process based on GTM identified five common themes and a sixth just for the strawberry dataset. The manual coding process based on GTM identified five common themes, and a sixth just for the strawberry dataset: substitute fruits (1), context of consumption (2), food consumption (3), lifestyle (4), associations with production (5), and associations with art (6). (Table 2).
The first theme is the comparison the strawberries with other products, mainly fruits.
The context of the activities related to agri-food products was a frequent topic in tweets analyzed. People described where, when, and with whom they were talking about strawberries. The most frequently mentioned places of consumption were restaurants (in the Spanish case) and farmersmarket (in English). In general, the ‘home’ location was mentioned less frequently than elsewhere, suggesting that people do not tend to make explicit reference to their homes when they tweet about feeding situations. Instead, they seem to refer to places considered different or special (e.g., Acapulco). Some feeding situations were motivated by a special occasion, such as special days (happy Sunday) or events (familyevent). The hashtags also contained information about a specific situation in time (breakfast, dessert).
Epicurean attitudes toward food such as ‘chocolate perverso’ were found in tweets. Additionally included were references to emotions (love, cute, happy Sunday, happy holidays).
References about healthy and unhealthy strawberries’ aspects, such as vitamins, healthy life, fiber, organic, antioxidants, eat clean, and healthy are also regularly presented in tweets.
Finally, Figure 4 shows the network obtained with the application of these spatialization criteria, observing how the position of the hashtags in the ‘fresas’ network is much more defined than in ‘strawberries’ network.
The final procedure was the detection of communities by calculating the modularity [83] (Figure 5 and Figure 6). Overall, five communities appear on the #strawberries network and seven on the #fresas network.

5. Discussion

The research discovered that people in their tweets described associations with topics that interest them. This confirmed our aim that these tweet content analysis techniques can serve as a low-cost marketing tools.
Sometimes, people tweeted about a craving for certain agri-food products, in line with other research [85,86].
The context of eating strawberries was one of the main issues that emerged from the content analysis. This accords with the perception that context is recognized as a key variable in the choice of agri-food product [87,88,89].
The data contained in our study shown that people tweeted mainly on strawberry consumption situations in a positive emotional state. According to [90], people use positive words when describing or remembering eating experiences due to a positive disposition toward food. Our results also reflect that meals are positively remembered when they involve family and friends [91,92].
Twitter was also used when making plans to eat, either with family or friends, which could be related to a social activity [93]. Related with this aspect, some strawberry consumption situations were motivated by a special occasion, such as special days (happy Sunday) or events (familyevent) [89,94].
Tweets that describe feeding situations in restaurants, or ‘farmersmarket’ could be related to the growing fruit consumption outside home, even on the street [95]. This suggests that Twitter could offer researchers the opportunity to recover impulsively generated and real-life data. In this regard, it should be pointed out that consumers increasingly use smartphones to access social networks, which allows data to be collected in any situation. Worldwide, 52% of total web traffic originates from mobile phones, representing 74% of the traffic on social networks [96].
In light of previous research on agri-food choices, patterns coincided with expectations [85,86,97] as it was common for tweets to include content about the specific fruits that people were eating, buying, or preparing.
Epicurean attitudes toward strawberries [98] were found in tweets. Associations included positive words such as ‘chocolate perverso’. There were also references to emotions (love, cute, happy Sunday, happy holidays). This is in accordance with the fact that eating has been widely reported to be associated with emotional factors [99,100].
Tweets also give importance to healthy food as authors point out [101,102,103]. Thus, the ecofriendly labels and standards can play a significant role in influencing consumer purchase decisions [104]. However, results seem to indicate that users are not interested in communicate about sustainability in contrary to [42].
Manual content analysis using GTM revealed some differences between users who talk about ‘fresas’ and those who talk about ‘strawberries’. While the former give more relevance to the situation of eating out (restaurant, bar) and production (urban, farming, or professional fair), the latter pay more attention to the healthy lifestyle, the product’s connections with art, and food security (pesticides).
However, automated content analysis through NA, in addition to reflecting the differences between the two user profiles, also discovers new issues that did not emerge with frequency analysis or GTM methodology. Regarding the differences between user groups, it was observed that ‘fresas’ users relate chocolate consumption (sweets) with special days (diadelosenamorados) while those using ‘strawberries’ associate this consumption with art (photography). The ‘fresas’ user also comments on eating out (restaurant, tapas, bar), while the community analysis detects a new context environment in the ‘strawberries’ group most related to holidays (vacations, summer, tourism). Finally, both groups of users talk about health, but the coding by GTM classifies certain fruits (apples) within the theme ‘fruits’ and the communities include them within the ‘health’ theme (apples, spinach).
Last but not least, in addition to the relationships between topics, NA detected new communities that did not emerge with the GTM analysis or Word-count technique: in relation to the hashtag ‘strawberries’, a group related to leisure (vacations, summer, tourism), and for ‘fresas’, one community related to recipes (recipes, cooking) and another related to exploitation of working people (Huelva, seasonal workers, justice, sexism, gender violence).
Finally, to use Twitter data for marketing research, we must be aware of its limitations and how to address them: related to the information analyzed from Twitter, hashtags are minimal units, but while they do not report on everything that a tweet can express (emotions, context, feelings), they are key words in the tweet that have been intentionally written by the user. Another limitation is that Twitter users are a non-representative sample of the general population [105] and, although men and women are equally represented, the distribution is largely skewed toward younger and better educated people. However, such systematic bias of the sample may decrease over time as more people become active users.
Due to the fact that the Spanish hashtag frequencies are much lower than the English ones (see Table 1 and Figure 3), the use of this analyses for the intended marketing purposes in this study is more limited in the Spanish case than in the English one. Nevertheless, a bigger selection of tweets in the automatic data extraction would resolve this problem.
Taking into account the aforementioned Twitter limitations, there are several directions for future research.
It would be interesting to expand the automatic data extraction to others hashtags (i.e., blueberries and raspberries) or to see the distribution or frequency of the number of hashtags in the tweets in addition to strawberries (strawberries) to find differences in this regard when considering these different sub-networks.
Moreover, the network analysis could be expanded taking into account other centrality metrics (i.e., intermediation) or clustering (i.e., PAM).
This study could be expanded by investigating consumer perceptions that result in the identification of the activities most desired by consumers. In addition, future research should try to examine the effectiveness of the different SNSs in various outcome measures, such as commitment, purchase intention, and brand affinity. It would also be interested to compare GTM and NA with other ML-based content analysis or apply them to other terms.

6. Conclusions

By accepting that social networks have transformed and will continue to transform the way in which companies and consumers communicate, berry industry must use social media data as part of their overall marketing efforts, as data are numerous, valid, and cheap to obtain.
It is true that tweets represent user opinions. We have tried to argue (although not to demonstrate) that hashtags contained in tweets are units with meaning that, analyzed as a whole, can lead us to obtain a representation of user’ interests, although it is also true that they do not represent the entire Strawberry consumer population. However, we have obtained several interesting conclusions.
The results of this study provide a very necessary first step to providing such guidance considering Twitter as a useful source of information for berry-consumer marketing research. Firstly, Automated Content Analysis (ACA) demonstrates which hashtags represent the main user interests.
Secondly, NA found out non-explicit relationships among consumers’ hashtags that reflect relevant topics for marketers of berry industry.
Thirdly, our study contributes to explore a global research trends that is the agri-food data from social networks. Using #strawberries and #fresas as search criteria, it was found that simple analysis based on word counting yields less information than the results of the other techniques used, highlighting two obstacles:
(i)
inclusion of non-relevant hashtags; and
(ii)
no identification of underlying issues or relationships. Even though content analysis using GTM provided much deeper information, it took much more time. NA, in addition to being faster, proved to be more efficient and allowed the discovery of new underlying themes and relationships.
In addition to the comparison of the three content analysis techniques, the analysis of the two separate datasets provided wealthy information to understand the differences between these markets.
Thus, in word-count analysis, it appears that English-speaking users have an orientation towards organic food rather than to vitamins of Spanish-speaking users. The first profile seems to be concerned about pesticides, while the second more about production. Regarding the differences in modes of consumption, the first group seems to describe more types of consumption such as yogurt and smoothies, while the Spanish-speaking market tweets more of consuming in more impulsive situations. Beauty and art are connotations that appear only in the first group. GTM reinforces these ideas, especially (and important) that of pesticides vs. farming, organic vs. vitamins, and art. Finally, NA brought to light more defined groups in the Spanish network and new topics, which, with the previous techniques, could not be intuited, such as social justice relationships in production (sexism, racism, immigration) and recipes in the Spanish dataset and holidays (vacation, summer) in the English dataset.
Although some relationships are incoherent with the consumption of strawberries, making it necessary to refine or to analyze in depth, connections have been found that a conventional market study can establish, such as places, situations, or feelings in which consumption is favored, but to a lower cost.
In this type of analysis, it is possible to determine consumer groups and to know their motivations and desires, which allows offering the product in formats with more acceptance or with elaborations (i.e., strawberries and chocolate), as well as segmenting the marketing campaigns.
On the other hand, it might be a challenge to evaluate whether the presence of a specific hashtag in a tweet is random, i.e., to reveal whether there is a pattern reflecting a trend in the consumer ‘opinion.
In conclusion, ACA, and specifically NA, can imply opportunities so that, in a simple and cheap way, the berry producing sector can better understand consumer behavior.
To maximize its benefits, this agri-food sector could strategically build a technological knowledge base of social media analytics, and strategically manage and support its use by facilitating IT-marketing and IT-organization alignments [106].
Despite the stated limitations, results confirm the potential of strawberry-related hashtags from Twitter for conducting berry consumer studies, useful in increasing the competitiveness of the berry sector and filling an important gap in the literature by providing guidance on the challenge of data science in agronomy.

Author Contributions

Conceptualization, methodology, software, validation and formal analysis and writing—original draft preparation, J.D.B.; investigation, resources, data curation, writing—review and editing, J.D.B. and A.Z.; funding acquisition, A.Z. All authors have read and agreed to the published version of the manuscript.

Funding

This research was funded by Department of Agroforestry Science-University of Huelva.

Conflicts of Interest

The authors declare no conflict of interest.

References

  1. The Economist. The World’s Most Valuable Resource is No Longer Oil, but Data. Available online: https://www.economist.com/leaders/2017/05/06/the-worlds-most-valuable-resource-is-no-longer-oil-but-data (accessed on 20 February 2021).
  2. Appel, G.; Grewal, L.; Hadi, R.; Stephen, A.T. The future of social media in marketing. J. Acad. Mark. Sci. 2020, 48, 79–95. [Google Scholar] [CrossRef] [Green Version]
  3. Galati, A.; Crescimanno, M.; Tinervia, S. Social media as a strategic marketing tool in the Sicilian wine industry: Evidence from Facebook. Wine Econ. Policy 2017, 6, 40–47. [Google Scholar] [CrossRef]
  4. Li, F.; Larimo, J.; Leonidou, L.C. Social media marketing strategy: Definition, conceptualization, taxonomy, validation, and future agenda. J. Acad. Mark. Sci. 2021, 49, 51–70. [Google Scholar] [CrossRef]
  5. Stelzner, M. 2016 Social Media Marketing Industry Report: How Marketers Are Using Social Media to Grow Their Business. Available online: http://www.socialmediaexaminer.com (accessed on 20 September 2020).
  6. Kaplan, A.M.; Haenlein, M. Users of the world, unite! The challenges and opportunities of social media. Bus. Horiz. 2010, 53, 59–68. [Google Scholar] [CrossRef]
  7. Nobre, H.; Silva, D. Social network marketing strategy and SME strategy benefits. J. Transnatl. Manag. 2014, 19, 138–151. [Google Scholar] [CrossRef]
  8. Stebner, S.; Baker, L.M.; Peterson, H.H.; Boyer, C.R. Marketing with more: An in-depth look at relationship marketing with new media in the green industry. J. Appl. Commun. 2017, 101. [Google Scholar] [CrossRef] [Green Version]
  9. Atanassova, I.; Clark, L. Social media practices in SME marketing activities: A theoretical framework and research agenda. J. Cust. Behav. 2015, 14, 163–183. [Google Scholar] [CrossRef] [Green Version]
  10. Yao, B.; Shanoyan, A.; Peterson, H.H.; Boyer, C.; Baker, L. The use of new-media marketing in the green industry: Analysis of social media use and impact on sales. Agribusiness 2019, 35, 281–297. [Google Scholar] [CrossRef]
  11. Twitter. About. Available online: https://about.twitter.com/company (accessed on 20 September 2020).
  12. Zanini, M.; Lima, V.; Migueles, C.; Reis, I.; Carbone, D.; Lourenco, C. Soccer and twitter: Virtual brand community engagement practices. Mark. Intell. Plan. 2019, 37, 791–805. [Google Scholar] [CrossRef]
  13. Guèvremont, A. Improving consumers’ eating habits: What if a brand could make a difference? J. Consum. Mark. 2019, 36, 885–900. [Google Scholar] [CrossRef]
  14. Moreno-Sandoval, L.G.; Sánchez-Barriga, C.; Buitrago, K.E.; Pomares-Quimbaya, A.; Garcia, J.C. Spanish Twitter Data Used as a Source of Information About Consumer Food Choice. In Machine Learning and Knowledge Extraction, Lecture Notes in Computer Science, Proceedings of the CD-MAKE 2018, Hamburg, Germany, 27–30 August 2018; Holzinger, A., Kieseberg, P., Tjoa, A., Weippl, E., Eds.; Springer: Cham, Switzerland, 2018; Volume 11015, p. 11015. [Google Scholar]
  15. Vidal, L.; Ares, G.; Machín, L.; Jaege, S.R. Using Twitter data for food-related consumer research: A case study on “what people say when tweeting about different eating situations”. Food Qual. Prefer. 2015, 45, 58–69. [Google Scholar] [CrossRef]
  16. Araujo, T.; Kollat, J. Communicating effectively about CSR on Twitter. Internet Res. 2018, 28, 419–431. [Google Scholar] [CrossRef]
  17. Cucagna, M.E.; Goldsmith, P.D. Value adding in the agri-food value chain. Int. Food Agribus. Manag. Rev. 2018, 21, 293–316. [Google Scholar] [CrossRef]
  18. Ciampi, K.; Cavicchi, A. Dynamics of Smart Specialisation Agri-food Trans-Regional Cooperation, JRC Technical Reports, S3 Policy Brief Series; Publications Office of the European Union: Luxembrug, 2017. [Google Scholar] [CrossRef]
  19. European Commission. The European Green Deal. Available online: https://ec.europa.eu/info/sites/info/files/european-green-deal-communication_en.pdf (accessed on 30 March 2021).
  20. Council of European Union. Draft Council Conclusions on Digitalisation for the Benefit of the Environment. Available online: https://data.consilium.europa.eu/doc/document/ST-13957-2020-INIT/en/pdf (accessed on 30 March 2021).
  21. De Cicco, A. The Fruit and Vegetable Sector in the EU—A statistical Overview. Eurostat. 2020. Available online: https://ec.europa.eu/eurostat/statistics-explained/index.php/The_fruit_and_vegetable_sector_in_the_EU_-_a_statistical_overview (accessed on 30 March 2021).
  22. Willer, H.; Schaak, D.; Lernoud, J. Organic farming and market development in Europe and the European union. Org. Int. World Org. Agric. 2018, 217–250. [Google Scholar]
  23. Mezzetti, B. EUBerry: The Sustainable Improvement of European Berry Production. Quality, and Nutritional Value in a Changing Environment. Int. J. Fruit Sci. 2013, 13, 60–66. [Google Scholar] [CrossRef]
  24. Baby, B.; Antony, P.; Vijayan, R. Antioxidant and anticancer properties of berries. Crit. Rev. Food Sci. Nutr. 2018, 58, 1–17. [Google Scholar] [CrossRef]
  25. Bhat, R.; Geppert, J.; Funken, E.; Stamminger, R. Consumers Perceptions and Preference for Strawberries—A Case Study from Germany. Int. J. Fruit Sci. 2015, 15, 405–424. [Google Scholar] [CrossRef]
  26. Castro, D.; Teodoro, A. Anticancer properties of bioactive compounds of berry fruits—A review. Br. J. Med. Med. Res. 2015, 6, 771–794. [Google Scholar] [CrossRef]
  27. Skrovankova, S.; Sumczynski, D.; Mlcek, J.; Jurikova, T.; Sochor, J. Bioactive Compounds and Antioxidant Activity in Different Types of Berries. Int. J. Mol. Sci. 2015, 16, 24673. [Google Scholar] [CrossRef] [PubMed] [Green Version]
  28. COMTRADE. Available online: https://comtrade.un.org/db/mr/rfCommoditiesList.aspx?px=S1&cc=0519 (accessed on 30 March 2021).
  29. FAO. Available online: http://www.fao.org/faostat/en/#data/QC (accessed on 30 March 2021).
  30. Sobekova, K.; Thomsen, M.R.; Ahrendsen, B.L. Market trends and consumer demand for fresh berries. Appl. Stud. Agribus. Commer. 2013, 7, 11–14. [Google Scholar] [CrossRef]
  31. Fortune Business Insights. Organic Berries Market. Markek Research Report. Summary. Available online: https://www.fortunebusinessinsights.com/organic-berries-market-103191 (accessed on 30 March 2021).
  32. Wang, J.; Yue, C.; Gallardo, K.; McCracken, V.; Luby, J.; McFerson, J. What Consumers Are Looking for in Strawberries: Implications from Market Segmentation Analysis. Agribusiness 2017, 33, 56–69. [Google Scholar] [CrossRef]
  33. Kahneman, D. Maps of bounded rationality: Psychology for behavioral economics. Am. Econ. Rev. 2003, 93, 1449–1475. [Google Scholar] [CrossRef] [Green Version]
  34. Decker, R.; Trusov, M. Estimating aggregate consumer preferences from online product reviews. Int. J. Res. Mark. 2010, 27, 293–307. [Google Scholar] [CrossRef]
  35. Köster, E.P. The psychology of food choice: Some often encountered fallacies. Food Qual. Prefer. 2003, 14, 359–373. [Google Scholar] [CrossRef]
  36. Podsakoff, P.M.; MacKenzie, S.B.; Lee, J.Y.; Podsakoff, N.P. Common method biases in behavioral research: A critical review of the literature and recommended remedies. J. Appl. Psychol. 2003, 88, 879–903. [Google Scholar] [CrossRef]
  37. Lawless, H.T.; Heymann, H. Sensory evaluation of food. In Principles and Practices, 2nd ed.; Springer: New York, NY, USA, 2010. [Google Scholar]
  38. Meiselman, H.L. The future in sensory/consumer research: Evolving to a better science. Food Qual. Prefer. 2013, 27, 208–214. [Google Scholar] [CrossRef]
  39. Chamlertwat, W.; Bhattarakosol, P.; Rungkasiri, T.; Haruechaiyasak, C. Discovering Consumer Insight from Twitter via Sentiment Analysis. J. UCS 2012, 18, 973–992. [Google Scholar]
  40. Carr, J.; Decreton, L.; Qin, W.; Rojas, B.; Rossochacki, T.; Wen Yang, Y. Social media in product development. Food Qual. Prefer. 2015, 40, 354–364. [Google Scholar] [CrossRef]
  41. Gong, S.; Juanjuan, Z.; Ping, Z.; Xuping, J. Tweeting as a Marketing Tool: A Field Experiment in the TV Industry. J. Mark. Res. 2017, 54, 833–850. [Google Scholar] [CrossRef] [Green Version]
  42. Ruggeri, A.; Samoggia, A. Twitter communication of agri-food chain actors on palm oil environmental, socio-economic, and health sustainability. J. Consum. Behav. 2018, 17, 75–93. [Google Scholar] [CrossRef]
  43. Boumans, J.W.; Trilling, D. Taking stock of the toolkit: An overview of relevant automated content analysis approaches and techniques for digital journalism scholars. Digit. J. 2016, 4, 8–23. [Google Scholar] [CrossRef] [Green Version]
  44. Mattila, M.; Salman, H. Analysing Social Media Marketing on Twitter using Sentiment Analysis. Bachelor’s Thesis, KTH Royal Institute of Technology, Stockholm, Sweden, 2018. [Google Scholar]
  45. Mishra, N.; Singh, A. Use of twitter data for waste minimisation in beef supply chain. Ann. Oper. Res. 2018, 270, 337–359. [Google Scholar] [CrossRef] [Green Version]
  46. Mostafa, M.M. Clustering halal food consumers: A Twitter sentiment analysis. Int. J. Market. Res. 2019, 61, 320–337. [Google Scholar] [CrossRef]
  47. Singh, A.; Shuklab, N.; Mishra, N. Social media data analytics to improve supply chain management in food industries. Transp. Res. Part E Logist. Transp. Rev. 2018, 114, 398–415. [Google Scholar] [CrossRef]
  48. Chau, M.; Xu, J. Business Intelligence in Blogs: Understanding Consumer Interactions and Communities. MIS Q. 2012, 36, 1189–1216. [Google Scholar] [CrossRef]
  49. Yanai, K.; Kawano, Y. Twitter Food Photo Mining and Analysis for One Hundred Kinds of Foods. In Advances in Multimedia Information Processing—Proceedings of the PCM 2014: 15th Pacific-Rim Conference on Multimedia, Kuching, Malaysia, 1–4 December 2014; Ooi, W.T., Snoek, C., Tan, H.K., Ho, C.K., Huet, B., Ngo, C.-W., Eds.; Springer: Cham, Switzerland, 2014; pp. 22–32. [Google Scholar]
  50. Hannigan, T.R.; Haans, R.F.; Vakili, K.; Tchalian, H.; Glaser, V.L.; Wang, M.S.; Kaplan, S.; Jennings, P.D. Topic modeling in management research: Rendering new theory from textual data. Acad. Manag. Ann. 2019, 13, 586–632. [Google Scholar] [CrossRef] [Green Version]
  51. Angelopoulos, S.; Merali, Y. Sometimes a cigar is not just a cigar: Unfolding the transcendence of boundaries across the digital and physical. In Proceedings of the ICIS International Conference in Information Systems, Seoul, Korea, 10–13 December 2017. [Google Scholar]
  52. Barabási, A.L. Network Science; Cambridge University Press: Cambridge, UK, 2016. [Google Scholar]
  53. Zuo, M.Z.; Angelopoulos, S.A.; Ou, C.X.; Carol, X.C.; Liu, H.L.; Liang, Z.L. Identifying Dynamic Competition in Online Marketplaces Through Consumers. Clickstream Data. 2020. Available online: https://doi.org/10.2139/ssrn.3598889 (accessed on 22 April 2020).
  54. Anninou, I.; Foxall, G.R. Consumer decision-making for functional foods: Insights from a qualitative study. J. Consum. Mark. 2017, 34, 552–565. [Google Scholar] [CrossRef]
  55. Eskandari, F.; Lake, A.A.; Weeks, G.; Butler, M. Twitter conversations about food poverty: An analysis supplemented with Google Trends analysis. Lancet 2019, 394. [Google Scholar] [CrossRef] [Green Version]
  56. Nam, H.; Joshi, Y.V.; Kannan, P.K. Harvesting Brand Information from Social Tags. J. Mark. 2017. [Google Scholar] [CrossRef]
  57. Tsur, O.; Rappoport, A. What’s in a hashtag? Content based prediction of the spread of ideas in microblogging communities. In Proceedings of the Fifth ACM International Conference on Web Search and Data Mining, Seattle, WA, USA, 8–12 February 2012; ACM: New York, NY, USA, 2012; pp. 643–652. [Google Scholar]
  58. Kar, A.K.; Dwivedi, Y.K. Theory building with big data-driven research—Moving away from the “What” towards the “Why”. Int. J. Inf. Manag. 2020, 54, 1–10. [Google Scholar] [CrossRef]
  59. Zaki, M.; McColl-Kennedy, J.R. Text mining analysis roadmap (TMAR) for service research. J. Serv. Mark. 2020, 34, 30–47. [Google Scholar] [CrossRef]
  60. R Core Team. R: A Language and Environment for Statistical Computing; R Foundation for Statistical Computing: Vienna, Austria, 2013. [Google Scholar]
  61. Gentry, J. Package ‘twitteR’. 2014. Available online: http://cran.r-project.org/web/packages/twitteR/twitteR.pdf (accessed on 21 October 2020).
  62. Breen, J. R by Example: Mining Twitter for Consumer Attitudes Towards Airlines. Cambridge Aviation Research. 2011. Available online: http://es.slideshare.net/jeffreybreen/r-by-example-mining-twitter-for (accessed on 20 October 2020).
  63. Worch, T. What should you know about analysing social media data using twitteR: The experience of a practitioner. In Proceedings of the 6th European Conference on Sensory and Consumer Research, Copenhagen, Denmark, 7–10 September 2014. [Google Scholar]
  64. Fried, D.; Surdeanu, M.; Kodbourov, S.; Hingle, M.; Bell, D. Analyzing the language of food on social media. In Proceedings of the 2014 IEEE International Conference on Big Data, Washington, DC, USA, 27–30 October 2014. [Google Scholar]
  65. Linvill, D.L.; McGee, S.E.; Hicks, L.K. Colleges’ and universities’ use of Twitter: A content analysis. Public Relat. Rev. 2012, 38, 636–638. [Google Scholar] [CrossRef] [Green Version]
  66. George, G.; Osinga, E.C.; Lavie, D.; Scott, B.A. Big data and data science methods for management research. Acad. Manag. J. 2016, 59, 1493–1507. [Google Scholar] [CrossRef] [Green Version]
  67. Tirunillai, S.; Tellis, G.J. Does chatter really matter? Dynamics of user-generated content and stock performance. Mark. Sci. 2012, 31, 198–215. [Google Scholar] [CrossRef] [Green Version]
  68. Liu, X. A big data approach to examining social bots on Twitter. J. Serv. Mark. 2019, 33, 369–379. [Google Scholar] [CrossRef]
  69. Forkmann, S.; Henneberg, S.C.; Witell, L.; Kindström, D. Driver configurations for successful service infusion. J. Serv. Res. 2017, 20, 275–291. [Google Scholar] [CrossRef]
  70. Charmaz, K. Constructing Grounded Theory: A Practical Guide through Qualitative Analysis; SAGE Publications Ltd.: London, UK, 2006. [Google Scholar]
  71. Humphreys, A.; Rebecca, J.W. Automated text analysis for consumer research. J. Consum. Res. 2017, 44, 1274–1306. [Google Scholar] [CrossRef]
  72. Glaser, B.G. Basics of Grounded Theory Analysis; Sociology Press: Mill Valley, CA, USA, 1992. [Google Scholar]
  73. Gregory, R.W. Design science research and the grounded theory method: Characteristics, differences, and complementary uses. In Proceedings of the 18th European Conference on Information Systems (ECIS 2010), Pretoria, South Africa, 7–9 June 2010. [Google Scholar]
  74. Schreier, M. Qualitative Content Analysis in Practice; Sage: Thousand Oaks, CA, USA, 2012. [Google Scholar]
  75. Guba, E.G. Criteria for assessing the trustworthiness of naturalistic inquiries. Educ. Commun. Technol. J. Theory Res. Dev. 1981, 29, 75–91. [Google Scholar]
  76. Shenton, A.K. Strategies for ensuring trustworthiness in qualitative research projects. Educ. Inf. 2004, 22, 63–75. [Google Scholar] [CrossRef] [Green Version]
  77. Strauss, A.; Corbin, J. Basics of Qualitative Research; Sage: Thousand Oaks, CA, USA, 1990. [Google Scholar]
  78. Borgatti, S.P. Centrality and network flow. Soc. Netw. 2005, 27, 55–71. [Google Scholar] [CrossRef]
  79. Freeman, L.C. Centrality in social networks: Conceptual clarification. Soc. Netw. 1979, 1, 215–239. [Google Scholar] [CrossRef] [Green Version]
  80. Girvan, M.; Newman, M.E.J. Community structure in social and biological networks. Proc. Natl. Acad. Sci. USA 2002, 99, 7821–7826. [Google Scholar] [CrossRef] [PubMed] [Green Version]
  81. Clauset, A.; Newman, M.E.J.; Moore, C. Finding community structure in very large networks. Phys. Rev. E 2004, 70, 66111. [Google Scholar] [CrossRef] [PubMed] [Green Version]
  82. Clauset, A. Finding local community structure in networks. Phys. Rev. E 2005, 72, 26132. [Google Scholar] [CrossRef] [PubMed] [Green Version]
  83. Blondel, V.D.; Guillaume, J.L.; Lambiotte, R.; Lefebvre, E. Fast unfolding of communities in large networks. J. Stat. Mech. Theory Exp. 2008, 10, P10008. [Google Scholar] [CrossRef] [Green Version]
  84. Bastian, M.; Heymann, S.; Jacomy, M. Gephi: An Open Source Software for Exploring and Manipulating Networks. Association for the Advancement of Artificial Intelligence (www.aaai.org). 2009. Available online: https://gephi.org/publications/gephi-bastian-feb09.pdf (accessed on 23 February 2021).
  85. Jaeger, S.R.; Bava, C.M.; Worch, T.; Dawson, J.; Marshall, D.W. The food choice kaleidoscope. A framework for structured description of product, place and person as sources of variation in food choices. Appetite 2011, 56, 412–423. [Google Scholar] [CrossRef]
  86. Kyutoku, Y.; Minami, Y.; Koizumi, K.; Okamoto, M.; Kusakabe, Y.; Dan, I. Conceptualization of food choice motives and consumption among Japanese in light of meal, gender, and age effects. Food Qual. Prefer. 2012, 24, 213–217. [Google Scholar] [CrossRef]
  87. Köster, E.P. Diversity in the determinants of food choice: A psychological perspective. Food Qual. Prefer. 2009, 20, 70–82. [Google Scholar] [CrossRef]
  88. Köster, E.P.; Mojet, J. Theories of food choice development. In Understanding Consumers of Food Products; Frewer, L., van Trijp, H.C.M., Eds.; Woodhead Publishing: Cambridge, UK, 2006; pp. 93–124. [Google Scholar]
  89. Meiselman, H.L. Experiencing food products within a physical and social context. In Product Experience; Schifferstein, H.N.J., Hekkert, P., Eds.; Elsevier: Oxford, UK, 2008; pp. 559–580. [Google Scholar]
  90. Desmet, P.M.A.; Schifferstein, H.N.J. Sources of positive and negative emotions in food experience. Appetite 2008, 50, 290–301. [Google Scholar] [CrossRef]
  91. Piqueras-Fiszman, B.; Jaeger, S.R. What makes meals ‘memorable’? A consumer-centric exploration. Food Res. Int. 2014. [Google Scholar] [CrossRef]
  92. Piqueras-Fiszman, B.; Jaeger, S.R. Emotions associated to mealtimes: Memorable meals and typical evening meals. Food Res. Int. 2014. [Google Scholar] [CrossRef]
  93. Rappoport, L.; Downey, R.G.; Huff-Corzine, L. Conceptual differences between meals. Food Qual. Prefer. 2001, 13, 489–495. [Google Scholar] [CrossRef]
  94. Bisogni, C.A.; Winter Falk, L.; Madore, E.; Blake, C.E.; Jastran, M.; Sobal, J.; Devine, C.M. Dimensions of everyday eating and drinking episodes. Appetite 2007, 218–231. [Google Scholar] [CrossRef]
  95. Liu, M.; Kasteridis, P.; Yen, S.T. Breakfast, lunch, and dinner expenditures away from home in the United States. Food Policy 2013, 38, 156–164. [Google Scholar] [CrossRef]
  96. ComScore. The Global Mobile Report. comScore Inc. 2017. Available online: https://www.comscore.com/Insights/Presentations-and-Whitepapers/2017/The-Global-Mobile-Report (accessed on 30 June 2020).
  97. Yates, L.; Warde, A. The evolving content of meals in Great Britain. Results of a survey in 2012 in comparison with the 1950s. Appetite 2014, 84, 299–308. [Google Scholar] [CrossRef]
  98. Vehkalahti, K.; Tahvonen, R.; Tuorila, H. Hedonic responses and individual definitions of an ideal apple as predictors of choice. J. Sens. Stud. 2013, 28, 346–357. [Google Scholar]
  99. Canetti, L.; Bachar, E.; Berry, E.M. Food and emotion. Behav. Process. 2002, 60, 157–164. [Google Scholar] [CrossRef]
  100. Macht, M. How emotions affect eating: A five-way model. Appetite 2008, 50, 1–11. [Google Scholar] [CrossRef] [PubMed]
  101. Aprile, M.C.; Caputo, V.; Nayga, R.M., Jr. Consumers’ valuation of food quality labels: The case of the European geographic indication and organic farming labels. Int. J. Consum. Stud. 2012, 36, 158–165. [Google Scholar] [CrossRef]
  102. Eldesouky, A.; Mesias, F.J.; Escribano, M. Perception of Spanish consumers towards environmentally friendly labelling in food. Int. J. Consum. Stud. 2020, 44, 64–76. [Google Scholar] [CrossRef]
  103. Samoggia, A.; Bertazzoli, A.; Ruggeri, A. Food retailing marketing management: Social media communication for healthy food. Int. J. Retail Distrib. Manag. 2019, 47, 928–956. [Google Scholar] [CrossRef]
  104. McEachern, M.G.; Warnaby, G. Exploring the relationship between consumer knowledge and purchase behaviour of value-based labels. Int. J. Consum. Stud. 2008, 32, 414–426. [Google Scholar] [CrossRef]
  105. Mellon, J.; Prosser, C. Twitter and Facebook are not Representative of the General Population: Political Attitudes and Demographics of British Social Media users. Res. Politics 2017. [Google Scholar] [CrossRef]
  106. Wang, Y.; Deng, Q.; Rod, M.; Shaobo, J. A thematic exploration of social media analytics in marketing research and an agenda for future inquirí. J. Strateg. Mark. 2020. [Google Scholar] [CrossRef]
Figure 1. Data collection procedure.
Agronomy 11 00809 g001
Figure 2. Top 50 English hashtags frequency. Extracted from Tweets that include the hashtag #strawberries.
Agronomy 11 00809 g002
Figure 3. Top 50 Spanish hashtags frequency. Extracted from Tweets that include the hashtag #fresas (strawberries).
Agronomy 11 00809 g003
Figure 4. Spatial network distribution after application of the algorithms (left, ‘strawberries’; right, ‘fresas’). The colors represent the cluster and the separation among hashtags is based on their relative positions.
Agronomy 11 00809 g004
Figure 5. Communities in the English keyword network. Separate analysis of the communities with visualization of the words that compose it. The size of the node represents the degree or importance within the group.
Agronomy 11 00809 g005
Figure 6. Communities in the Spanish keyword network. Separate analysis of the communities with visualization of the words that compose it. The size of the node represents the degree or importance within the group.
Agronomy 11 00809 g006
Table 1. Descriptive statistics.
#Strawberries%#Fresas%
Number of tweets with a single token25911.88%27417.19%
Number of tweets with two tokens53924.69%32420.31%
Number of tweets with three tokens2059.38%32420.31%
Number of tweets with four tokens1989.06%22414.06%
Number of tweets with five tokens22510.31%1509.38%
Number of tweets with six tokens23910.94%1509.38%
Number of tweets with seven tokens1235.63%251.56%
Number of tweets with eight tokens1989.06%251.56%
Number of tweets with nine tokens964.38%503.13%
Number of tweets with ten or more tokens1024.69%503.13%
Total of tweets2184 1596
Number of tokens7690 3460
Mean3.52 2.17
Standard deviation3.09 2.54
Table 2. Inductive construction of categories and emerging themes (above #strawberries; below #fresas).
ThemesFocused CodesInitial Codes for #Strawberries
1. Fruits1raspberries, fruits, blueberries, banana, berries, grapes, watermelon, blackberries
2. Context2breakfast, dessert, food
3familyevent, familyfun
6farmersmarket
8flowers
3. Consumption4chocolate, cake, syrup, sliceofcake, granola, walnutcake, chocolatecoveredstrawberries
sweet
4. Healthy lifestyle5smoothie, yogurt
fiber, organic, antioxidants, eatclean, healthy, fresh
fit
5. Production9localfood
11farmers, pesticides
12incotober
6. Art10photography, design, foodphotography, red, cute
ThemesFocused CodesInitial Codes for #fresas (strawberries)
1. Fruits1frutas (fruits), frutosrojos (berries), manzana (apple), arándanos (blueberries)
2. Context2desayuno (breakfast), postres (dessert)
3domingos (Sundays), felizdomingo (happysunday), felizjueves (happythursday, lafamilia (thefamily), mejoresamigos (bestfriends)
6fideua (typical spanish dish), paella (typical spanish dish), bar(bar), restaurante (restaurant)
8amor (love), rosas(roses)
acapulco (beautiful beach in Mexico)
13Anuga (the leading food fair in the world)
3. Consumption4Chocolate (chocolate), fresasconchocolate (chocolatedippedstrawberries), fresascubiertasdechocolate (chocolatecoveredstrawberries), avena (oatmeal), perversodechocolate (perversechocolate)
Dulces (sweets), tarta (cake), tusdulces (yoursweets)
4. Healthy lifestyle5Jugosverdes (greenjuices)
Vitaminas (vitamins)
Vidamassana (healthierlife), vidasaludable (healthylife)
5. Production7Macetahuertourbano (urban farm), semillero (seedbed), pepinos (cucumbers), pimientos (peppers), tomates (tomatoes), germinar (germinate), sustrato (substrate), verduras (vegetables)
9Huelva (localcity)
6. Art
Publisher’s Note: MDPI stays neutral with regard to jurisdictional claims in published maps and institutional affiliations.

