Article

Metabonomic Profiling Analyses Reveal ANS Upregulation to Enhance the Flavonoid Pathway of Purple-Fleshed Sweet Potato Storage Root in Response to Deep Shading

MOA Key Laboratory of Crop Ecophysiology and Farming System in the Middle Reaches of the Yangtze River, College of Plant Science and Technology, Huazhong Agricultural University, Wuhan 430070, China
*
Author to whom correspondence should be addressed.
Agronomy 2021, 11(4), 737; https://doi.org/10.3390/agronomy11040737
Submission received: 1 March 2021 / Revised: 6 April 2021 / Accepted: 7 April 2021 / Published: 10 April 2021
(This article belongs to the Special Issue Study of Primary Metabolism of Plants)

Abstract

:
Intercropping, as a common worldwide cultivation pattern, provides opportunities for sustainable agriculture with fuller use of light, temperature and land resources and greater yield per unit of land. The intercropping impact on crop quality is a current focus. This study found that shading cultivation of purple-fleshed sweet potato can improve the storage root pigment accumulation by more than 20% to increase economic benefits. We performed gas chromatography and mass spectrometry analysis of storage roots of the anthocyanin-enriched cultivar Jihei-1 under 60% shading and nonshaded treatments. A total of 224 differential metabolites were identified, among which N-acetyl-5-hydroxytryptamine, 1-monopalmitin, 4-pyridoxic acid, dodecano, arbutin, tryptophan, citrulline and phenylalanine were significantly upregulated under shading with a more than 10-fold change. Furthermore, metabolic pathway enrichment maps were based on the biological processes and stratification level selected. These metabolites mainly influenced the pathways of phenylpropanoid biosynthesis, the citrate cycle, organic acid biosynthesis and metabolism and amino acid metabolism. Through tissue-specific dynamic changes in amino acids, soluble sugars, starch and anthocyanins during storage root development, we proposed a variety-specific strategy of purple-fleshed sweet potato in response to prolonged deep shading, that is, utilizing and enhancing broad aboveground-tissue photosynthesis and transferring photosynthates into roots in advance, leading to a rapid increase in storage root anthocyanin synthesis. With comprehensive qPCR, western blot and enzyme activity analyses, we identified three key enzymes, CHS, ANS and 3GT, in purple-fleshed sweet potato storage roots in response to shading, which affect the root anthocyanin content by influencing the flavonoid metabolism pathway. This study provides a theoretical basis for revealing the regulation of anthocyanin synthesis in crops and a guidance for high-quality sweet potato cultivation and nutritional improvement using shade facilities.

1. Introduction

Purple-fleshed sweet potato (PSP) is an important resource with high anthocyanin levels in storage roots. In recent years, it has become popular in international markets. Considering its broad prospects, it is necessary to study ways to maintain or improve the high anthocyanin contents in sweet potatoes. Owing to their potential health benefits, anthocyanin has been investigated extensively. These compounds are a final product of flavonoid metabolic pathways. The pathways have been elucidated in plants, and many structural genes have been successfully identified. The process consists of three stages. For the upstream stage, p-coumaroyl-CoA is produced in the general phenylpropanoid pathway. The upstream stage is also a common synthetic pathway of flavonoids, isoflavones, and flavonols. There are three enzymes in the pathway: phenylalanine ammonialyase (PAL), 4-coumarate-CoA ligase (4CL) and cinnamate 4-hydroxylase (C4H). As the first flavonoid product of the pathway, chalcone is generated by chalcone synthase (CHS) at the intermediate stage. The pigment is synthesized by anthocyanidin synthase (ANS) at the downstream stage [1,2]. Then, anthocyanin is formed through glycosylation by glycosyltransferase (GT). Finally, anthocyanin is transported and stored in vacuoles [3,4,5]. However, the key enzymes of the flavonoid pathway always show differential expression and complicated regulation in a developmental stage-specific, tissue-specific and/or interspecific manner in plants [6,7,8].
The external environment significantly influences the flavonoid metabolic pathway. CHS is a light-regulating enzyme. Both the intensity and wavelength of light can regulate its gene expression and activity, thereby affecting pigment synthesis in plants. Studies have shown that ultraviolet light (UV light) can regulate the specific tissue expression of CHS in Arabidopsis [9]. UV light is an environmental signal perceived by plants that affects the flavonoid pathway and influences the levels of anthocyanins, flavonols, and proanthocyanidins. Recent studies have reported that low UV light induces downregulated changes in the gene expression of not only the key enzyme but also the activator of anthocyanin biosynthesis, MYB, such as MYB10- and MYB22-activating transcription of flavonol synthase (FLS) in apple and MYB gene TT2 comprised of MYB–bHLH–WD regulating the late biosynthetic genes in Arabidopsis thaliana, to regulate anthocyanin biosynthesis [10,11]. In addition, key enzymes of the anthocyanin pathway are sensitive to temperature. Intense light and low temperature can significantly accelerate flavonoid pathway in different plant tissues, mainly by inducing PAL expression [12,13,14]. There is a trade-off between plant primary and secondary metabolites. For example, starch degradation can promote the accumulation of pigment in PSP roots. Moreover, it has been reported that sucrose acts as a signal molecule to regulate the expression of ANS and 3GT in the flavonoid pathway [15,16,17] and fruit ripening [18]. The flavonoid pathway is closely linked to fertility and stress resistance. Proteomic analysis of photoperiod-induced male sterility was carried out in a previous study. OsCHS is a significantly differential protein between long and short light conditions. The photoperiod regulates the expression of OsCHS and affects the N/C metabolic network, resulting in a change in pollen fertility [19]. Most studies on anthocyanin regulation have already been reported in fruits and ornamental plants, but such reports are limited for PSP [7,20,21,22].
With urbanization and competition for land among the limited areas for cultivation, intercropping is becoming a common cultivation pattern worldwide to provide opportunities for sustainable agriculture with greater yield per unit land [23,24,25]. Sweet potato, as a creeping plant with broad leaves, is a promising plant for intercropping with other tall-stemmed crop species [26,27]. In southwestern regions of China, the three-crop intercropping system of “wheat/corn/potato” is predominantly used, that is, simultaneously growing two or more crops with strip-intercropping arrangement for each crop. However, not all crops can provide benefits in terms of yields or quality from the intercropping systems. For example, short- and tall-stemmed mixtures often give lower biomass or yields than when they are independent, in particular for short-stemmed crops with limited solar radiation resources due to shading from neighbor interactions [28]. Improvement of the intercropping systems for the future production region of sweet potato requires a clear understanding of the physical and biological effects of shading on these crops [28]. Solar energy, which is the basis for biomass production, is important for plant yield [29,30,31], but limited information is available on pigment quality. Jihei-1 is widely cultivated in China due to its high yield and anthocyanin-rich characteristics. Taking shading as an example, the effects of shading on the process of storage root anthocyanin synthesis and accumulation were investigated in this study. This study provides a theoretical basis for revealing the regulation of anthocyanin synthesis in crops and a basis for high-quality sweet potato cultivation and nutritional improvement. In addition, these findings provide a reference for the trait of pigment accumulation in other root crops.

2. Materials and Methods

2.1. Plant Materials and Growth Conditions

The popular PSP cultivar Jihei-1 was used in this experiment, and was compared to a nonpigmented cultivar, the yellow-fleshed sweet potato cultivar (SP). Both Jihei-1 and yellow-fleshed SP were generously provided by Wuhan Academy of Agriculture Sciences (Wuhan City, China). Among the two, Jihei-1 was widely cultivated in China with high-yield and anthocyanin-enriched characteristics, and the yellow-fleshed sweet potato cultivar was a testing nonpigmented one also with high-yield characteristics. They had the same reproductive period. A pot experiment was performed at Huazhong Agricultural University in Wuhan (30°47′ N, 114°35′ E) from April to October in 2017 and 2019. Seedlings of 15–20 cm cut with scissors were transplanted into plastic pots (top diameter of 30 cm, bottom diameter of 27 cm, and depth of 30 cm) on 24 May.
Fifty days after planting (DAP), plants were subjected to three levels of 100% (control), 70% and 40% natural irradiance. A nonshaded group was used as a control and subjected to 100% natural light. Two treated groups shaded 30% and 60% of light via cultivation in iron frames (length of 2.0 m, width of 1.2 m, and height of 1.2 m) were covered with plastic shading nets from 50 DAP to 130 DAP, respectively. In each treatment, we selected 60 plants with more than two storage roots per plant (n ≥ 120) and then immediately froze them in liquid nitrogen for physiological and biochemical determination, molecular validation and metabolite content evaluation.

2.2. Untargeted Metabolomics Analysis of Storage Roots

Samples of ripe storage roots (130 DAP) were prepared before gas chromatography-mass spectrometry (GC-MS) analysis. With an internal standard of 0.3 mg mL−1 2-chloro-l-phenylalanine added, 60 mg of the powder samples were ground with small steel balls in cold methanol. The mixtures were ultrasonicated for 30 min. After centrifugation and vacuum drying, a quality control (QC) sample was prepared, and 80 μL of 15 mg mL−1 methoxylamine hydrochloride was subsequently added to pyridine. The mixture was vortexed and incubated for 90 min. Eighty microlitres of BSTFA (with 1% TMCS) and 20 μL of n-hexane were added to the mixture and derivatized at 70 °C for 60 min.
The samples were analyzed on an Agilent 7890B gas chromatography system coupled to a 5977A MSD system (Agilent, Guangzhou, China) according to Lai et al. [32]. The metabolites were annotated using the Fiehn or NIST database [33]. A DB-5 MS fused-silica capillary column (30 m × 0.25 mm × 0.25 μm) was utilized to separate the derivatives. Helium was used as the carrier gas at a constant flow rate of 1 mL/min through the column. The parameters were as follows: injector temperature of 260 °C and injection volume of 1 μL (split ratio is 10:1). Mass data were acquired in full-scan mode (50–450 m/z) with the solvent delay time set to 5 min. Eight independent replicates for each group were determined (n = 8). Three QCs were injected throughout the analytical run.
The resulting GC−MS data were normalized to the total peak area of each sample and log2 transformed by Excel software (Microsoft Corp., Redmond, WA, USA) then imported into SIMCA software (version 14.0, Umetrics, Umeå, Sweden), where principal component analysis (PCA), partial least-squares discriminant analysis (PLS-DA) and orthogonal partial least-squares discriminant analysis (OPLS-DA) were performed. The differential metabolites were selected on the basis of the combination of statistically significant thresholds including the variable importance in the projection (VIP > 1.0) obtained from the OPLS-DA model and p values (p < 0.05) from a two-tailed Student’s t-test of the normalized peak areas.

2.3. Measurement of Soluble Sugar, Starch, and Anthocyanin Contents in Sweet Potato

The soluble sugar and starch contents of the samples were measured according to the sulfuric acid-anthrone method [34]. First, sample powder was ground with 80% (v/v) ethyl alcohol and transferred into a centrifuge tube that was then placed in a water bath for 30 min at 80 °C. After cooling, the homogenate was centrifuged at 4000 rpm for 5 min. The supernatant was a soluble sugar solution gathered in a 100-mL volumetric flask. Second, the residue was gathered into another 100-mL volumetric flask, 20 mL hot dH2O was added to create a boiling water bath for 15 min and 2 mL of 9.2 M perchloric acid was added under the boiling water bath for another 15 min. After cooling, the mixture was centrifuged to a constant volume, and the supernatant was a starch extract solution. Extract solutions were diluted 5-folds. Then, the absorbance of the solutions was evaluated at 620 nm using a fluorescence microplate reader (Infinite 200 NanoQuant, Tecan, Gr dig, Austria). Three independent replicates for each group were determined (n = 3).
Anthocyanin was extracted as described by Jing et al. [35]. The sample was ground under citric acid into sodium hydrogen phosphate buffer solution (pH 3.0). The homogenate was transferred to a 100-mL volumetric flask, brought to a constant volume and rested in the dark for 30 min. After centrifugation at 6000 rpm for 10 min, the supernatant was collected. The anthocyanin extract solution was read at 525 nm by a fluorescence microplate reader. For soluble sugar, starch and anthocyanin analysis, three independent replicates for each group were determined.

2.4. Measurement of Amino Acid Contents in Developing Storage Roots

Samples of developing storage roots at 80, 100 and 130 DAP were prepared. Total amino acid contents were determined by an HPLC method [36] with three replicates (n = 3). The samples were hydrolyzed with 6 N HCl at 110 °C for 22 h. The mixtures were evaporated and dissolved in 1 mL of 0.02 N HCl. The samples were filtered and analyzed in three replicates via an Agilent 1260 system (Agilent, Guangzhou, China) with the C18 column (4.6 mm × 250 mm × 5 μm).

2.5. Measurement of CHS, ANS, and UFGT Enzyme Activities

The key enzymes of CHS, ANS and UFGT of the flavonoid metabolic pathway were selected and determined in PSP storage roots at 60, 80 and 100 DAP. First, a crude enzyme sample was extracted with cold extraction buffer (pH 8.2) comprising 50 mM HEPES–KOH. After 20 min of chilling, the mixture was centrifuged at 12,000 rpm for 15 min at 4 °C. The supernatant was assayed at a wavelength of 450 nm using enzyme linked immunosorbent assay (ELISA) kits (Jiangsu KeJing Biological Technology Co., Ltd., Nanjing, China) with specific antibodies against CHS, ANS, and UFGT and HRP-conjugate reagent with three independent replicates for each group (n = 3).

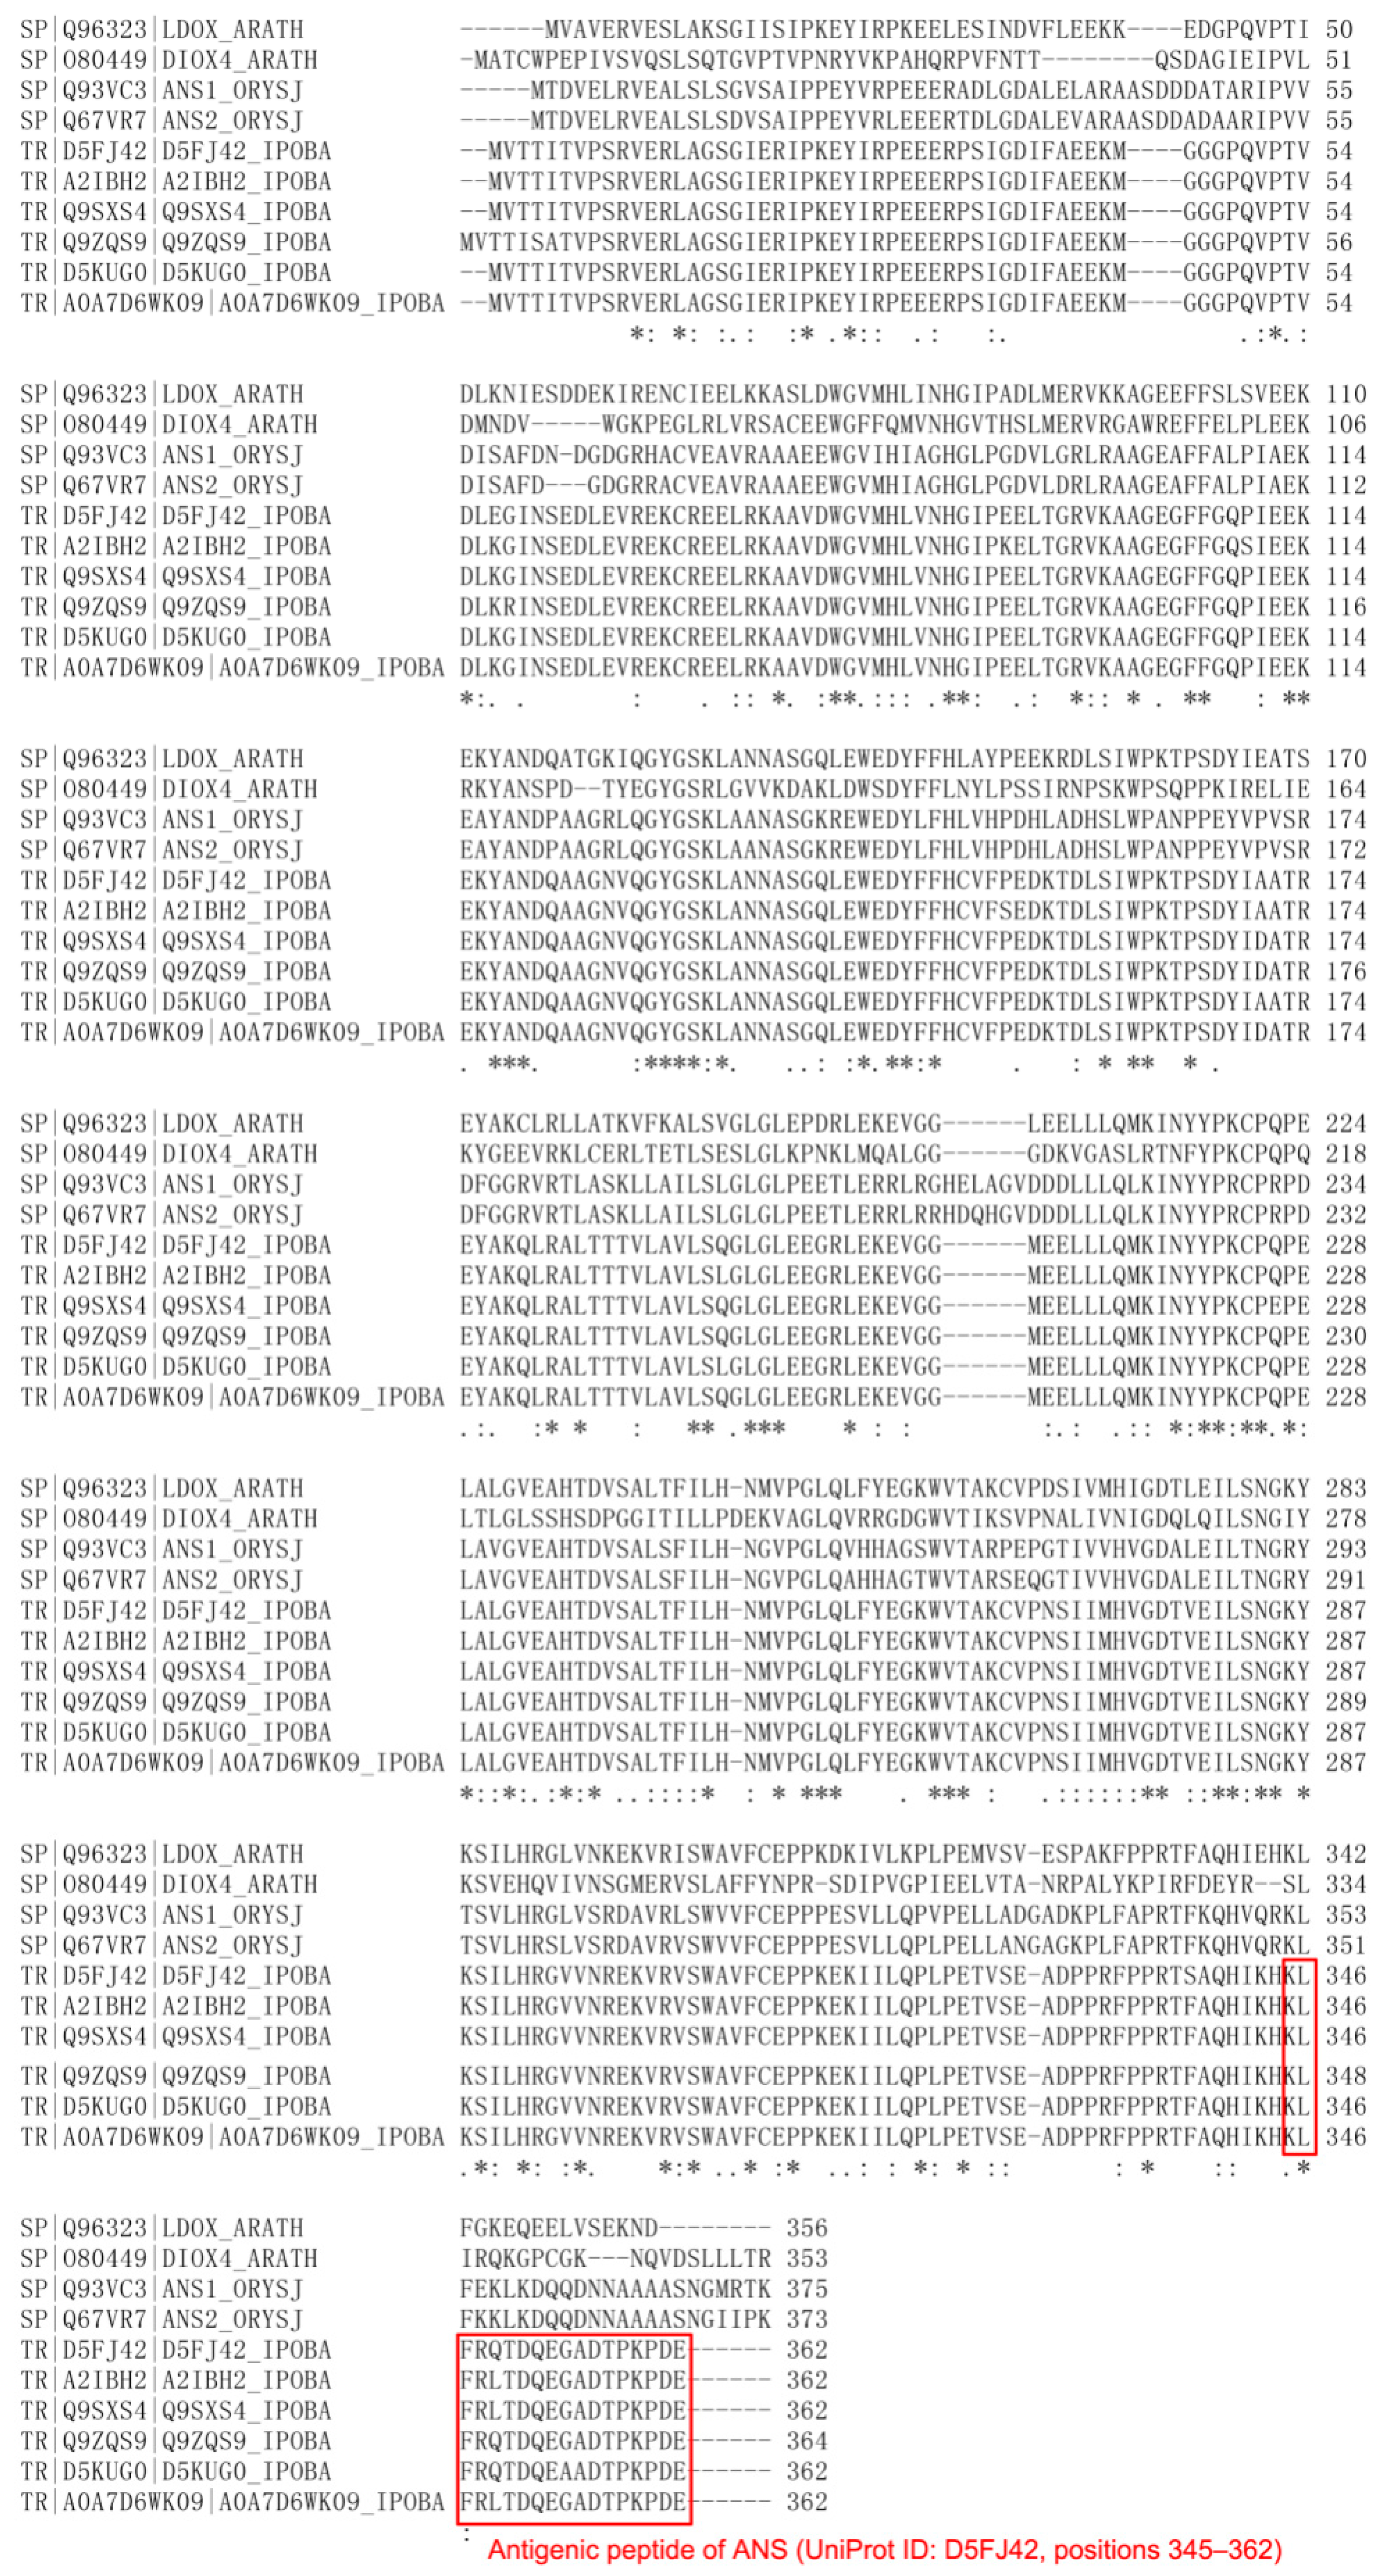
2.6. Measurement of CHS, ANS and 3GT Protein Expression by Western Blot Assay

Three specific antibodies against CHS, ANS and 3GT were prepared for western blotting analysis. Among them, anti-ANS and anti-3GT were newly designed. Antibodies were obtained by injecting the corresponding synthetic peptides into rabbits. The peptides were newly synthesized by ABclonal Biotechnology Co., Ltd. (Wuhan, China), and those for CHS1, ANS and 3GT were C-VLFGFGPGLTIETVVLHSVP (UniProt ID: Q9MB33, positions 369–387), C-KLFRQTDQEGADTPKPDE (UniProt ID: D5FJ42, positions 345–362) and NNHDSNSTLFGGRNPAA-C (UniProt ID: A0A0G2QMF5, positions 42–58), respectively, for sweet potato (Ipomoea batatas L.). The western blot assay was carried out as follows according to a previous study [37]. The samples were loaded onto a 12% resolving polyacrylamide gel with Tris-glycine buffer in an electrophoresis tank (Liuyi Instrument Ltd., Beijing, China). Then, the gel was transferred to nitrocellulose membrane (Merck KGaA, Darmstadt, Germany). The membrane was treated with blocking solution containing 20 mM Tris, 0.05% (v/v) Tween-20, 5% (w/v) defatted milk and 500 mM NaCl buffer (pH 7.4). After incubation with the primary antibodies (1:2000), the membrane was subsequently incubated with the alkaline phosphatase-conjugated goat anti-rabbit IgG secondary antibody (1:4000, CWBIO, China). The blotted proteins were detected by 5-bromo-4-chloro-3-indolyl-phosphate/nitroblue tetrazolium solution and scanned, and two replicated membranes were prepared (n = 2).

2.7. qPCR Verification of CHS, ANS, and UFGT Gene Expression

The primers for candidate genes designed by EMBL-EBI and NCBI primers are shown in Appendix A (Table A1). Actin (https://www.ebi.ac.uk/, accessed on 25 February 2021, Accession EU250003) was used as the reference gene. Total RNA of storage roots was extracted using the TIANGEN RNAprep Pure Plant Kit as described by the supplier. First-strand cDNA was synthesized in a 20 µL reaction solution with oligo(dT) primers using a ReverTra Ace-a kit (TOYOBO). Quantitative real-time PCR (qPCR) was performed in a 10 μL volume using SYBR Green SuperMix (Bio-Rad) on a QuantStudio 6 Flex instrument (Applied Biosystems) [38]. Each sample was represented by three biological replicates (n = 3). Analysis of the relative gene expression was carried out by the relative quantitative method.

2.8. Data Analysis

The acquired MS data from GC−MS were analyzed by ChromaTOF software (v 4.34, LECO, St Joseph, MI, USA). The metabolites were identified by the NIST and Fiehn databases using ChromaTOF software. The resulting data were normalized to the total peak area of each sample and transformed by log2 in Excel software (Microsoft Corp., Redmond, WA, USA) and imported into SIMCA (version 14.0, Umetrics, Umeå, Sweden). Sequence alignment of proteins was analyzed using online tools (http://www.UniProt.org/help/uniprotkb, accessed on 25 February 2021).
Statistical analysis of the soluble sugars, starch and protein contents and activity values were performed with analysis of variance, and significant difference (p < 0.05) analysis was performed using Excel software. For protein quantitative analysis with western blotting, two replicated membranes were prepared, and the band grey values were analysed with β-actin as a reference with Quantity One software (Bio-Rad, Hercules, CA, USA).

3. Results

3.1. Effects of Shading on Storage Root Yield and Anthocyanin Content in PSP

For PSP, three levels of natural irradiance that influenced the yield of Jihei-1 were sorted in descending order, as follows: nonshaded group > 30% shading group > 60% shading group (Figure 1A, Table 1). The average weight of a single storage root of the 30% shading group was consistent with the control value, and that of the 60% shading group decreased by 9%. The average number of storage roots per plant was reduced in the shaded groups. Accordingly, the total root yields decreased by approximately 26–40% under shading. However, pigment outputs increased by approximately 25% under shading. In particular, the anthocyanin contents of the storage roots increased by 70–105% under the shading treatment. Thus, it was concluded that shading produces a negative effect on storage root yields but may have a positive effect on PSP anthocyanin outputs.
Significant characteristics related to anthocyanin enrichment were detected in Jihei-1 storage roots compared to those of the yellow-fleshed sweet potato cultivar (SP) (Figure 1B). For 60% shading, the anthocyanin contents in the developing storage roots of Jihei-1 were significantly influenced, that is, the anthocyanin content was 118% that of the control at the ripe stage at 130 DAP (Figure 1B, Table 1). However, the shading condition slightly affected anthocyanin contents in the yellow-fleshed SP (Figure 1C), which might be due to the low background levels of storage root anthocyanins in this cultivar. It was suggested that the shading treatment had an interspecific influence on root anthocyanins, notably specific to PSP; shading could improve or stabilize the anthocyanin accumulation at the mid-late stage of storage root development during 100–130 DAP. The differences in anthocyanin content observed between the two varieties were likely a result of the cumulative effect of various environmental factors that affect storage root anthocyanin synthesis and outputs.

3.2. Tissue-Specific and Cultivar-Specific Effects on Soluble Sugar Contents and Starch Accumulation by Shading Treatment

Shading influenced tissue soluble sugar contents in both PSP and PS but with different changing patterns. For PSP Jihei-1, the soluble sugar contents in all tissues, such as the leaf, petiole, stem and storage root tissues, were significantly increased under 60% shading conditions, especially with a higher growth rate of 76–92% at 80 DAP (Figure 2A). There were no significant differences in the soluble sugar contents of each tissue during the ripe period of 130 DAP between the control and shaded groups. For SP, some tissue-specific soluble sugar contents (leaf-, petiole- and stem-) were significantly increased under shading conditions at 130 DAP (Figure 2A).
Moreover, shading could partially facilitate the formation of starch in petioles and storage roots during the developing period of Jihei-1. Under shading, the root starch contents of developing (at 80 DAP) and ripe storage roots (at 130 DAP) increased by 26% and 13%, respectively, while at the same time, the leaf starch contents decreased markedly (Figure 2B). However, there were also significant differences, but at lower levels, in tissue starch contents from yellow-fleshed SP, except for the leaf starch content that showed a 2-fold increase during the ripe period at 130 DAP under shading (Figure 2B).
Overall, the shading treatment had a cultivar-specific influence on sweet potato soluble sugar content and starch accumulation during storage root development. That is, for dealing with deep and prolonged shading, one strategy was to mobilize petioles to participate in photosynthesis to accumulate more starch in PSP during the whole root development period, and another was to maintain leaf photosynthesis in yellow-fleshed SP even in the ripe period. Notably, shading improved the soluble sugar level in all PSP tissues at the early root development period of 80 DAP to prematurely stabilize storage root starch accumulation.

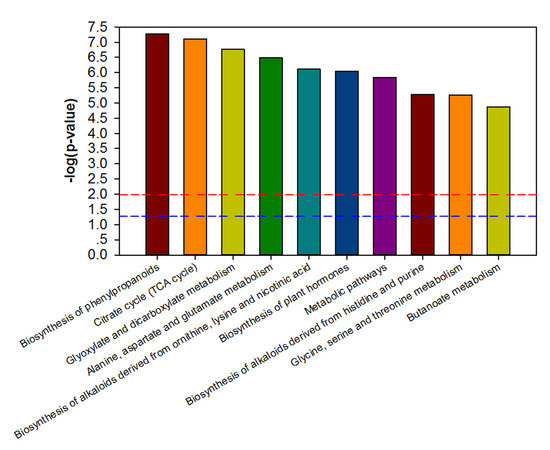
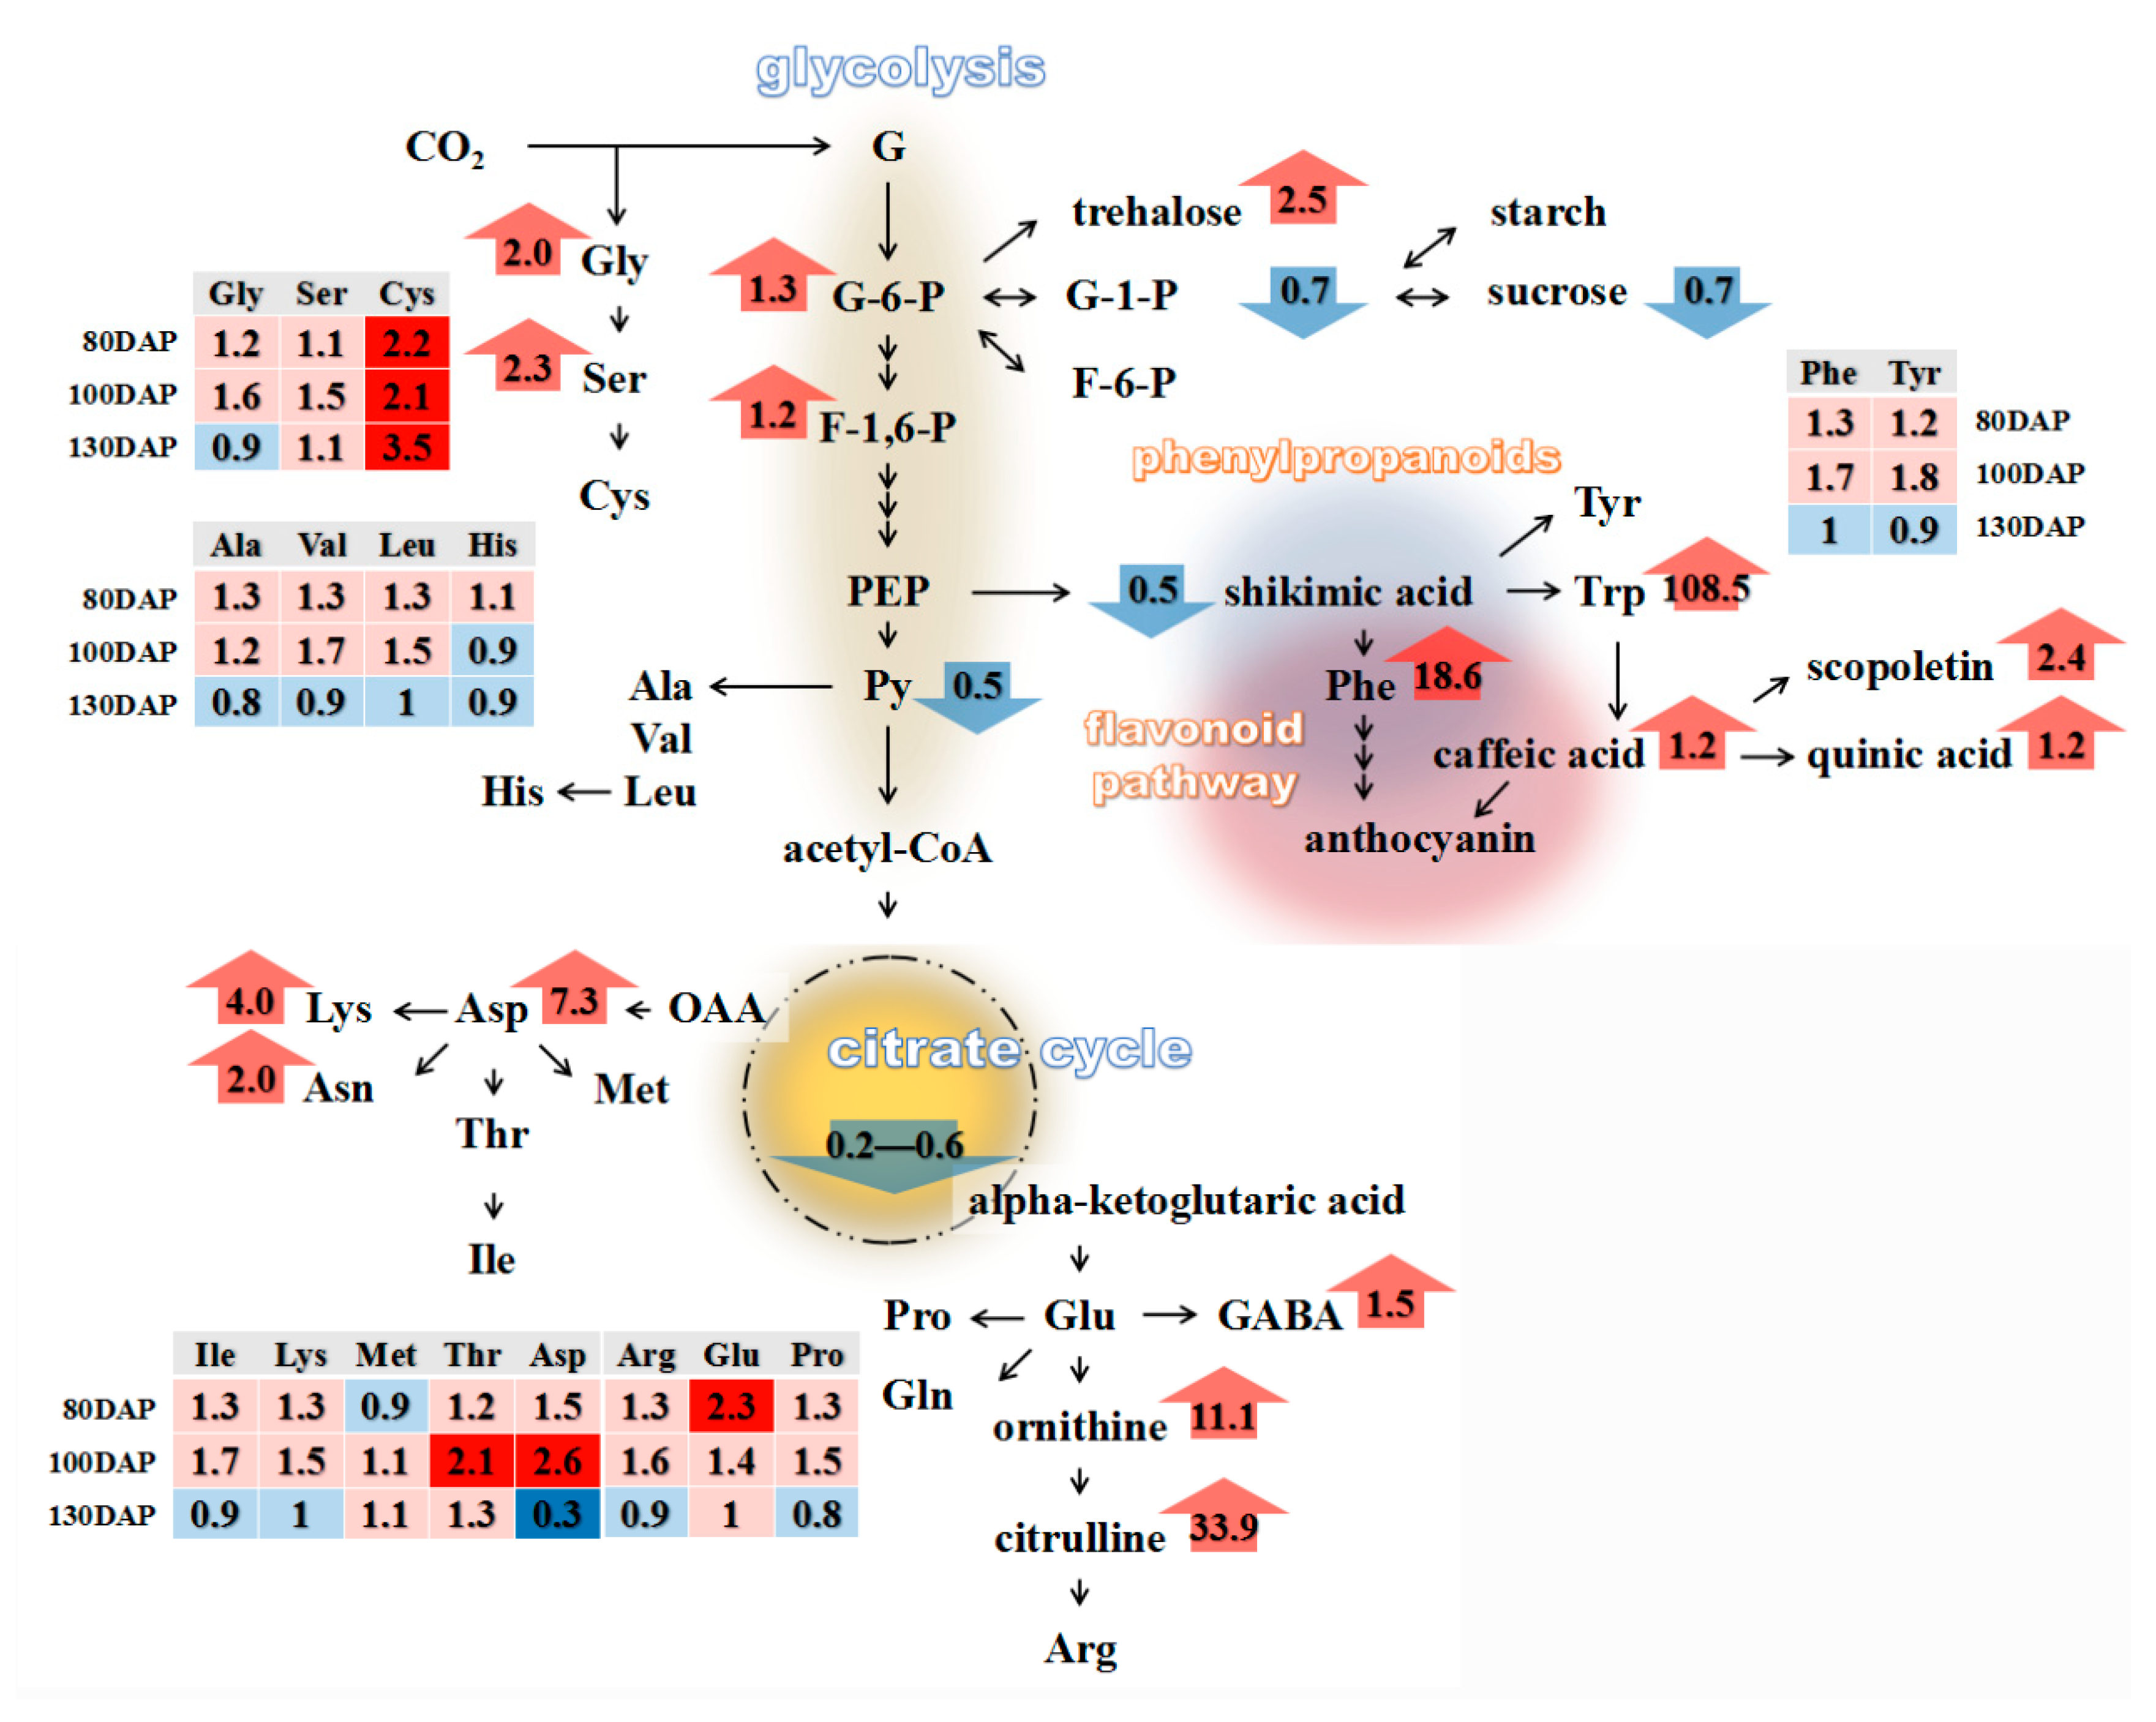
3.3. Metabolic Characterization of Ripe PSP Storage Roots under Shading

PCA of storage roots reflected major differences in PSP metabolite levels between the 60% shading group and the control (Appendix A, Figure A1). In total, 507 metabolites were successfully quantified (p < 0.05). Among them, 224 differential metabolites were annotated, including 84 upregulated and 140 downregulated metabolites in storage roots under shading. Twelve differential metabolites were significantly upregulated under 60% shading with a more than 10-fold change (FC) compared to the levels under non-shading treatment, including N-acetyl-5-hydroxytryptamine (FC = 1.1 × 10⁷), 1-monopalmitin (FC = 1.1 × 10⁷), 4-pyridoxic acid (FC = 6.3 × 10⁶), dodecano (FC = 6.3 × 10⁵), arbutin (FC = 1.8 × 10⁵), tryptophan (FC = 1.1 × 10²), citrulline (FC = 33.9), phenylalanine (FC = 18.6), malonic acid (FC = 15.8), N-methyl-L-glutamic acid (FC = 12.6), ornithine (FC = 11.1) and guanine (FC = 10.7) with descending order of FC. Furthermore, metabolic pathway enrichment maps were based on the biological processes and stratification level selected (Figure 3). The top two metabolic pathways were biosynthesis of phenylpropanoids and the citrate cycle, followed by organic acid metabolism, biosynthesis and metabolism of amino acids, and biosynthesis of alkaloids and hormones (Figure 3).
To explore the metabolic changes under shading, the differential metabolites of storage roots between the shaded and control groups were grouped into two primary clusters by hierarchical cluster analysis (Figure 4). Deep insight into these metabolites revealed many primary metabolites, including organic acids, soluble sugars and amino acids (Appendix A, Figure A2). There were several differential metabolites that were intermediate metabolites of the citrate cycle that increased under shading. Among them, five organic acids, succinic acid, L-malic acid, citric acid, pyruvic acid and isocitric acid, were significantly downregulated with FCs of 0.2–0.5 (Table 2). For soluble sugars, sucrose accounted for the largest component of the total soluble sugar content, accounting for more than 50%. It was downregulated with an FC of 0.7 with shading. In addition, most amino acids were upregulated. Among them, four significantly differential metabolites were Phe, Glu, Gly and Ser (Table 2).
In plants, primary and secondary metabolites influence each other. Phenylpropanoid biosynthesis is a common upstream pathway of several secondary metabolites. In the upstream pathway, one differential metabolite of 3,4-dihydroxycinnamic acid was upregulated with an FC of 1.8 under shading. Despite the limited anthocyanins identified by GC-MS analysis, the acyl ligands of 4-hydroxybenzoic acid and caffeic acid were upregulated under shading with FC values of 1.3 and 1.2, respectively (Table 2). Anthocyanins should be acylated and glycosylated to exist in a stable form for accumulation in plants. For the PSP cultivar Jihei-1, caffeic acid could be one of the main acyl ligands of anthocyanins [39,40]. The results demonstrated that shading accelerated flavonoid biosynthesis as an essential route of phenylpropanoid biosynthesis and increased the acyl ligands required for anthocyanin accumulation.

3.4. Changes in the Amino Acid Contents of PSP Storage Roots in Response to Shading

Amino acid analysis showed the nutritional characteristics of PSP storage roots (Figure 5). In the ripe storage roots, the ascending sort of the essential amino acid content was His (0.1 g kg−1), Thr (0.4 g kg−1), Lys (0.4 g kg−1), Ile (0.5 g kg−1), Phe (0.5 g kg−1), Met (0.5 g kg−1), Val (0.6 g kg−1) and Leu (0.6 g kg−1). Among the essential amino acids, the contents of Thr and Met increased by 28% and 8%, respectively, under shading treatment, while the contents of His, Val and Ile decreased by approximately 10%. However, almost all the amino acid levels increased in the growing storage roots under shading, with an increase ranging from 12–159% during the rapid growth periods from 80 DAP to 100 DAP. In particular, the storage root amino acid levels of Cys, Asp and Thr under shading were two-fold higher than those of the control at 100 DAP (Figure 5). These findings suggest that the amino acid contents were highly related to the anthocyanin content in PSP storage roots.

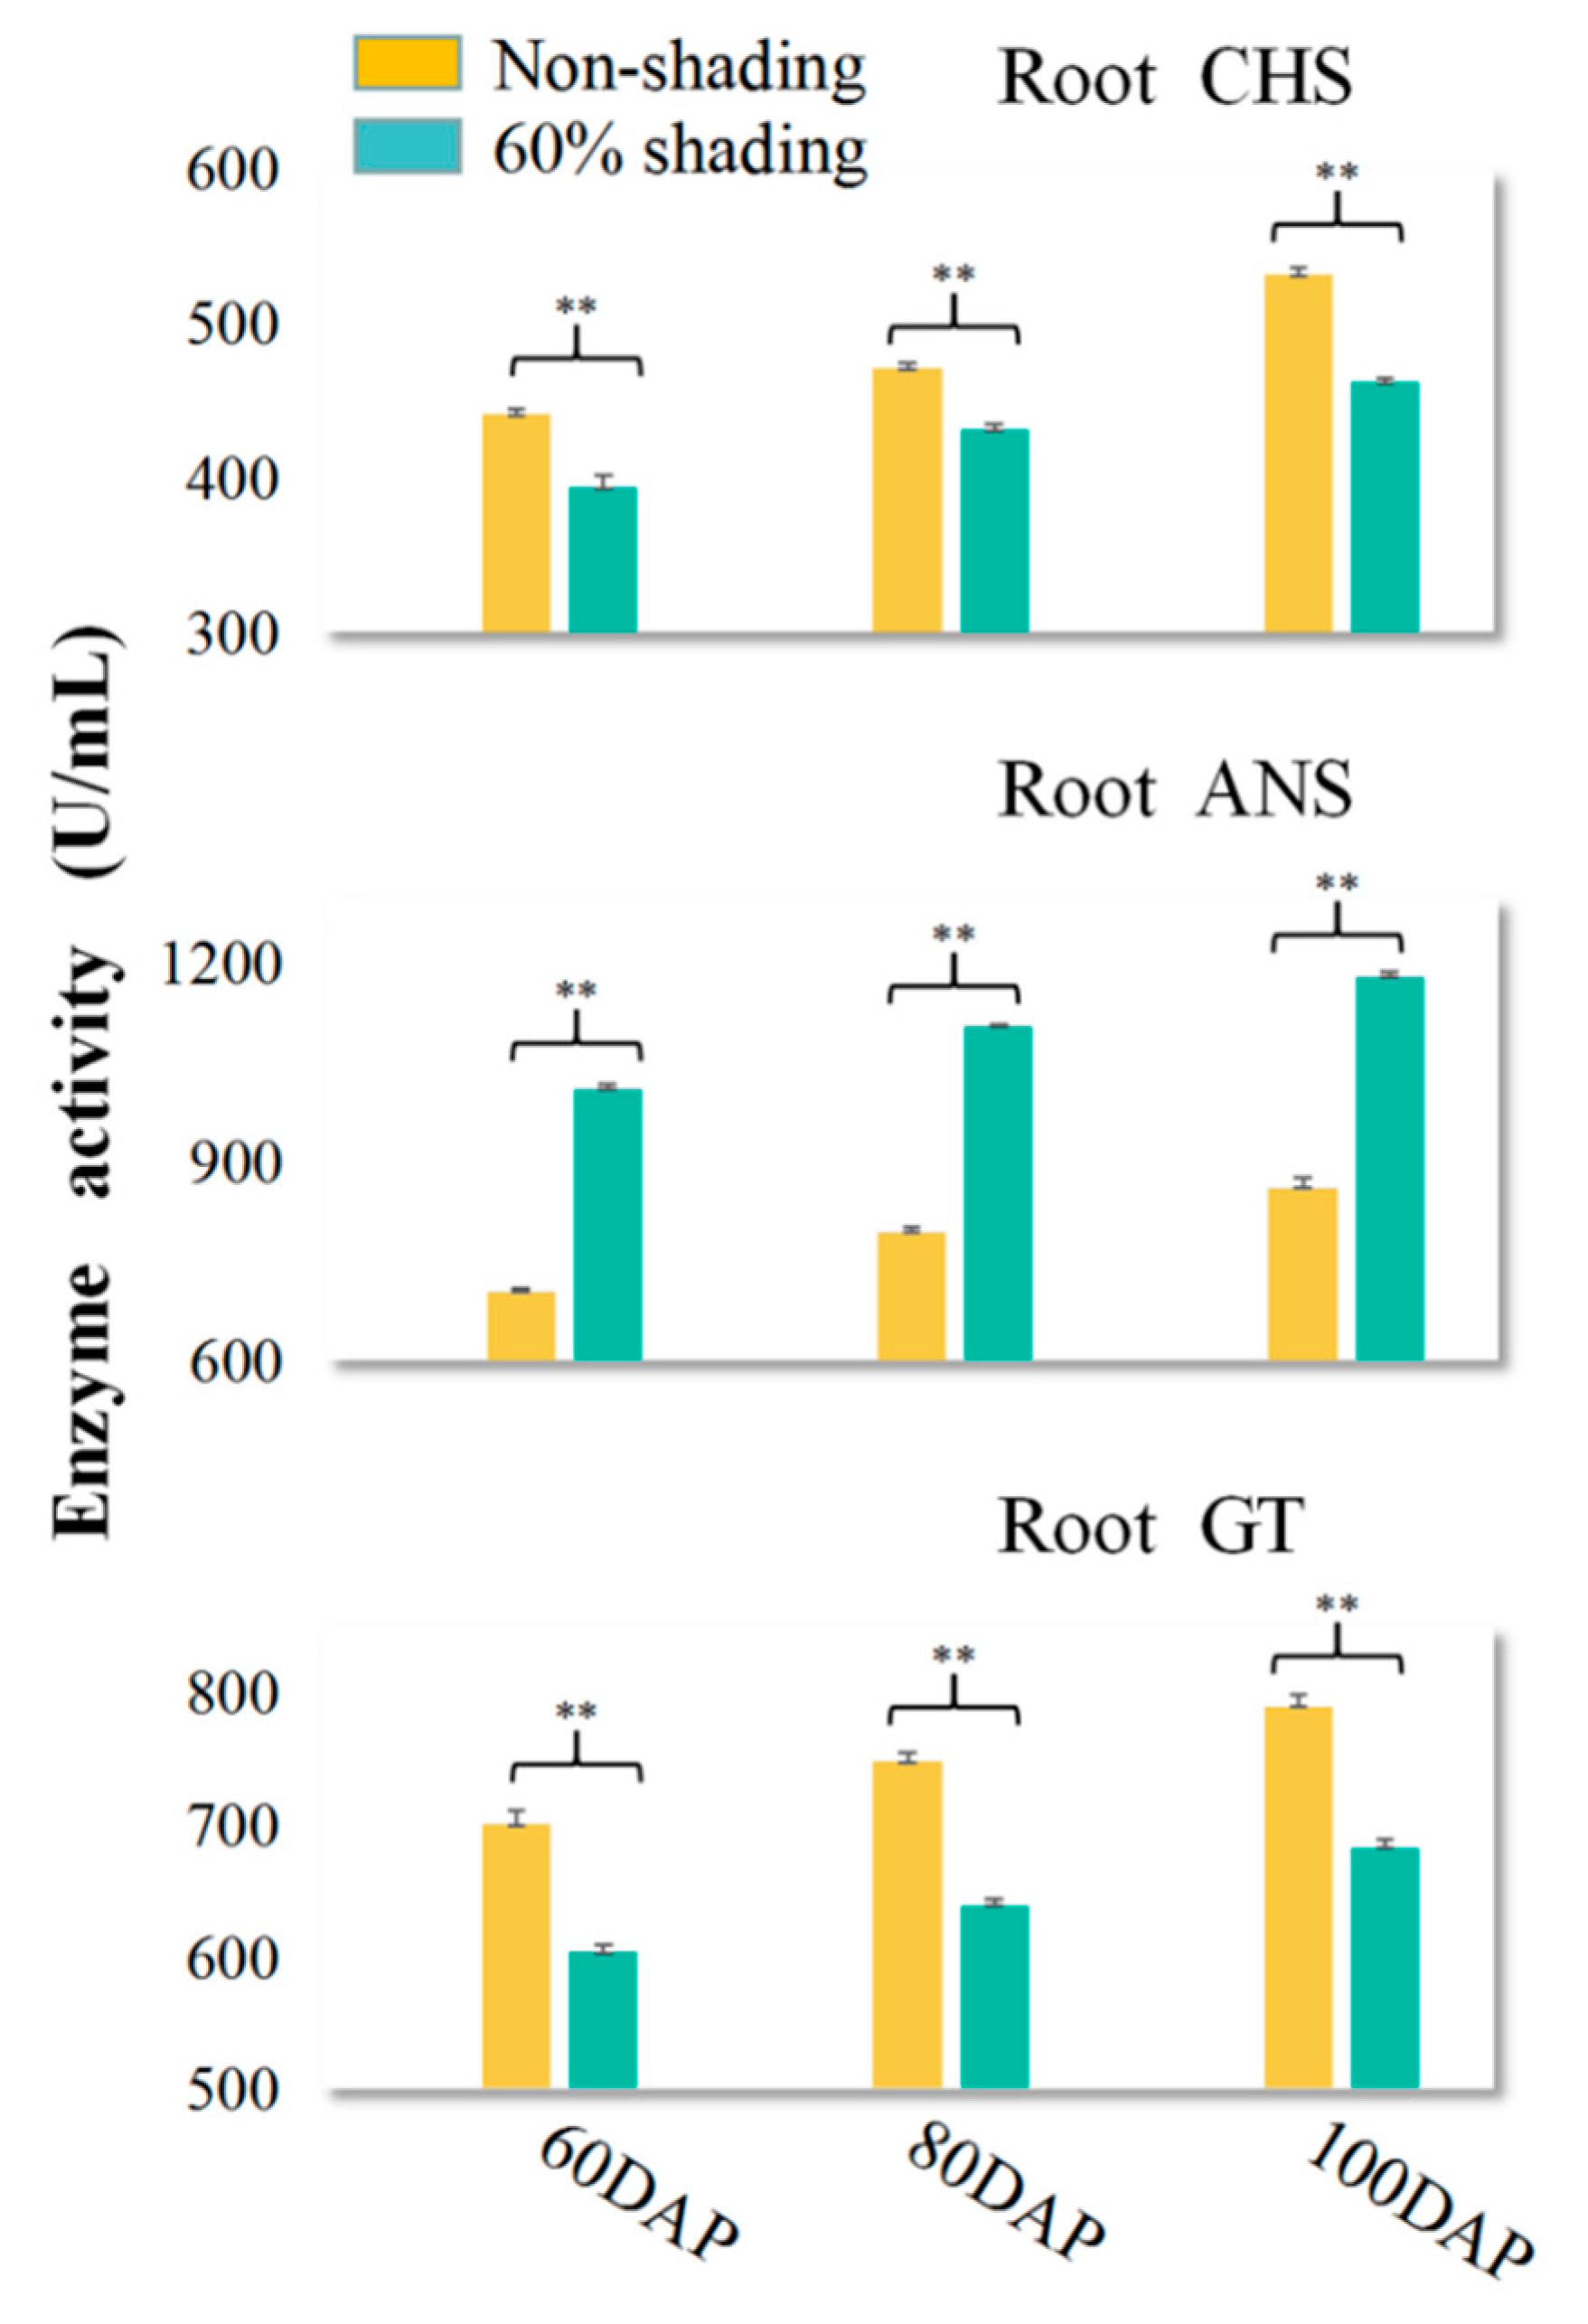
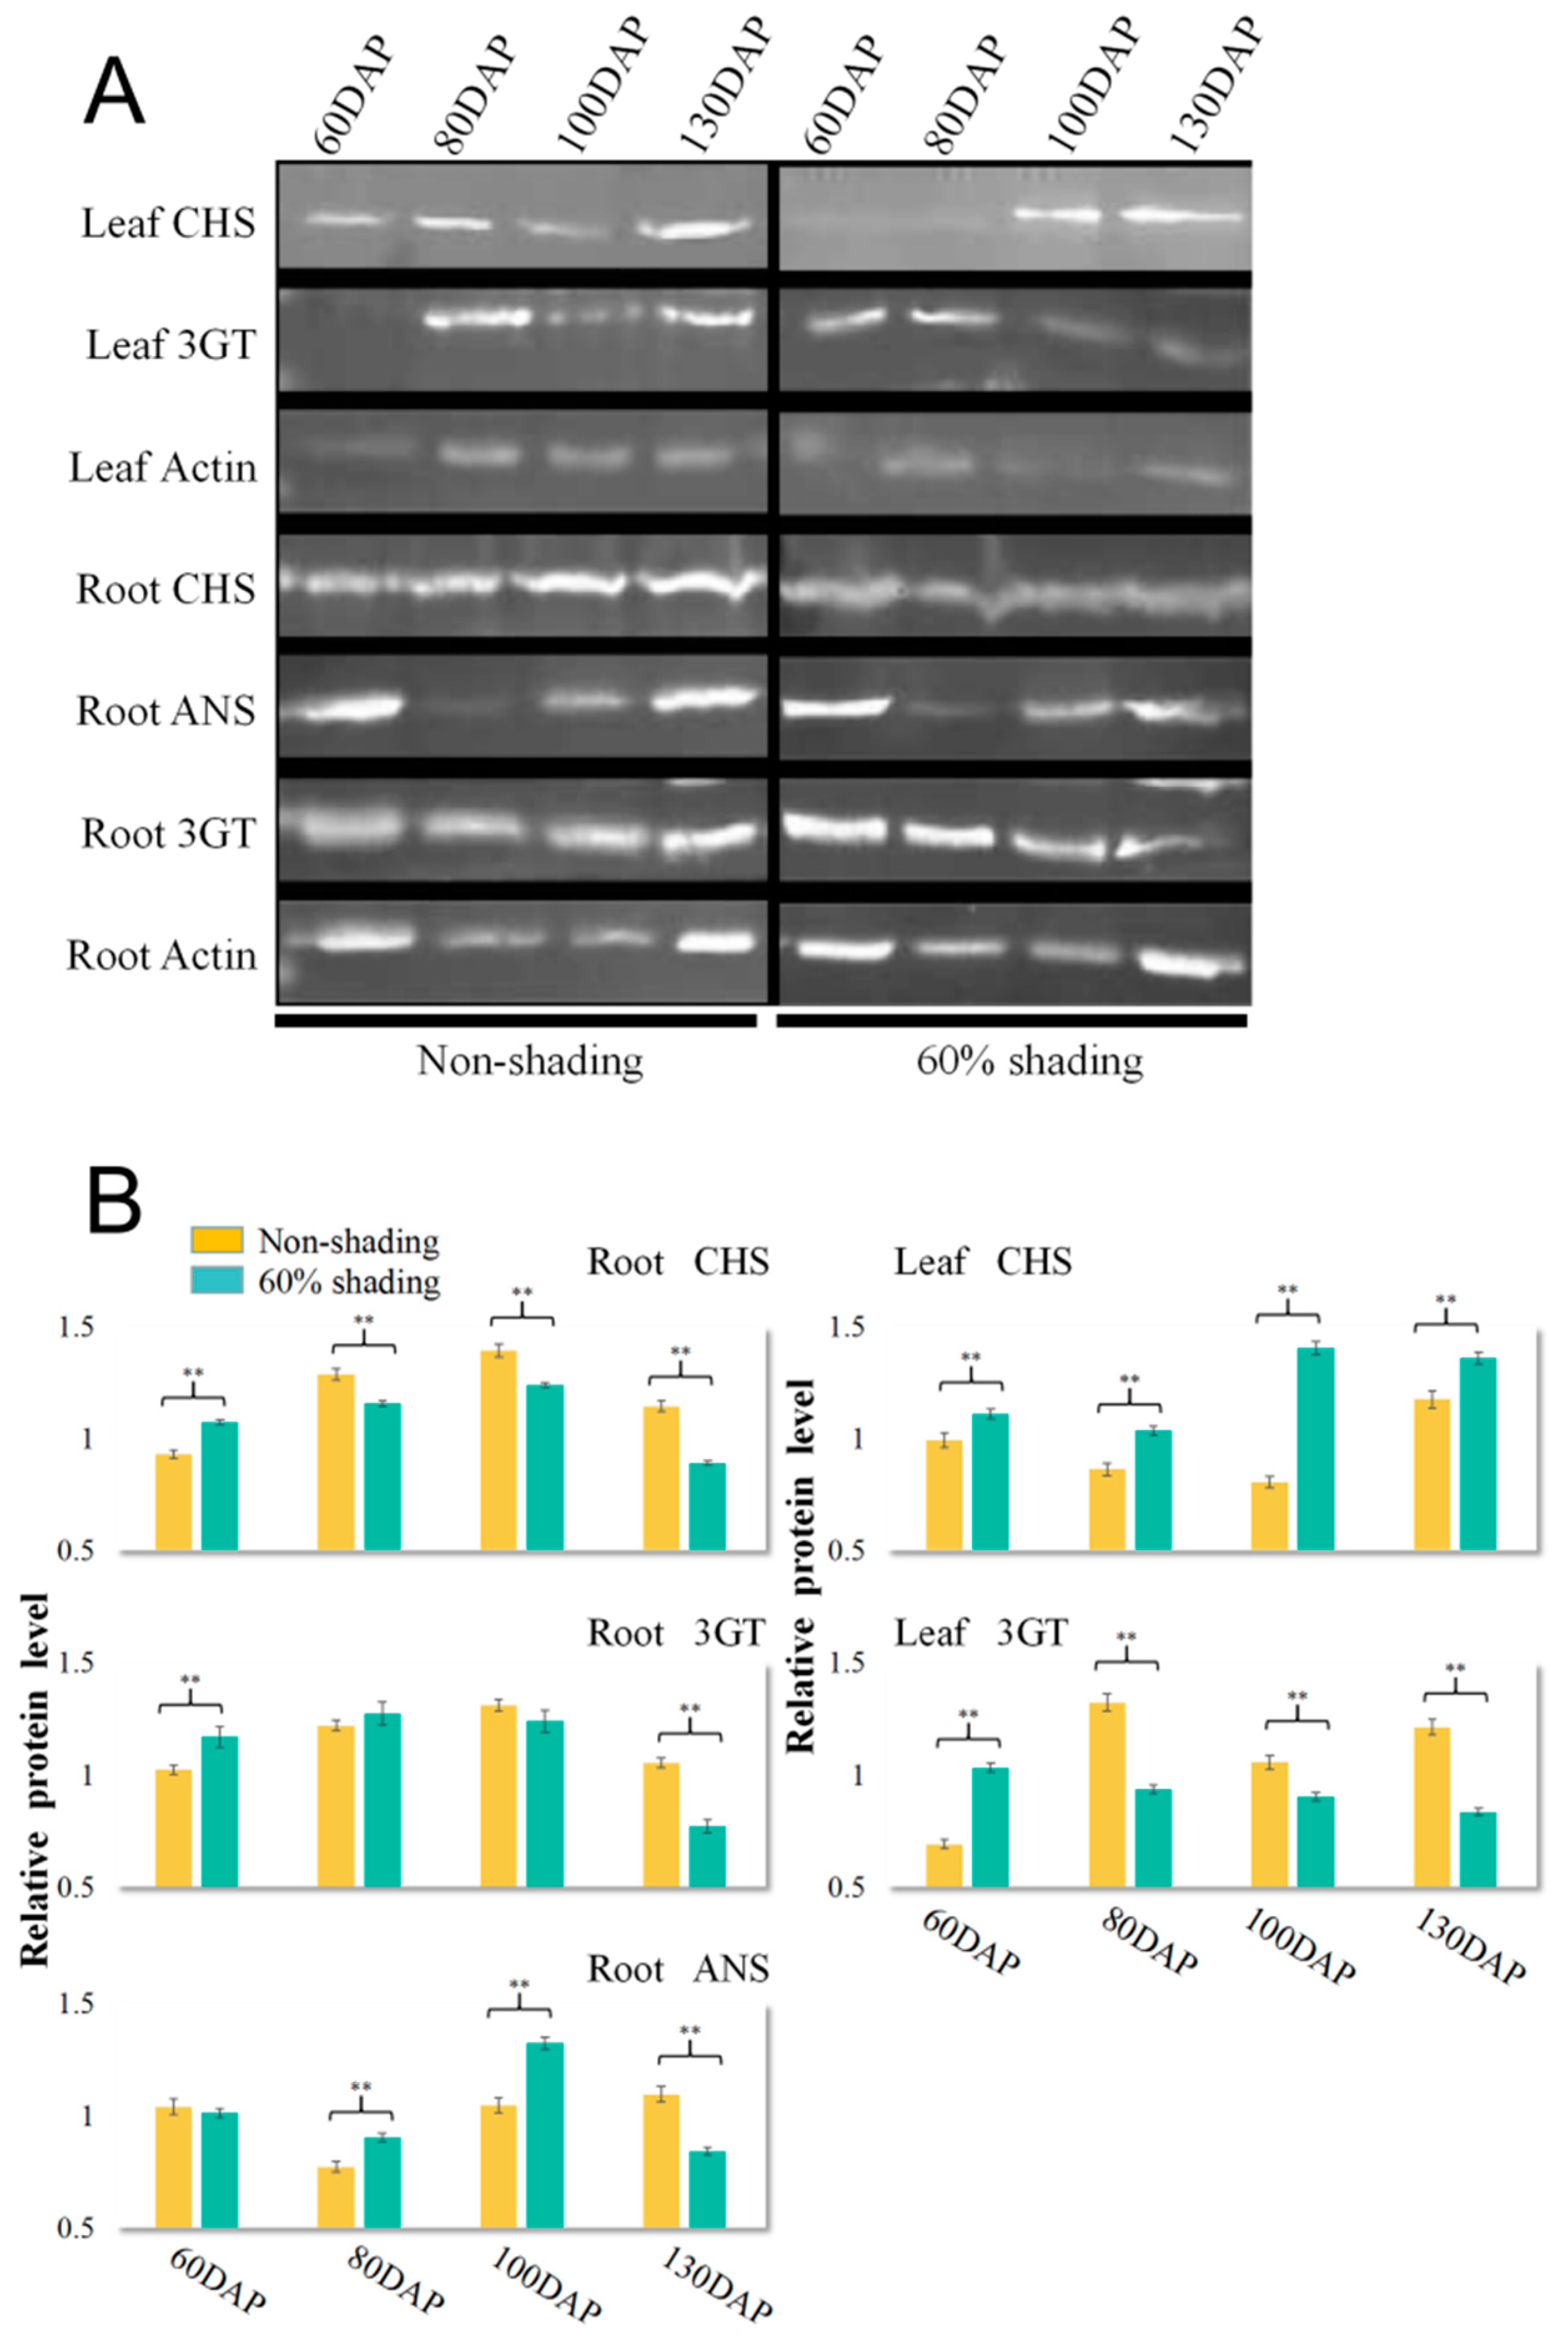
3.5. Effects of Shading on Three Key Anthocyanin Metabolism Enzymes, CHS, ANS, and 3GT, in Treated PSP Storage Roots

The ELISA results showed that ANS activity increased by 37.1–43.4% during the rapid growth periods from 80 DAP to 100 DAP (Figure 6). At the same time, the CHS and 3GT activities decreased with different degrees of decline, ranging from 8.5–17.0% (Figure 6). By western blot analysis, the ANS contents were consistent with enzyme activity, which increased with an increase of 17–26% during the growth periods from 80–100 DAP under shading (Figure 7). In the shading group, the 3GT contents increased during growth periods, with an increase of 14% at 60 DAP (Figure 7).
Based on sequence analysis, the functions and sequences of CHSs and ANSs were highly conserved in sweet potato (Ipomoea batatas L.), with a high homology of 73–74% to Arabidopsis ANS and CHS (UniProt ID: Q96323 and P13114). In addition, six sequences of ANSs from sweet potato already identified were 95% homogenous amino acid sequences (Appendix A, Figure A3). Although sweet potato CHSs with seven family members probably exhibit functional redundancy, thirteen sequences contained the CHS family in sweet potato with 95% homogeneity of highly conserved sequences (Appendix A, Figure A4). Accordingly, western blot analysis showed representative changes in the whole protein family from sweet potato in response to shading. ANS belongs to the 2-oxoglutarate-dependent dioxygenase (2-ODD) superfamily, which encodes a key enzyme for the catalytic reaction of pigment metabolites from non-colored to colored [41]. Obviously, shading can enhance the background ANS at the protein content and enzyme activity levels during 80–100 DAP, thereby leading to increased anthocyanin accumulation via the flavonoid pathway (Figure 6 and Figure 7). Root and leaf 3GT (UniProt ID: A0A0G2QMF5, Gene Accession: JN258961) and CHS1 (UniProt ID: Q9MB33, Gene Accession: AB037680) expression levels in sweet potato were upregulated under shading at 60 DAP; notably, leaf CHS1 were upregulated under shading during the storage root growth periods (Figure 7).
The expression of three key genes in the flavonoid pathway was also detected by qPCR assay (Appendix A, Table A1). The relative transcript abundance of CHS1, ANS and 3GT in the control group was set as 1 for the convenience of comparison with the shading groups (Figure 8). As shown, the gene expression levels were upregulated significantly during early storage root development at 60–80 DAP, coinciding with the protein content analysis. The lowest ANS expression occurred during the storage root growth period at 80–100 DAP, showing at least a 60% decrease compared to the control levels at 60 DAP, suggesting primary enzymes of the glycometabolic pathway are involved in rapid starch accumulation in the middle tuber growth stage (Figure 8).

4. Discussion

4.1. Effect of Shading Treatment on Storage Root Development in Sweet Potato and Species-Specific Strategy

Solar energy is the basis for biomass production [29,30]. During plant production, overshadowing from intercropping plants impacts crop yields, particularly for sweet potato as a creeping plant. The storage root yield in the pot experiments of three years showed deep decreases with increasing shade levels, while shading increased the PSP pigment concentrations and outputs to a noteworthy degree (Table 1). We focused on the establishment of pigment quality during PSP storage root development in response to shading; that is, anthocyanins accumulate richly and especially increase in the later period of storage root development (Figure 1). The benefits of intercropping the PSP cultivar Jihei-1 under shading with respect to solar energy use for quality formation, particularly storage root anthocyanin contents, are presented. The shading treatments reduced its root yield by decreasing the storage root number per plant. However, it is worth noting that shading also resulted in a significant increase in total pigment output with an increase of more than 20% (Table 1). Apparently, PSP cultivation under mild shading can influence yield in exchange for the improvement of storage root pigment accumulation, possibly increasing economic benefits.
Plants show two different strategies of tolerance and/or avoidance under shading [42,43]. This study showed a variety-specific strategy of sweet potato in response to prolonged deep shading. Comparing the two varieties of anthocyanin-enriched purple-fleshed and yellow-fleshed sweet potatoes, a notable effect on tissue soluble sugar and starch contents under shading treatment was not present, but there were different changing patterns. For the PSP Jihei-1 under shading, the soluble sugar contents in all tissues, such as leaf, petiole, stem and storage root tissues, were significantly increased at 80 DAP, and the storage root starch content also increased in the corresponding period (Figure 2A). For the yellow-fleshed SP, the aboveground-tissue soluble sugar contents (leaves, petioles and stems) were significantly increased under shading at 130 DAP, while the leaf starch content increased during the ripe period (Figure 2A). In response to shading, photosynthesis in all green tissues, particularly the petiole, was noted; this was required to feed the developing storage roots of SPS in the premature expansion period. On the other hand, green tissue sugar was mobilized and transferred into storage roots at 80 DAP, twenty days ahead of the process in SP. Another strategy is to maintain and enhance leaf photosynthesis in yellow-fleshed SP even during the maturation period. Plant starch production is largely dependent on current photosynthesis. Light intensity is one of the most critical environmental factors for crop yield and the physiological and biochemical processes related to growth and development. According to past studies, the dry matter and photosynthetic rate of different tissues and whole plants decreased under low light conditions [44]. Some studies suggest that a decrease in light intensity leads to marked increases in leaf photosynthesis characteristics, such as leaf morphology and structure, leaf angle orientation and movement in crop plants [45,46]. However, information about sweet potato photosynthetic characteristics in response to shading during intercropping is limited. Recent studies suggest that the SP net photosynthetic rate can be improved in cases of compatible high-density intercropping under walnut saplings [47]. Here, we propose a specific strategy by which SPS respond to continuous and extensive shading treatment with three points: (I) the utilization of photosynthesis in broad aboveground tissues with creeping characteristics, (II) the advance (by 20 days) mobilization and transfer of photosynthates into storage roots, and (III) the maintenance and enhancement of aboveground tissue photosynthesis in the maturation period, for example, in the leaf petiole, leading to a rapid increase in physiological process rates and demands while storage root yield decreases.

4.2. Effect on Key Enzyme Expression of Flavonoid Pathways to Promote PSP Storage Root Anthocyanin Biosynthesis in Response to Shading Treatment

Anthocyanins are plant secondary metabolites that play a key role as pigments, in response to nutrient availability, in male fertility of some species, in the modulation of auxin transport, and in UV protection [48,49]. Light intensity can affect both flavonoid and anthocyanin contents in plants. The anthocyanin contents of SPS storage roots increased significantly at 130 DAP under the shading treatments in this study. As mentioned above, shading affects carbohydrate transport from photosynthetic organs to storage roots. Upregulation of the expression and enzyme activity of several anthocyanin biosynthesis genes/proteins was observed in the shaded SPS groups, which accumulated high levels of soluble sugars at 80 DAP in the early period of storage root development (Figure 6, Figure 7 and Figure 8). Obviously, in the early expansion period, the upregulated expression of storage root CHS, ANS and 3GT genes in SPS could promote the flavonoid pathway, leading to an increase in anthocyanin biosynthesis (Figure 8) and ultimately to a notable increase in storage root pigment outputs and anthocyanin contents. However, ANS expression was not detected in yellow-fleshed SP but was weakly detected in other SPS tissues except storage roots (data not shown). ANSs, as key enzymes downstream of the pathway, are functionally conserved with highly homologous sequences (Figure A3). Accordingly, the changing patterns of these enzymes upstream from the flavonoid pathway could represent the strengthening of the whole pathway and the increased pigment outputs under shading in this study.
The synthesis of plant anthocyanins shares common steps with the flavonoid pathway. However, the enzymes from the pathway may be variety-/time-/tissue-specific and regulated by multigene family members in addition to showing species-specific chemical diversity of the anthocyanins ultimately produced in these plants. For the shading effect on anthocyanin accumulation, it is unclear which signals are involved in transfer to underground organs. Plant growth is centered around the production and utilization of sugars that serve as the primary supplies of energy as well as signals to guide development and adaptation [50]. It has been reported that sucrose can affect the anthocyanin content and the flavonoid pathway with a sugar-dependent upregulation of enzyme expression in plants [51,52,53,54,55]. For sweet potato, the interrelationships between the developmental, shading and metabolic signals of sugar control the accumulation of flavonoids (Figure 8). With limited knowledge of anthocyanin synthesis and regulation in sweet potato, it is difficult to determine the contribution of specific regulatory sites or factors responsible for storage root anthocyanin biosynthesis. We thus speculate that the soluble sugar level influenced anthocyanin accumulation via an upregulation in gene expression and the activity of the key enzyme ANS in the flavonoid pathway. Certainly, additional studies are required to confirm this hypothesis to guide the development of intercropping production.

4.3. Nitrogen/Carbon Balance and Sugar/Hormone Signalling to Regulate Storage Root Flavonoid Pathways under Shading

For crop plants, a long-time and low-level light intensity could affect their carbon balance because of mismatching between the carbohydrate demand increases for physiological processes and the photosynthetic production reduction [56]. Shading affects not only crop yield but also crop quality. During shading, valuable compounds are remobilized and accumulate in storage roots. Our data essentially reveal a balanced and trade-off relationship between primary metabolites and secondary metabolites in sweet potato. On the one hand, the main soluble sugar, sucrose, which accounts for more than half of the total amount, decreased by 26% in the ripe storage roots (Table 2). The intermediate metabolites of the central pathway of the citrate cycle were also reduced with FC values of 0.2–0.6 (Figure 9). On the other hand, most of the amino acids in the ripe storage roots were upregulated under shading. The significant differential expression of Phe was upregulated with an FC of 18.6 (Figure 9). Based on metabolic pathway enrichment maps, the top biological process was the biosynthesis of phenylpropanoids with an initial substrate of Phe, which is also the upstream pathway of pigment synthesis. Amino acids provide initial carbon skeletons for the biosynthesis of specific secondary metabolites. The first limited amino acid of Lys and a healthy functional 4-aminobutyric acid were also significantly upregulated. In addition, the significantly differential Cys, Thr, Asp and Glu, which are the polar amino acids distributed in the enzyme activity center and have important catalytic functions, showed a two-fold increase (Figure 9). Recent studies have also suggested that numerous pathways associated with amino acid metabolism of tea altered in a Chinese chestnut and tea intercropping system greatly influence tea quality [57].
Nutrient signaling is the most ancient and fundamental mechanism to regulate and sustain life [58]. As mentioned above, a specific strategy for SPS in response to continuous and extensive shading treatment is proposed, that is, a rapid increase in physiological process rates. The nutritional levels of the edible storage roots, consisting of the richness of carbohydrates, polyphenolic compounds and peptides/amino acids, also significantly changed under shading (Table 2). Anthocyanins are plant secondary metabolites that play a key role as pigments in responses related to nutrient availability. Genes coding for dihydroflavonols 4-reductase (DFR) and ANS were upregulated, and the accumulation of anthocyanins was strongly increased by sucrose in grapes [15]. Recent studies have suggested that structural genes of tea flavonoid biosynthesis altered throughout shading greatly enhanced tea quality [59]. In Arabidopsis, the pho3 mutant, which has a defective copy of the sucrose transporter gene, can lead to soluble sugar, starch and anthocyanin accumulation, possibly because sugars are in vivo triggers of anthocyanin biosynthesis [54,60]. The sugar-regulating mechanism operating in sweet potato is poorly studied. Due to the outstanding accumulation of sugars during storage root development (Figure 2), it is tempting to speculate that sugars are endogenous signals modulating the expression of anthocyanin biosynthesis genes (Figure 7 and Figure 8). Under shading conditions, the absolute amount of sucrose in mature storage roots of SPS was downregulated, but the ratio of sucrose to total soluble sugar was upregulated by metabolomics analysis. Sucrose is the transport form of photosynthetic products in sweet potato. Combined with tissue-specific soluble sugar contents, it is speculated that the sucrose proportion influences the flavonoid pathway and anthocyanin accumulation. In addition to sucrose, trehalose showed a significant 2.5-fold increase in SPS storage roots under shading through metabolomics data (Table 2). In plants, trehalose is an important metabolic signal that regulates plant development, abiotic stress tolerance and anthocyanin synthesis pathways [61,62,63].

5. Conclusions

The shade cultivation of PSP can improve pigment outputs by an extra 20% to increase economic benefits. This report described a comprehensive investigation of sugar, anthocyanin and amino acid contents in PSP storage roots under shading by metabolomics and biochemical characterization. Accordingly, we proposed a variety-specific and tissue-specific strategy of PSP in response to shading, leading to a reduction in yield but a rapid increase in storage root anthocyanin synthesis. With molecular validation data, we elucidated the regulation of genes involved in the flavonoid pathways by shading treatment; that is, shading significantly impacts the key enzyme ANS upregulation at the transcriptional level and enzymatic activity, leading to enhancement of storage root anthocyanin biosynthesis and pigment outputs. These results indicate that intercropping cultivation patterns provide opportunities for sustainable agriculture with greater yield per unit land but also nutritional improvement of sweet potato.

6. Patents

There is one patent authorized resulting from the work, the antigenic peptides of Anthocyanin synthase and the anti-ANS application (number 2019111228892.2).

Author Contributions

Y.H. analyzed the data, made the charts and wrote the manuscript; D.Z., Y.S., Q.W. and L.Z. performed the experiments and proofread the text; H.Z. and Y.H. conceived and designed the experiment, applied for the project, and provided platforms and materials. All authors have read and agreed to the published version of the manuscript.

Funding

This research was supported by the National Natural Science Foundation of China (No. 31801294) and Fundamental Research Funds for the Central Universities (No. 2662015QC012).

Informed Consent Statement

Not applicable.

Acknowledgments

Plant material of Jihei-1 and yellow-fleshed SP were generously provided by Aihua Wang and Ping Wang researchers in Wuhan Academy of Agriculture Sciences (Wuhan City, China). Guidance on purple potato cultivation were generously provided by Xinsun Yang researchers in Hubei Academy of Agricultural Sciences (Wuhan City, China).

Conflicts of Interest

All authors declare that they have no competing interests.

Appendix A

Table A1. A Primer information of three candidate genes related to flavonoid biosynthesis used for qPCR.
Target GeneAccessionPrimer Sequence (5′-3′)
ANSFJ478179GCTGACACGCCCAAACCT
CCATAATAATACCAAACGGACT
CHSAB037680GCACTTGGATAGCCTGGTC
GAGTAAATGGAACGTGAGCC
3GTJN258961GACGGATTCGTTTCTGTGG
GTTTGCGTTTGGAGTGGC
ACTINEU250003GAGACCTTCAACACCCCTGCTA
ATCACCAGAGTCCAACACATTACCT
The data is obtained from EMBL-EBI (https://www.ebi.ac.uk/, accessed on 25 February 2021, accession FJ478179, AB037680, JN258961 and EU250003).
Figure A1. Multivariate statistical analysis of differential metabolites from PSP storage roots under 60% shading treatment and control, including PCA, OPLS-DA and PLS-DA. Green and blue circles and red triangles reflected the 60% shading and non-shading samples and three QC sample (n = 3), respectively. Analysis represents with eight independent replicates (n = 8). principal component analysis, PCA, orthogonal partial least-squares discriminant analysis, OPLS-DA, partial least-squares discriminant analysis, PLS-DA.
Agronomy 11 00737 g0a1
Figure A2. Classification of differential metabolites of PSP storage roots under shading treatment.
Agronomy 11 00737 g0a2
Figure A3. Sequence analysis of ANS. The antigenic peptides of ANS are marked with red frames. Align protein sequences with the Clustal Omega program (https://www.uniprot.org/align/, accessed on 25 February 2021) to view their characteristics alongside each other. The asterisks (*) represent significant amino acid residue identity, and the dots (:/.) represent amino acid residue similarity.
Agronomy 11 00737 g0a3
Figure A4. Sequence analysis of CHS. The antigenic peptides of CHS1 are marked with red frames. Align protein sequences with the Clustal Omega program (https://www.uniprot.org/align/, accessed on 25 February 2021) to view their characteristics alongside each other. The asterisks (*) represent significant amino acid residue identity, and the dots (:/.) represent amino acid residue similarity.
Agronomy 11 00737 g0a4

References

  1. Jaakola, L.; Määttä-Riihinen, K.; Kärenlampi, S.; Hohtola, A. Activation of flavonoid biosynthesis by solar radiation in bilberry (Vaccinium myrtillus L.) leaves. Planta 2004, 218, 721–728. [Google Scholar]
  2. Deluc, L.; Bogs, J.; Walker, A.R.; Ferrier, T.; Decendit, A.; Merillon, J.-M.; Robinson, S.P.; Barrieu, F. The transcription factor VvMYB5b contributes to the regulation of anthocyanin and proanthocyanidin biosynthesis in developing grape berries. Plant Physiol. 2008, 147, 2041–2053. [Google Scholar] [CrossRef] [PubMed] [Green Version]
  3. Kobayashi, S.; Ishimaru, M.; Hiraoka, K.; Honda, C. Myb-related genes of the Kyoho grape (Vitis labruscana) regulate anthocyanin biosynthesis. Planta 2002, 215, 924–933. [Google Scholar]
  4. Kobayashi, S.; Goto-Yamamoto, N.; Hirochika, H. Retrotransposon-induced mutations in grape skin color. Science 2004, 304, 982. [Google Scholar] [CrossRef] [PubMed]
  5. Ogo, Y.; Mori, T.; Nakabayashi, R.; Saito, K.; Takaiwa, F. Transgenic rice seed expressing flavonoid biosynthetic genes accumulate glycosylated and/or acylated flavonoids in protein bodies. J. Exp. Bot. 2016, 67, 95–106. [Google Scholar] [CrossRef] [PubMed]
  6. Zhao, C.; Wang, F.; Lian, Y.; Xiao, H.; Zheng, J. Biosynthesis of citrus flavonoids and their health effects. Crit. Rev. Food Sci. Nutr. 2020, 60, 566–583. [Google Scholar] [CrossRef] [PubMed]
  7. Tohge, T.; de Souza, L.P.; Fernie, A.R. Current understanding of the pathways of flavonoid biosynthesis in model and crop plants. J. Exp. Bot. 2017, 68, 4013–4028. [Google Scholar] [CrossRef]
  8. Lepiniec, L.; Debeaujon, I.; Routaboul, J.-M.; Baudry, A.; Pourcel, L.; Nesi, N.; Caboche, M. Genetics and biochemistry of seed flavonoids. Annu. Rev. Plant Biol. 2006, 57, 405–430. [Google Scholar] [CrossRef]
  9. Fuglevand, G.; Jackson, J.A.; Jenkins, G.I. UV-B, UV-A, and blue light signal transduction pathways interact synergistically to regulate chalcone synthase gene expression in Arabidopsis. Plant Cell 1996, 8, 2347–2357. [Google Scholar]
  10. Lloyd, A.; Brockman, A.; Aguirre, L.; Campbell, A.; Bean, A.; Cantero, A.; Gonzalez, A. Advances in the MYB–bHLH–WD repeat (MBW) pigment regulatory model: Addition of a WRKY factor and co-option of an anthocyanin MYB for betalain regulation. Plant Cell Physiol. 2017, 58, 1431–1441. [Google Scholar] [CrossRef] [Green Version]
  11. Henry-Kirk, R.A.; Plunkett, B.; Hall, M.; McGhie, T.; Allan, A.C.; Wargent, J.J.; Espley, R.V. Solar UV light regulates flavonoid metabolism in apple (Malus × domestica). Plant Cell Environ. 2018, 41, 675–688. [Google Scholar] [CrossRef]
  12. Cohen, S.D.; Tarara, J.M.; Gambetta, G.A.; Matthews, M.A.; Kennedy, J.A. Impact of diurnal temperature variation on grape berry development, proanthocyanidin accumulation, and the expression of flavonoid pathway genes. J. Exp. Bot. 2012, 63, 2655–2665. [Google Scholar] [CrossRef] [PubMed] [Green Version]
  13. Koyama, K.; Ikeda, H.; Poudel, P.R.; Goto-Yamamoto, N. Light quality affects flavonoid biosynthesis in young berries of Cabernet Sauvignon grape. Phytochemistry 2012, 78, 54–64. [Google Scholar] [CrossRef] [PubMed]
  14. Goh, H.H.; Khairudin, K.; Sukiran, N.A.; Normah, M.; Baharum, S. Metabolite profiling reveals temperature effects on the VOC s and flavonoids of different plant populations. Plant Biol. 2016, 18, 130–139. [Google Scholar] [CrossRef]
  15. Jia, H.; Jiu, S.; Zhang, C.; Wang, C.; Tariq, P.; Liu, Z.; Wang, B.; Cui, L.; Fang, J. Abscisic acid and sucrose regulate tomato and strawberry fruit ripening through the abscisic acid-stress-ripening transcription factor. Plant Biotechnol. J. 2016, 14, 2045–2065. [Google Scholar] [CrossRef] [PubMed]
  16. Gambetta, G.A.; Matthews, M.A.; Shaghasi, T.H.; McElrone, A.J.; Castellarin, S.D. Sugar and abscisic acid signaling orthologs are activated at the onset of ripening in grape. Planta 2010, 232, 219–234. [Google Scholar] [CrossRef] [Green Version]
  17. Zheng, Y.; Tian, L.; Liu, H.; Pan, Q.; Zhan, J.; Huang, W. Sugars induce anthocyanin accumulation and flavanone 3-hydroxylase expression in grape berries. Plant Growth Regul. 2009, 58, 251–260. [Google Scholar] [CrossRef]
  18. Jia, H.; Xie, Z.; Wang, C.; Shangguan, L.; Qian, N.; Cui, M.; Liu, Z.; Zheng, T.; Wang, M.; Fang, J. Abscisic acid, sucrose, and auxin coordinately regulate berry ripening process of the Fujiminori grape. Funct. Integr. Genomics 2017, 17, 441–457. [Google Scholar] [CrossRef] [PubMed]
  19. Chen, Z.; Li, H.; Ma, X.; Dong, H.; Ma, D.; Zeng, H. Proteome alterations of reverse photoperiod-sensitive genic male sterile rice (Oryza sativa L.) at fertility transformation stage. Genes Genomics 2014, 36, 711–726. [Google Scholar] [CrossRef]
  20. Acero, N.; Gradillas, A.; Beltran, M.; García, A.; Mingarro, D.M. Comparison of phenolic compounds profile and antioxidant properties of different sweet cherry (Prunus avium L.) varieties. Food Chem. 2019, 279, 260–271. [Google Scholar] [CrossRef]
  21. Bai, S.; Tao, R.; Tang, Y.; Yin, L.; Ma, Y.; Ni, J.; Yan, X.; Yang, Q.; Wu, Z.; Zeng, Y. BBX16, a B-box protein, positively regulates light-induced anthocyanin accumulation by activating MYB10 in red pear. Plant Biotechnol. J. 2019, 17, 1985–1997. [Google Scholar] [CrossRef] [PubMed] [Green Version]
  22. Mei, X.; Zhou, C.; Zhang, W.; Rothenberg, D.O.N.; Wan, S.; Zhang, L. Comprehensive analysis of putative dihydroflavonol 4-reductase gene family in tea plant. PLoS ONE 2019, 14, e0227225. [Google Scholar] [CrossRef] [PubMed]
  23. Barbieri, P.; Pellerin, S.; Nesme, T. Comparing crop rotations between organic and conventional farming. Sci. Rep. 2017, 7, 1–10. [Google Scholar] [CrossRef] [PubMed] [Green Version]
  24. Li, C.; Hoffland, E.; Kuyper, T.W.; Yu, Y.; Zhang, C.; Li, H.; Zhang, F.; van der Werf, W. Syndromes of production in intercropping impact yield gains. Nat. Plants 2020, 6, 653–660. [Google Scholar] [CrossRef] [PubMed]
  25. Voisin, A.-S.; Guéguen, J.; Huyghe, C.; Jeuffroy, M.-H.; Magrini, M.-B.; Meynard, J.-M.; Mougel, C.; Pellerin, S.; Pelzer, E. Legumes for feed, food, biomaterials and bioenergy in Europe: A review. Agron. Sustain. Dev. 2014, 34, 361–380. [Google Scholar] [CrossRef]
  26. Midmore, D.J. Scientific basis and scope for further improvement of intercropping with potato in the tropics. Field Crop. Res. 1990, 25, 3–24. [Google Scholar] [CrossRef]
  27. Mushagalusa, G.N.; Ledent, J.-F.; Draye, X. Shoot and root competition in potato/maize intercropping: Effects on growth and yield. Environ. Exp. Bot. 2008, 64, 180–188. [Google Scholar] [CrossRef]
  28. Brooker, R.W.; Bennett, A.E.; Cong, W.F.; Daniell, T.J.; George, T.S.; Hallett, P.D.; Hawes, C.; Iannetta, P.P.; Jones, H.G.; Karley, A.J. Improving intercropping: A synthesis of research in agronomy, plant physiology and ecology. New Phytol. 2015, 206, 107–117. [Google Scholar] [CrossRef]
  29. Krieger-Liszkay, A.; Krupinska, K.; Shimakawa, G. The impact of photosynthesis on initiation of leaf senescence. Physiol. Plant. 2019, 166, 148–164. [Google Scholar] [CrossRef] [PubMed]
  30. Li, T.; Zhang, Y.; Dai, J.; Dong, H.; Kong, X. High plant density inhibits vegetative branching in cotton by altering hormone contents and photosynthetic production. Field Crop. Res. 2019, 230, 121–131. [Google Scholar] [CrossRef]
  31. Wang, Q.; Hou, F.; Dong, S.; Xie, B.; Li, A.; Zhang, H.; Zhang, L. Effects of shading on the photosynthetic capacity, endogenous hormones and root yield in purple-fleshed sweetpotato (Ipomoea batatas (L.) Lam). Plant Growth Regul. 2014, 72, 113–122. [Google Scholar] [CrossRef]
  32. Lai, J.-l.; Liu, Z.-w.; Luo, X.-g. A metabolomic, transcriptomic profiling, and mineral nutrient metabolism study of the phytotoxicity mechanism of uranium. J. Hazard. Mater. 2020, 386, 121437. [Google Scholar] [CrossRef] [PubMed]
  33. Scandiani, M.M.; Luque, A.G.; Razori, M.V.; Ciancio Casalini, L.; Aoki, T.; O’Donnell, K.; Cervigni, G.D.; Spampinato, C.P. Metabolic profiles of soybean roots during early stages of Fusarium tucumaniae infection. J. Exp. Bot. 2015, 66, 391–402. [Google Scholar] [CrossRef] [Green Version]
  34. Laurentin, A.; Edwards, C.A. A microtiter modification of the anthrone-sulfuric acid colorimetric assay for glucose-based carbohydrates. Anal. Biochem. 2003, 315, 143–145. [Google Scholar] [CrossRef]
  35. Jing, P.; Zhao, S.-J.; Ruan, S.-Y.; Xie, Z.-H.; Dong, Y.; Yu, L.L. Anthocyanin and glucosinolate occurrences in the roots of Chinese red radish (Raphanus sativus L.), and their stability to heat and pH. Food Chem. 2012, 133, 1569–1576. [Google Scholar] [CrossRef]
  36. Aredes, R.S.; Peixoto, F.C.; Sphaier, L.A.; de Carvalho Marques, F.F. Evaluation of craft beers through the direct determination of amino acids by capillary electrophoresis and principal component analysis. Food Chem. 2021, 344, 128572. [Google Scholar] [CrossRef] [PubMed]
  37. Qiao, X.; He, Y.; Wang, Z.; Li, X.; Zhang, K.; Zeng, H. Effect of foliar spray of zinc on chloroplast β-carbonic anhydrase expression and enzyme activity in rice (Oryza sativa L.) leaves. Acta Physiol. Plant 2014, 36, 263–272. [Google Scholar] [CrossRef]
  38. Zhu, L.; Chen, Z.; Li, H.; Sun, Y.; Wang, L.; Zeng, H.; He, Y. Lipid metabolism is involved in male fertility regulation of the photoperiod-and thermo sensitive genic male sterile rice line Peiai 64S. Plant Sci. 2020, 299, 110581. [Google Scholar] [CrossRef]
  39. He, W.; Zeng, M.; Chen, J.; Jiao, Y.; Niu, F.; Tao, G.; Zhang, S.; Qin, F.; He, Z. Identification and quantitation of anthocyanins in purple-fleshed sweet potatoes cultivated in China by UPLC-PDA and UPLC-QTOF-MS/MS. J. Agric. Food Chem. 2016, 64, 171–177. [Google Scholar] [CrossRef]
  40. Li, J.; Li, X.-d.; Zhang, Y.; Zheng, Z.-d.; Qu, Z.-y.; Liu, M.; Zhu, S.-h.; Liu, S.; Wang, M.; Qu, L. Identification and thermal stability of purple-fleshed sweet potato anthocyanins in aqueous solutions with various pH values and fruit juices. Food Chem. 2013, 136, 1429–1434. [Google Scholar] [CrossRef]
  41. Tanner, G.J.; Francki, K.T.; Abrahams, S.; Watson, J.M.; Larkin, P.J.; Ashton, A.R. Proanthocyanidin biosynthesis in plants: Purification of legume leucoanthocyanidin reductase and molecular cloning of its cDNA. J. Biol. Chem. 2003, 278, 31647–31656. [Google Scholar] [CrossRef] [Green Version]
  42. Gommers, C.M.; Visser, E.J.; St Onge, K.R.; Voesenek, L.A.; Pierik, R. Shade tolerance: When growing tall is not an option. Trends Plant Sci. 2013, 18, 65–71. [Google Scholar] [CrossRef] [PubMed]
  43. Gong, W.; Jiang, C.; Wu, Y.; Chen, H.; Liu, W.; Yang, W. Tolerance vs. avoidance: Two strategies of soybean (Glycine max) seedlings in response to shade in intercropping. Photosynthetica 2015, 53, 259–268. [Google Scholar] [CrossRef]
  44. Yang, F.; Liao, D.; Wu, X.; Gao, R.; Fan, Y.; Raza, M.A.; Wang, X.; Yong, T.; Liu, W.; Liu, J. Effect of aboveground and belowground interactions on the intercrop yields in maize-soybean relay intercropping systems. Field Crop. Res. 2017, 203, 16–23. [Google Scholar] [CrossRef]
  45. Shafiq, I.; Hussain, S.; Raza, M.A.; Iqbal, N.; Asghar, M.A.; Ali, R.; Fan, Y.-f.; Mumtaz, M.; Shoaib, M.; Ansar, M. Crop photosynthetic response to light quality and light intensity. J. Integr. Agric. 2021, 20, 4–23. [Google Scholar] [CrossRef]
  46. Wu, Y.; Gong, W.; Yang, W. Shade inhibits leaf size by controlling cell proliferation and enlargement in soybean. Sci. Rep. 2017, 7, 9295. [Google Scholar] [CrossRef]
  47. Song, D.; Tariq, A.; Pan, K.; Khan, S.U.; Saleh, T.A.; Gong, S.; Zhang, A.; Wu, X. Influence of planting distance and density on the yield and photosynthetic traits of sweet potato (Ipomoea balatas L.) under an intercropping system with walnut (Juglans regia) saplings. Soil Tillage Res. 2020, 196, 104484. [Google Scholar] [CrossRef]
  48. Fogelman, E.; Tanami, S.; Ginzberg, I. Anthocyanin synthesis in native and wound periderms of potato. Physiol. Plant. 2015, 153, 616–626. [Google Scholar] [CrossRef] [PubMed]
  49. Loreti, E.; Povero, G.; Novi, G.; Solfanelli, C.; Alpi, A.; Perata, P. Gibberellins, jasmonate and abscisic acid modulate the sucrose-induced expression of anthocyanin biosynthetic genes in Arabidopsis. New Phytol. 2008, 179, 1004–1016. [Google Scholar] [CrossRef]
  50. Wingler, A. Transitioning to the next phase: The role of sugar signaling throughout the plant life cycle. Plant Physiol. 2018, 176, 1075–1084. [Google Scholar] [CrossRef] [Green Version]
  51. Cominelli, E.; Gusmaroli, G.; Allegra, D.; Galbiati, M.; Wade, H.K.; Jenkins, G.I.; Tonelli, C. Expression analysis of anthocyanin regulatory genes in response to different light qualities in Arabidopsis thaliana. J. Plant Physiol. 2008, 165, 886–894. [Google Scholar] [CrossRef] [PubMed]
  52. Hong, Y.; Tang, X.; Huang, H.; Zhang, Y.; Dai, S. Transcriptomic analyses reveal species-specific light-induced anthocyanin biosynthesis in chrysanthemum. BMC Genom. 2015, 16, 1–18. [Google Scholar] [CrossRef] [PubMed] [Green Version]
  53. Lv, F.; Liu, J.; Ma, Y.; Chen, J.; Keyoumu· Abudurezikekey, A.; Wang, Y.; Chen, B.; Meng, Y.; Zhou, Z. Effect of shading on cotton yield and quality on different fruiting branches. Crop Sci. 2013, 53, 2670–2678. [Google Scholar] [CrossRef]
  54. Solfanelli, C.; Poggi, A.; Loreti, E.; Alpi, A.; Perata, P. Sucrose-specific induction of the anthocyanin biosynthetic pathway in Arabidopsis. Plant Physiol. 2006, 140, 637–646. [Google Scholar] [CrossRef] [PubMed] [Green Version]
  55. Yang, C.; Iqbal, N.; Hu, B.; Zhang, Q.; Wu, H.; Liu, X.; Zhang, J.; Liu, W.; Yang, W.; Liu, J. Targeted metabonomics analysis of fatty acid in soybean seed by GC-MS reveal the metabolic manipulation of shading in intercropping system. Anal. Methods 2017, 3, 1–27. [Google Scholar]
  56. Feng, L.; Raza, M.A.; Li, Z.; Chen, Y.; Khalid, M.H.B.; Du, J.; Liu, W.; Wu, X.; Song, C.; Yu, L.; et al. The influence of light intensity and leaf movement on photosynthesis characteristics and carbon balance of soybean. Front. Plant Sci. 2019, 9, 1952. [Google Scholar] [CrossRef] [PubMed]
  57. Wu, T.; Zou, R.; Pu, D.; Lan, Z.; Zhao, B. Non-targeted and targeted metabolomics profiling of tea plants (Camellia sinensis) in response to its intercropping with Chinese chestnut. BMC Plant Biol. 2021, 21, 55. [Google Scholar] [CrossRef]
  58. Wu, Y.; Shi, L.; Li, L.; Fu, L.; Liu, Y.; Xiong, Y.; Sheen, J. Integration of nutrient, energy, light, and hormone signalling via TOR in plants. J. Exp. Bot. 2019, 70, 2227–2238. [Google Scholar] [CrossRef]
  59. Liu, L.; Li, Y.; She, G.; Zhang, X.; Jordan, B.; Chen, Q.; Zhao, J.; Wan, X. Metabolite profiling and transcriptomic analyses reveal an essential role of UVR8-mediated signal transduction pathway in regulating flavonoid biosynthesis in tea plants (Camellia sinensis) in response to shading. BMC Plant Biol. 2018, 18, 233. [Google Scholar] [CrossRef]
  60. Lloyd, J.C.; Zakhleniuk, O.V. Responses of primary and secondary metabolism to sugar accumulation revealed by microarray expression analysis of the Arabidopsis mutant, pho3. J. Exp. Bot. 2004, 55, 1221–1230. [Google Scholar] [CrossRef]
  61. Fernie, A.R.; Bachem, C.W.; Helariutta, Y.; Neuhaus, H.E.; Prat, S.; Ruan, Y.-L.; Stitt, M.; Sweetlove, L.J.; Tegeder, M.; Wahl, V. Synchronization of developmental, molecular and metabolic aspects of source–sink interactions. Nat. Plants 2020, 6, 55–66. [Google Scholar] [CrossRef] [PubMed]
  62. Wingler, A.; Delatte, T.L.; O’Hara, L.E.; Primavesi, L.F.; Jhurreea, D.; Paul, M.J.; Schluepmann, H. Trehalose 6-phosphate is required for the onset of leaf senescence associated with high carbon availability. Plant Physiol. 2012, 158, 1241–1251. [Google Scholar] [CrossRef] [PubMed] [Green Version]
  63. Yoshida, T.; Obata, T.; Feil, R.; Lunn, J.E.; Fujita, Y.; Yamaguchi-Shinozaki, K.; Fernie, A.R. The role of abscisic acid signaling in maintaining the metabolic balance required for Arabidopsis growth under nonstress conditions. Plant Cell 2019, 31, 84–105. [Google Scholar] [CrossRef] [PubMed] [Green Version]
Figure 1. Comparison of pigment characteristics of purple-fleshed and yellow-fleshed sweet potato under shaded conditions. (A) Growth conditions of SP under nonshaded conditions and under 60% shading treatment. Anthocyanin contents in developing storage roots of purple-fleshed SP (B) and yellow-fleshed SP (C) under shading treatment at 60–130 DAP. The AC contents of SP storage roots under 60%-shading and non-shading treatments are marked with green-background or blue-border bars, respectively. Data represent the mean ± SD from three individual plants with main storage roots mixed per plant (three independent biological replicates, n = 3). The asterisks represent significant differences (*, p < 0.05; **, p < 0.01). Sweet potato, SP; anthocyanin, AC; days after planting, DAP.
Agronomy 11 00737 g001
Figure 2. The contents of soluble sugar and starch in sweet potato during storage root development under shaded conditions. The contents of soluble sugar (A) and starch (B) from SP different tissues under 60% shading and non-shading treatment at 60–130 DAP. Data represent the mean ± s.d. (n = 3, three individual biological samples). The asterisks represent significant differences between those data under 60% shading and non-shading treatment by Student’s t-test at p < 0.05 (*) and p < 0.01 (**), respectively. Days after planting, DAP; sweet potato, SP.
Agronomy 11 00737 g002
Figure 3. Main KEGG pathways related to differential metabolites of PSP storage roots between the 60% shading and nonshaded treatments. Kyoto encyclopedia of genes and genomes, KEGG; purple-fleshed sweet potato, PSP.
Agronomy 11 00737 g003
Figure 4. Differential metabolite profiles of purple-fleshed sweet potato storage roots under 60% shading treatment presented in a matrix format. In the matrix, each row represents an individual metabolite. Columns of differential metabolites from purple-fleshed sweet potato storage roots (n = 6, six individual biological samples) represented under 60% shading treatment (1PSP-3, -4, -5, -6, -7 and -8) and nonshaded conditions (0PSP-1, -2, -3, -4, -7 and -8). Red and green reflect relatively upregulated and downregulated metabolites under shading, respectively. Purple-fleshed sweet potato, PSP.
Agronomy 11 00737 g004
Figure 5. The contents of amino acids in developing storage roots of purple-fleshed sweet potato under shaded conditions. Data represent the mean ± SD from three individual plants (three biological replicates, n = 3) with more than two storage roots mixed per plant. The asterisks represent significant differences revealed by Student’s t-test at p < 0.05 (*) and p < 0.01 (**), respectively. The columns of amino acid contents from PSP storage roots under 60% shading treatment (60%) are represented by a black background and those under the nonshaded condition (CK) are represented by a grey background.
Agronomy 11 00737 g005
Figure 6. ELISA analysis of the activities of three key enzymes, CHS, ANS and GT, of the flavonoid pathway in PSP storage roots of 60 DAP, 80 DAP and 100 DAP under shaded conditions. Data represent the mean ± SD of three individual plants (n = 3) with main storage roots mixed in each plant. The asterisks represent significant differences by Student’s t-test at p < 0.01 (**), respectively. The columns of enzyme activities from PSP storage roots under 60% shading treatment are shown with green filling and those under nonshaded conditions are shown with yellow filling. chalcone synthase, CHS; anthocyanidin synthase, ANS; glycosyltransferase, GT; purple-fleshed sweet potato, PSP.
Agronomy 11 00737 g006
Figure 7. Protein expression analysis of three key enzymes in the flavonoid pathway, CHS, ANS and 3GT, from PSP. (A) western blotting results of CHS, ANS and 3GT in leaves and storage roots at 60–130 DAP. (B) Protein expression analysis of three key enzymes between the 60% shading treatment and the control. Data represent the mean ± SD of two individual plants (n = 2) with tissue-mixed samples of functional leaves or storage roots per plant. The asterisks represent significant differences by Student’s t-test (**, p < 0.01). The columns of relative protein expression from PSP storage roots under 60% shading treatment are shown with green filling and those under nonshaded conditions are shown with yellow filling. chalcone synthase, CHS; anthocyanidin synthase, ANS; UDP glucose flavonoid 3-O-glycosyltransferase, 3GT; purple-fleshed sweet potato, PSP.
Agronomy 11 00737 g007
Figure 8. Gene expression analysis of three key enzymes in the storage root flavonoid pathway from PSP. Data represent the mean ± SD of three individual plants (n = 3) with root-mixed samples per plant. The asterisks represent significant differences (*, p < 0.05; **, p < 0.01). chalcone synthase, CHS; anthocyanidin synthase, ANS; UDP glucose flavonoid 3-O-glycosyltransferase, 3GT; purple-fleshed sweet potato, PSP.
Agronomy 11 00737 g008
Figure 9. Metabolism was altered in the storage roots of PSP under shading. Numbers proceeded by an upward or downward arrow indicate positive (in red) or negative (in blue) abundance ratios of the metabolites. Differential amino acid contents in the developing storage roots are presented in a matrix format. Numbers in red and blue indicate positive and negative abundance ratios of the amino acids under shading, respectively. Purple-fleshed sweet potato, PSP.
Agronomy 11 00737 g009
Table 1. Analysis of PSP storage root yield and anthocyanin contents under shading.
GroupStorage Root
FW
(g)
Storage
Root
Num.
Outputs
Per Plant
(kg)
Anthocyanin
Content
Per Plant
(mg)
Storage Root
Yield
(t/hm2)
Anthocyanin
Outputs
(g/hm2)
Non shading82.63 ± 3.077.00.58 ± 0.0673.95 ± 7.6547.226020.19
30% shading82.14 ± 6.575.20.43 ± 0.03 **93.01 ± 6.49 **34.877541.86
60% shading75.05 ± 9.53 *4.60.35 ± 0.10 **91.70 ± 26.21 *28.187383.69
Storage Root FW: average weight of single sweet potato root (g); Storage Root Num.: average number of storage roots of single plant; The data of storage root yield and anthocyanin outputs have been obtained according to potted plant data determined. Data of storage root FW and outputs per plant are shown as means ± SD from 60 individual plants with more than two storage roots per plant (n = 120) in each group during 2017–2019. Data of anthocyanin content per plant are shown as means ± SD from nine individual plants with main storage roots mixed per plant (nine biological replicates, n = 9). The asterisk represents a significant difference compared to non-shading group (*, p < 0.05; **, p < 0.01). PSP, purple-fleshed sweet potato.
Table 2. Partial differential metabolites storage root of PSP with the fold change under shading.
Differential
Metabolites
VIP 2FC 3Differential
Metabolites
VIP 2FC 3Differential
Metabolites
VIP 2FC 3
Carbohydrates and
carbohydrate conjugates 1
Carbohydrates and
carbohydrate conjugates 1
Amino acids, peptides and
analogues 1
L-Threose1.370.25P-benzoquinone1.140.77β-Alanine1.210.20
Glycerol1.511.00Allo-inositol/0.47Valine1.601.73
D-Glyceric acid1.310.86Myo-inositol/0.57D-alanyl-D-alanine1.280.76
Lyxose1.540.13Quinic acid/1.16Norleucine1.221.35
Dihydroxyacetone1.490.43Shikimic acid/0.47L-Isoleucine1.470.92
Erythrose1.660.07Chlorogenic acid/2.29Glycine1.212.07
Threitol/0.18 Serine1.492.32
Threonic acid/0.12Organic acids and derivatives 13-Cyanoalanine1.381.16
Glucose-1-phosphate/0.70Urea1.631.15Threonine1.411.17
Tartaric acid/0.00Aconitic acid/0.20Gly-Pro1.292.57
Sorbitol/0.07Citric acid/0.35L-dopa1.151.69
Ribose/0.68Isocitric acid/0.28Glycocyamine1.110.43
Xylose/0.432-Ketobutyric acid1.040.97L-Allothreonine1.360.25
Galactinol/0.822-Ketovaleric acid1.011.06N-Acetyl-L-phenylalanine1.110.33
Xylitol/0.67α-Ketoisocaproic acid1.410.00Methionine1.561.33
Sedoheptulose/0.66Methyl phosphate1.560.81Oxoproline1.251.20
D-Arabitol/0.45O-Phosphorylethanolamine/3.51Aspartic acid1.297.30
Fucose/0.81Galactonic acid/0.293-hydroxy-L-proline/0.52
Gluconic acid/0.30α-Ketoglutaric acid/0.564-aminobutyric acid/1.51
Mucic acid/0.26Oxalic acid1.592.44L-glutamic acid/1.02
Saccharic acid/0.37Succinic acid1.250.23Ornithine/11.10
1-Kestose/0.44Fumaric acid1.330.23Glutamic acid/1.86
1,5-Anhydroglucitol/1.20Malonic acid/15.82Phenylalanine/18.64
Tagatose/0.32Methylmalonic acid/0.00Sarcosine/3.41
Glucuronic acid/0.36β-Hydroxypyruvate1.230.99N-Carbamylglutamate/1.05
Mannitol/1.013-Hydroxypropionic acid1.240.40Asparagine/1.97
Glucose-6-phosphate/1.30L-Malic acid1.580.26α-Aminoadipic acid/2.86
Digalacturonic acid/1.89Pyruvic acid1.510.47Tyrosine/0.94
D-Fructose 1,6-bisphosphate/1.16Lactic acid1.610.12Glutamine/0.80
Maltotriose/0.58Glycolic acid1.430.69Citrulline/33.91
Arbutin/177,050.00 Allantoic acid/0.81
Sucrose/0.74Amino acids, peptides, and analogues 1N-Methyl-L-glutamic acid/12.62
Isomaltose/0.463-Aminoisobutyric acid1.380.30Lysine/3.98
Maltose/0.77Nicotinoylglycine1.380.64Iminodiacetic acid/3.45
Ribitol/0.15Alanine1.000.83Kyotorphin/0.86
Melezitose/5.40N-Ethylglycine1.570.67
Trehalose/2.47Proline1.371.19
Gluconic lactone/4.80Pipecolinic acid1.420.58
1 Classification of differential metabolites according to Supplement Figure 2, that is carbohydrates and carbohydrate conjugates, organic acids and derivatives, amino acids, peptides, and analogues. 2 The differential metabolites were analyzed on the basis of the combination of a statistically significant threshold of variable influence on variable importance in the projection (VIP > 1.0) obtained from the OPLS-DA model (Figure A1) and p values (p < 0.05) from a two-tailed Student’s t test on the normalized peak areas (n = 8, eight individual biological samples). 3 FC: fold change. PSP, purple-fleshed sweet potato.
Publisher’s Note: MDPI stays neutral with regard to jurisdictional claims in published maps and institutional affiliations.

