Article

Phytoavailability of Cd, Cr, Cu, Hg, Mn, Mo, Ni, Pb, Tl and Zn in Arable Crop Systems Amended for 13 to 15 Years with Organic Waste Products

by
Aurélia Marcelline Michaud
1,2,*,
Valérie Sappin-Didier
3,
Philippe Cambier
1,
Christophe Nguyen
3,
Noémie Janot
3,
Denis Montenach
4,
Lana Filipovic
5,
Valentin Deltreil
6 and
Sabine Houot
1
1
INRAE, ECOSYS, AgroParisTech, Université Paris-Saclay, 78850 Thiverval-Grignon, France
2
INRAE, SAS, AgroCampusOuest, 35042 Rennes CEDEX, France
3
INRAE, ISPA, Bordeaux Sciences Agro, 33140 Villenave d’Ornon, France
4
INRAE, SEAV, 68000 Colmar, France
5
Faculty of Agriculture, University of Zagreb, 10000 Zagreb, Croatia
6
Veolia Recherche & Innovation, 78603 Maisons-Laffitte, France
*
Author to whom correspondence should be addressed.
Agronomy 2021, 11(4), 664; https://doi.org/10.3390/agronomy11040664
Submission received: 16 February 2021 / Revised: 25 March 2021 / Accepted: 29 March 2021 / Published: 31 March 2021

Abstract

:
Repeated applications of organic waste products (OWP) are a source of trace elements (TE) inputs to agricultural topsoils. The present study aimed at (i) assessing the effects of repeated OWP inputs on the chemical properties of topsoils in two long-term field experiments (13 and 15 years; calcareous and non-calcareous soils), (ii) evaluating TE phytoavailability and their transfer to grain (winter wheat and maize) and (iii) identifying the underlying factors causing alterations of TE phytoavailability. In both field experiments, receiving compliant or slightly high doses of OWP in compliance with regulations, OWP and soil physicochemical properties and TE concentrations in soils and grains were determined. In situ phytoavailability of TE was assessed at two juvenile crop growth stages by analyzing TE concentrations in shoot plantlets. Depending on the OWP input amount, results showed that compared to the soil receiving no organic amendment, repeated OWP inputs significantly increased soil organic carbon content, pH, cation exchange capacity, total soil Cu, Mo and Zn concentration and the phytoavailability of Mo, while the phytoavailability of Cd, Mn, Ni and Tl was significantly reduced. No notable effect was observed for Cr, Cu, Hg, Pb and Zn phytoavailability. Statistical approaches suggested that due to the repeated OWP applications, increased soil organic carbon content and pH, were likely responsible for decreased TE phytoavailability (e.g., Cd).

1. Introduction

In the perspective of circular economy, the recycling of residual organic matter and nutrients should be generalized [1]. In this context, beneficial agricultural use of organic waste products (OWPs) rich in organic matter and nutrients is a favorable alternative to their landfilling or incineration. In fact, since 2000–2010s composting and anaerobic digestion are established processes for waste management in Europe, and field application of OWP such as composts became a common practice worldwide [1,2,3]. These organic products are commonly used in order to improve soil fertility, to minimize the dependency on inorganic fertilization and avoid elevated carbon footprint [4,5].
Depending on the origin of the raw materials, OWP may contain variable quantities of organic contaminants, biological pathogens and toxic metal residues, especially sewage sludge and municipal solid waste compost. Agricultural recycling of OWP in such cases may lead to negative impacts on soil health, crop safety and on the environment [2,3,5,6,7]. In the past, land-applied OWP (e.g., sewage sludge) contained much higher concentrations of metals (Cd, Zn, Cu and Zn) leading sometimes to excessive soil concentration [6,7,8]. Since the 1990s–2000s, implementation of environmental regulations resulted in a general quality improvement of the OWP produced and applied [9,10,11]. Nevertheless, if inputs exceed outputs by harvest and leaching, repeated application of OWP can result in slow accumulation of trace elements (TEs) in soils because TE are persistent in the environment and a large fraction of them, once applied, remains in the topsoil [6,7,8,12,13]. A number of TEs in OWP are essential plant nutrients, such as B, Cu, Mn, Mo and Zn. However, if their concentrations in soils are high, they can impair the proper functioning of the soil by becoming phytotoxic or toxic to the soil micro-flora and to the soil macro- and micro-fauna. The majority of concern refers to Cd, Hg, Pb and the metalloid As, with no known biological role [6,14,15,16]. Additionally, Cd is of particular concern due to its high toxicity, long body retention time, high mobility in the environment and risks of high dietary intake through crop contamination, especially cereals [17,18,19,20].
Generally, TEs in soils have to be mobile or environmentally available before becoming bioavailable to plants and other soil organisms. The bioavailable fraction refers to the fraction (or pool) that can be taken up by an organism, e.g., phytoavailable fraction if the organisms are plants [21,22,23]. Soil type and soil physicochemical properties control physical, chemical and biological processes that modulate TE mobility in soils, and thus their bioavailability. Among these properties, soil pH is considered as one of the main variables controlling the TE behavior [21,24]. Soil organic matter (OM), cation exchange capacity (CEC), clay and Fe/Mn hydroxides are also considered as important soil factors governing TE mobility/availability, and the TE chemical speciation in soil and soil-solution [17,21,24,25,26,27]. These properties can be altered by OWP application, especially OM content, CEC and pH [5,26]. A number of studies have examined the role of OWP, especially sewage sludge, as a source of TE contamination of soil, but only limited works reported the beneficial effect of organic amendments as a way for reducing TE mobility in soils [22]. These studies focused mostly on contaminated soils [28,29], but rarely on uncontaminated agricultural soils at the field scale [12,30].
Long-term experiments can give a realistic overview of the effects of OWP recycling in agriculture [2,6]. The first long-term trials devoted to the study of OWP recycling in agriculture started in 1840–1850s in England with the Rothamsted experiment and in the 1970s in France with Couhins experiments [8,31]. These trials mainly studied amendments with high concentrations of toxic TE, or massive amendments inputs into the soil, which does not reflect current agronomic practices. Since then, numerous field experiments focusing on the evaluation of OWP application effects have been carried out in short-term studies [32,33], mainly focusing on nitrogen fertilization [34]. Among OWP studied in respect to TE dynamics, sewage sludge (composted or not), manures and municipal solid waste compost were investigated in both short- and long-term field experiments [30,35,36,37,38,39,40,41,42,43,44]. Much less research considered urban OWP, including composts in mid- and long-term experiments [45,46,47]. Recently, new field studies focused on the OWP effects on the fate of TE considered in regulations can be found [12,13,48,49,50]. To our knowledge, none of the previous studies provided in situ TE phytoavailability at the field scale for a wide range of TE (i.e., under regulation or not) or evaluated underlying soil factors affecting the TE phytoavailability after long-term applications of OWP at commonly applied levels. Moreover, long-term field experiments provide the opportunity to step back from collected data in order to provide new observations relative to the TE dynamics and fate after repeated inputs of OWP, which was the scope of the present study.
The present study aimed at (i) assessing the evolution of some topsoil chemical properties after repeated inputs of OWP in two long-term field experiments (13 and 15 years), (ii) evaluating the resulting changes of TE phytoavailability and transfer to grain, and (iii) identifying the underlying factors of OWP application controlling the TE phytoavailability. The TEs studied are the elements taken into account in the regulations (Cd, Cr, Cu, Ni, Pb, Zn and Hg) [9,10,11], and Mn, Mo and Tl. Phytoavailability was assessed by measuring TE concentrations in shoot plantlets. The first working hypothesis was that repeated inputs of various OWP would alter soil properties depending on initial soil type (calcareous and non-calcareous), and on the amounts and types of applied OWP. The second hypothesis was that phytoavailability of TE would be modulated as a function of initial soil type, quantity and type of OWP applied, with soil pH as one of the main soil-governing variable. To meet our objectives, we used two experimental trials, with different soil geochemical characteristics (a silt loam Luvisol soil and a silt–silt clayey Calcisol soil).

2. Materials and Methods

The two field experiments, QualiAgro and PROspective, were set up in 1998 and 2000, respectively, to investigate the long-term effects of repeated applications of various OWP on soil fertility and potential contamination with inorganic and organic contaminants. For the same type of OWP (e.g., manure), the products and their origin were different in the two field experiments. All treatments and plots received similar pesticide treatments and cropping practices at both sites.

2.1. QualiAgro Field Experiment

The complete experimental description of QualiAgro is available in [13,46]. Briefly, it is located within the Plateau des Alluets (Yvelines, France), on a silt loam Luvisol, according to IUSS-FAO classification and USDA texture triangle, developed on aeolian loess. The upper horizon includes a plough layer (i.e., topsoil), which is decarbonated, the carbonated silt loess appearing below 1.4–1.6 m depth. From 1999 to 2013, the 6-ha field experiment has been cropped with a biennial rotation of maize and winter wheat. The climate is oceanic, with mean annual precipitation of 572 mm and a mean annual temperature of 11 °C. The experiment could be considered as representative of non-calcareous cultivated soils of the central Paris Basin and of extended agricultural areas of NW Europe.
Figure 1 presents the experimental plan of the QualiAgro field experiment, with the distribution of the 20 plots of 45 m × 10 m in 4 blocks of replicates, with the following 5 treatments randomly distributed within each block:
  • Co-compost of sewage sludge with green wastes and wood chips (Q-GWS),
  • Co-compost of the home-sorted fermentable fraction of municipal solid waste and green waste, also called biowaste compost (Q-BIOW),
  • Compost of residual municipal solid waste (Q-MSW),
  • Farmyard manure from a dairy farm (Q-FYM),
  • No organic amendment (control, or Q-CN).
In 1998–2013, additional mineral nitrogen (N) fertilization was applied at doses between 0 and 170 kg N ha−1, depending on mineral N stocks measured in plots down to 90 cm at the end of winter before fertilization [4]. No mineral fertilization of potassium (K) and phosphorus (P) was applied.
Each OWP was applied on soil with remaining wheat stubbles every 2 years in September, at doses equivalent to 4 t organic C. ha−1. This corresponded to average doses of 18.0 (Q-MSW), 26.3 (Q-GWS), 28.0 (Q-BIOW) and 35.4 (Q-FYM) tons of fresh matter per hectare, i.e., about 1.5–3 fold larger than usual practices (average recommended amounts: 20–30 t ha−1 per 3 years for farmyard manure and 10–20 t ha−1 per 3 years for composts) [13]. Large amounts of OWP have thus been applied in QualiAgro in order to maximize OWP effects on soil organic carbon (OC) increase.

2.2. PROspective Field Experiment

The PROspective site is located in Colmar (Haut-Rhin, France), on a silt–silt clayey Calcisol soil, according to IUSS-FAO classification and USDA texture triangle. The upper horizon includes a plough layer (i.e., topsoil), which is carbonated. From 2000 to 2013, the 2-ha field experiment has been cropped with a rotation of maize, winter wheat, sugar beet and barley. The climate is continental, with mean annual precipitation of 540 mm and a mean annual temperature of 10 °C. The experiment could be considered as representative of calcareous cultivated soils of the central Colmar-Strasbourg Basin and of extended agricultural areas of NW Europe.
Figure 2 presents the experimental plan of the PROspective field experiment, with the distribution of the 24 plots of 10 m × 9 m in 4 blocks of replicates, with the following 6 treatments randomly distributed within each block:
  • Sewage sludge (P-SLU),
  • Co-compost of sewage sludge with green wastes and wood chips (P-GWS),
  • Co-compost of the home-sorted fermentable fraction of municipal solid waste and green waste, also called biowaste compost (P-BIOW),
  • Farmyard manure from a dairy farm (P-FYM),
  • Compost of farmyard manure (P-CFYM),
  • No organic amendment (control, or P-CN).
In 2000–2013, on all plots additional mineral N fertilization was applied at doses between 0 and 170 kg N ha−1, depending on mineral N stocks measured in plots down to 90 cm, at the end of winter before fertilization. No mineral fertilization of K occurred and P fertilization occurred occasionally.
Each OWP application was made before maize or sugar beat every 2 years in February, at doses equivalent to 170 kg N ha−1. This corresponded to average doses of 14.2 (P-GWS), 14.5 (P-BIOW), 15.0 (P-SLU), 32.5 (P-CFYM) and 35.5 (P-FYM) tons of fresh matter per hectare, i.e., amounts representative of agricultural practices for urban OWP.

2.3. Field Monitoring for OWP and Soils

Between 1998 and 2013, in QualiAgro and PROspective, a total of 8 and 7 OWP spreading were carried out, respectively (Supplementary Materials Figures S1 and S2). All OWPs were sampled at the time of application for analysis of their composition.
Soils were sampled before each OWP spreading. Each plot was sampled in the topsoil layer between 0 and 25 cm depth (10 spadesful further pooled). After air drying, the fine soil fraction (<2 mm) was prepared according to the standard ISO 11464 and kept for further analyses.
Soils and OWP were analyzed by the central soil-testing laboratory of INRAE (INRAE LAS Arras) according to standardized French (AFNOR) or international methods (ISO). Soil and OWP pH were measured in water using a 1:5 soil:solution ratio (NF EN 15933). Soil OC was determined by dry combustion (after carbonate removal) (NF ISO 10694), CEC was determined at soil pH by the cobaltihexamine chloride extraction (NF ISO 23470). In OWP and soil samples, total concentrations of Cd, Cr, Cu, Mn, Mo, Ni, Pb, Tl and Zn were determined in crushed samples (<250 µm) by HF–HClO4 extraction (NF X31-147). TE concentrations were measured by inductively coupled plasma atomic emission spectrometry (ICP-AES) for Cr, Cu, Ni, Mn and Zn, or inductively coupled plasma mass spectrometry (ICP-MS) for Cd, Mo, Pb and Tl. Total Hg concentration was estimated by dry combustion in crushed samples (<250 µm). Other chemical properties were determined as follows: in soils, total N content by NF ISO 13878, P was extracted by the Olsen method NF ISO 11263, and CaCO3 content by NF ISO 10693; in OWP, total N by dry combustion, OC by dry combustion, P by Olsen method and P and K by HF–HClO4 extraction.

2.4. In Situ Plant Accumulation Studies

In 2013, plantlets of winter wheat (Triticum aestivum L., variety: Caphorn) cropped at QualiAgro site and plantlets of maize (Zea mays L., variety: DKC 4012) cropped at the PROspective site were sampled to assess in situ phytoavailability by analyzing their TE concentrations in shoots. At the QualiAgro site, plantlets of wheat were harvested at the stage of 1 cm spike (end of tillering stage); in a way that plant samples were taken from 5 subplots of a double row (1 m per subplot) pooled to obtain one composite sample per plot. At the PROspective site, plantlets of maize were harvested at the stage of 4 shoots from 5 subplots of a double row (1 m per subplot), pooled to obtain one composite sample per plot. Shoots were oven-dried at 50 °C and residual humidity was estimated in subsamples. The oven-dried and crushed (<0.5 mm) shoots were digested in a microwave oven with hot concentrated HNO3/H2O2 mixture, and reference plant materials were used as quality control. Concentrations of Cd, Cr, Cu, Hg, Ni, Mn, Mo, Pb, Tl and Zn in the plantlet shoot digests were determined by ICP-MS in the CEREGE Laboratory (CIRAD CEREGE Aix Marseille University).
In 2013, just before the harvest, wheat and maize grains were sampled, respectively at QualiAgro and the PROspective site. For each harvested plot, one composite sample of grain per plot was obtained by pooling samples from subplots (i.e., for wheat 10 subplots of triple row of 0.5 m width, for maize 5 subplots of a double row of 2.5 m width) and grain yield was estimated. Wheat and maize grains analyses were carried out in the central plant-testing laboratory of INRAE (INRAE USRAVE, Paris, France) according to standardized French (AFNOR) or international procedures (ISO). Grains were oven dried at 40 °C then ground to under 0.5 mm. Grain samples were digested in a microwave oven with a sequential procedure including digestion with concentrated nitric acid, H2O2 and HF–HClO4. TE concentrations were measured by ICP-AES for Cu, Mn and Zn, or ICP-MS for Cd, Cr, Ni, Mo, Tl and Pb. Total Hg concentration was analyzed by dry combustion in crushed samples (under 0.5 mm).

2.5. Statistical Analyses

Parametric or non-parametric tests were applied after testing normality of residues and equality of variances. Tests were performed using XLSTAT® (V 2019.1, Addinsoft) as follows: Newman–Keuls parametric or Kruskal–Wallis and Dunn multiple comparison non-parametric tests were performed to identify significant differences between treatments per year for each experimental site; principal component analyses (PCA) were carried out with Spearman correlation matrixes. Stepwise multiple log-log linear regressions were performed between in situ phytoavailable fractions (i.e., TE concentrations in plantlets shoots) and soil properties (pH, OC content, TE concentration and silt and clay content). Regression was carried out for both experimental sites and considering separately each experimental site. For these calculations, data were previously log10 transformed (except for pH) and normality of residues was tested for each model calculations.

2.6. Supplementary Data

Concentrations of Ag, Al, As, B, Co, Fe, Sb, Se, Sn and two rare earth elements Ce and La, are available in Supplementary Materials (Figures S3 and S4, Tables S1–S11, for soils, OWP and plants, respectively).

3. Results and Discussion

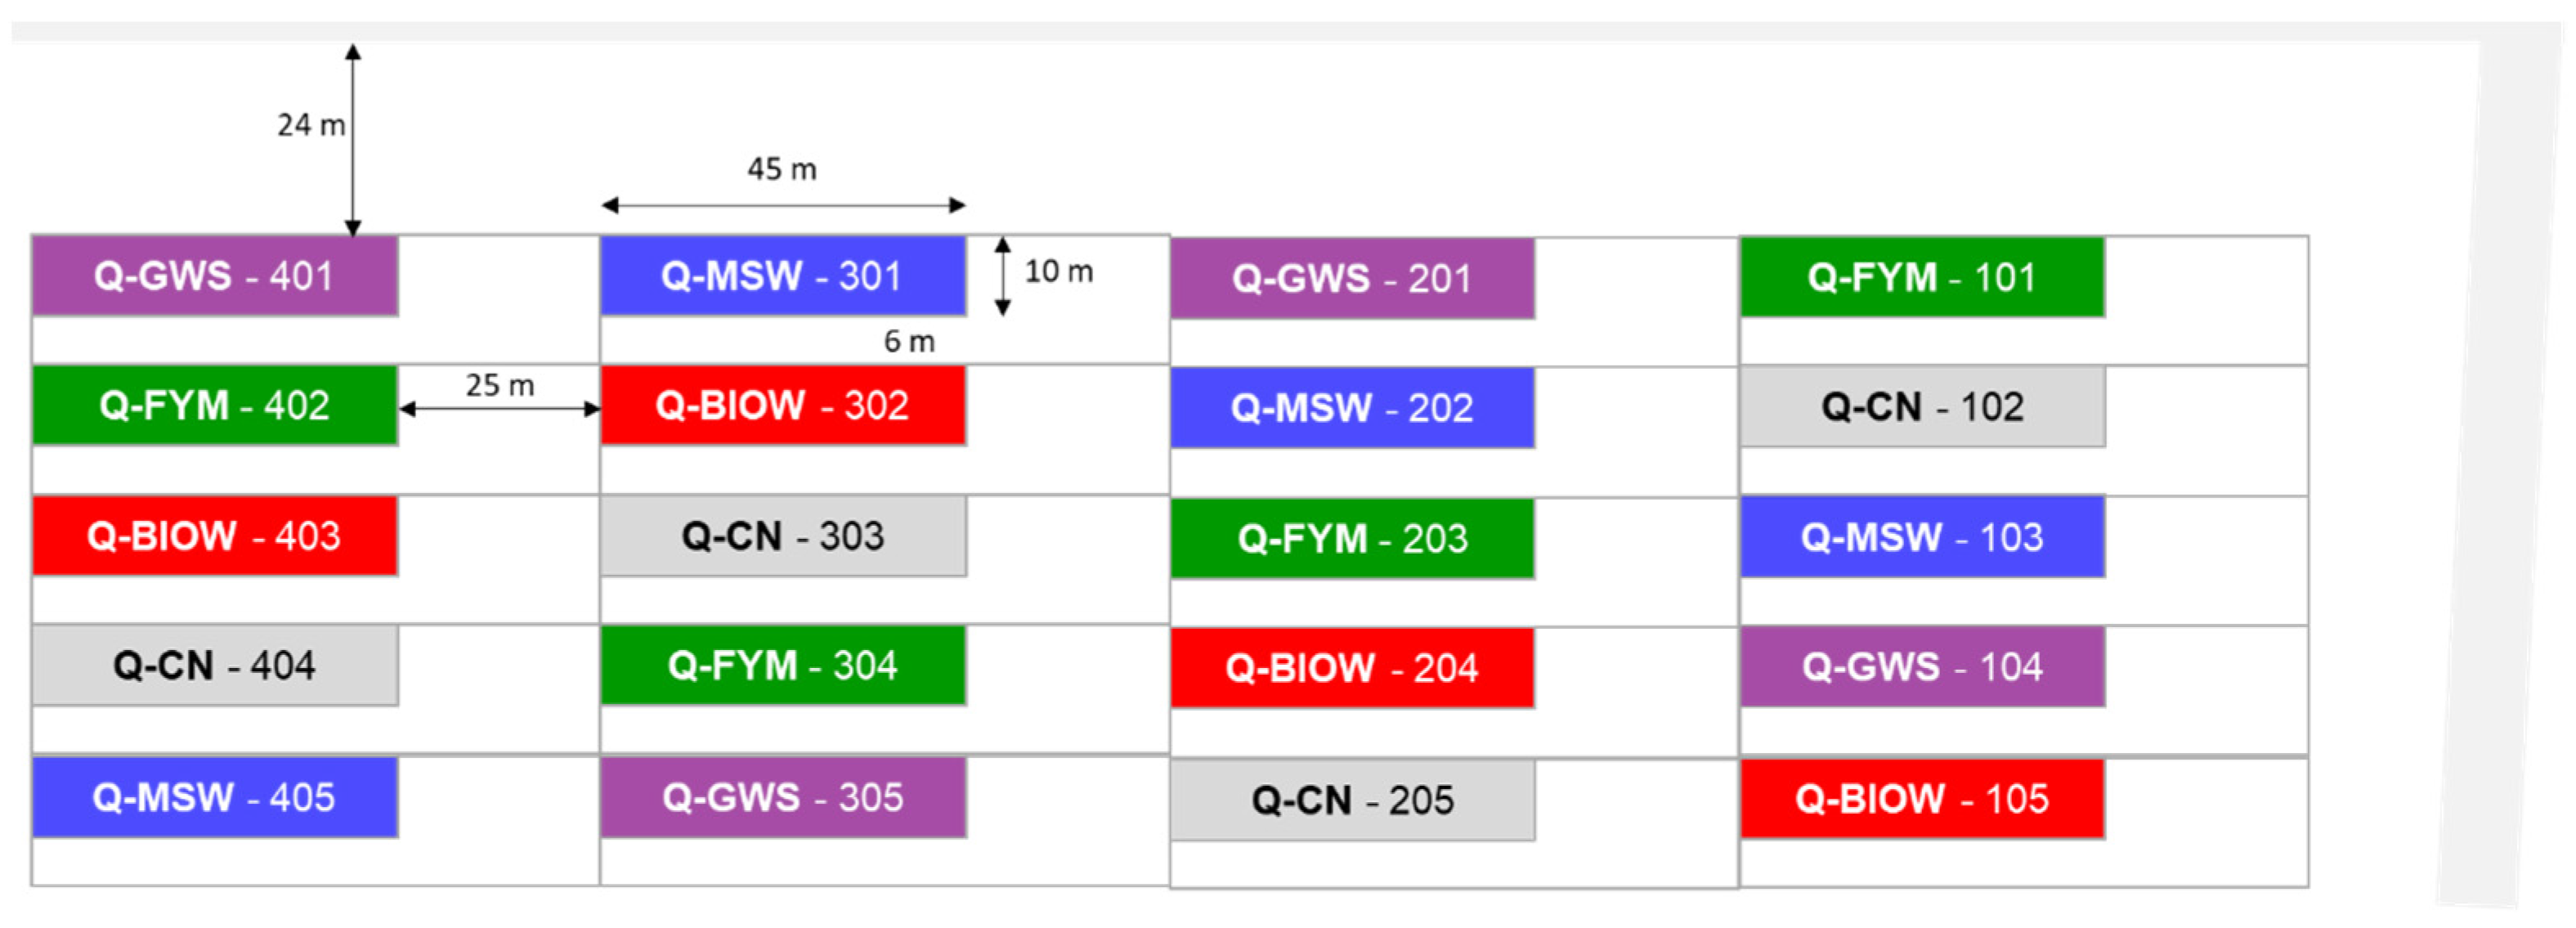
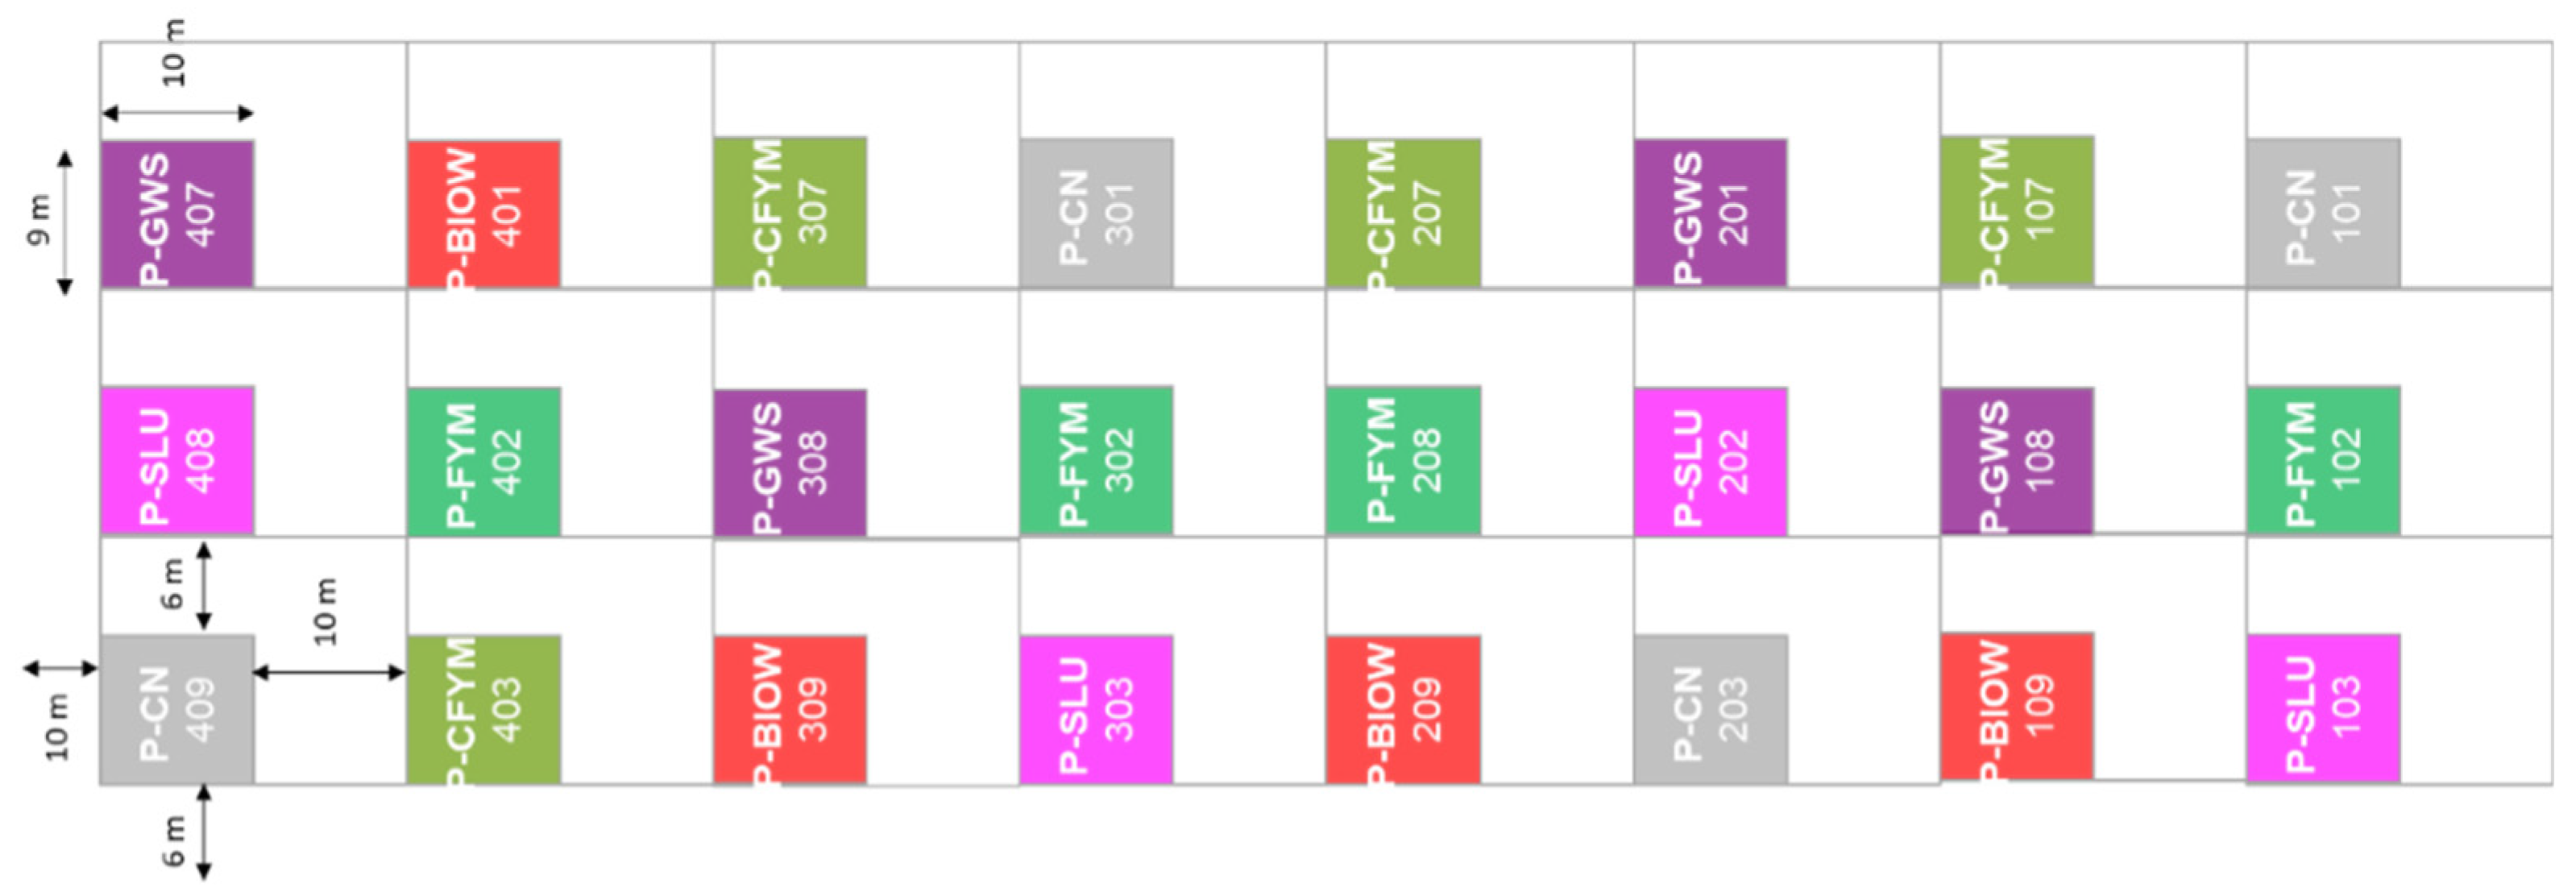
3.1. Organic Waste Products Characteristics

The nine OWP treatments applied in QualiAgro and PROspective field experiments differed in their physicochemical properties (Table 1, detailed statistics in Supplementary Materials Tables S4 and S5, Figure S3). Their characteristics are in agreement with previous studies [2], regardless of the experimental site:
  • The highest pH was found for farmyard manure (FYM), compost of farmyard manure (CFYM) and compost of biowastes (BIOW), while the lowest was found in sewage sludge (SLU), compost of green waste and sewage sludge (GWS) and compost of residual municipal solid waste (MSW).
  • The highest content of carbonates was found in BIOW, while the lowest was found in SLU and GWS.
  • The highest OC content was found in FYM, while the lowest was found in BIOW and GWS. The index of residual organic carbon (Iroc) expressing stability of OM after incorporation to soil, which was defined by Lashermes et al. [51], was found by Obriot et al. [52] to be larger for Q-GWS and Q-BIOW compared to the other OWP at the QualiAgro site.
  • The highest content of N and P was found in SLU compared to the other OWP.
Table 2 presents average concentrations of TE measured in OWP applied at both sites over the period 1998–2013 (statistics by year in Supplementary Materials Tables S6 and S7, Figure S4). During this period, GWS composts applied at QualiAgro and PROspective experimental sites had TE concentrations lower than the thresholds defined in Regulation NFU 44-095 only since 2002 (i.e., 3, 120, 300, 2, 60, 180 and 600 mg kg−1 for Cd, Cr, Cu, Hg, Ni, Pb and Zn, respectively) [10]. Even though some composts overpassed regulatory thresholds before 2006, as already stressed by Michaud et al. [13], since 2006, average concentrations of TE in BIOW and MSW were lower than the regulatory thresholds defined in Regulation NFU 44-051 [11] (Table 2). Concentrations of TE in SLU were far lower than the French spreading plan for sewage sludge [9]. The TE concentrations in OWP applied at both sites were similar to previous studies [1,2,53,54,55]. The average TE concentrations in studied OWP respected the maximal concentrations cited in recent European Regulations [56,57], except for Hg (P-SLU) and for Pb (Q-MSW and Q-FYM), with threshold values of 2, 120, 300, 1, 50, 120 and 800 mg kg−1 for Cd, Cr, Cu, Hg, Ni, Pb and Zn, respectively.
Considering the nine OWP applied in QualiAgro and PROspective field experiments, TE concentrations differed among OWPs and between sites as follows (Table 2, Supplementary Materials Tables S4–S9, Figure S3 and S4):
  • P-FYM and P-CFYM had the lowest concentrations of Cd, Cr, Cu, Hg, Mo, Ni, Pb, Tl and Zn, even when compared to Q-FYM. It can be noticed that FYM and CFYM presented also the lowest As concentration (Supplementary Materials Table S9).
  • P-SLU presented the highest concentrations of Cu, Hg, Mo, Ni and Zn.
Table 3 presents the cumulative fluxes of TE in 10 years for both experimental sites. The input flux for each TE respected French regulations at PROspective site for Cd, Cu, Hg, Ni, Pb and Zn [9,10,11], with larger inputs found for P-GWS and P-BIOW, and lower inputs related to P-FYM and P-CFYM. At the QualiAgro site, the general observation is that the TE inputs were comparable among treatments. Input fluxes were within the range of the regulatory maximum for composts, except for Zn and Cu, which exceeded the French regulation for Q-GWS, for Ni and Pb with for Q-BIOW, and for Pb with Q-MSW [10,11]. It should be noted that the amounts of OWP applied have been about 1.5- to 3-fold higher than usual practices at the QualiAgro site, which led to maximized risks related to input fluxes of TE. This was not the case at the PROspective site.

3.2. Effect of Repeated Inputs of Organic Waste Products on Soil Properties

The initial chemical properties of the topsoil layer of each experimental site sampled at the beginning of the experiment before the first application of waste products (i.e., 1998 for QualiAgro and 2000 for PROspective) is summarized in Table 4. Before the first OWP application, chemical properties were homogeneous as no significant differences were observed between the treatments plots, except for available P (i.e., Olsen P) at the PROspective site (detailed statistics in Supplementary Materials Table S1). The topsoil of the QualiAgro site was characterized by a neutral pH without carbonates, while the topsoil of the PROspective site presented an alkaline pH with carbonates. OC content and CEC in the topsoil at QualiAgro site were lower than values found in the PROspective topsoil and lower than median values found in French topsoil layers of arable crop systems [58]. Soil at QualiAgro and PROspective sites exhibited granulometry as follows: silt (QualiAgro 78.5% and PROspective 64.6%) > clay (QualiAgro 14.6% and PROspective 23.8%) > sand (QualiAgro 6.9% and PROspective 9.4%) (Supplementary Materials Table S2).
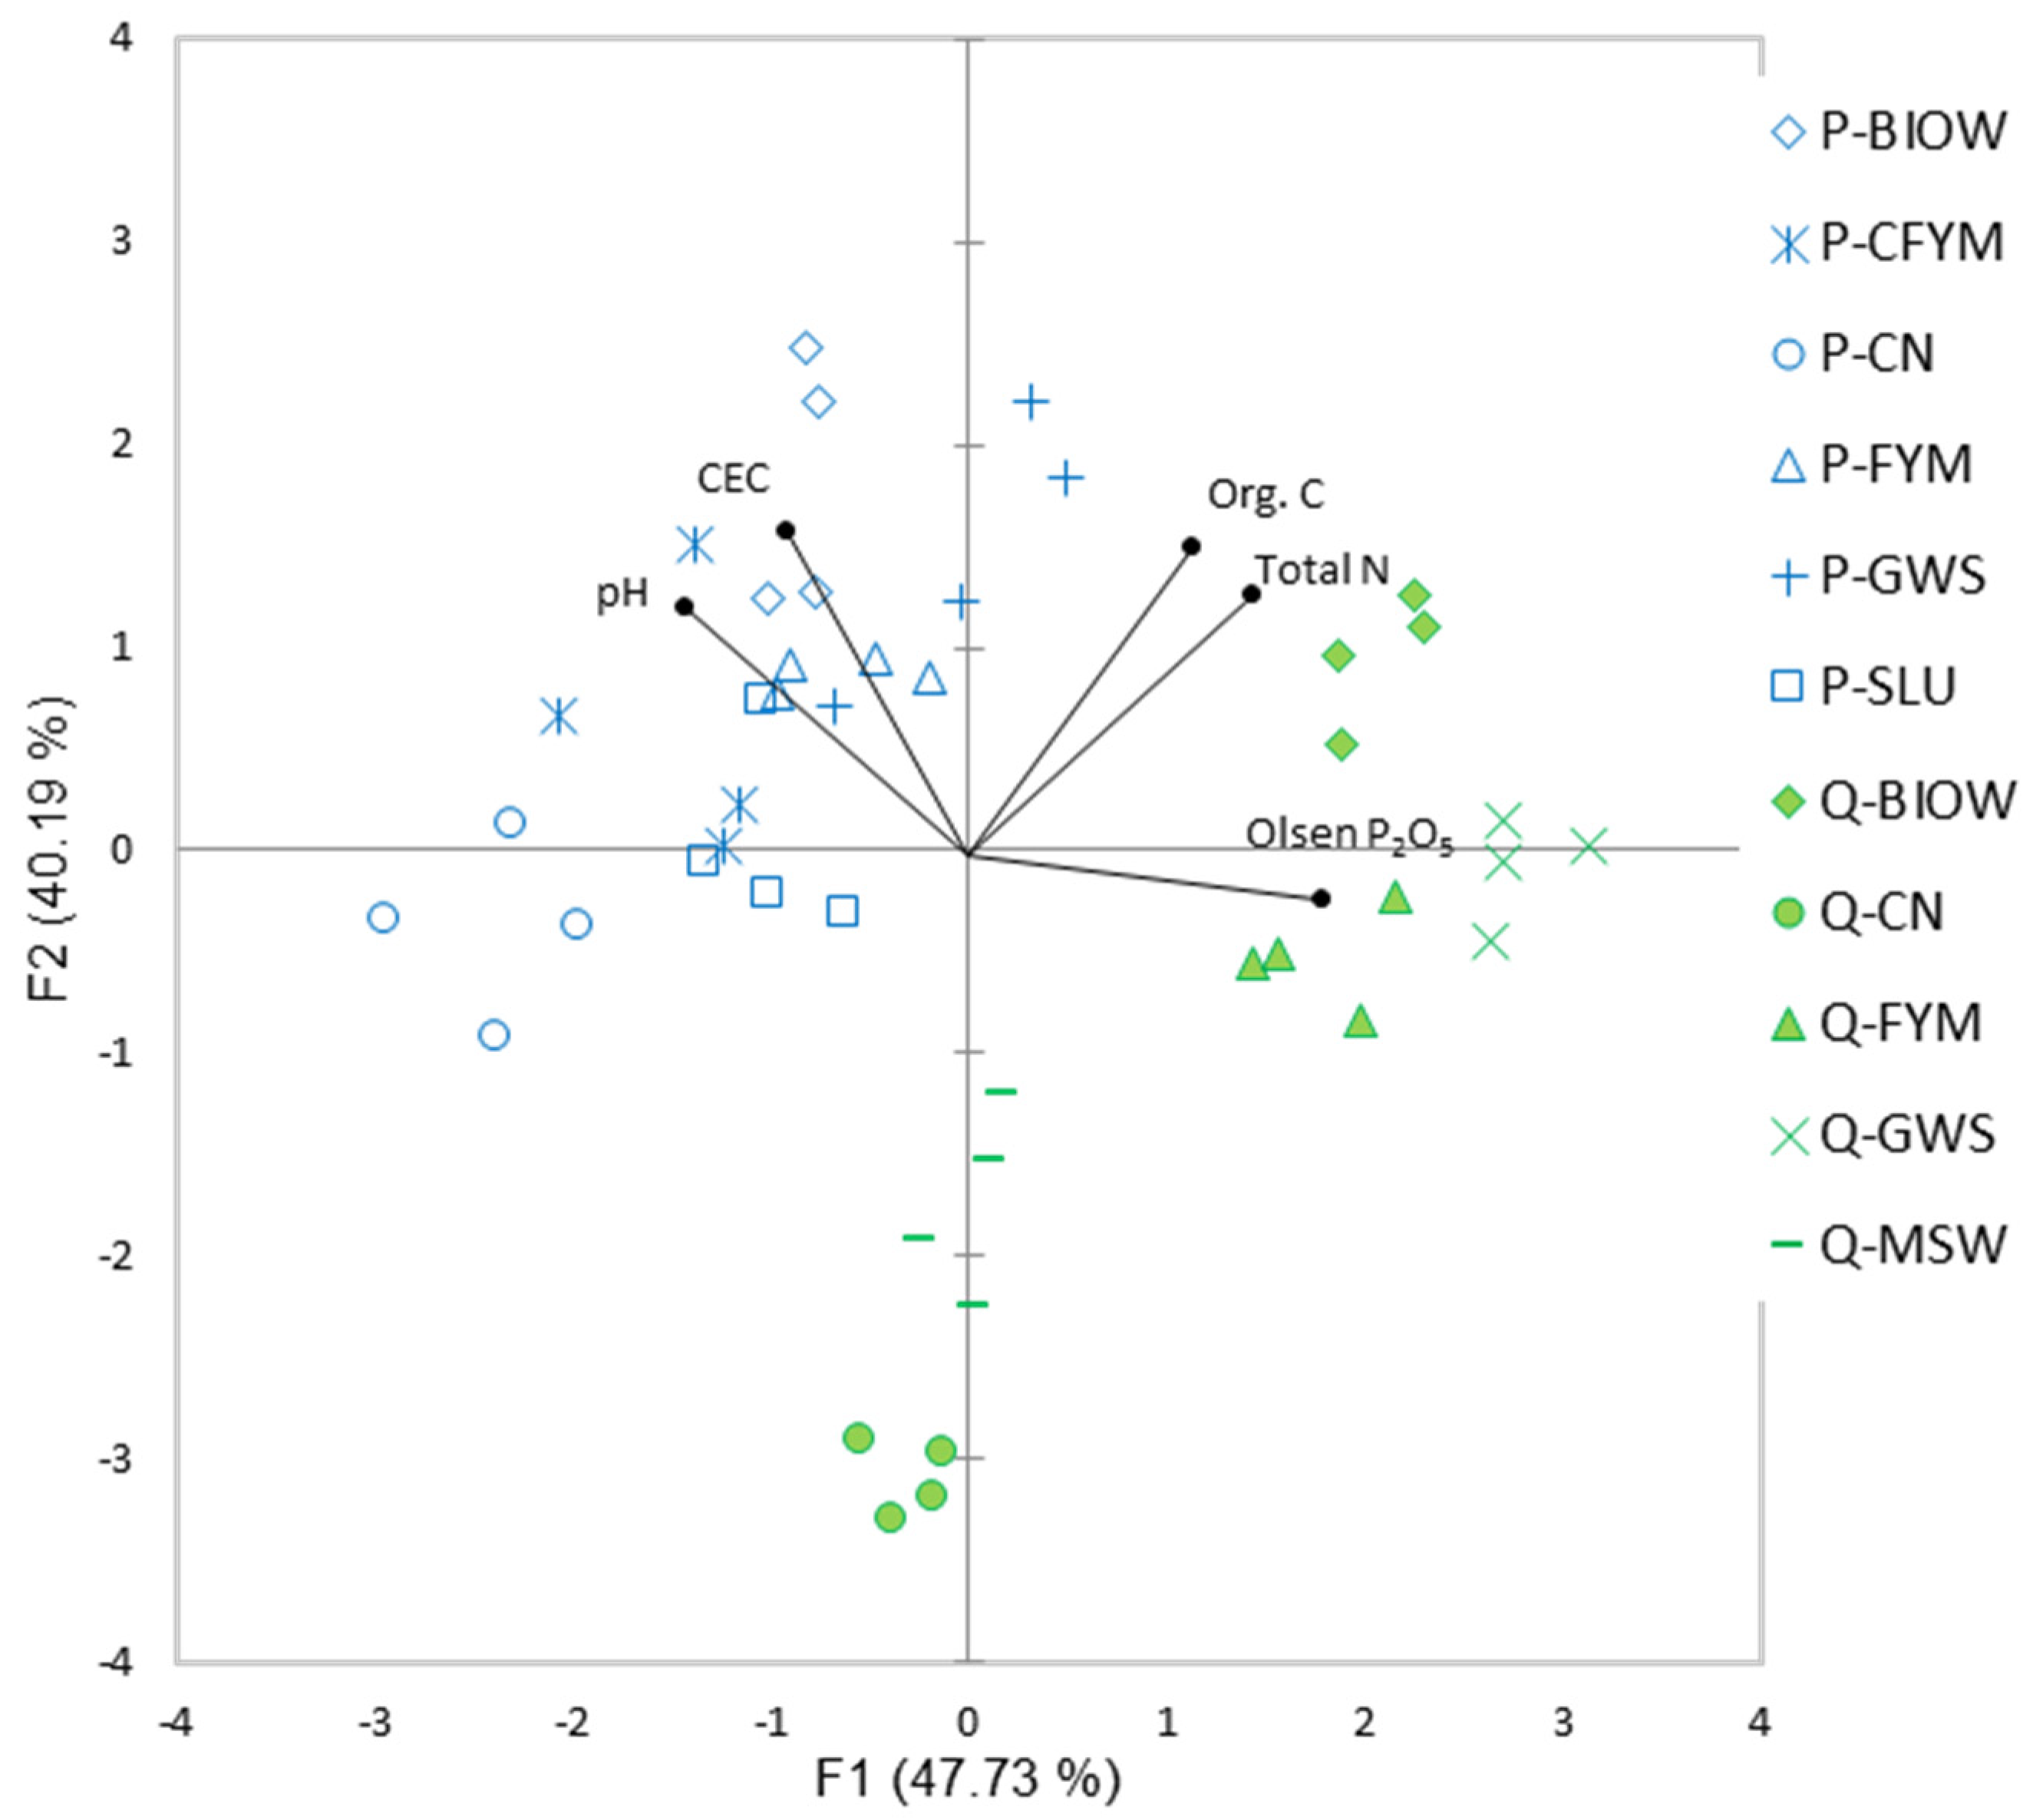
After 13–15 years of OWP applications, several significant differences in soil chemical properties appeared among treatments (Figure 3, Table 4):
  • Soil pH at the PROspective site, which was initially alkaline (before the OWP application), was not significantly altered by the repeated applications of OWP. At the QualiAgro site, after 15 years of OWP applications, the amended soils were always characterized by a significantly higher soil pH, compared to the control (Q-CN) (up to 1 unit for Q-BIOW). In addition, soil pH in Q-CN decreased significantly compared to the initial state in 1998 [13].
  • CEC at the OWP treated plots was significantly higher than at the CN plots at both sites, with stronger effects at QualiAgro site, especially for Q-BIOW, which exhibited an increase of 10% compared to the initial state. Moreover, CEC of the non-amended soil decreased significantly over time at the QualiAgro site [13].
  • Soil OC content was significantly higher at the OWP treated plots (after 13–15 years) compared to the CN plots (except for P-SLU). At the QualiAgro site, significant OC increase was observed for soils amended with OWP compared to initial state, especially for Q-GWS and Q-BIOW (+48% for Q-GWS and +52% for Q-BIOW compared to initial state). At the PROspective site, OC content in composts and FYM amended soils was the same as the initial average content, while it decreased in the P-CN and P-SLU amended soils.
Soil OC, CEC and pH are known to be increased by the repeated inputs of OWP and to influence TE mobility and bioavailability [24,26,37,59]. As observed in Table 4 and illustrated by the distribution of the dots in PCA analysis for both sites (Figure 3), the increase of those properties was more marked at QualiAgro site compared to the PROspective site. As supposed by the first working hypothesis, this observation could result from initial soil chemical properties, such as pH, OC content and CEC higher at the PROspective site compared to the QualiAgro site, and from the higher amounts of OWP applied at QualiAgro site compared to the PROspective site. Moreover, the PROspective site presented a high pH buffering capacity, notably in relation to its carbonate content.
At both sites, initial topsoil TE concentrations were homogeneous as no significant difference was observed between the treatments plots (detailed statistics in Supplementary Materials Table S1). At the QualiAgro site, initial TE concentrations were in the range or lower than median values for topsoil layer (0–30 cm) of arable crop systems cited in Saby et al. [58], except for Hg (Table 5). At the PROspective site, initial TE concentrations were close to the median or lower than those commonly found in topsoil in France for Cd, Hg, Mo, Pb and Zn, while initial concentrations for Cr, Cu, Mn, Ni and Tl were higher than those commonly found in topsoil in France. Initial TE concentrations were higher at the PROspective site than at the QualiAgro site for Cr, Cu, Ni and Zn, while Hg concentration was higher at the QualiAgro site.
At the PROspective site, cumulated TE inputs by OWP represented up to 4% of the Cd initial soil stock (P-GWS), 1% for Cr (P-BIOW), 9% for Cu (P-GWS), 23% for Hg (P-GWS), 1% for Mn (P-BIOW), 10 and 11% for Mo (respectively for P-BIOW and P-GWS), 1% for Ni (P-BIOW and P-GWS), 5% for Pb (P-BIOW), 1% for Tl (P-BIOW) and 9% for Zn (P-GWS) (Supplementary Materials Table S8). In fact, 13 years of OWP spreading at agriculturally relevant levels did not result in significant changes of TE concentrations in the topsoil layer compared to the control treatment, except for Mo and Ag (Table 5; for supplementary TE such as As and Ag see Supplementary Materials Table S3, Ag topsoil concentration increased significantly in P-SLU and P-GWS compared to the other treatments). 
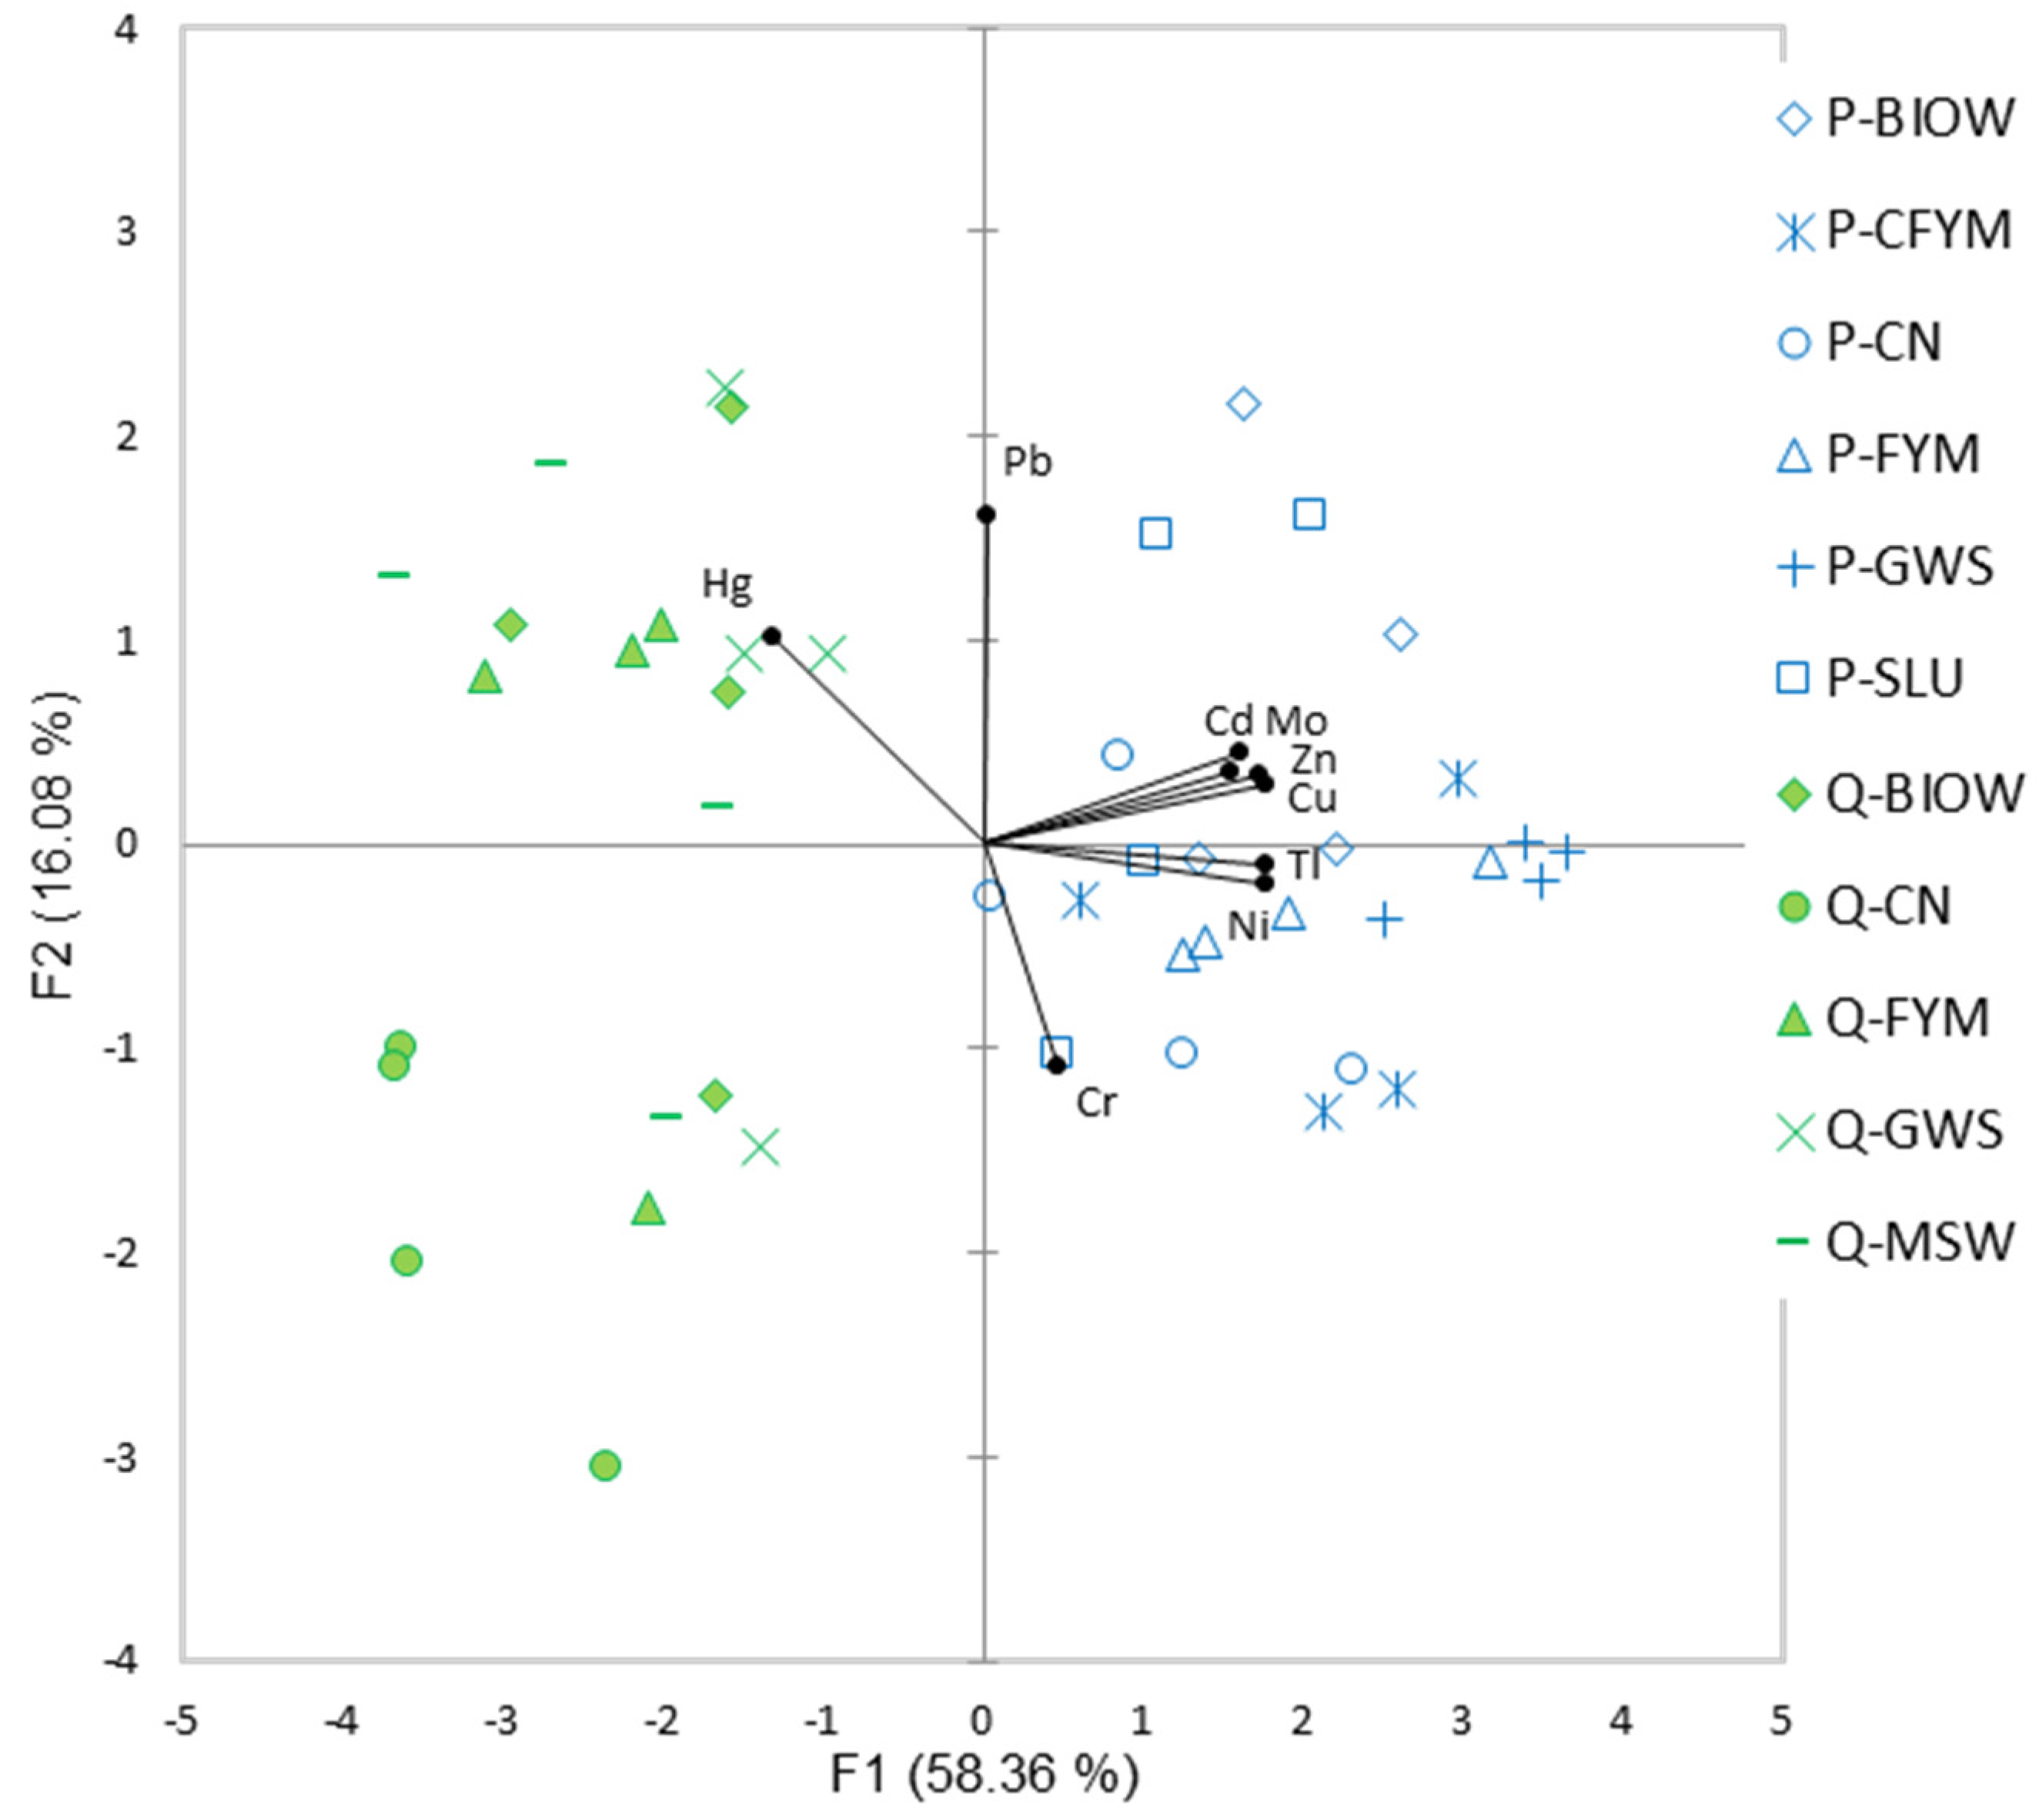
Figure 4 illustrates such findings because the control (P-CN) overlapped OWP treatments on both components of the PCA.
At the QualiAgro site, the amounts of OWP applied were 2–2.5 fold higher than at the PROspective site and the initial TE levels were generally lower than at the PROspective site. At this site, cumulated TE inputs by OWP represented up to 15% of the initial soil stock for Cd (Q-MSW and Q-GWS), 48% for Cu (Q-GWS), 32% for Hg (Q-GWS), 8% for Ni (Q-BIOW), 17% for Pb (Q-BIOW) and 26% for Zn (Q-GWS) (Supplementary materials Table S8). Fifteen years of repeated inputs of OWP did not result in increased concentration of As, Cd, Cr, Hg, Ni and Pb in the topsoil compared to the initial state in 1998 (Table 5, for As see Supplementary Materials Table S3). However, at this site, repeated inputs of OWP tended to slow down natural attenuation of topsoil concentration for Cd, Hg and Pb. Indeed, as already pointed out by Michaud et al. [13], a slight decrease of Cd concentration occurred in non-amended soil (−13% between 1998 and 2013). Large inputs of OWP also resulted in a significant increase of topsoil concentration of TE considered as micronutrients, (i) i.e., B, Cu, Mo and Zn, compared to the control soil (for B, see Supplementary Materials Table S3); (ii) i.e., Cu and Zn, compared to the initial state, especially in Q-GWS with +58% for Cu and +25% for Zn. It should be noticed that, as cited by Michaud et al. [13], a large increase of all Cr values appeared between 1998 and 2013, probably resulting from a change in the analytical methods. For all of the measured topsoil TEs, concentrations remained in the range of median found for topsoils in France [58].
Furthermore, Figure 4 illustrates that the changes in topsoil TE concentrations were slightly higher at the QualiAgro site compared to the PROspective site because CN data points did not overlap the other treatments at the QualiAgro site, contrary to the PROspective site. Higher amounts of OWP spread at the Qualigro site resulted in larger changes in TE concentrations in topsoils compared to the PROspective site, but this did not level the initial differences between the two sites (i.e., P > Q).

3.3. Accumulation of Trace Elements in Plantlets and Grains

Table 6 presents the average biomass yields for plantlets and grains of winter wheat at the QualiAgro site and maize at the PROspective site. At the PROspective site, maize plantlet biomass and grain yield did not differ significantly between the plants cropped from amended soils and from the control. At this site, maize grain yield was slightly higher than average French yield of 9.1 t ha−1 for grain maize but no impact of OWP spreading was observed [60]. At the QualiAgro site, wheat plantlet biomass and grain yield were significantly lower from plants cropped from Q-CN compared to the plants cropped from the amended-soils. Wheat grain yield from Q-BIOW, Q-MSW and Q-FYM amended soils was in the range of French average yield of 7.1 t ha−1 for winter wheat, it was larger for Q-GWS amended soils, while it was lower for non-amended Q-CN soils [60]. Such observation could result from nutrient inputs by OWP (e.g., N and P) and a decrease in soil nutrients in non-amended soils (e.g., N and P) (Table 1 and Table 4, Supplementary Materials Tables S1–S9, Figure S3 and S4).
Table 7 and Table 8 summarize TE concentrations in plantlets (wheat and maize) and exported grains, respectively. At the QualiAgro site, no significant difference was observed between wheat plants (plantlets and grains) sampled from OWP-amended and CN soils for As, Cr, Cu and Pb (for As see Supplementary Materials Tables S10 and S11). The Mn concentration was significantly lower in plantlets and grains sampled from the OWP treatments compared to those sampled from the control soil, which was also true for Tl concentration in plantlets. Cd and Ni concentrations were significantly lower in plants sampled from OWP amended plots, compared to the control, i.e., Cd in Q-GWS (grains) and Q-BIOW (plantlets and grains), and Ni in Q-BIOW (grains) and Q-MSW (plantlets). Compared to controls, plantlet Zn and Mo concentrations were significantly higher at the GWS and OWP plots, respectively. The Hg concentrations were lower than the quantification limit in both, plantlets and grains.
In PROspective maize plantlets, no significant difference was observed between OWP amended plots and the P-CN, except for Mo and Pb (Table 7). For Mo, the concentration was significantly higher in P-GWS compared to the other treatments, while for Pb P-FYM was significantly higher than P-CFYM. It can be noticed that As concentration was significantly larger in P-FYM compared to P-BIOW and P-CN (see Supplementary Materials Table S10). In maize grains, no significant difference was observed between the treatments for all TE, except for Zn for which the concentration was significantly higher in P-BIOW and P-FYM compared to P-SLU (Table 8, Supplementary Materials Table S11).
For both field experiments, average grain TE concentrations were generally equal or below regulatory and recommended limits [62] and published values [18,61]. For toxic TE in grains, most values were lower than the quantification limit, especially at the PROspective site (Table 8, see Supplementary Materials Table S11 for As). At the QualiAgro site, inputs of OWP resulted in decreased phytoavailability for Cd, Mn, Ni and Tl compared to Q-CN. Such results agreed with previous results showing that long-term application of sewage sludge and manures reduces the TE phytoavailability, e.g., shoot and grain Cd accumulation [19,48,63]. The present results also showed that composts inputs in neutral soil, especially alkaline mature compost (i.e., BIOW) decreases the plant concentration of highly toxic TE, e.g., Cd and Tl.

3.4. Underlying Soil Factors Determining Trace Elements Phytoavailability

Multilinear regressions (MLRs) analysis were carried out to identify soils characteristics influencing in situ TE phytoavailability as related to repeated inputs of OWP: (i) for both experimental sites despite different plant species and (ii) considering separately each experimental site. MLR equations were previously selected (i) by considering soil properties significantly altered by the repeated inputs of OWP and soil properties differing between the sites (e.g., clay and silt contents), and (ii) by avoiding correlated soil variables (e.g., OC, CEC, N and P). Carbonates were not considered in MLR, as values found at QualiAgro site were lower than the quantification limits. Soil properties not measured simultaneously at both sites were excluded from the regression equation.
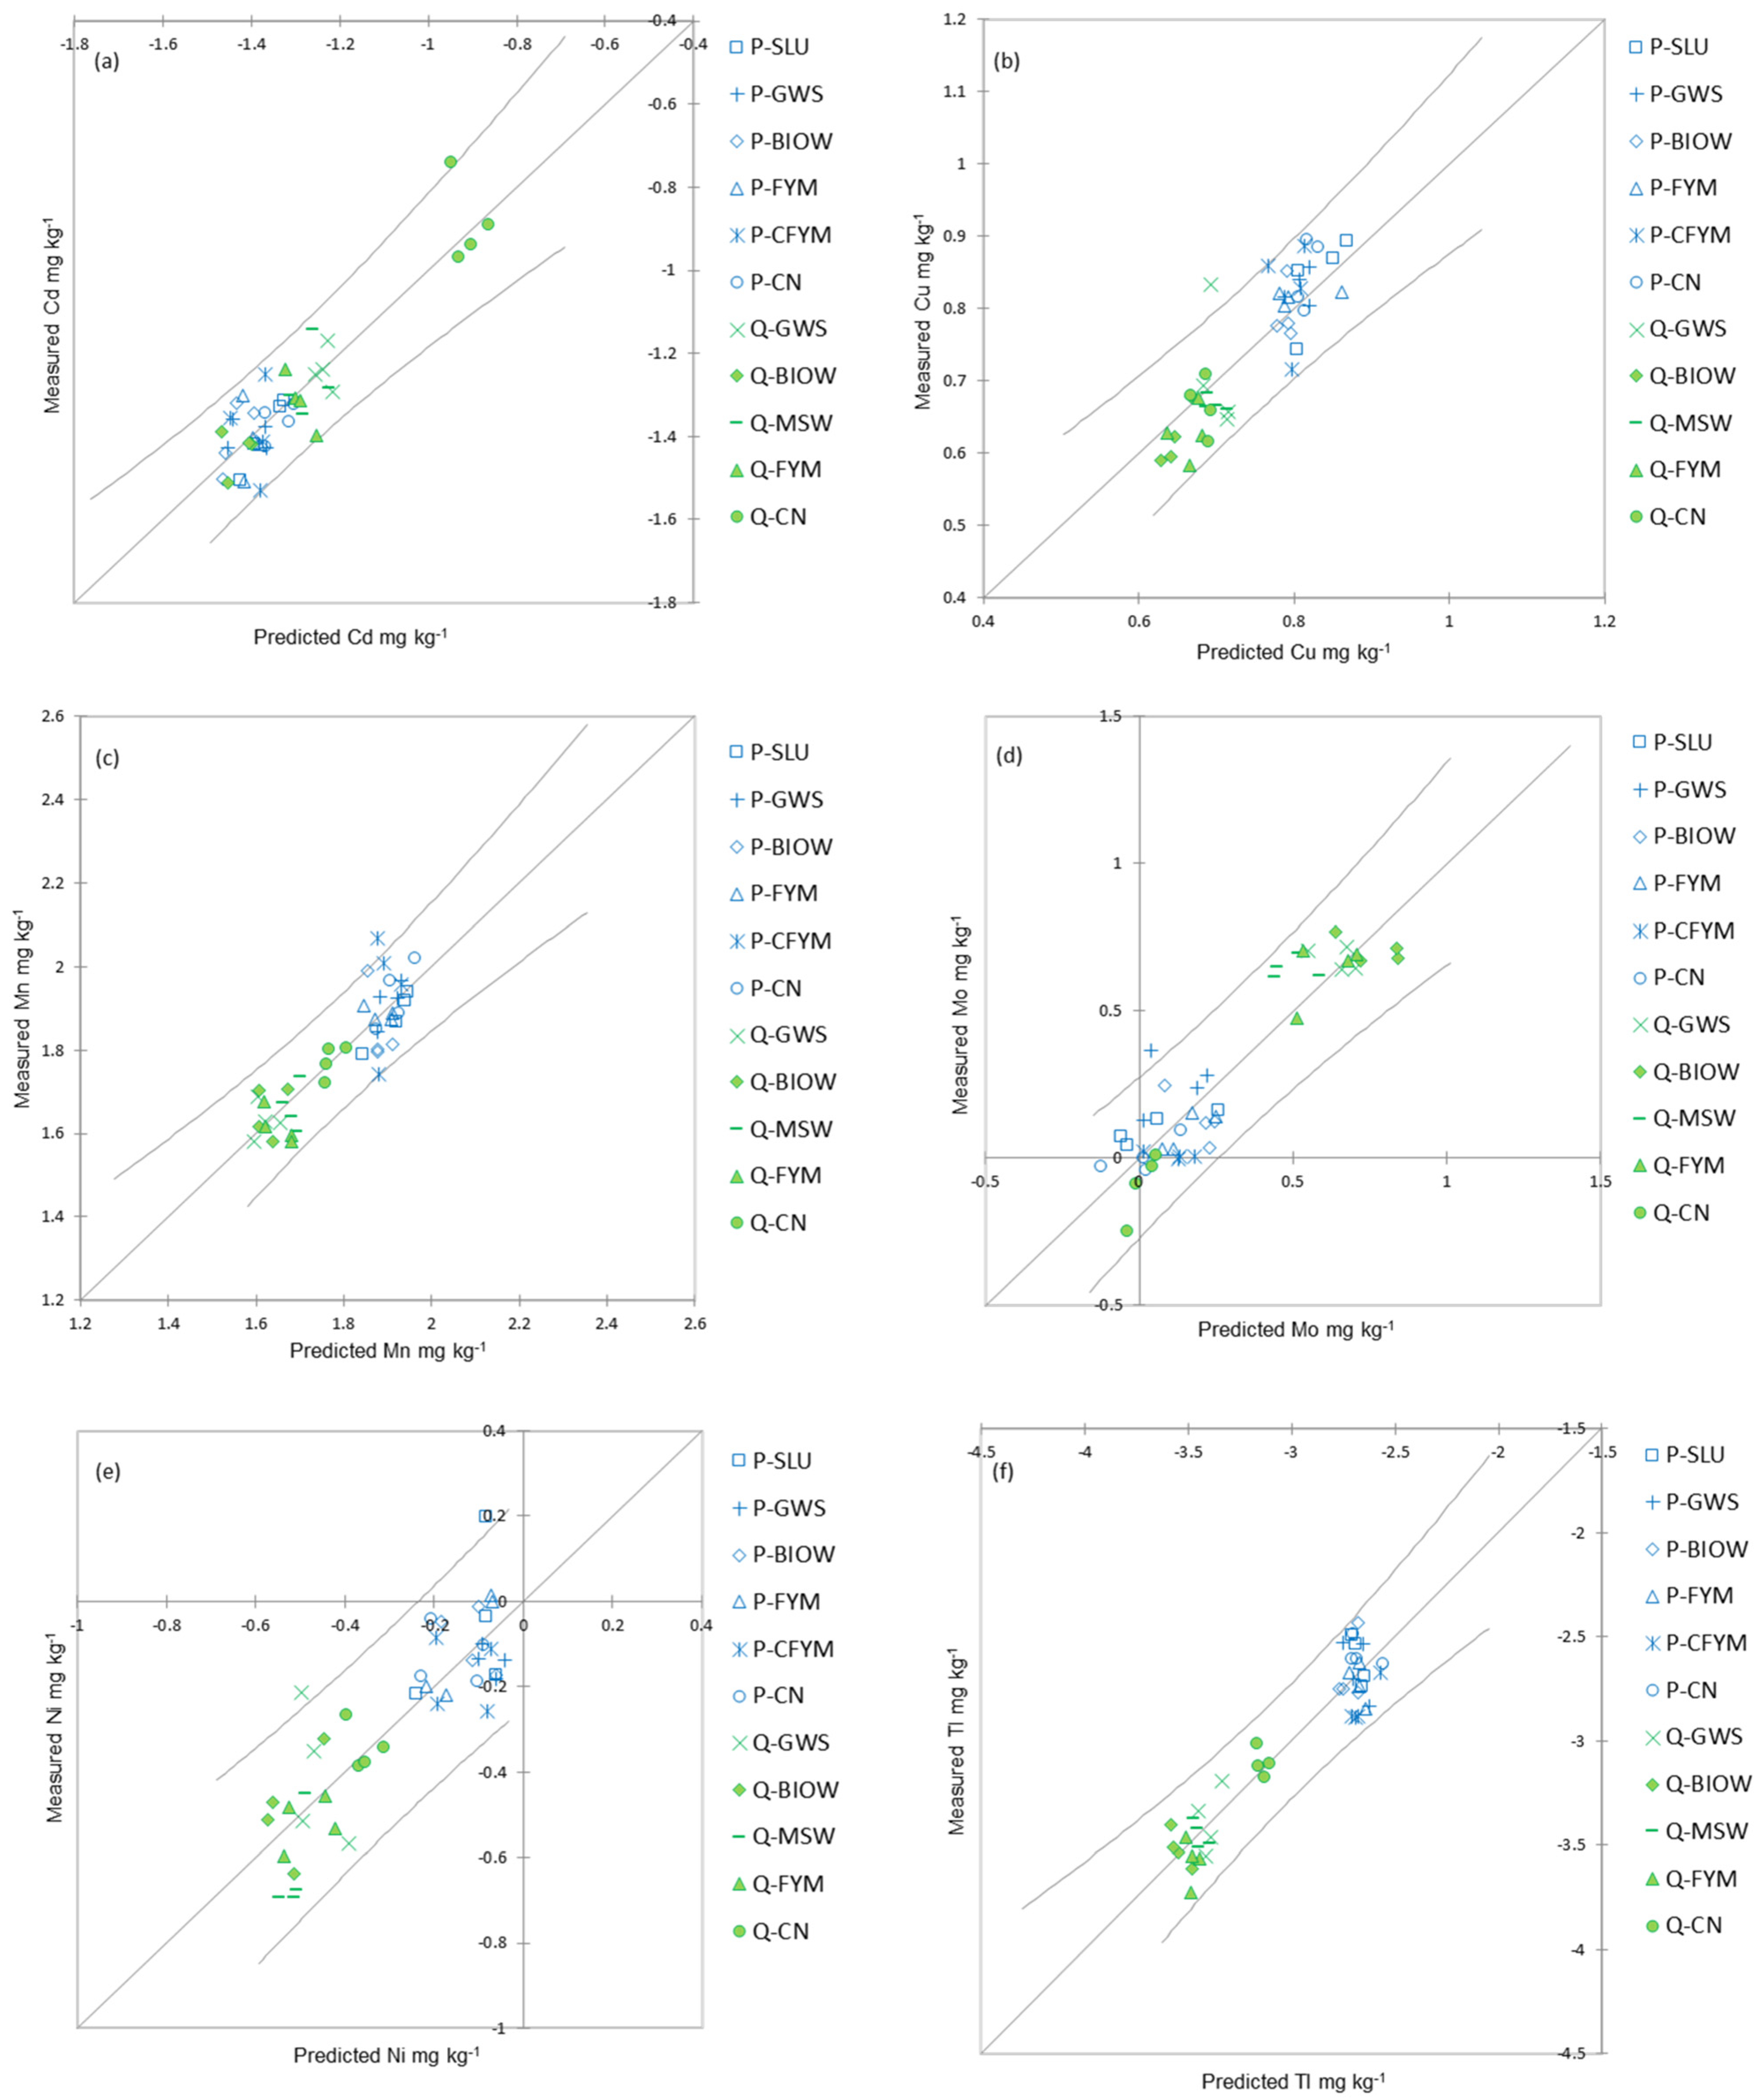
Considering both sites, MLR models based on soil TE concentrations and selected soil properties were able to accurately predict TE concentration in plantlets for Cd, Cu, Mn, Mo, Ni and Tl (i.e., in situ phytoavailability) (Table 9, Figure 5, r2adj ≥ 0.72). Figure 5 showed that MLR models could correctly predict differences among experimental sites, with distinct repartition of the dots between the sites for Cu, Mn, Ni and Tl. Of all soil variables tested in the MLR, soil OC content was the most frequent significant associated variable, followed by the clay content, pH and total soil TE concentration. Soil OC and pH did vary according to the initial soil chemical properties and the type and amount of OWP applied (Table 1 and Table 4, Figure 3). For Cd and Mo, the TE phytoavailability was significantly associated to soil OC, pH and clay content. For Cu and Tl, soil TE concentration and OC content (and pH for Tl) appeared as explaining soil variables when considering the ranges of variations within our data. For Mn and Ni, clay content appeared as associated soil variables, and OC content for Mn and pH for Ni. For Cr, Hg, Pb and Zn, no significant equation was found: indeed, Cr and Hg phytoavailability did not differ significantly between the treatments, while Pb and Zn phytoavailability differed only between P-FYM and P-CFYM and between Q-GWS and Q-CN at the PROspective and QualiAgro site, respectively (Table 7).
When considering both sites, a negative significant coefficient between the OC content and plantlet TE concentrations suggested an effect of OC inputs to soils in decreasing TE phytoavailability for Cd (p < 0.001), Cu (p < 0.01), Mn (p < 0.01) and Tl (p < 0.01). This could result from sorption of TE onto fraction of OM, which could form immobile TE-OM complexes [5,64]. Our findings are in agreement with previous studies suggesting the importance of insoluble OM in decreasing TE solubility, and thus phytoavailability [19,25,26,28,65]. In a same way, negative significant coefficients with pH for Cd (p < 0.001), Ni (p < 0.05) and Tl (p < 0.05) were consistent with common observations and interpretation that increasing pH facilitates deprotonation of soil variable charge surfaces, and cationic TE sorption and complexation, decreasing their (phyto)availability. For the anionic Mo, on the contrary, positive significant coefficient was found for OC content (p < 0.001) and pH (p < 0.05), which was consistent with a soil enrichment of Mo with repeated inputs of OWP and increasing mobility and phytoavailability of oxyanions with alkalinity [21,22,66,67,68]. According to the literature, soil texture appeared as predicting factor of TE phytoavailability, as it influences TE solubility and bioavailability [22,24,67]. Finally, positive significant coefficient between soil and plant TE concentration suggested a significant increase in TE phytoavailability with increasing soil TE concentration for Cu (p < 0.001) and Tl (p < 0.001). Among other soil variables known to alter TE availability and not considered in MLR analysis, increased carbonates and phosphates content could alter availability of some cationic TE [17,21,22].
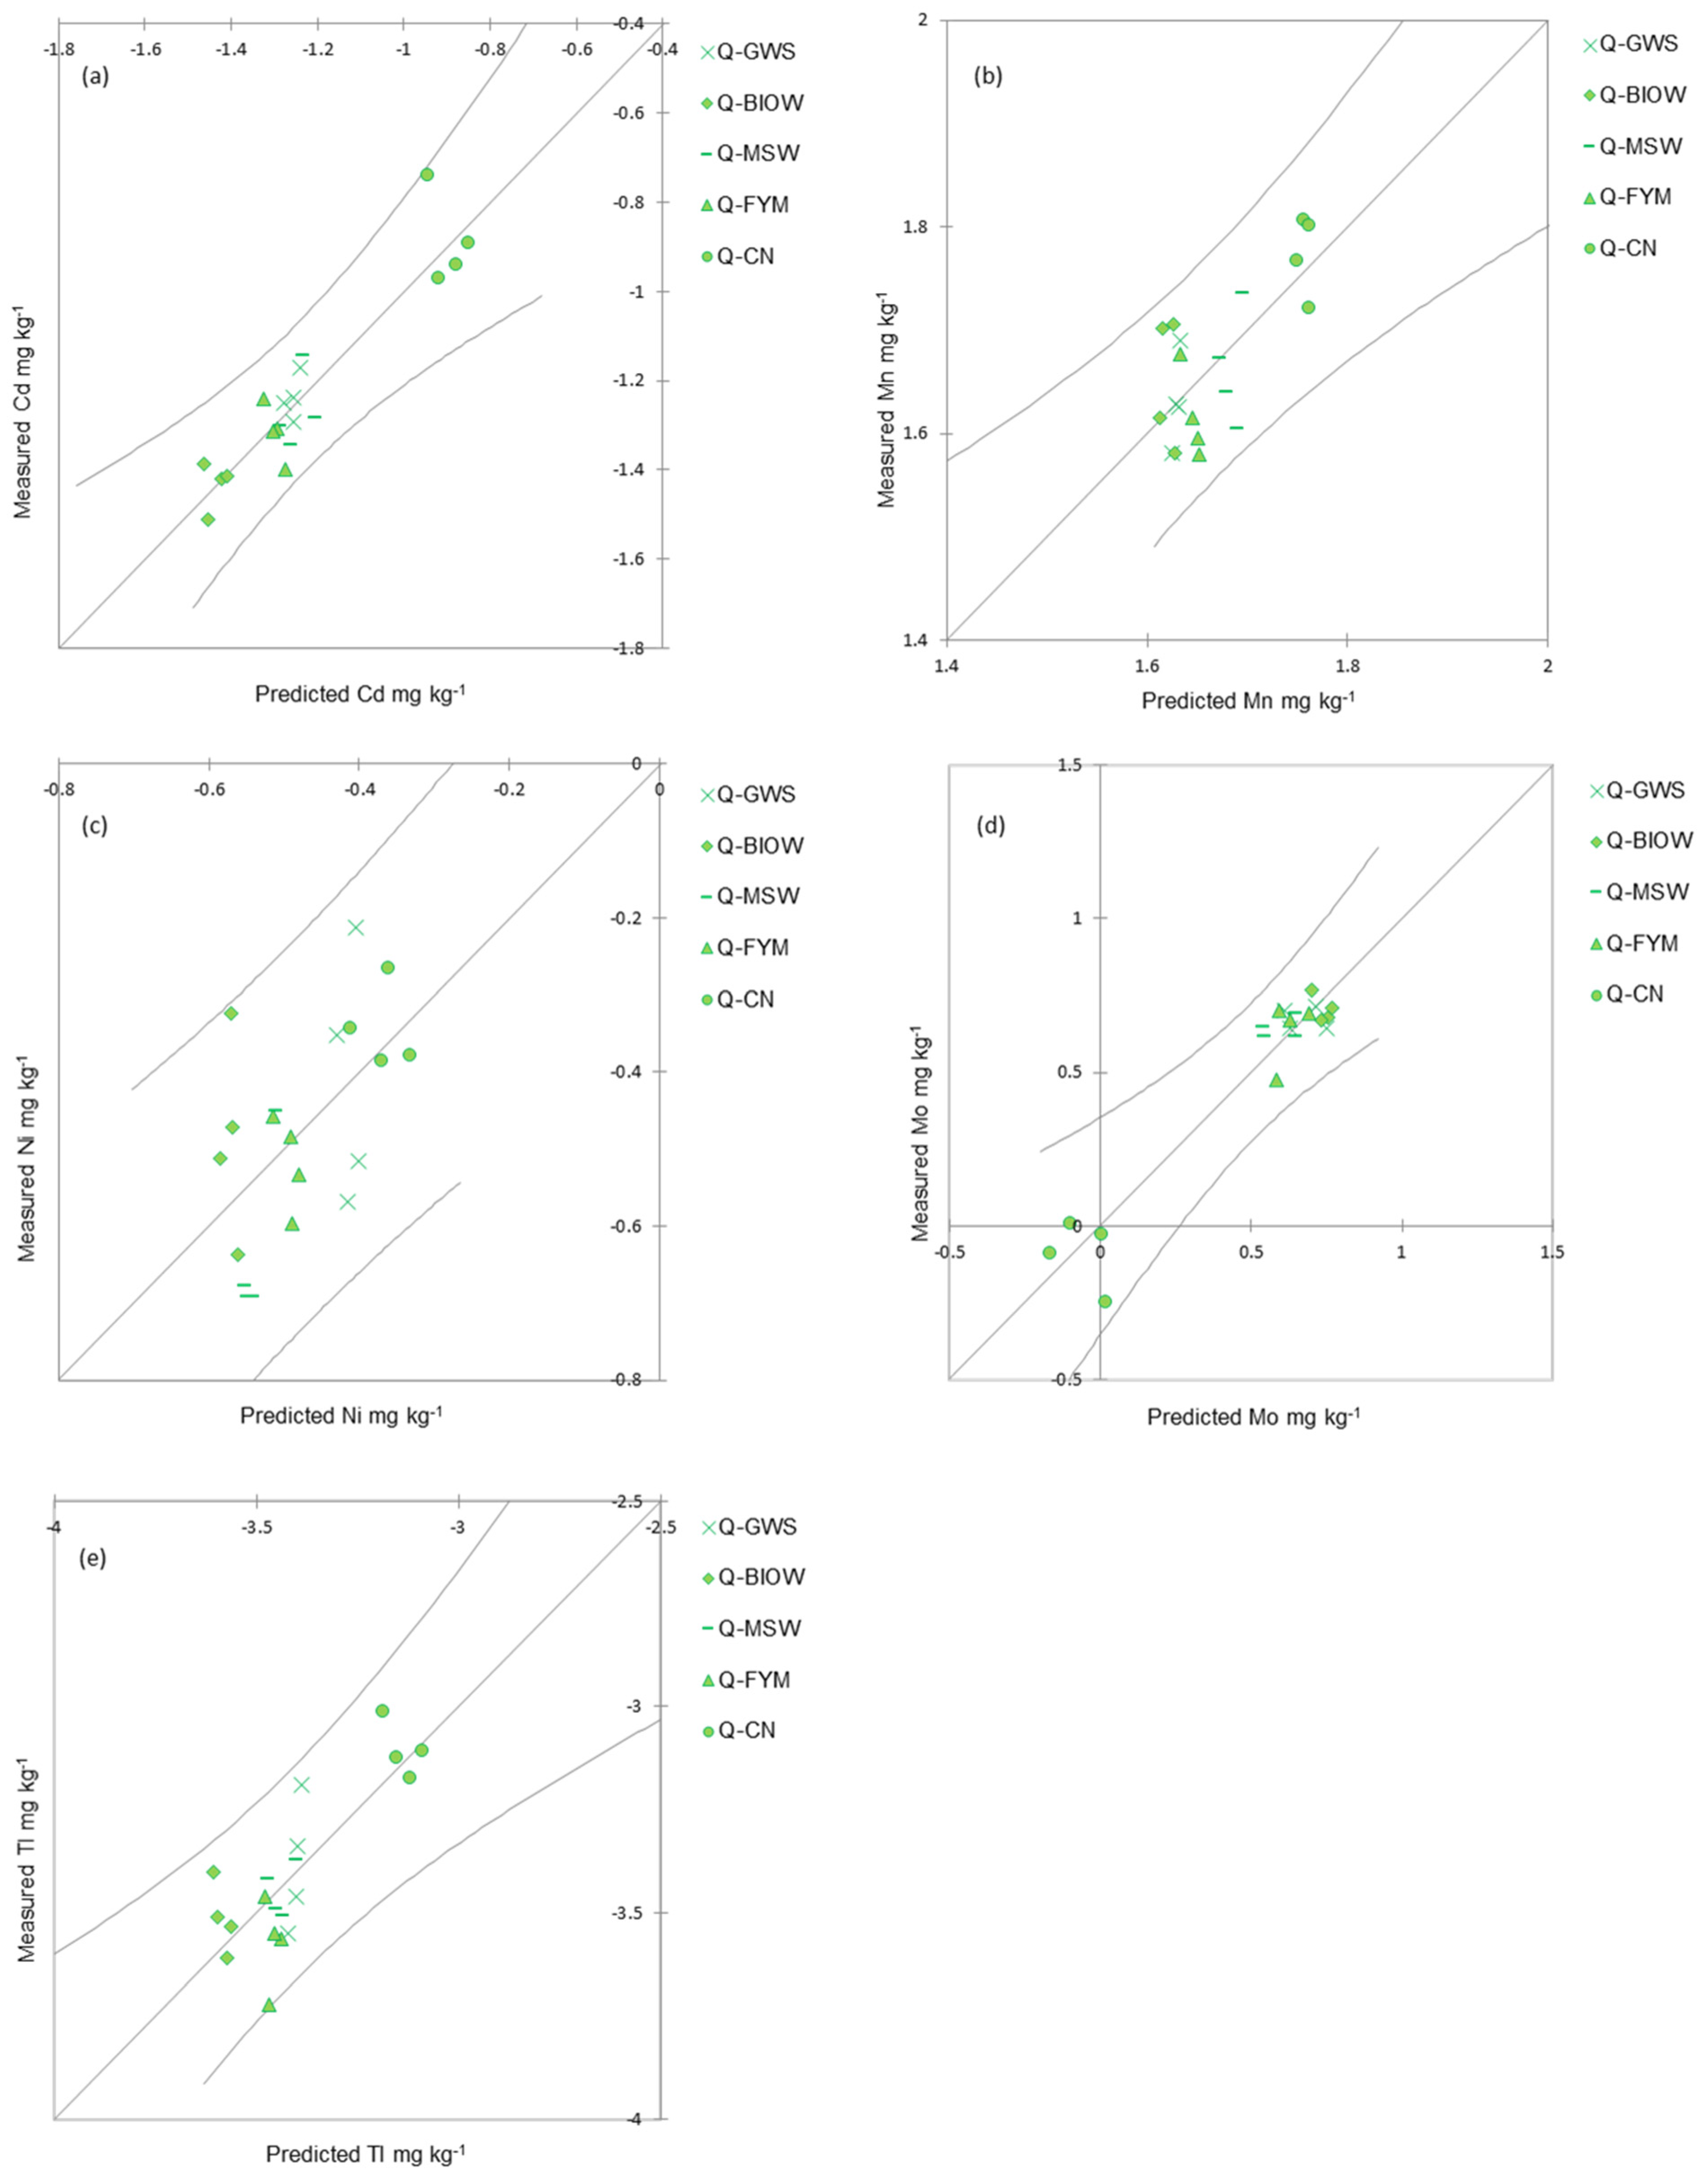
In order to specify the OWP treatment effects on TE phytoavailability, MLR were carried out per experimental site (Table 9). At the PROspective site, no significant equation was found likely for Cd, Cu, Cr, Mn, Pb, Tl and Zn because OWP spreading had little effects on soil characteristics, including the TE contents. For Ni and Mo significant models were found, but low adjusted r-square error and low p-value underlined the fact that models did not explain accurately the dispersion of observations, and thus TE concentration in plantlets was not correctly explained by the selected soil variables. The present results showed that regression models could not explain the intrasite variability for the PROspective site.
We expected soil pH (i.e., second working hypothesis) and soil TE concentrations to be controlling factors of TE phytoavailability, as already stressed in previous work [20,24,28,69,70]. Our data suggested that soil TE concentration might not have varied enough to detect the effect on the phytoavailability of most TE, especially at the PROspective site. With the OWP inputs to soil, the major processes determining TE phytoavailability were presumably the complexation and retention processes with OM, and the reduction of their mobility in soil due to the increase of soil pH. Such findings have already been observed at contaminated sites, but rarely in non-contaminated field experiments and also not in the case of urban composts application [26,28,48]. At the PROspective site, OWP inputs were not sufficient to alter soil TE concentrations and OC content, while the carbonate content probably buffered the alkaline pH. This could explain the absence of TE phytoavailability differences between the OWP treatments at the PROspective site (except for Mo and Pb), compared to the QualiAgro site. Indeed, at the QualiAgro site, with significant differences in TE phytoavailability found among treatments, higher OWP inputs, and greater variations in soil chemical properties, significant equations were found for Cd, Mn, Mo, Ni and Tl, with adjusted r-square error up to 0.84 and 0.89 for Cd and Mo, respectively. When comparing MLR equations, clay content differed between MLR equations for both sites (i.e., Q/P) and for the QualiAgro site (i.e., Q) (Table 9). Of all soil variables tested in the related MLR, pH was the most significant, followed by OC.
At the QualiAgro site, the models correctly predicted TE phytoavailability, with the control (Q-CN) exhibiting higher TE phytoavailability for Cd, Mn, Ni and Tl, and lower Mo phytoavailability (Figure 6). When considering the studied treatments, Figure 6 showed the following orders: for Cd, Mn, Ni and Tl phytoavailability, Q-CN > Q-MSW = Q-GWS = Q-FYM > Q-BIOW; for Mo phytoavailability, Q-CN < Q-MSW = Q-GWS = Q-FYM = Q-BIOW. Among TE, Cd is the most probable TE to be of concern in the terms of crop accumulation from fertilizers and soil amendments [21]. The predicted Cd phytoavailability decreased with an increase in OC content and soil pH, i.e., in amended-soils although the total content was higher compared to the control. The OWP inputs resulted in decreased risk of Cd transfer to the crop, especially for Q-BIOW at QualiAgro site, which is an alkaline and mature compost.
However, our results did suggest a somewhat confounding effect of OWP inputs doses (large versus common) on TE phytoavailability with respect to the soil type and plant species. Therefore, there is still a question if doubling the OWP inputs at the PROspective site would demonstrate the same or similar results to those found at the QualiAgro site.

4. Conclusions

Studied OWP had the same chemical characteristics (i.e., pH, CEC, OC, N, P and K) and TE concentrations, regardless of the site and the place of OWP production. Farmyard manure and compost of farmyard manure had the lowest TE concentrations (Cd, Cr, Cu, Hg, Mn, Mo, Ni, Pb and Zn). Repeated OWP inputs at agriculturally relevant levels on a calcareous soil, i.e., at the PROspective site (pH 8.3), maintained the topsoil OC content, without altering pH, and the topsoil TE concentration, except for Mo. When large amounts of OWP were applied for 15 years in a neutral non-calcareous soil, i.e., at the QualiAgro site (pH 7.1), significant increase in soil pH and OC content occurred. In such conditions, larger TE inputs by OWP tended to slow down natural attenuation of topsoil TE concentrations for Cd, Hg and Pb, and to increase Cu, Mo and Zn topsoil concentration in amended soils. Maize TE concentrations did not change with the common agricultural OWP input levels at the PROspective site. At the QualiAgro site, significant decrease in wheat TE concentrations (i.e., plantlet shoots and grains) occurred at OWP amended plots for Cd, Mn, Ni and Tl, compared to the control. The contrary occurred for Mo.
With the OWP application to soil, the major factor determining TE phytoavailability was an increase in OC content and pH, suggesting TE complexation and retention processes with OM, also possibly associated with the TE reduced mobility in soil due to the increase of soil pH. In a very long-term perspective, decomposition of OM and soil OM complexes that bind TE, modification of environmental conditions and land management could occur. This could result in a release of sorbed TE. Nevertheless, TE phytoavailability would not increase in the case OWP inputs ceased due to ageing processes, sorption of TE to recalcitrant OM and/or sorption of TE onto other soil components such as Mn oxides. In order to confirm such a hypothesis, future work is needed to determine OM reactivity and TE retention capacities of OWP and in amended soils, and the oxides implication in TE phytoavailability. Moreover, the present approach could be applied at various experimental sites, e.g., sites integrated in the SOERE PRO network (network of long-term experiments dedicated to the studying of impacts of organic waste product recycling). This would (i) complete TE phytoavailability references, (ii) evaluate a putative alteration of TE phytoavailability after cessation of OWP inputs and (iii) identify the role of OC and oxides in TE phytoavailability.

Supplementary Materials

The following are available online at https://www.mdpi.com/article/10.3390/agronomy11040664/s1, Figure S1: Field management and sampling periods for QualiAgro site, Figure S2: Field management and sampling periods for PROspective site, Figure S3: Principal Component Analysis of organic waste product chemical properties for both sites, Figure S4: Principal Component Analysis of organic waste product trace element concentrations for both sites. Table S1: Initial chemical characteristics of the topsoil layer (0–25 cm, sieved < 2 mm), Table S2: Soil supplementary chemical properties, Table S3: Supplementary total trace elements concentrations measured in the topsoil layer (0–25 cm, sieved < 2 mm) for Ag, Al, As, B, Co, Fe, Se, compared to the average French trace element concentrations, Table S4: Characteristics of the organic waste products studied in the QualiAgro site, Table S5: Characteristics of the organic waste products studied in the PROspective site, Table S6: Trace element concentration (mg kg−1 DM, DM for dry matter) of the organic waste products studied at the QualiAgro site, Table S7: Trace element concentration (mg kg−1 DM; DM for dry matter) of the organic waste products studied at the PROspective site, Table S8: Cumulated input fluxes of trace elements (kg ha−1) by organic waste products, Table S9: Supplementary trace elements concentrations in the applied organic waste products studied over the period 1998–2013 at the QualiAgro and PROspective sites, for Ag, Al, As, Co, Fe and Se, Table S10: Supplementary trace element concentrations in plantlets for Ag, Al, As, B, Co, Fe, Sb, Se, Sn and rare earth elements Ce, La, Table S11: Supplementary trace element concentrations in consumed exported grains for Ag, Al, As, B, Co, Fe, Sb, Se, Sn and rare earth elements Ce, La.

Author Contributions

A.M.M., conceptualization, methodology, validation, data curation, statistical analysis, investigation, writing and original draft preparation, review and editing, project administration and funding acquisition; V.S.-D., methodology, validation, investigation, review; P.C., methodology, validation, review; C.N., validation, review; N.J., validation, review; D.M., methodology, data curation, review; L.F., review; V.D., review, S.H., conceptualization, validation, review, supervision, project administration and funding acquisition. All authors have read and agreed to the published version of the manuscript.

Funding

The QualiAgro and PROspective field experiments form part of the SOERE-PRO (network of long-term experiments dedicated to the study of impacts of organic waste product recycling) certified and funded in 2013 by ALLENVI (Alliance Nationale de Recherche pour l’Environnement) and integrated as a service of the “Investment for future” infrastructure AnaEE-France, overseen by the French National Research Agency (ANR-11-INBS-0001). The in situ phytoavailability study was also carried out by Reseau PRO project funded by CasDAR IP (grant number 10095) and ADEME (grant number n° 1006C0034).

Data Availability Statement

Available in https://si-pro.fr/, accessed on 15 February 2021.

Acknowledgments

We greatly thank Bernardita Ponce for analyzing of plantlets and for her valuable participation in this study. We thank Bernard Angeletti for TE analyses by ICP-MS in CEREGE.

Conflicts of Interest

The authors declare no conflict of interest.

References

  1. Alvarenga, P.; Palma, P.; Mourinha, C.; Farto, M.; Dores, J.; Patanita, M.; Cunha-Queda, C.; Natal-da-Luz, T.; Renaud, M.; Sousa, J.P. Recycling organic wastes to agricultural land as a way to improve its quality: A field study to evaluate benefits and risks. Waste Manag. 2017, 61, 582–592. [Google Scholar] [CrossRef] [PubMed]
  2. Houot, S.; Pons, M.N.; Pradel, M.; Tibi, A. Organic waste materials valorisation in soils used for agriculture and forestry, agronomic, environmental and socio-economic impacts. Sci. Expert. 2014, Synthesis, 108. [Google Scholar]
  3. Kupper, T.; Burge, D.; Bachmann, H.; Gusewell, S.; Mayer, J. Heavy metals in source-separated compost and digestates. Waste Manag. 2014, 34, 867–874. [Google Scholar] [CrossRef]
  4. Noirot-Cosson, P.E.; Vaudour, E.; Gilliot, J.M.; Gabrielle, B.; Houot, S. Modelling the long-term effect of urban waste compost applications on carbon and nitrogen dynamics in temperate cropland. Soil Biol. Biochem. 2016, 94, 138–153. [Google Scholar] [CrossRef]
  5. Sharma, B.; Sarkar, A.; Singh, P.; Singh, R.P. Agricultural utilization of biosolids: A review on potential effects on soil and plant grown. Waste Manag. 2017, 64, 117–132. [Google Scholar] [CrossRef]
  6. Lopez-Rayo, S.; Laursen, K.H.; Lekfeldt, J.D.S.; Grazie, F.D.; Magid, J. Long-term amendment of urban and animal wastes equivalent to more than 100 years of application had minimal effect on plant uptake of potentially toxic elements. Agric. Ecosyst. Environ. 2016, 231, 44–53. [Google Scholar] [CrossRef]
  7. Tai, Y.; Li, Z.; Mcbride, M. Natural attenuation of toxic metal phytoavailability in 35-year-old sewage sludge-amended soil. Environ. Monit. Assess. 2016, 188, 1–8. [Google Scholar] [CrossRef]
  8. Baize, D. Cadmium in soils and cereal grains after sewage-sludge application on French soils. A review. Agron. Sustain. Dev. 2009, 29, 175–184. [Google Scholar] [CrossRef] [Green Version]
  9. FAO. Decree of 8 January 1998 Establishing the Technical Requirements Applicable for Sewage Sludge Spreading on Agricultural Soils Adopted in Application of Decree N° 97-1133 of 8 December 1997 Relative to Spreading of Sewage Sludge from Waste Water Treatment; FAO: Rome, Italy, 1998. [Google Scholar]
  10. AFNOR. French Regulation Established by AFNOR for Organic Amendments—Composts Containing Sewage Sludges; NFU 44-095; AFNOR: Paris, France, 2002. [Google Scholar]
  11. AFNOR. French Regulation Established by AFNOR for Organic Amendments; NFU 44-051; AFNOR: Paris, France, 2006. [Google Scholar]
  12. Cambier, P.; Michaud, A.; Paradelo, R.; Germain, M.; Mercier, V.; Guerin-Lebourg, A.; Revallier, A.; Houot, S. Trace metal availability in soil horizons amended with various urban waste composts during 17 years—Monitoring and modelling. Sci. Total Environ. 2019, 651, 2961–2974. [Google Scholar] [CrossRef] [PubMed]
  13. Michaud, A.; Cambier, P.; Sappin-Didier, V.; Deltreil, V.; Mercier, V.; Rampon, J.; Houot, S. Mass balance and long-term soil accumulation of trace elements in arable crop systems amended with urban composts or cattle manure during 17 years. Environ. Sci. Pollut. Res. 2020, 27, 5367–5386. [Google Scholar] [CrossRef] [Green Version]
  14. Johnston, A. Micronutrients in Soil and Agrosystems: Occurrence and Availability. Int. Fertil. Soc. 2004, 544, 4–31. [Google Scholar]
  15. Kirkby, E.; Römheld, V. Micronutrients in Plant Physiology: Functions, Uptake and Mobility. Int. Fertil. Soc. 2004, 543, 4–51. [Google Scholar]
  16. Marschner, H. Mineral Nutrition of Higher Plants, 3rd ed.; Academic Press: London, UK, 2012; p. 651. [Google Scholar]
  17. Alloway, B.; Jackson, A. The behavior of heavy-metals in sewage sludge-amended soils. Sci. Total Environ. 1991, 100, 151–176. [Google Scholar] [CrossRef]
  18. Kabata-Pendians, A. Trace Elements in Soils and Plant, 4th ed.; CRC Press Taylor & Francis Group: Boca Raton, FL, USA, 2012; p. 520. [Google Scholar]
  19. Hamid, Y.; Tang, L.; Sohail, M.; Cao, X.; Hussain, B.; Aziz, M.; Usman, M.; He, Z.; Yang, X. An explanation of soil amendments to reduce cadmium phytoavailability and transfer to food chain. Sci. Total Environ. 2019, 660, 80–96. [Google Scholar] [CrossRef]
  20. Wang, Y.; Su, Y.; Lu, S. Predicting accumulation of Cd in rice (Oryza sativa L.) and soil threshold concentration of Cd for rice safe production. Sci. Total Environ. 2020, 738, 1–10. [Google Scholar] [CrossRef] [PubMed]
  21. Carrillo-Gonzalez, R.; Simunek, J.; Sauvé, S.; Adriano, D. Mechanisms and pathways of trace element mobility in soils. Adv. Agron. 2006, 91, 111–178. [Google Scholar]
  22. Bolan, N.; Kunhikrishnan, A.; Thangarajan, R.; Kumpiene, J.; Park, J.; Makino, T.; Kirkham, M.; Scheckel, K. Remediation of heavy metal(loid)s contaminated soils—To mobilize or to immobilize? J. Hazard. Mater. 2014, 266, 141–166. [Google Scholar] [CrossRef]
  23. ISO. Soil Quality—Requirements and Guidance for the Selection and Application of Methods for the Assessment of Bioavailability of Contaminants in Soil and Soil Materials; ISO 17402:2008; ISO: Geneva, Switzerland, 2008. [Google Scholar]
  24. Gupta, N.; Yadav, K.; Kumar, V.; Kumar, S.; Chadd, R.; Kumar, A. Trace elements in soil-vegetables interface: Translocation, bioaccumulation, toxicity and amelioration—A review. Sci. Total Environ. 2019, 651, 2927–2942. [Google Scholar] [CrossRef]
  25. Sauvé, S.; Manna, S.; Turmel, M.; Roy, A.; Courchesne, F. Solid-solution partitioning of Cd, Cu, Ni, Pb, and Zn in the organic horizons of a forest soil. Environ. Sci. Technol. 2003, 37, 5191–5196. [Google Scholar] [CrossRef]
  26. Basta, N.; Ryan, J.; Chaney, R. Trace element chemistry in residual-treated soil: Key concepts and metal bioavailability. J. Environ. Qual. 2005, 34, 49–63. [Google Scholar] [CrossRef] [Green Version]
  27. Heemsbergen, D.A.; Warne, M.S.J.; Broos, K.; Bell, M.; Nash, D.; McLaughlin, M.; Whatmuff, M.; Barry, G.; Pritchard, D.; Penney, N. Application of phytotoxicity data to a new Australian soil quality guideline framework for biosolids. Sci. Total Environ. 2009, 407, 2546–2556. [Google Scholar] [CrossRef] [Green Version]
  28. Melgar-Ramirez, R.; Gonzalez, V.; Sanchez, J.; Garcia, I. Effects of Application of Organic and Inorganic Wastes for Restoration of Sulphur-Mine Soil. Water Air Soil Pollut. 2012, 223, 6123–6131. [Google Scholar] [CrossRef]
  29. Wyszkowski, M.; Brodowska, M. Phytoextraction with Maize of Soil Contaminated with Copper after Application of Mineral and Organic Amendments. Agronomy 2020, 10, 1597. [Google Scholar] [CrossRef]
  30. Sato, A.; Takeda, H.; Oyanagi, W.; Nishihara, E.; Murakami, M. Reduction of cadmium uptake in spinach (Spinacia oleracea L.) by soil amendment with animal waste compost. J. Hazard. Mater. 2010, 181, 298–304. [Google Scholar] [CrossRef]
  31. Jones, K.; Johnstol, A. Cadmium in cereal grain and herbage from long-term experimental plots at Rothamsted, UK. Environ. Pollut. 1989, 57, 199–216. [Google Scholar] [CrossRef]
  32. Douglas, J.T.; Aitken, M.N.; Smith, C.A. Effects of five non-agricultural organic wastes on soil composition, and on the yield and nitrogen recovery of Italian ryegrass. Soil Use Manag. 2003, 19, 135–138. [Google Scholar] [CrossRef]
  33. Warman, P.R.; Termeer, W.C. Evaluation of sewage sludge, septic waste and sludge compost applications to corn and forage: Ca, Mg, S, Fe, Mn, Cu, Zn and B content of crops and soils. Bioresour. Technol. 2005, 96, 1029–1038. [Google Scholar] [CrossRef] [PubMed]
  34. Heurtaux, M.; Michaud, A.; Bell, A.; Houot, S.; Alexandre, S.; Duparque, A.; Balloy, B.; Schaub, A.; Trochard, R.; Bouthier, A.; et al. Réseau PRO: Field experiment network and data mutualisation tool to study agronomic value and environmental impacts of organic waste residues used in agriculture. Innov. Agron. 2016, 49, 111–132. [Google Scholar]
  35. Giusquiani, P.L.; Gigliotti, G.; Businelli, D. Long-term effects of heavy-metals from composted municipal waste on some enzyme activities in a cultivated soil. Biol. Fertil. Soils 1994, 17, 257–262. [Google Scholar]
  36. McGrath, S.P.; Chaudri, A.M.; Giller, K.E. Long-term effects of metals in sewage-sludge on soils, microorganisms and plants. J. Ind. Microbiol. 1995, 14, 94–104. [Google Scholar] [CrossRef]
  37. Businelli, M.; Gigliotti, G.; Giusquiani, P.L. Trace element fate in soil profile and corn plant after massive applications of urban waste compost: A six-year study. Agrochimica 1996, 40, 145–152. [Google Scholar]
  38. Gigliotti, G.; Businelli, D.; Giusquiani, P.L. Trace metals uptake and distribution in corn plants grown on a 6-year urban waste compost amended soil. Agric. Ecosyst. Environ. 1996, 58, 199–206. [Google Scholar] [CrossRef]
  39. Chaudri, A.M.; Allain, C.M.G.; Barbosa-Jefferson, V.L.; Nicholson, F.A.; Chambers, B.J.; McGrath, S.P. A study of the impacts of Zn and Cu on two rhizobial species in soils of a long-term field experiment. Plant Soil 2000, 221, 167–179. [Google Scholar] [CrossRef]
  40. Chaudri, A.; McGrath, S.; Gibbs, P.; Chambers, B.; Carlton-Smith, C.; Godley, A.; Bacon, J.; Campbell, C.; Aitken, M. Cadmium availability to wheat grain in soils treated with sewage sludge or metal salts. Chemosphere 2007, 66, 1415–1423. [Google Scholar] [CrossRef] [PubMed]
  41. Weber, J.; Karczewska, A.; Drozd, J.; Licznar, M.; Licznar, S.; Jamroz, E.; Kocowicz, A. Agricultural and ecological aspects of a sandy soil as affected by the application of municipal solid waste composts. Soil Biol. Biochem. 2007, 39, 1294–1302. [Google Scholar] [CrossRef]
  42. Uprety, D.; Hejcman, M.; Szakova, J.; Kunzova, E.; Tlustos, P. Concentration of trace elements in arable soil after long-term application of organic and inorganic fertilizers. Nutr. Cycl. Agroecosyst. 2009, 85, 241–252. [Google Scholar] [CrossRef]
  43. Hamner, K.; Kirchmann, H. Trace element concentrations in cereal grain of long-term field trials with organic fertilizer in Sweden. Nutr. Cycl. Agroecosyst. 2015, 103, 347–358. [Google Scholar] [CrossRef]
  44. Charlton, A.; Sakrabani, R.; Tyrrel, S.; Casado, M.R.; McGrath, S.P.; Crooks, B.; Cooper, P.; Campbell, C.D. Long-term impact of sewage sludge application on soil microbial biomass: An evaluation using metaanalysis. Environ. Pollut. 2016, 219, 1021–1035. [Google Scholar] [CrossRef] [Green Version]
  45. Delschen, T. Impacts of long-term application of organic fertilizers on soil quality parameters in reclaimed loess soils of the Rhineland lignite mining area. Plant Soil 1999, 213, 43–54. [Google Scholar] [CrossRef]
  46. Houot, S.; Clergeot, D.; Michelin, J.; Francou, C.; Bourgeois, S.; Caria, G.; Ciesielski, H. Agronomic value and environmental impacts of urban composts used in agriculture. In Microbiology of Composting; Insam, H., Riddech, N., Klammer, S., Eds.; Springer: Berlin/Heidelberg, Germany, 2002; pp. 457–472. [Google Scholar]
  47. Riber, L.; Poulsen, P.H.B.; Al-Soud, W.A.; Hansen, L.B.S.; Bergmark, L.; Brejnrod, A.; Norman, A.; Hansen, L.H.; Magid, J.; Sorensen, S.J. Exploring the immediate and long-term impact on bacterial communities in soil amended with animal and urban organic waste fertilizers using pyrosequencing and screening for horizontal transfer of antibiotic resistance. FEMS Microbiol. Ecol. 2014, 90, 206–224. [Google Scholar] [CrossRef]
  48. Grüter, R.; Costerousse, B.; Mayer, J.; Mader, P.; Thonar, C.; Frossard, E.; Schulin, R.; Tandy, S. Long-term organic matter application reduces cadmium but not zinc concentrations in wheat. Sci. Total Environ. 2019, 669, 608–620. [Google Scholar] [CrossRef] [PubMed] [Green Version]
  49. Escobedo-Monge, M.; Aparicio, S.; Marugan-Miguelsanz, J. Long-Term Effects of the Application of Urban Waste Compost and Other Organic Amendments on Solanum tuberosum L. Agronomy 2020, 10, 1575. [Google Scholar] [CrossRef]
  50. Zhen, H.; Jia, L.; Huang, C.; Qiao, Y.; Li, J.; Li, H.; Chen, Q.; Wan, Y. Long-term effects of intensive application of manure on heavy metal pollution risk in protected-field vegetable production. Environ. Pollut. 2020, 263, 1–10. [Google Scholar] [CrossRef] [PubMed]
  51. Lashermes, G.; Nicolardot, B.; Parnaudeau, V.; Thuriès, L.; Chaussod, R.; Guillotin, M.L.; Linères, M.; Mary, B.; Metzger, L.; Morvan, T.; et al. Indicator of potential residual carbon in soils after exogenous organic matter application. Eur. J. Soil Sci. 2009, 60, 297–310. [Google Scholar] [CrossRef]
  52. Obriot, F.; Stauffer, M.; Goubard, Y.; Cheviron, N.; Peres, G.; Eden, M.; Revallier, A.; Vieuble-Gonod, L.; Houot, S. Multi-criteria indices to evaluate the effects of repeated organic amendment applications on soil and crop quality. Agric. Ecosyst. Environ. 2016, 232, 165–178. [Google Scholar] [CrossRef]
  53. McBride, M.B.; Spiers, G. Trace element content of selected fertilizers and dairy manures as determined by ICP-MS. Commun. Soil Sci. Plant Anal. 2001, 32, 139–156. [Google Scholar] [CrossRef]
  54. Zhang, F.; Zhang, Y.L.; Ming, Y.; Wei, L. Content of Heavy Metals in Animal Feeds and Manures from Farms of Different Scales in Northeast China. Int. J. Environ. Res. Public Health 2012, 9, 2658–2668. [Google Scholar] [CrossRef] [Green Version]
  55. Alvarenga, P.; Mourinha, C.; Farto, M.; Santos, T.; Palma, P.; Sengo, J.; Morais, M.C.; Cunha-Queda, C. Sewage sludge, compost and other representative organic wastes as agricultural soil amendments: Benefits versus limiting factors. Waste Manag. 2015, 40, 44–52. [Google Scholar] [CrossRef]
  56. EU Law and Publications. Regulation (EU) 2019/1009 of the European Parliament and of the Council of 5 June 2019 Laying Down Rules on the Making Available on the Market of EU Fertilising Products and Amending Regulations (EC) No 1069/2009 and (EC) No 1107/2009 and Repealing Regulation (EC) No 2003/2003; UE 2019/1009; EU Law and Publications: Luxembourg, 2019. [Google Scholar]
  57. Draft Decree Concerning Criteria for Agronomic Quality and Safety depending on Use Conditions for Fertilising Products and Culture Supplies. Available online: https://rispo.org/themes/fichiers/projet-decret-socle-commun.pdf (accessed on 31 March 2021).
  58. Saby, N.; Bertouy, B.; Boulonne, L.; Bispo, A.; Ratié, C.; Jolivet, C. Summary Statistics from RMQS on Agronomic Data and Trace Elements in French Soils of 0 to 50 cm; Portail Data INRAE: Paris, France, 2019. [Google Scholar] [CrossRef]
  59. Smolders, E.; Oorts, K.; Lombi, E.; Schoeters, I.; Ma, Y.B.; Zrna, S.; McLaughlin, M.J. The availability of copper in soils historically amended with sewage sludge, manure, and compost. J. Environ. Qual. 2012, 41, 1–9. [Google Scholar] [CrossRef]
  60. Agreste. Available online: https://agreste.agriculture.gouv.fr/ (accessed on 5 January 2021).
  61. Feix, I.; Tremel, A. Soil Contamination, Soil-Plant Transfer; Edp Sciences: Paris, France, 2005; p. 53. [Google Scholar]
  62. Food and Agriculture Organization. Codex Alimentarius. International Standards for Food; Food and Agriculture Organization of the United Nations: Rome, Italy, 2015. [Google Scholar]
  63. Woodbury, P. Trace-elements in municipal solid-waste composts—A review of potential detrimental effects on plants, soil biota, and water-quality. Biomass Bioenergy 1992, 3, 239–259. [Google Scholar] [CrossRef]
  64. Van Herwijnen, R.; Hutchings, T.; Ai-Tabbaa, A.; Moffat, A.; Johns, M.; Ouki, S. Remediation of metal contaminated soil with mineral-amended composts. Environ. Pollut. 2007, 150, 347–354. [Google Scholar] [CrossRef] [PubMed]
  65. Viala, Y.; Laurette, J.; Denaix, L.; Gourdain, E.; Meleard, B.; Nguyen, C.; Schneider, A.; Sappin-Didier, V. Predictive statistical modelling of cadmium content in durum wheat grain based on soil parameters. Environ. Sci. Pollut. Res. 2017, 24, 20641–20654. [Google Scholar] [CrossRef] [PubMed]
  66. Girard, M.C.; Walter, C.; Rémy, J.C.; Berthelin, J.; Morel, J.L. Soils and Environment; Dunod: Paris, France, 2011; p. 881. [Google Scholar]
  67. Borjesson, G.; Kirchmann, H.; Katterer, T. Four Swedish long-term field experiments with sewage sludge reveal a limited effect on soil microbes and on metal uptake by crops. J. Soils Sediments 2014, 14, 164–177. [Google Scholar] [CrossRef] [Green Version]
  68. Moreno-Jiménez, E.; Fernández, J.M.; Puschenreiter, M.; Williams, P.N.; Moreno-Jimenez, C.P. Availability and transfer to grain of As, Cd, Cu, Ni, Pb and Zn in a barley agri-system: Impact of biochar, organic and mineral fertilizers. Agric. Ecosyst. Environ. 2016, 219, 171–178. [Google Scholar] [CrossRef]
  69. Adams, M.; Zhao, F.; McGrath, S.; Nicholson, F.; Chambers, B. Predicting cadmium concentrations in wheat and barley grain using soil properties. J. Environ. Qual. 2004, 33, 532–541. [Google Scholar] [CrossRef] [PubMed]
  70. Kirkham, M. Cadmium in plants on polluted soils: Effects of soil factors, hyperaccumulation, and amendments. Geoderma 2006, 137, 19–32. [Google Scholar] [CrossRef]
Figure 1. Experimental plan of the QualiAgro site, with the following organic waste product (OWP) treatments applied: co-compost of sewage sludge and green waste (Q-GWS), biowaste compost (Q-BIOW), compost of residual municipal solid waste (Q-MSW), farmyard manure (Q-FYM) and no organic amendment (Q-CN).
Agronomy 11 00664 g001
Figure 2. Experimental plan of the PROspective site, with the following OWP treatments applied: sewage sludge (P-SLU), co-compost of sewage sludge and green waste (P-GWS), biowaste compost (P-BIOW), farmyard manure (P-FYM), compost of farmyard manure (P-CFYM) and no organic amendment (P-CN).
Agronomy 11 00664 g002
Figure 3. Principal component analysis of soil chemical properties for both experimental sites, after 13–15 years of OWP spreading (n = 44); see Figure 1 and Figure 2 for treatments signification.
Agronomy 11 00664 g003
Figure 4. Principal component analysis of soil trace elements concentrations for both sites, after 13–15 years of OWP spreading (n = 44); see Figure 1 and Figure 2 for treatments signification.
Agronomy 11 00664 g004
Figure 5. Multiple log–log linear regression studies for trace elements measured in plantlets at both sites, for Cd (a), Cu (b), Mn (c), Mo (d), Ni (e) and Tl (f), with the following data presented: Number of values = 44, with lower and upper bounds (95%). See Figure 1 and Figure 2 for treatments signification.
Agronomy 11 00664 g005
Figure 6. Multiple log–log linear regression studies for trace elements (TEs) measured in plantlets at QualiAgro site, for Cd (a), Mn (b), Mo (c), Ni (d) and Tl (e), with the following data presented: number of values = 44, with lower and upper bounds (95%). See Figure 1 for treatments signification.
Agronomy 11 00664 g006
Table 1. Characteristics of the organic waste products, with the following data presented: average values for the period 1998–2013 ± standard deviations (n = 8 for QualiAgro, n = 7 for PROspective), average and cumulated input amount expressed as ton of dry matter (DM) per hectare, dry matter (DM) expressed as percentage of fresh matter (FM), pH, CaCO3 and organic carbon (OC) content, content of total and Olsen phosphorus (total/Olsen P2O5), total content of nitrogen (N) and potassium (K). See Figure 1 and Figure 2 for treatments signification.
TreatmentAverage AmountDMpHCaCO3OC
t DM ha−1% FM g kg−1 DMg kg−1 DM
Q-GWS16.4 ± 2.963.3 ± 8.77.5 ± 0.725.8 ± 11.1265.6 ± 47.7
Q-BIOW19.1 ± 4.470.1 ± 9.18.1 ± 0.599.0 ± 59.6207.8 ± 49.8
Q-MSW12.0 ± 3.467.7 ± 12.97.5 ± 0.569.8 ± 24.2308.3 ± 47.7
Q-FYM13.2 ± 2.139.9 ± 9.69.1 ± 0.247.2 ± 17.8319.9 ± 71.6
P-SLU2.7 ± 0.517.6 ± 1.57.2 ± 0.714.6 ± 8.0370.7 ± 32.7
P-GWS7.3 ± 1.752.6 ± 7.17.6 ± 0.430.7 ± 14.2293.6 ± 54.7
P-BIOW8.3 ± 1.760.4 ± 14.18.5 ± 0.478.9 ± 32.5244.7 ± 20.4
P-FYM6.9 ± 1.319.4 ± 1.59.5 ± 0.432.6 ± 7.3394.9 ± 20.9
P-CFYM6.0 ± 0.818.8 ± 2.19.4 ± 0.448.0 ± 17.8356.5 ± 30.3
Cumulated AmountTotal NOlsen P2O5Total P2O5K
t DM ha−1g kg−1 DMg kg−1 DMg kg−1 DMg kg−1 DM
Q-GWS131.123.4 ± 2.91.5 ± 0.729.7 ± 8.314.5 ± 4.8
Q-BIOW152.417.4 ± 4.81.0 ± 0.311.0 ± 4.121.0 ± 3.1
Q-MSW96.317.6 ± 2.20.5 ± 0.28.0 ± 1.810.4 ± 3.2
Q-FYM105.521.9 ± 3.33.1 ± 0.912.6 ± 2.535.6 ± 2.7
P-SLU18.661.0 ± 4.05.0 ± 0.866.8 ± 3.56.1 ± 1.4
P-GWS51.024.6 ± 2.71.6 ± 0.531.1 ± 7.712.9 ± 5.7
P-BIOW58.020.0 ± 3.50.9 ± 0.410.1 ± 1.621.7 ± 4.2
P-FYM48.326.5 ± 3.54.5 ± 1.115.2 ± 4.037.9 ± 6.6
P-CFYM42.025.8 ± 1.73.9 ± 0.417.3 ± 2.939.5 ± 5.8
Table 2. Trace element concentrations (mg kg−1 DM; DM for dry matter) in the organic waste products, as compared to French (NFU) and recent European regulations levels [10,11,56,57], with the following data presented: average values for the period 1998–2013 ± standard deviations (n = 8 for QualiAgro, n = 7 for PROspective). See Figure 1 and Figure 2 for treatments signification. <quantification limit (QL): at least half of values were lower than the quantification limit; na for not available.
TreatmentCdCrCuHgMn
mg kg−1 DMmg kg−1 DMmg kg−1 DMmg kg−1 DMmg kg−1 DM
Q-GWS1.1 ± 0.739.4 ± 7.8170.1 ± 44.10.9 ± 0.3378.7 ± 68.1
Q-BIOW0.8 ± 0.739.6 ± 14.765.7 ± 25.20.2 ± 0.1478.2 ± 245.5
Q-MSW1.3 ± 0.787.1 ± 60.3134.6 ± 88.90.8 ± 0.8229.0 ± 63.2
Q-FYM1.2 ± 1.236.4 ± 24.2101.3 ± 71.70.1 ± 0.0328.2 ± 94.6
P-SLU1.0 ± 0.235.7 ± 4.2279.8 ± 37.81.1 ± 0.5116.8 ± 24.7
P-GWS0.7 ± 0.343.8 ± 9.2171.2 ± 43.80.7 ± 0.3320.5 ± 80.8
P-BIOW<QL45.9 ± 26.686.7 ± 51.60.3 ± 0.3439.5 ± 145.4
P-FYM<QL6.7 ± 2.730.9 ± 11.00.0 ± 0.0224.7 ± 37.1
P-CFYM<QL9.1 ± 3.634.5 ± 10.40.0 ± 0.0278.0 ± 35.7
NFU3.0120.0300.02.0na
European2.0120.0300.01.0na
MoNiPbTlZn
mg kg−1 DMmg kg−1 DMmg kg−1 DMmg kg−1 DMmg kg−1 DM
Q-GWSna28.2 ± 7.462.0 ± 11.3na397.5 ± 91.8
Q-BIOWna26.9 ± 25.386.1 ± 55.2na244.8 ± 102.9
Q-MSWna29.1 ± 18.4143.0 ± 92.9na349.2 ± 182.1
Q-FYMna13.1 ± 9.4127.7 ± 129.5na357.8 ± 195.3
P-SLU7.6 ± 1.930.3 ± 8.048.1 ± 15.20.18 ± 0.03546.3 ± 89.5
P-GWS4.6 ± 1.427.3 ± 6.154.6 ± 16.30.28 ± 0.16421.2 ± 110.1
P-BIOW3.1 ± 2.318.9 ± 9.577.8 ± 48.90.37 ± 0.06265.4 ± 106.2
P-FYM2.5 ± 0.93.9 ± 1.11.8 ± 0.60.04 ± 0.01155.4 ± 72.4
P-CFYM2.9 ± 1.04.7 ± 1.53.5 ± 1.10.07 ± 0.02165.1 ± 65.3
NFUna60.0180.0na600.0
Europeanna50.0120.0na800.0
Table 3. Cumulated flux of trace elements in 10 years of spreading by organic waste products (kg ha−1) as compared to the French regulation level (NFU) [10,11], with the following data presented: See Figure 1 and Figure 2 for treatments signification. For values inferior to the quantification limit (QL) the QL divided by 2 were considered to calculate fluxes, <QL: at least half of values were lower than the QL. na for not available.
TreatmentCdCrCuHgMn
kg ha−1kg ha−1kg ha−1kg ha−1kg ha−1
Q-GWS0.0893.514.60.07432.7
Q-BIOW0.0804.36.80.02051.5
Q-MSW0.0875.68.80.05615.1
Q-FYM0.0862.77.30.00723.7
P-SLU0.0160.64.30.0181.8
P-GWS0.0311.87.00.03114.0
P-BIOW<QL2.44.50.01622.0
P-FYM<QL0.31.20.0029.1
P-CFYM<QL0.31.20.0019.8
NFU0.156.010.00.10na
MoNiPbTlZn
kg ha−1kg ha−1kg ha−1kg ha−1kg ha−1
Q-GWSna2.45.3na34.3
Q-BIOWna3.110.0na26.1
Q-MSWna1.99.3na24.0
Q-FYMna0.99.2na25.7
P-SLU0.120.50.80.00298.6
P-GWS0.181.12.30.012117.6
P-BIOW0.171.04.10.017413.6
P-FYM0.100.20.10.00166.0
P-CFYM0.100.20.10.00255.8
NFUna3.09.0na30.0
Table 4. Chemical properties of the topsoil layer (0–25 cm, sieved <2 mm) at the initial state and after 13 and 15 years of repeated OWP application, compared to average French values with the following data presented: pH, CaCO3 and organic carbon (OC) content, content of Olsen phosphorus (Olsen P2O5), DM for dry matter. At initial state with mean values ± standard deviations for all plots. After 13 and 15 years of repeated OWP application with mean values ± standard deviation of the four replicates (in each site, abc letters stand for significant difference between treatments with Newman–Keuls and Kruskal–Wallis tests). See Figure 1 and Figure 2 for treatments signification. <QL values lower than the quantification limit. na for not available.
TreatmentpHCECCaCO3OCOlsen P2O5
cmol+ kg−1 DMg kg−1 DMg kg−1 DMg kg−1 DM
Q-19987.1 ± 0.29.7 ± 0.8na10.6 ± 0.60.09 ± 0.01
P-20008.3 ± 0.017.1 ± 0.3111.4 ± 11.314.6 ± 0.90.07 ± 0.01
French value *7.111.8na14.60.07
Q-GWS6.8 ± 0.1 (d)9.8 ± 0.6 (a)<QL15.7 ± 0.2 (a)0.18 ± 0.01 (b)
Q-BIOW7.6 ± 0.0 (a)10.7 ± 0.5 (a)<QL16.1 ± 0.4 (a)0.10 ± 0.01 (ab)
Q-MSW7.4 ± 0.1 (b)9.8 ± 0.8 (a)<QL13.2 ± 0.4 (c)0.07 ± 0.00 (a)
Q-FYM7.2 ± 0.1 (c)9.9 ± 0.6 (a)<QL14.9 ± 0.4 (b)0.12 ± 0.01 (ab)
Q-CN6.6 ± 0.2 (e)7.9 ± 0.8 (b)<QL10.5 ± 0.2 (d)0.06 ± 0.00 (a)
P-SLU8.3 ± 0.0 (a)16.8 ± 0.3 (b)124.5 ± 8.8 (a)13.8 ± 0.6 (bc)0.07 ± 0.01 (a)
P-GWS8.2 ± 0.0 (a)17.4 ± 0.1 (a)110.5 ± 7.3 (a)15.1 ± 0.9 (ab)0.07 ± 0.01 (a)
P-BIOW8.3 ± 0.0 (a)17.1 ± 0.1 (ab)116.5 ± 7.9 (a)15.4 ± 0.6 (a)0.04 ± 0.00 (c)
P-FYM8.2 ± 0.0 (a)16.9 ± 0.3 (b)117.3 ± 10.9 (a)14.6 ± 0.3 (ab)0.05 ± 0.00 (b)
P-CFYM8.3 ± 0.0 (a)16.9 ± 0.2 (b)111.3 ± 20.5 (a)14.2 ± 1.1 (ab)0.04 ± 0.01 (c)
P-CN8.3 ± 0.0 (a)16.4 ± 0.3 (c)125.0 ± 10.7 (a)12.8 ± 0.7 (c)0.03 ± 0.01 (c)
* Median values for topsoil layer (0–30 cm) of arable crop systems cited in [58].
Table 5. Trace element concentrations of the topsoil layer (0–25 cm, sieved <2 mm; mg kg−1 DM, DM for dry matter) at the initial state and after 13 and 15 years of OWP spreading, with the following data presented: initial state with mean values ± standard deviations for all plots. After 13 and 15 years of OWP spreading with mean values ± standard deviation of the four replicates (in each site, abc letters stand for significant difference between treatments with Newman–Keuls and Kruskal–Wallis tests). See Figure 1 and Figure 2 for treatments signification. na for not available.
TreatmentCdCrCuHgMn
mg kg−1 DMmg kg−1 DMmg kg−1 DMmg kg−1 DMmg kg−1 DM
Q-19980.24 ± 0.0145.7 ± 3.112.0 ± 1.00.10 ± 0.02na
P-20000.24 ± 0.0075.8 ± 4.124.8 ± 1.90.05 ± 0.01930.0 ± 24.0
French value *0.2356.514.10.04581.5
Q-GWS0.24 ± 0.00 (a)70.4 ± 6.2 (a)18.9 ± 1.1 (a)0.11 ± 0.02 (a)na
Q-BIOW0.23 ± 0.01 (a)68.9 ± 7.5 (a)15.9 ± 1.1 (b)0.08 ± 0.02 (a)na
Q-MSW0.23 ± 0.01 (a)71.8 ± 5.4 (a)16.2 ± 0.6 (b)0.11 ± 0.04 (a)na
Q-FYM0.23 ± 0.01 (a)72.1 ± 1.3 (a)15.9 ± 1.2 (b)0.08 ± 0.02 (a)na
Q-CN0.21 ± 0.01 (b)74.6 ± 4.8 (a)12.9 ± 0.7 (c)0.07 ± 0.01 (a)na
P-SLU0.24 ± 0.00 (a)70.3 ± 1.7 (a)27.3 ± 3.4 (a)0.06 ± 0.01 (a)894.3 ± 12.9 (a)
P-GWS0.25 ± 0.01 (a)73.8 ± 2.8 (a)26.9 ± 1.7 (a)0.05 ± 0.00 (a)905.8 ± 23.0 (a)
P-BIOW0.24 ± 0.00 (a)75.5 ± 3.9 (a)25.5 ± 1.0 (a)0.07 ± 0.02 (a)910.3 ± 16.5 (a)
P-FYM0.24 ± 0.00 (a)74.6 ± 2.2 (a)26.1 ± 3.4 (a)0.05 ± 0.00 (a)894.5 ± 25.4 (a)
P-CFYM0.24 ± 0.01 (a)75.1 ± 2.0 (a)24.5 ± 0.7 (a)0.05 ± 0.02 (a)907.8 ± 12.0 (a)
P-CN0.24 ± 0.00 (a)71.6 ± 1.5 (a)24.2 ± 0.5 (a)0.05 ± 0.01 (a)890.3 ± 13.6 (a)
MoNiPbTlZn
mg kg−1 DMmg kg−1 DMmg kg−1 DMmg kg−1 DMmg kg−1 DM
Q-1998na14.8 ± 0.725.7 ± 4.1na51.6 ± 3.5
P-20000.56 ± 0.0133.9 ± 0.925.3 ± 1.20.63 ± 0.0264.2 ± 5.3
French value *0.5319.325.20.5059.3
Q-GWS0.56 ± 0.02 (a)15.5 ± 0.2 (a)25.2 ± 2.6 (a)0.41 ± 0.01 (a)64.5 ± 1.6 (a)
Q-BIOW0.48 ± 0.01 (b)15.9 ± 0.5 (a)27.9 ± 3.2 (a)0.42 ± 0.01 (a)61.4 ± 2.0 (a)
Q-MSW0.50 ± 0.01 (b)15.7 ± 0.7 (a)26.3 ± 2.6 (a)0.41 ± 0.01 (a)59.9 ± 2.6 (a)
Q-FYM0.51 ± 0.01 (b)15.5 ± 0.8 (a)25.8 ± 1.6 (a)0.41 ± 0.00 (a)60.4 ± 4.1 (a)
Q-CN0.44 ± 0.02 (c)15.5 ± 0.6 (a)22.7 ± 1.7 (a)0.41 ± 0.00 (a)50.6 ± 1.2 (b)
P-SLU0.58 ± 0.01 (b)33.1 ± 0.4 (a)25.9 ± 1.8 (a)0.63 ± 0.00 (a)70.2 ± 8.1 (a)
P-GWS0.60 ± 0.01 (a)33.7 ± 0.6 (a)25.1 ± 0.4 (a)0.64 ± 0.01 (a)70.9 ± 2.5 (a)
P-BIOW0.59 ± 0.00 (ab)33.1 ± 0.5 (a)26.4 ± 1.2 (a)0.63 ± 0.01 (a)67.6 ± 0.6 (a)
P-FYM0.58 ± 0.00 (b)33.4 ± 0.7 (a)25.7 ± 0.8 (a)0.64 ± 0.01 (a)66.8 ± 1.8 (a)
P-CFYM0.58 ± 0.01 (b)33.7 ± 0.4 (a)25.1 ± 1.1 (a)0.64 ± 0.01 (a)67.8 ± 2.5 (a)
P-CN0.55 ± 0.01 (c)33.4 ± 0.2 (a)24.9 ± 0.8 (a)0.63 ± 0.01 (a)67.1 ± 2.5 (a)
* Median values for topsoil layer (0–30 cm) of arable crop systems cited in Saby et al. [58].
Table 6. Biomass of plantlets and grain yields (t DM ha−1, DM for dry matter), with the following data presented: mean values ± standard deviation of the four replicates (in each site, abc letters stand for significant difference between treatments with Newman–Keuls and Kruskal–Wallis tests). See Figure 1 and Figure 2 for treatments signification.
TreatmentPlantletGrain
t DM ha−1t DM ha−1
Q-GWS0.65 ± 0.02 (a)8.0 ± 0.1 (a)
Q-BIOW0.63 ± 0.02 (a)7.5 ± 0.3 (b)
Q-MSW0.57 ± 0.04 (a)6.9 ± 0.3 (c)
Q-FYM0.63 ± 0.05 (a)7.3 ± 0.4 (b)
Q-CN0.41 ± 0.09 (b)6.2 ± 0.2 (d)
P-SLU0.013 ± 0.002 (a)10.37 ± 0.31 (a)
P-GWS0.014 ± 0.002 (a)10.31 ± 0.51 (a)
P-BIOW0.012 ± 0.002 (a)9.72 ± 0.83 (a)
P-FYM0.014 ± 0.001 (a)10.24 ± 0.38 (a)
P-CFYM0.014 ± 0.002 (a)10.35 ± 0.31 (a)
P-CN0.012 ± 0.002 (a)10.26 ± 0.31 (a)
Table 7. Plantlet trace element concentrations (mg kg−1 DM, DM for dry matter), with the following data presented: mean values ± standard deviation of the four replicates (in each site, abc letters stand for significant difference between treatments with Newman–Keuls and Kruskal–Wallis tests). See Figure 1 and Figure 2 for treatments signification. <QL: at least half of values were lower than the quantification limit.
TreatmentCdCrCuHgMn
mg kg−1 DMmg kg−1 DMmg kg−1 DMmg kg−1 DMmg kg−1 DM
Q-GWS0.06 ± 0.01 (ab)0.06 ± 0.02 (a)5.2 ± 1.1 (a)<QL42.9 ± 4.4 (b)
Q-BIOW0.04 ± 0.00 (a)0.05 ± 0.01 (a)4.2 ± 0.4 (a)<QL45.1 ± 6.4 (b)
Q-MSW0.05 ± 0.01 (ab)0.05 ± 0.01 (a)4.7 ± 0.1 (a)<QL46.4 ± 6.1 (b)
Q-FYM0.05 ± 0.01 (ab)0.05 ± 0.00 (a)4.3 ± 0.4 (a)<QL41.5 ± 4.2 (b)
Q-CN0.13 ± 0.03 (b)0.05 ± 0.01 (a)4.6 ± 0.4 (a)<QL59.6 ± 5.3 (a)
P-SLU0.04 ± 0.00 (a)0.45 ± 0.00 (a)7.0 ± 0.1 (a)<QL76.5 ± 1.1 (a)
P-GWS0.04 ± 0.00 (a)0.53 ± 0.10 (a)6.8 ± 0.4 (a)<QL83.0 ± 9.5 (a)
P-BIOW0.04 ± 0.00 (a)0.48 ± 0.01 (a)6.2 ± 0.1 (a)<QL72.3 ± 1.7 (a)
P-FYM0.04 ± 0.00 (a)0.57 ± 0.01 (a)6.6 ± 0.0 (a)<QL76.9 ± 0.3 (a)
P-CFYM0.04 ± 0.00 (a)0.54 ± 0.01 (a)6.7 ± 0.1 (a)<QL91.2 ± 2.6 (a)
P-CN0.04 ± 0.00 (a)0.56 ± 0.01 (a)7.1 ± 0.1 (a)<QL86.4 ± 1.5 (a)
MoNiPbTlZn
mg kg−1 DMmg kg−1 DMmg kg−1 DMmg kg−1 DMmg kg−1 DM
Q-GWS4.8 ± 0.4 (a)0.41 ± 0.16 (ab)0.09 ± 0.02 (a)0.0004 ± 0.0002 (b)19.6 ± 1.5 (b)
Q-BIOW5.1 ± 0.5 (a)0.34 ± 0.10 (ab)0.08 ± 0.03 (a)0.0003 ± 0.0001 (b)16.8 ± 1.3 (ab)
Q-MSW4.4 ± 0.4 (a)0.24 ± 0.07 (b)0.09 ± 0.03 (a)0.0004 ± 0.0001 (b)17.2 ± 0.6 (ab)
Q-FYM4.4 ± 1.0 (a)0.31 ± 0.04 (ab)0.08 ± 0.02 (a)0.0003 ± 0.0001 (b)16.0 ± 3.0 (ab)
Q-CN0.8 ± 0.2 (b)0.46 ± 0.06 (a)0.07 ± 0.01 (a)0.0008 ± 0.0001 (a)14.8 ± 3.8 (a)
P-SLU1.3 ± 0.0 (b)0.95 ± 0.04 (a)0.14 ± 0.00 (ab)0.0025 ± 0.0001 (a)19.3 ± 0.1 (a)
P-GWS1.8 ± 0.4 (a)0.73 ± 0.06 (a)0.16 ± 0.03 (ab)0.0023 ± 0.0007 (a)22.4 ± 2.3 (a)
P-BIOW1.4 ± 0.0 (b)0.82 ± 0.01 (a)0.15 ± 0.00 (ab)0.0022 ± 0.0001 (a)21.5 ± 0.2 (a)
P-FYM1.2 ± 0.0 (b)0.82 ± 0.02 (a)0.19 ± 0.00 (a)0.0019 ± 0.0000 (a)22.4 ± 0.4 (a)
P-CFYM1.0 ± 0.0 (b)0.68 ± 0.01 (a)0.13 ± 0.00 (b)0.0015 ± 0.0000 (a)23.4 ± 1.0 (a)
P-CN1.0 ± 0.0 (b)0.75 ± 0.01 (a)0.16 ± 0.00 (ab)0.0026 ± 0.0000 (a)26.1 ± 1.2 (a)
Table 8. Trace element concentrations in consumable grains (mg kg−1 DM, DM for dry matter), with the following data presented: mean values ± standard deviation of the four replicates (in each site, abc letters stand for significant difference between treatments with Newman–Keuls and Kruskal–Wallis tests). See Figure 1 and Figure 2 for treatments signification. <QL: at least half of values were lower than the quantification limit. na for not available.
TreatmentCdCrCuHgMn
mg kg−1 DMmg kg−1 DMmg kg−1 DMmg kg−1 DMmg kg−1 DM
Q-GWS0.02 ± 0.00 (a)<QL3.9 ± 0.3 (a)<QL28.3 ± 1.5 (b)
Q-BIOW0.02 ± 0.00 (a)<QL4.0 ± 0.1 (a)<QL29.6 ± 1.8 (b)
Q-MSW0.02 ± 0.00 (ab)<QL4.1 ± 0.4 (a)<QL30.2 ± 1.2 (b)
Q-FYM0.03 ± 0.01 (ab)<QL4.2 ± 0.2 (a)<QL30.2 ± 2.7 (b)
Q-CN0.04 ± 0.00 (b)<QL4.1 ± 0.1 (a)<QL38.8 ± 1.2 (a)
P-SLU<QL0.05 ± 0.04 (a)1.1 ± 0.1 (a)<QL3.8 ± 0.2 (a)
P-GWS<QL0.09 ± 0.00 (a)1.4 ± 0.4 (a)<QL3.7 ± 0.2 (a)
P-BIOW<QL0.06 ± 0.06 (a)1.2 ± 0.2 (a)<QL3.5 ± 0.1 (a)
P-FYM<QL0.07 ± 0.03 (a)1.0 ± 0.1 (a)<QL3.7 ± 0.1 (a)
P-CFYM<QL0.05 ± 0.05 (a)1.2 ± 0.2 (a)<QL3.7 ± 0.2 (a)
P-CN<QL0.05 ± 0.04 (a)1.1 ± 0.2 (a)<QL3.7 ± 0.2 (a)
(1)0.030.104.50.0140.0
(2)0.02–0.070.0002–0.0041.3–10<0.0348–103
(3)na0.22–0.29na<0.073na
(4)0.10nananana
MoNiPbTlZn
mg kg−1 DMmg kg−1 DMmg kg−1 DMmg kg−1 DMmg kg−1 DM
Q-GWS1.0 ± 0.2 (a)0.08 ± 0.02 (ab)< QL (a)na27.9 ± 1.4 (a)
Q-BIOW1.6 ± 0.1 (ab)0.05 ± 0.01 (a)0.05 ± 0.02 (a)na27.5 ± 1.8 (a)
Q-MSW2.6 ± 0.7 (b)0.12 ± 0.07 (ab)0.04 ± 0.01 (a)na27.6 ± 1.5 (a)
Q-FYM2.0 ± 0.2 (b)0.07 ± 0.02 (ab)0.05 ± 0.01 (a)na27.6 ± 1.0 (a)
Q-CN1.7 ± 0.2 (ab)0.19 ± 0.01 (b)0.05 ± 0.02 (a)na27.2 ± 1.4 (a)
P-SLU0.17 ± 0.02 (a)0.23 ± 0.05 (a)<QL<QL17.9 ± 0.7 (b)
P-GWS0.18 ± 0.01 (a)0.30 ± 0.08 (a)<QL<QL18.9 ± 0.8 (ab)
P-BIOW0.18 ± 0.03 (a)0.27 ± 0.05 (a)<QL<QL19.3 ± 0.5 (a)
P-FYM0.16 ± 0.01 (a)0.27 ± 0.03 (a)<QL<QL19.3 ± 0.6 (a)
P-CFYM0.17 ± 0.02 (a)0.29 ± 0.03 (a)<QL<QL18.7 ± 0.2 (ab)
P-CN0.19 ± 0.03 (a)0.29 ± 0.03 (a)<QL<QL18.9 ± 0.5 (ab)
(1)0.300.300.50na25.0
(2)na0.17–0.670.005–0.6na23.0–37.0
(3)nananana25–36
(4)nana0.20nana
(1) Wheat grains [61]; (2) wheat grains [18]; (3) maize cobs/grains [18]; (4) cereal grains [62].
Table 9. Selected results of stepwise multiple log–log linear regression (MLR) studies and associated statistics, with the following data presented: Pl for Plantlet, Q for QualiAgro, P for PROspective and OC for organic carbon.
SiteMLR ForEquation ¤Nr2adjRMSEp Value
Q/PLog10(CdPl)=0.823 − 0.236 × pH *** − 1.432 × log10(OC) *** + 0.583 × log10(Clay) *440.790.076<0.0001
Q/PLog10(CuPl)=0.484 − 0.510 × log10(OC) ** + 0.648 × log10(Cu) ***440.770.047<0.0001
Q/PLog10(MnPl)=4.965 × 10−2 − 0.669 × log10(OC) ** + 1.103 × log10(Clay) ***440.760.068<0.0001
Q/PLog10(MoPl)=2.371 + 0.164 × pH * + 2.870 × log10(OC) *** − 2.919 × log10(Clay) ***440.830.126<0.0001
Q/PLog10(NiPl)=−4.573 − 0.130 × pH * + 2.325 × log10(Clay) ***440.720.115<0.0001
Q/PLog10(TlPl)=1.511 − 0.213 × pH * − 1.220 × log10(OC) ** + 5.189 × log10(Tl) ***440.890.136<0.0001
QLog10(CdPl)=2.224 − 0.195 × pH ** − 1.804 × log10(OC) ***200.840.081<0.0001
QLog10(MnPl)=2.500 − 0.729 × log10(OC) ***200.480.052<0.0001
QLog10(MoPl)=−2.562 + 0.365 × pH *** + 1.444 × log10(OC) + 3.863 × log10(Mo) **200.890.104<0.0001
QLog10(NiPl)=0.920 − 0.196 × pH **200.280.119<0.01
QLog10(TlPl)=−0.511 − 0.206 × pH* − 1.250 × log10(OC) *200.600.121<0.0001
PLog10(MoPl)=1.147 + 4.455 × log10(Mo) **240.260.091<0.01
PLog10(NiPl)=11.172 − 7.408 × log10(Ni) *240.190.092<0.05
¤ Exclusion of variable if p value > 0.1; N number of observations, r2adj adjusted r-square error, RMSE root mean square error; * p value < 0.05; ** p value < 0.01; *** p value < 0.001 (statistical significance).
Publisher’s Note: MDPI stays neutral with regard to jurisdictional claims in published maps and institutional affiliations.

