Article

Agronomic Efficiency Losses by Ammonia Emission from Staple Crops in China as Response to Various Mitigation Strategies: A Meta-Analysis Study

1
Guangdong Provincial Key Laboratory of Eco-Circular Agriculture, South China Agricultural University, Guangzhou 510642, China
2
Soil Science Department, Faculty of Agriculture, Zagazig University, Zagazig 44519, Egypt
3
Department of Ecology, College of Natural Resources and Environment, South China Agricultural University, Guangzhou 510642, China
4
Guangdong Engineering Technology Research Centre of Modern Eco-Agriculture and Circular Agriculture, Guangzhou 510642, China
5
Agronomy Department, Faculty of Agriculture, Zagazig University, Zagazig 44519, Egypt
6
Key Laboratory of Agro-Environment in the Tropics, Ministry of Agriculture and Rural Affairs, South China Agricultural University, Guangzhou 510642, China
*
Author to whom correspondence should be addressed.
Agronomy 2021, 11(12), 2593; https://doi.org/10.3390/agronomy11122593
Submission received: 9 November 2021 / Revised: 6 December 2021 / Accepted: 7 December 2021 / Published: 20 December 2021

Abstract

:
Economic losses and environmental hazards are meaningful problems of emitted ammonia induced by extensive use of synthetic nitrogen fertilizers. The concept presented as yield scaled fertilizer productivity (YSFP) in our meta-analysis in addition to nitrogen use efficiency (NUE), nitrogen agronomic efficiency (NAE), and productivity of applied nitrogen (PAN) were used to weight ammonia emission (AV)-induced reductions in wheat, maize, and rice production. The comprehensive meta-analysis was used to weight the reductions in these parameters by AV as the difference between observed means of the collected studies and their adjusted means using AV factor. There were higher reductions in agronomic production induced by AV in rice than maize and wheat. AV-induced reductions in PAN of rice, maize, and wheat were decreased by 4.99, 3.71, and 2.42 (kg grains kg−1 N), respectively. YSFP and PAN recorded the highest sensitivity to AV in wheat (R2 = 0.88 for both) and rice (R2 = 0.92 and 0.89, respectively), while NUE was the most efficient parameter in weighting AV induced agronomic effects in maize (R2 = 0.81). Slow-released N fertilizers resulted in the lowest reductions in AV induced agronomic losses followed by organic amendments and then urea while using other synthetic fertilizers recorded the highest reductions by 3.90, 6.40, 1.41, and 4.70 in YSFP, NUE, NAE, and PAN, respectively. Inhibitors had the highest effect on mitigating AV induced agronomic losses compared with biochar and mulching and affected the parameters following that order as percentages of no amendments, YSFP (52.63%) > PAN (47.18%) > NUE (40.83%) > NAE (38.75%). This study outlines the reductions in agronomic production induced by AV and weights the efficiency of various mitigation strategies under various agronomic conditions. The results proved the efficiency of YSFP with NUE parameters to weight the effect of AV on crop yield, while suggesting to find out more applicable parameters in further studies.

1. Introduction

Wheat, maize, and rice are the most important field crops worldwide with a harvested area of 2.40, 2.38, and 1.92 × 10⁸ ha during 2019, respectively. China is the main producer of these crops by an average yield of 133.6, 260.96, and 211.41 Tg in 2019 [1] through intensive cultivation systems. Nitrogen fertilization is the main input that increased from 0.88 Tg to 26.1 Tg from 1961 to 2016 [2], however, this increase was accompanied by a sharp reduction in nitrogen use efficiency (NUE) from 65.0% to 25.0% from 1961 to 2010 [3]. That means that a large quantity of reactive N (~270 kg N ha−1 yr−1) is being lost to the environment [4]. The main path of N losses is ammonia volatilization (AV), accounting for 10–60% of the total N losses, which has notable adverse environmental impacts and influences global, regional, and local nitrogen cycles [5]. The emitted ammonia from N fertilizers to the atmosphere was determined as 60% and expected to increase dramatically under the accelerated growth in fertilizer use [6]. The emitted ammonia from wheat, maize, and rice in China was 2.24, 4.75, and 3.69 Tg, respectively, causing significant economic losses and environmental hazards [7].
Emitting ammonia from farmlands is controlled by numerous factors including agronomic conditions [air temperature and precipitation, soil moisture, soil texture, aeration, pH, soil organic matter content (SOM), soil total N content (STN), and cation exchange capacity (CEC)] and agronomic practices (fertilizer type, application rate and depth, tillage system, mulching, organic and inorganic amendments, and irrigation scheduling) [8,9,10,11]. The AV reduces with increased clay content due to adsorbing ammonium (NH4+), increasing water retention, and decreasing aeration by clay. AV from N fertilizers was 1.2 to 2.0% in clay soil [12], 9.5% in light loamy soil [13], and around 20.0% in sandy loam soil [14]. Higher hydroxyl anion (OH) concentration under high soil pH conditions means higher AV because of the high deprotonation of NH4+ to NH3 [15]. The activity of urease enzyme and reaction equilibrium constant for hydrolysis of N fertilizers and the NH3 diffusion rate to the atmosphere increase with increasing soil temperature [16]. In contrast, other researchers indicated that air temperature is not a limiting factor of AV [17]. An inverse correlation between AV, precipitation, and soil moisture has been reported [18,19,20], where rainfall of 3 mm after fertilization increased NH3 emissions, while 71.4 mm decreased NH3 volatilization by 84.0% [21].
Appropriate agronomy practices play a notable role in controlling the losses of N fertilizers through AV [18]. The most common effective strategy to mitigate AV is reducing the amount of N fertilizer, because of the strong positive correlation between the application rate and AV [22]. There are many commercial N fertilizer types that differ in their reactive N content, form, and hydrolysis activity; choosing the appropriate type of agronomic conditions and practices is an alternative strategy to reduce the emitted ammonia. Urea is the most common fertilizer type in China with an average of 65.0% of used fertilizers by main crops (rice, wheat, and maize); however, it recorded the highest AV (49.0–66.0%) when compared with other N types (ammonium nitrate, ammonium sulfate, calcium ammonium nitrate, and ammonium bicarbonate) [23,24]. Coating urea with sulfur and polymers, for example, reduces its hydrolysis activity and slows the release of ammonium and nitrate, which reduces AV significantly [25,26,27]. Mixing any N fertilizer type with urease and/or nitrification inhibitors is a recent suggested method for altering AV [28]. Complete or partial replacement of synthetic N fertilizers with organic amendments has been reported as an effective alternative to mitigate AV [29,30]. Recently, an enormous attention was directed to the biochar role in AV mitigation [31]. Contrarily, it was reported that AV increased under the application of biochar [26,32,33]. Subsurface placement of N fertilizers is one of the most effective agronomic practices for controlling AV by reducing the exposure to the air [34,35].
Meanwhile, studies so far have been mostly directed at the impact of fertilizer management strategies on either crop yields or AV, leaving synergies, and trade-offs between yield and AV unaddressed [36]. Achieving food security while sustaining environmental quality is important; greenhouse gases are progressively considered concerning crop productivity [37]. Still, despite numerous studies aimed at mitigating AV by improving management practices [38,39], little is known about the impacts of mitigation strategies on yield-scaled AV. The feasibility of applying the chosen strategy for AV mitigation has an economic impact, which is indicated by plant production that is outweighed by the environmental impact of the farmer. The common agronomic parameters are yield-scaled fertilizer productivity or yield-scaled AV (YSFP), nitrogen use efficiency (NUE), nitrogen agronomic efficiency (NAE), and productivity of applied nitrogen (PAN), represented by Equations (4)–(7), respectively (Table 1). YSFP and PAN are functions of yield and applied N rate without taking control into consideration, contrary to NAE, while NUE is a function of changes in nitrogen uptake between treatment and control and the applied N. We hypothesized that these parameters differ in their sensitivity to reflect the effect of AV on crop yield, thus the main objectives were: (1) Testing the sensitivity of agronomic parameters to AV from different crops under various agronomic conditions and practices. (2) Agronomical weighting of AV effects and the efficiency of different mitigation strategies on controlling these impacts.

2. Materials and Methods

2.1. Study Area

China represents a large area of 9.6 × 10⁶ km2, with wide-scale variations in agronomic conditions including climatic conditions and soil properties. There are a wide range of soil textures from sandy (clay content is less than 60 g kg−1) to clay soils (clay content is higher than 600 g kg−1). Soil pH, SOM (g kg−1), and STN (g kg−1) range from 4.2, 5.6, and 0.2 to 9.8, 80, and 4.6, respectively (Table S1) [44,45]. Temporal and spatial variations in climatic conditions are presented across China, wherein air temperature ranges between 3 and 27 °C and the annual precipitation is between 350 and 1600 mm based on the data of the China Meteorological Data Service Center (CMDC) (Table S1).

2.2. Data Collection

Peer-reviewed papers about AV in China from several databases [Google Scholar, Web of Science (ISI), Research Gate, and China National Knowledge Infrastructure (CNKI)] were collected using the keywords “ammonia volatilization” and “ammonia emission”. We searched more than 1200 papers online and downloaded around 400 papers, which included AV (kg ha−1 or as a percentage of the applied N). The following criteria were used to determine the relevance of these papers to our study, thereafter, a total of 132 papers with 1240 datasets were chosen and listed in Table S1. References of these studies are included in the Supplementary Materials.
Experimental details include trial location, type, implementation year, number of replicates, crop type (wheat, maize and rice), climatic conditions (precipitation and temperature), and soil properties (pH, clay content, SOM and STN).
Treatment details and agronomic practices include tillage systems, irrigation, fertilizer rate, and type and methods of application and amendments like organic materials, biochar, mulching, and inhibitors.
AV rate is stated as percent or kg ha−1, grain yield (Mg ha−1), grains N content (g kg−1), N uptake (kg ha−1), NUE (%), NAE (kg kg−1), YSFP (kg N Mg−1 grains), PAN (kg kg−1), standard error (SE), and standard deviation (STD).
Missing climatic data were collected from China Meteorological Data Service Center (CMDC) according to the study implementation year and site, and then we calculated the cumulative precipitation and temperature as a summation of daily observations during the growth period of each crop. Missing soil properties data were collected using other papers implemented at the same experimental site. When the numerical data were not included by a study, AV rates and agronomic attributes were extracted from figures using GetData Graph Digitizer software version 24. We used Equation (8) to calculate missing data of NUE (Equation (5)), then we used AVF (Equation (1)) with Equations (4)–(7) to calculate adjusted YSFPAV, NUEAV, NAEAV, and PANAV (Equations (11)–(14)) (Table 1). All data were input in Microsoft excel 2013 package. Missed STDs were generated using Excel or calculated using coefficient of variance (CV), standard error, t-values, p-values, and confidence interval (CI) using the meta-analysis software and the following equations [46,47]:
S D = S E × n
S D = C V × m e a n
S D = C I m e a n 2 Z α / 2 × n
where n is sample size, α is the significant level, and Z α / 2 = 1.96 when α = 0.05 .

2.3. Calculating the Reductions in Agronomic Parameters by AV and Data Grouping

Firstly, we expressed the AV as ammonia emission factor [AV (%)] (Equation (1)) to avoid the effect of AV from control and adjust it to treatments only. Secondly, the increase in grain yield and N uptake was adjusted (Adj. GYT and Adj. NUT) (Equations (3) and (10)) using the response factor (Equations (2) and (9), respectively). The adjusted YSFPAV, NUEAV, NAEAV, and PANAV were calculated using AV, Adj. GYT, and Adj. NUT as presented by Equations (11)–(14) (Table 1). Data were grouped into three main categories: wheat, maize, and rice. Under each category, datasets were grouped into six classes based on N fertilizer rate (kg N ha−1): (C1) 1–80, (C2) 81–139, (C3) 140–179, (C4) 180–239, (C5) 240–300, and (C6) ≥300. Under class 4 of N rates, nitrogen sources were categorized into four groups: urea (U), other mineral fertilizers (OCF), improved nitrogen fertilizers (IU) including the coated and slow-released N fertilizers, and organic amendments (OA). Amendments were grouped into mulching, biochar, and inhibitors. Application depth of N fertilizers was classified into surface and subsurface applications. More details about grouping are presented by Abdo, Shi, Li, Yang, Wang, Li, Abdel-Hamed, Merwad and Wang [7].

2.4. Data Compilation and Analysis Using Meta-Analysis

Quality control for the collected data was done using different manners wherein, normal distribution for the collected data of AV (kg N ha−1), YSFP (kg N Mg−1 grains), NUE (%), NAE (kg grains kg−1 N), and PAN (kg grains kg−1 N) was carried out using Shapiro–wilk normality test at p < 0.05. We used bootstrap method to estimate the average of SD/mean ratio for none-normal distributed data [46] and generated normal distributed data (Figure S1). Then, publication bias was evaluated at p > 0.05 by Rosenthal’s Fail-safe N test and using Z-values and two-tailed p-values [48]. A heterogeneity test was implemented at p ≤ 0.05 using the software Comprehensive Meta-Analysis (CMA-2), which confirmed that all estimated effect sizes (ESs) were located within 95% confidence interval (CI) limits and the pooled ES. That means the variations were greater than the sampling error. CMA-2 program allows testing the normality of data in a further procedure called Duval and Tweedie’s Trim and Fill, which indicated zero trimmed studies in our analysis. All calculations and equations used for estimating variance, weight, fail-safe N test, Duval and Tweedie’s Trim test, and heterogeneity are provided within CMA-2 [49].
After implementing the quality control, the effect of ammonia volatilization (AV) on decreasing agronomic parameters was calculated as the difference in means between the observed values of these parameters (YSFP, NUE, NAE, and PAN) as X ¯ 1 and the adjusted values when hypothesizing no AV detected (YSFPAV, NUEAV, NAEAV and PANAV) as   X ¯ 2 . We used unmatched groups and pre- and post-data pathways to calculate the effect size for each pairwise comparison with positive effect direction (to avoid the negative signs) [7,50]. Then, pooled effect size (Equation (23)) of each group was calculated and compared between each two groups using the software [7]. Each resultant forest plot in our figures represents the reduction in the investigated agronomic parameter as a result of AV. The following equations were used by our analysis to calculate changes of difference in means [51]:
D = X ¯ 1   X ¯ 2
V D = n 1 + n 2 n 1 n 2 S p o o l e d 2
S p o o l e d = n 1 1 S 1 2 + n 2 1 S 2 2 n 1 + n 2 2
S E D = V D
W = 1 V D + τ 2
E S ¯ = i = 1 k W i E S i i = 1 k W i
where D is the difference in means between meaningful and same scale means, X ¯ 1 and X ¯ 2 are the means of observed and adjusted agronomic parameters, respectively, n1 and n2 are sample sizes of agronomic and adjusted agronomic parameters, S p o o l e d 2 is the squared standard deviation of pooled effect size, V D is variance of difference in means, S E D is the standard error, W is the weight, τ is variance between groups, E S is the effect size for each variable, k is the number of effect sizes within the group, and E S ¯ is pooled effect size of the group.
The differences in response of reductions in agronomic parameters to amendments were calculated as average percentages of each parameter within the three crops using the following equation:
P a r a m e t e r   r e s p o n s e   % = m e a n   d i f f e r e n c e   o f   n o   a m e n d m e n t m e a n   d i f f e r e n c e   o f   a m e n d m e n t m e a n   d i f f e r e n c e   o f   n o   a m e n d m e n t s × 100
The random effect model was chosen as it is more stable with a small standard error-based confidence interval [52]. Path analysis represented by structural equation modeling (SEM) was investigated using Amos 22.0 (IBM; Armonk, NY, USA) to quantify the overall response of agronomic parameters to all agronomic conditions and practices [53]. Constrained multiple regression analysis was done to measure the relation strength between the agronomic parameters and AV. Both rate and depth factors were used in the meta-analysis when studying their effect on the mean differences of agronomic parameters to have acceptable heterogeneity, thus we did regression analysis to measure each single factor contribution in our analysis output. Regression analysis was also done for the amendments effect using rate and amendments to measure the rate contribution in our analysis output. The meta-analysis was done for fertilizer type effect using one fertilizer rate (C4) as we have enough data with acceptable heterogeneity, thus we did not implement the regression analysis between rate and type. All statistics were performed using SPSS Statistics 20 (IBM, Armonk, NY, USA), and figures were drawn using Origin 2021 (OriginLab, Northampton, MA, USA).

3. Results

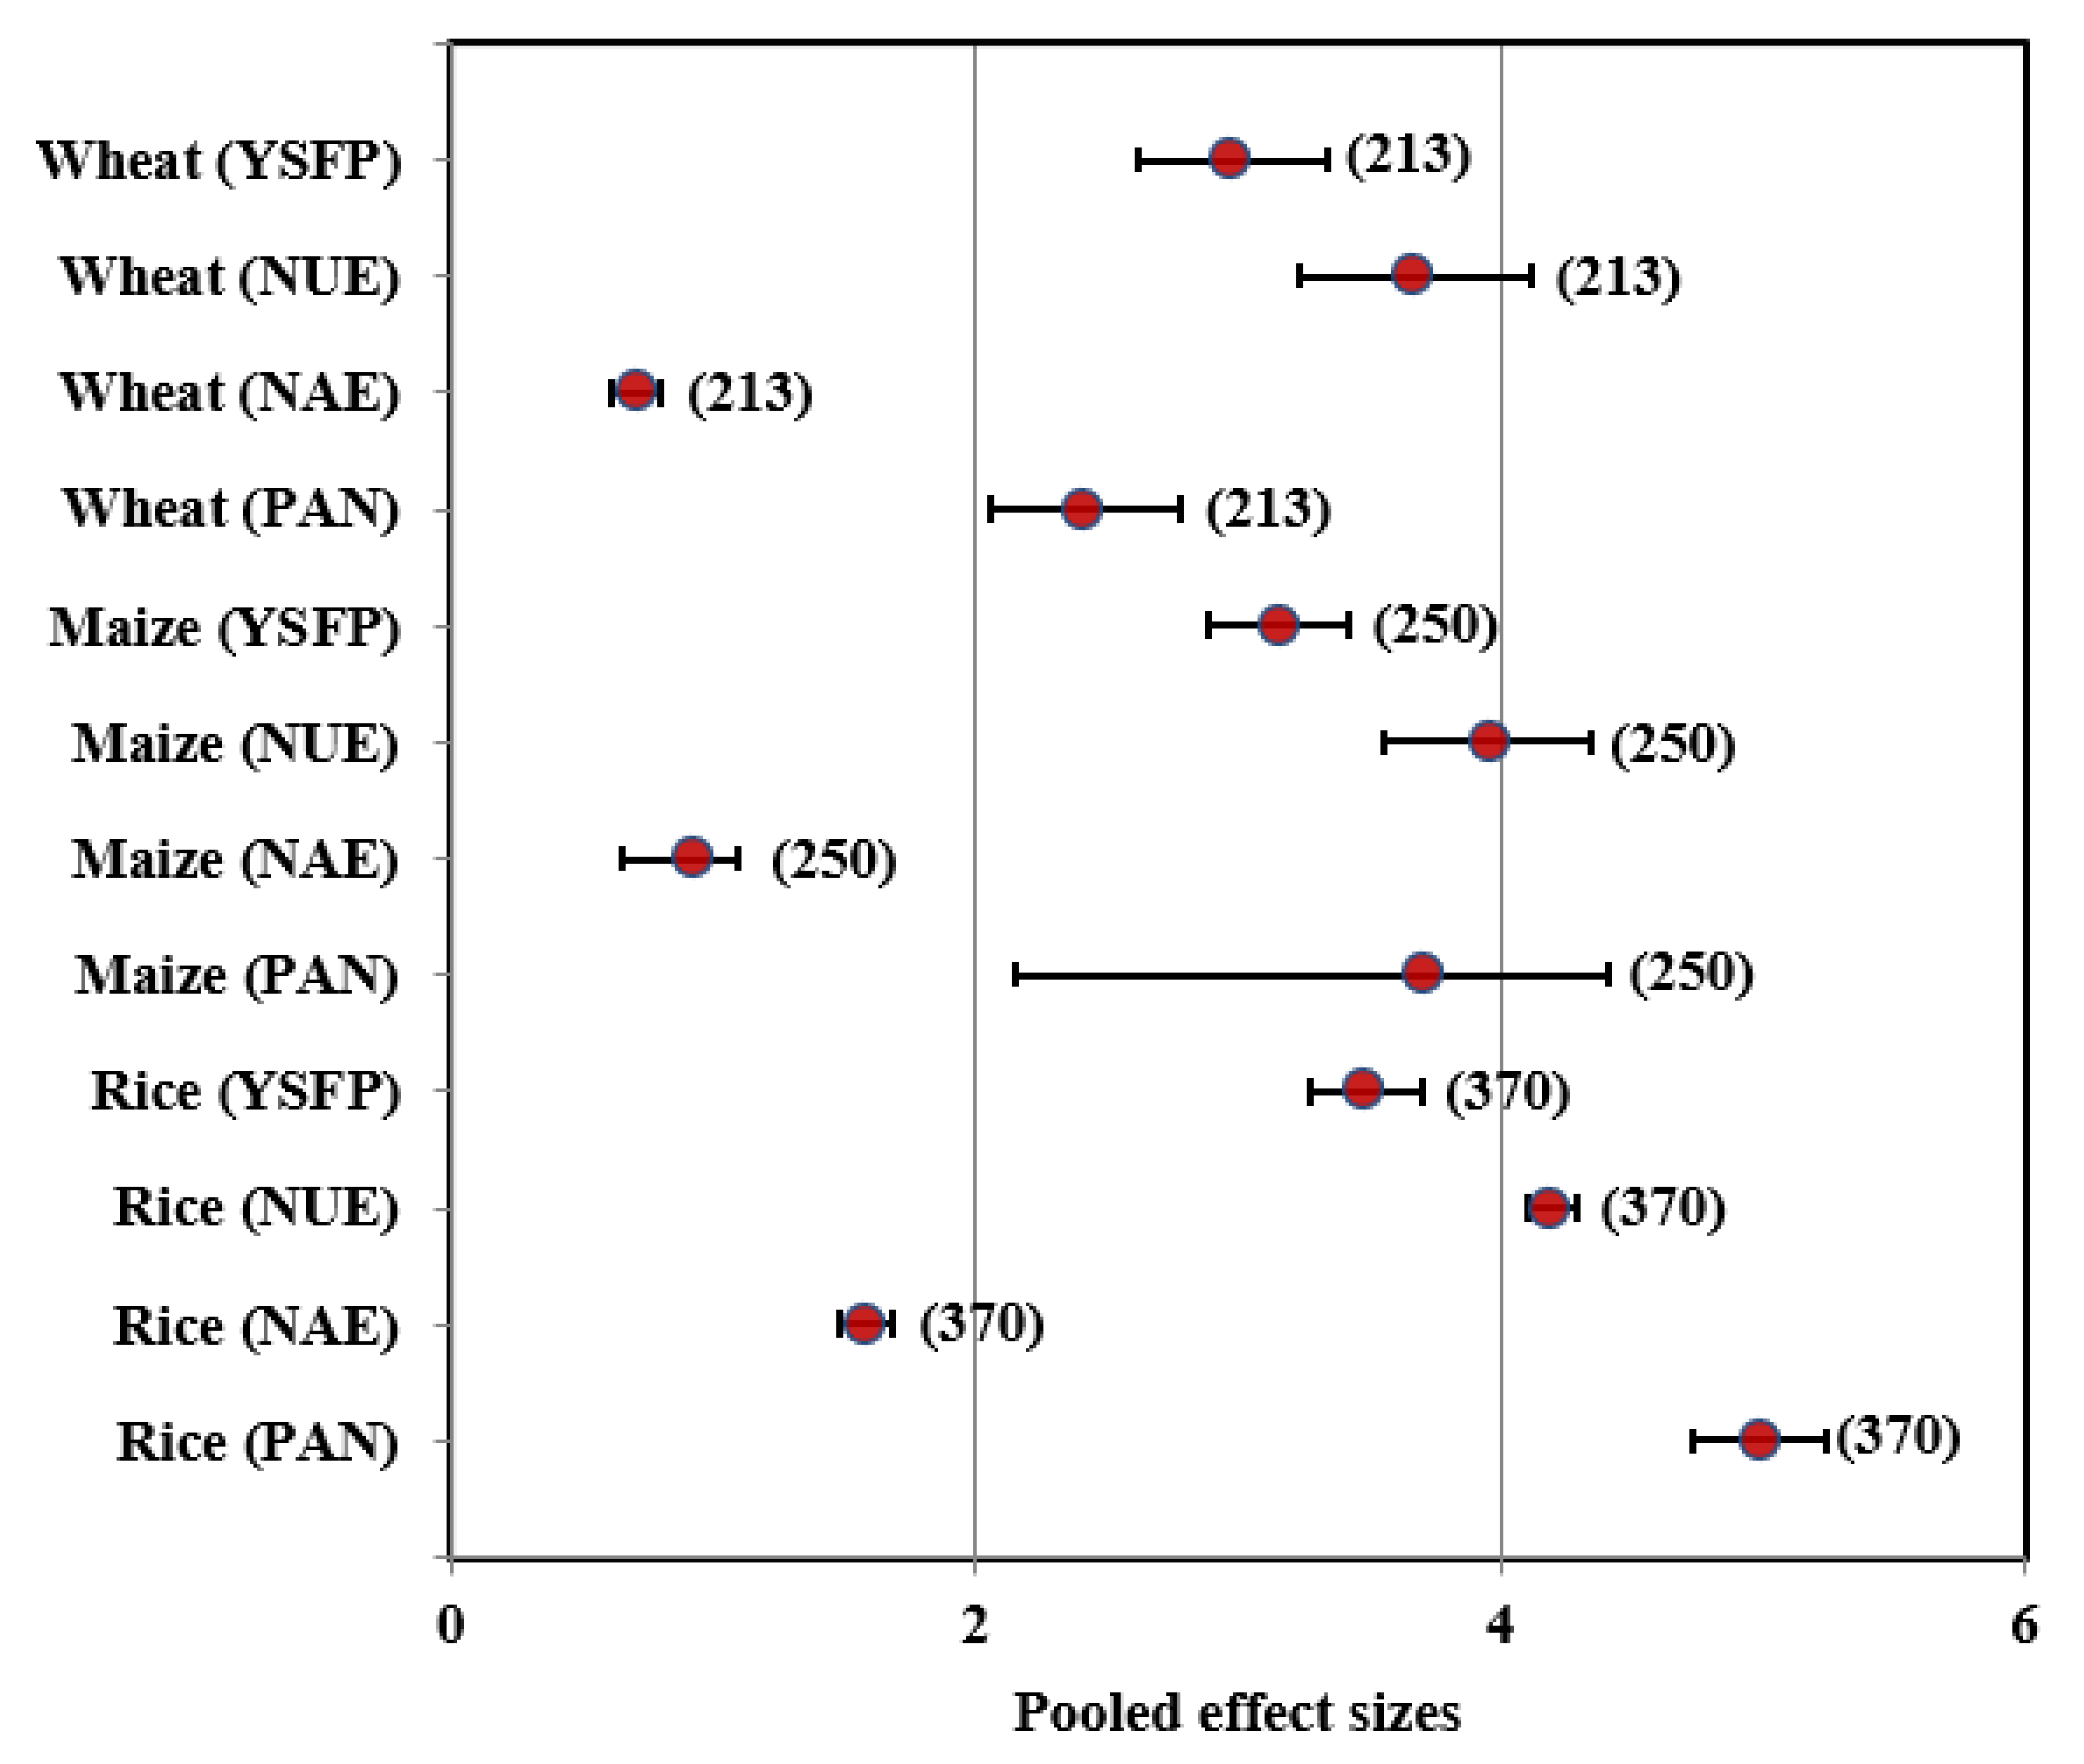
3.1. Overall Responses of the Investigated Agronomic Parameters to AV

Reductions in agronomic parameters in response to AV were presented by the pooled effect sizes of difference in means within each group at CI = 95% (Figure 1). There were overall significant reductions in YSFP (kg N Mg−1 grains), NUE (%), NAE (kg grains kg−1 N), and PAN (kg grains kg−1 N) by 2.98, 3.67, 0.71, and 2.42 from wheat crop, 3.16, 3.96, 0.93, and 3.71 from maize and 3.49, 4.19, 1.59, and 4.99 from rice, respectively. Decreases in agronomic parameters were higher in rice than maize while wheat reported the lowest response to AV. Constrained multiple regression analysis fitted at 95% confidence band (Figure 2) showed a strong relationship among the explanatory variable (AV) and the agronomic parameters for the three crops. The coefficient of determination (R2) for the agronomic parameters ranged between 0.82 and 0.88 in wheat, 0.50 and 0.81 in maize and 0.70 and 0.92 in rice. The NAE reported the lowest dependability in response to AV for the three crops. YSFP recorded the highest response to AV (0.88 and 0.92) followed by PAN (0.88, 0.89) in wheat and rice, respectively, while NUE reported the highest response (R2 = 0.81) in maize.
The contribution of the agronomic conditions [climatic conditions including temperature (T); precipitation (P); and soil properties including soil pH, clay content (C), organic matter (SOM), and total N (STN)] and practices [fertilizer type (FT) and rate (RT), application depth (AD), and amendments (A)] in the response of agronomic parameters to AV was drawn using path analysis (Figure 3). The SEM of wheat showed a significant positive effect of STN on all parameters; FR on YSFP; FT on all parameters except YSFP and AD on NUE and PAN; and T on all parameters but insignificant with YSFP. Contrarily, all other agronomic conditions and properties had significant negative effects on the reductions of the agronomic parameters caused by AV except P, which had an insignificant effect on YSFP and NAE and C on NUE and PAN. SEM of maize showed significant negative responses of all agronomic parameters to FT, FR (except YSFP which was positive), T, and A (except PAN which was insignificant). In contrast, significant positive effects were noticed for P on all parameters, SOM on YSFP and NUE, STN on NAE and PAN, AD on YSFP, and C on PAN. The SEM of rice reported significant responses of all agronomic parameters even positive to P, STN, FR (except NAE and PAN), and T (except YSFP and PAN); or negative to FT, A, and AD (except YSFP and NUE).
There were significant correlations between the investigated parameters in the three crops (Figure 3). The highest correlations were reported among NUE, NAE, and PAN in wheat (0.92–0.94) and rice (0.81–0.92), while it was between NUE and PAN (0.88) in maize followed by NUE and NAE (0.71). Generally, these parameters showed weak correlation in maize as compared with wheat and rice, and the lowest correlation (0.57) was between YSFP and PAN in maize.

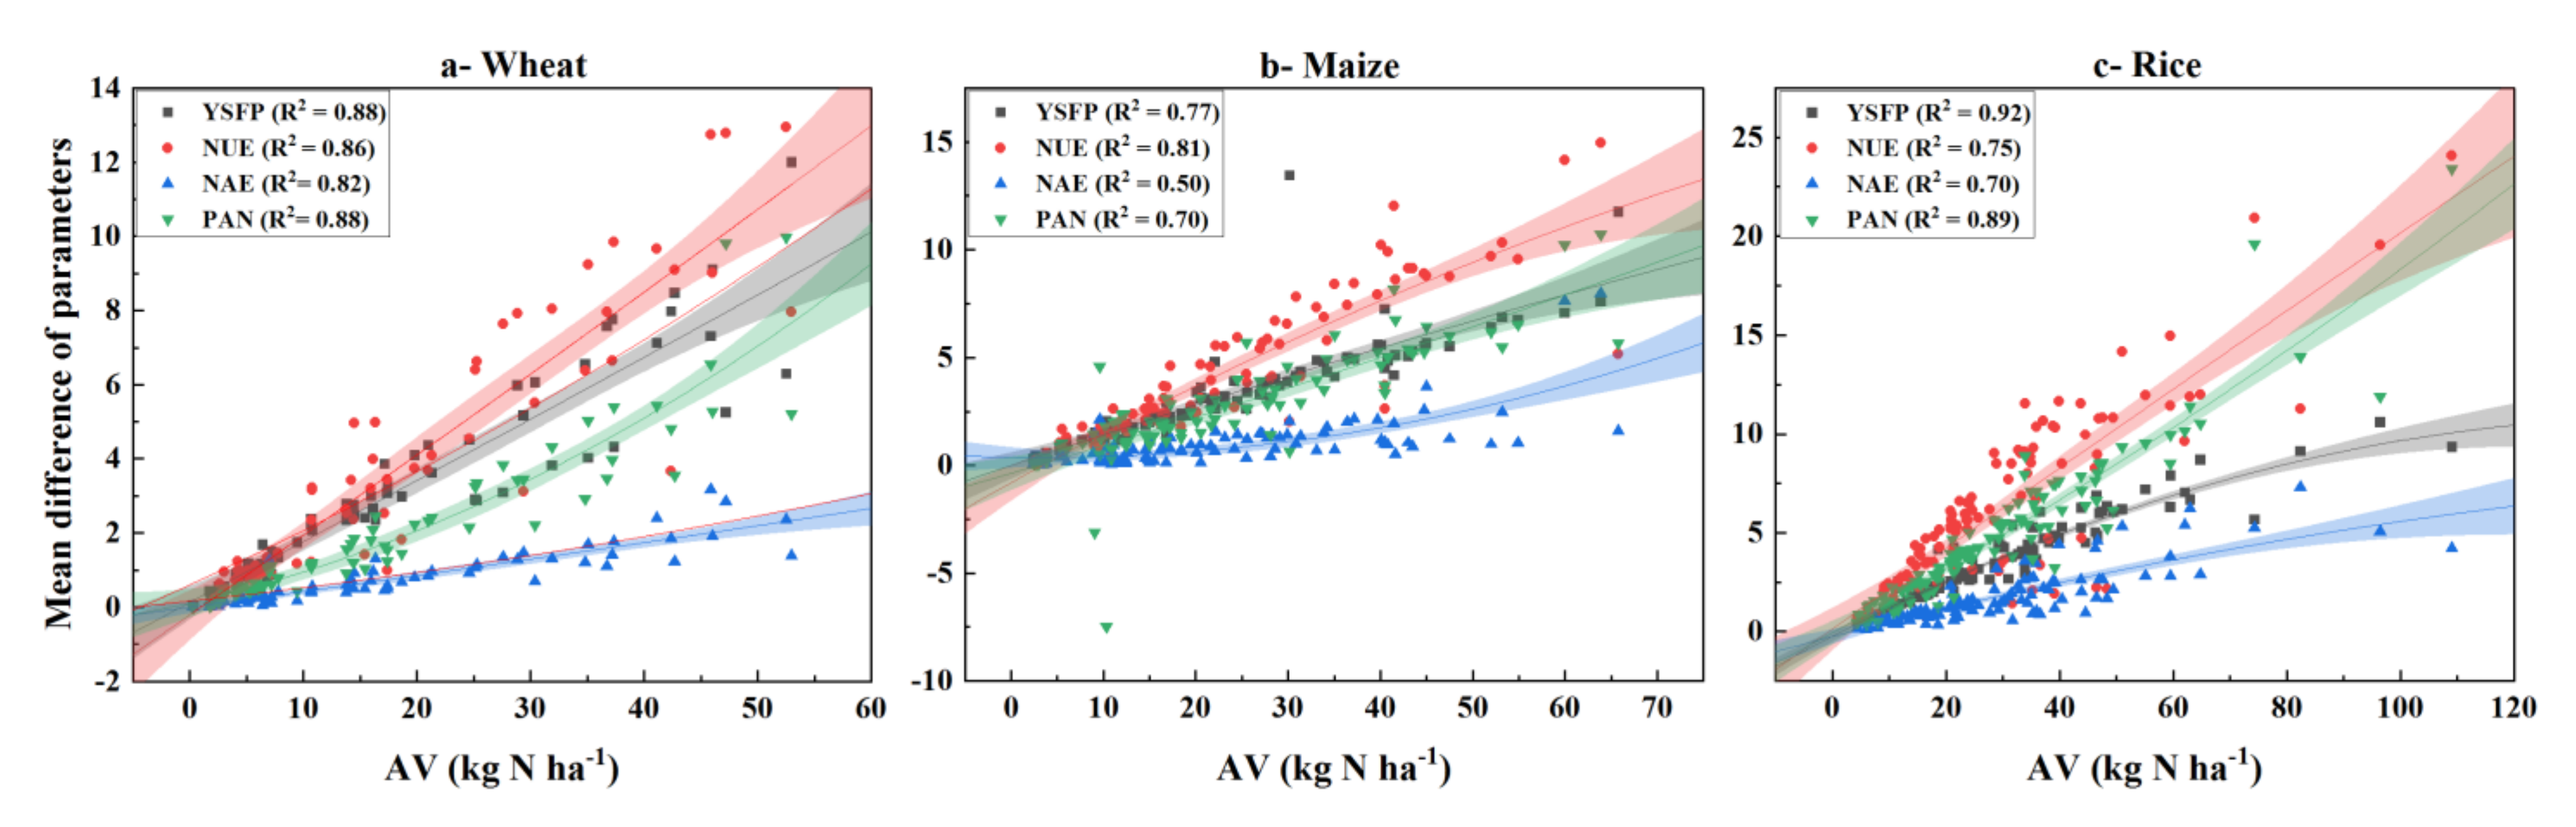
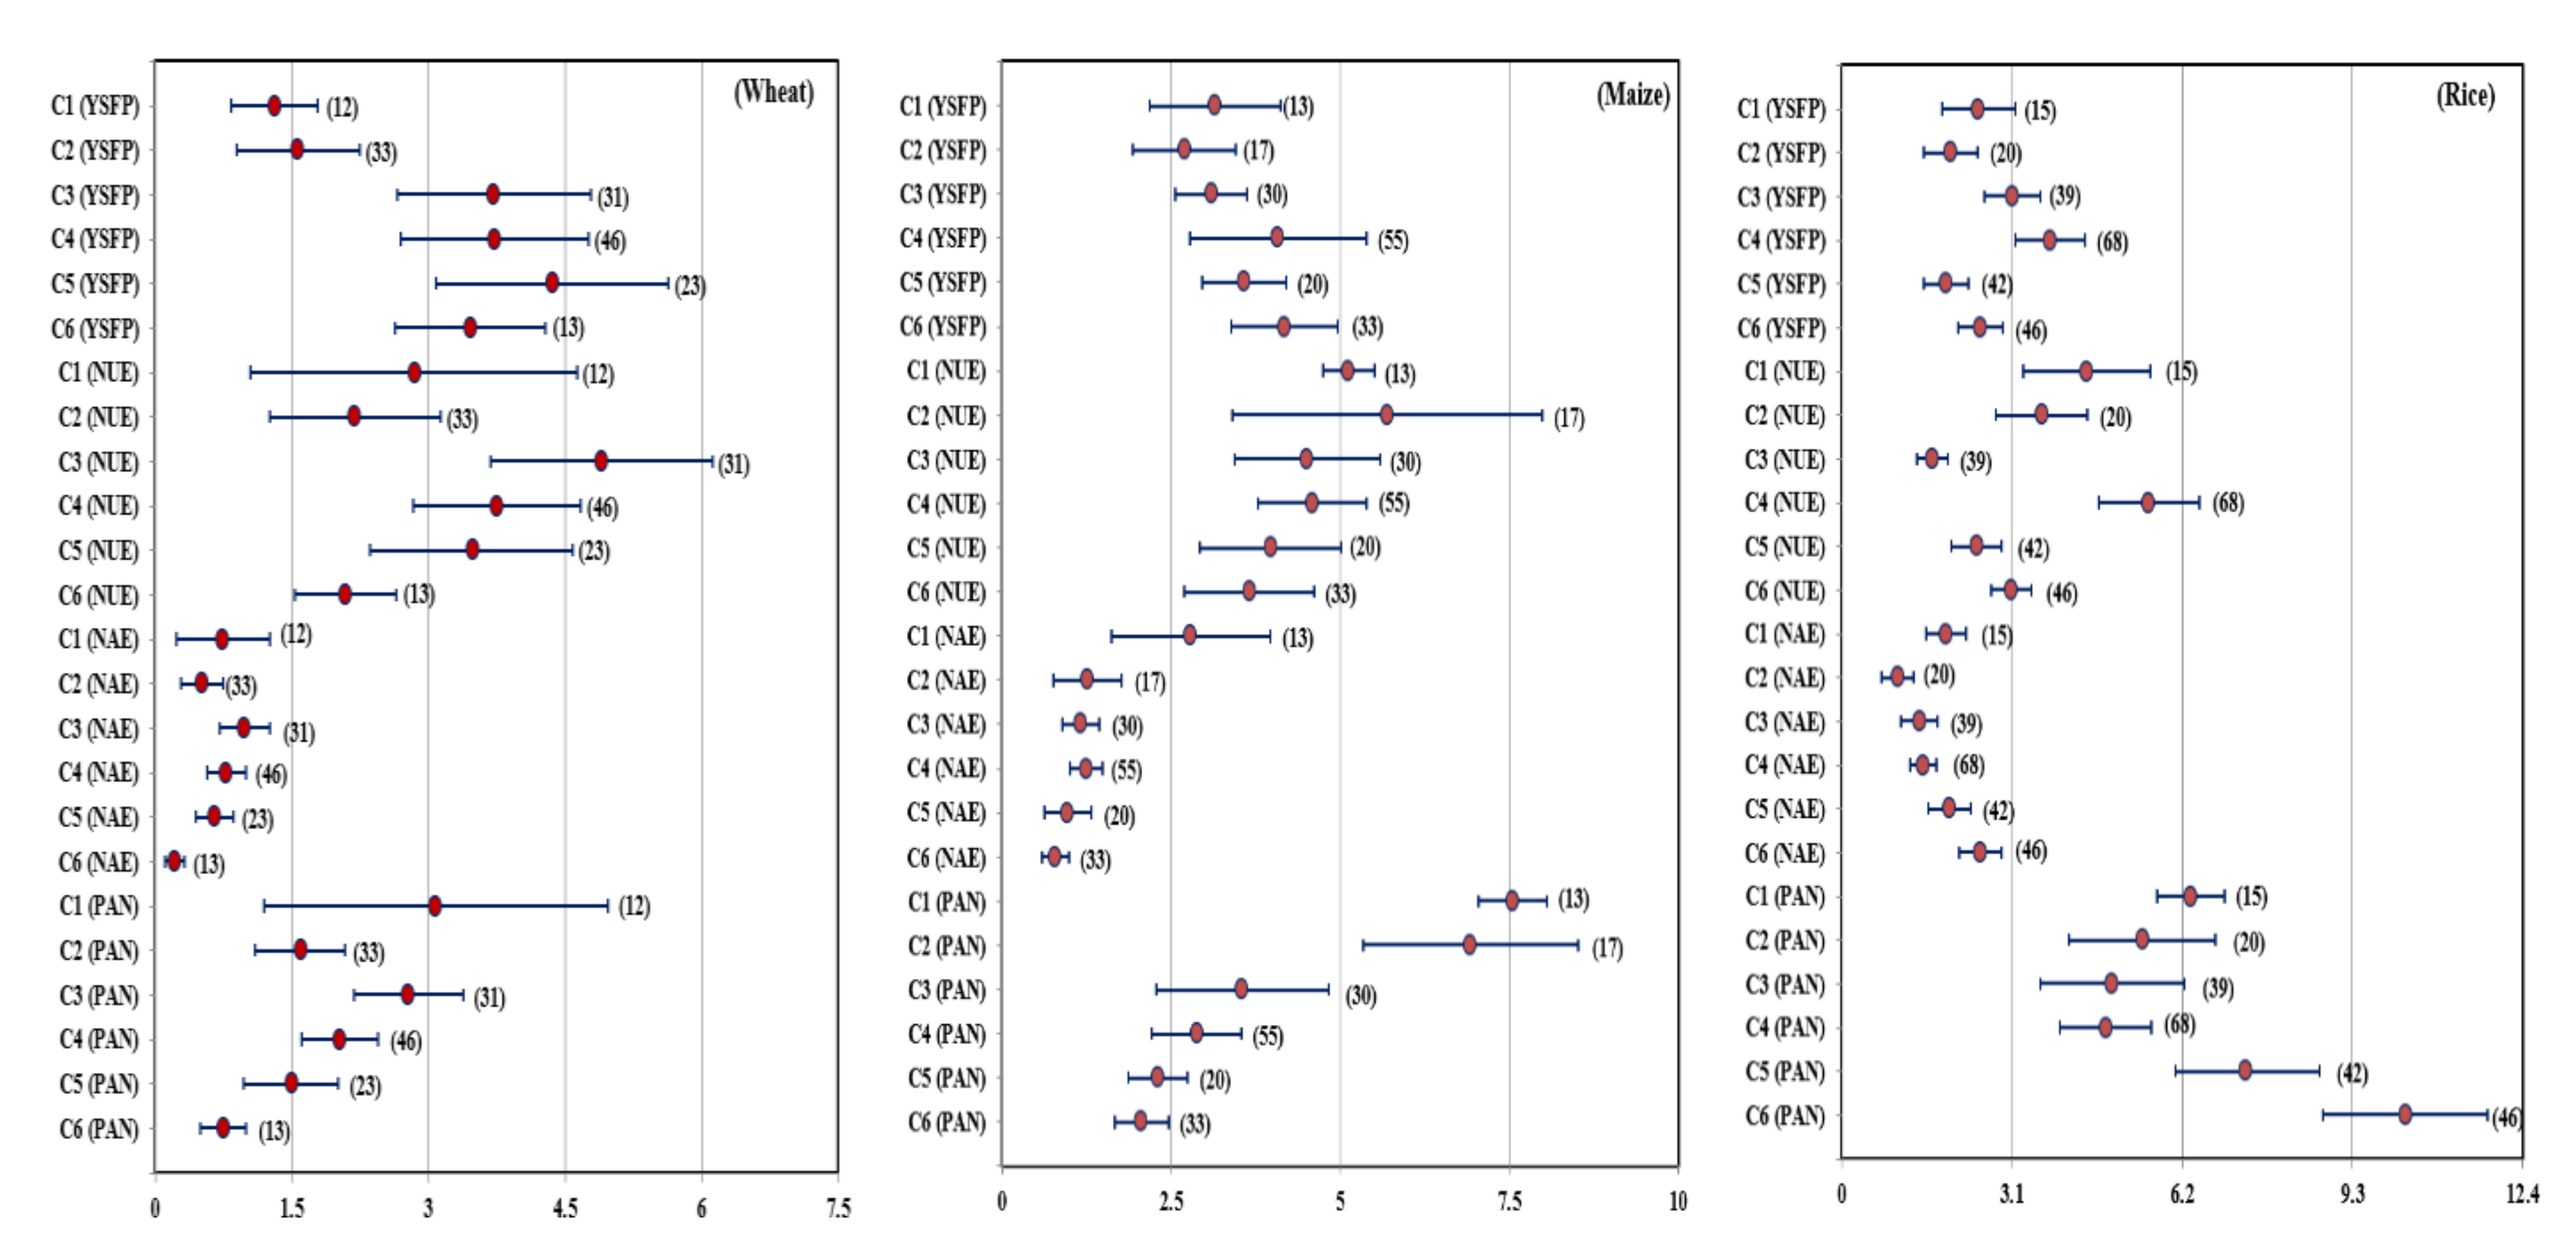
3.2. Induced AV Changes in Agronomic Parameters to N Application Rate

A difference in means of the pooled effect sizes represented by forest plots (Figure 4) indicates the reductions in the wheat agronomic parameters (YSFP, NUE, NAE, and PAN) caused by AV at CI = 95%. These parameters showed no relative response to the increment in N application rate (from C1 to C6), where the maximum YSFP (4.36 kg N Mg−1 grains) was recorded at C5 rate, while the minimum (1.31 kg N Mg−1 grains) was at C1. N application rate (C3) resulted in the highest reductions in NUE and NAE (4.9% and 0.98 kg grains kg N−1, respectively), whilst the lowest NUE and NAE values (2.09 and 0.22) were reported after applying C6. The highest reduction in PAN (3.08 kg grains kg−1 N) resulted by applying C1, while the lowest (0.75 kg grains kg−1 N) was recorded under C6. Relative reductions in means difference of maize NAE and PAN at CI = 95% were recorded with increasing the fertilization rate from C1 (2.78 and 7.55) to C6 (0.78 and 2.06) (Figure 4). Maximum reduction in YSFP (4.17) was reported at C6 while the minimum (2.70) was at C2. Applying N rate at C2 resulted in the highest reduction in NUE (5.69), while applying C6 reported the lowest reduction in NUE (3.66). The highest reductions in rice YSFP and NUE (3.79 and 5.59, respectively) at CI = 95% were reported under N application rate (C4), but the highest reductions in NAE and PAN (2.52 and 10.26, respectively) were recorded under C6 (Figure 4). N application rates, C5, C3, C2, and C4 resulted in the lowest reductions in YSFP, NUE, NAE, and PAN (1.9, 1.65, 1.02, and 4.81, respectively).
Generally, YSFP showed higher response to AV in maize (3.46) followed by wheat (3.03) then rice (2.64), while NUE of maize had the highest response to AV (4.59) followed by rice (3.48) and then wheat (3.21). NAE and PAN had the highest response to AV in rice (1.72 and 6.53), then maize (1.37 and 4.21) and wheat (0.65 and 1.96). The analysis was done for the rate effect without taking the application depth into consideration, thus we carried out the linear regression analysis to figure out the application depth effect (Table 2). The regression analysis showed a significant relation (R2) between application depth and YSFP, NUE, NAE, and PAN of wheat by 0.03, 0.09, 0.03, and 0.04, respectively when studying the rate effect. There were no significant relations between application depth and all parameters of maize and rice except PAN in rice by 0.04.

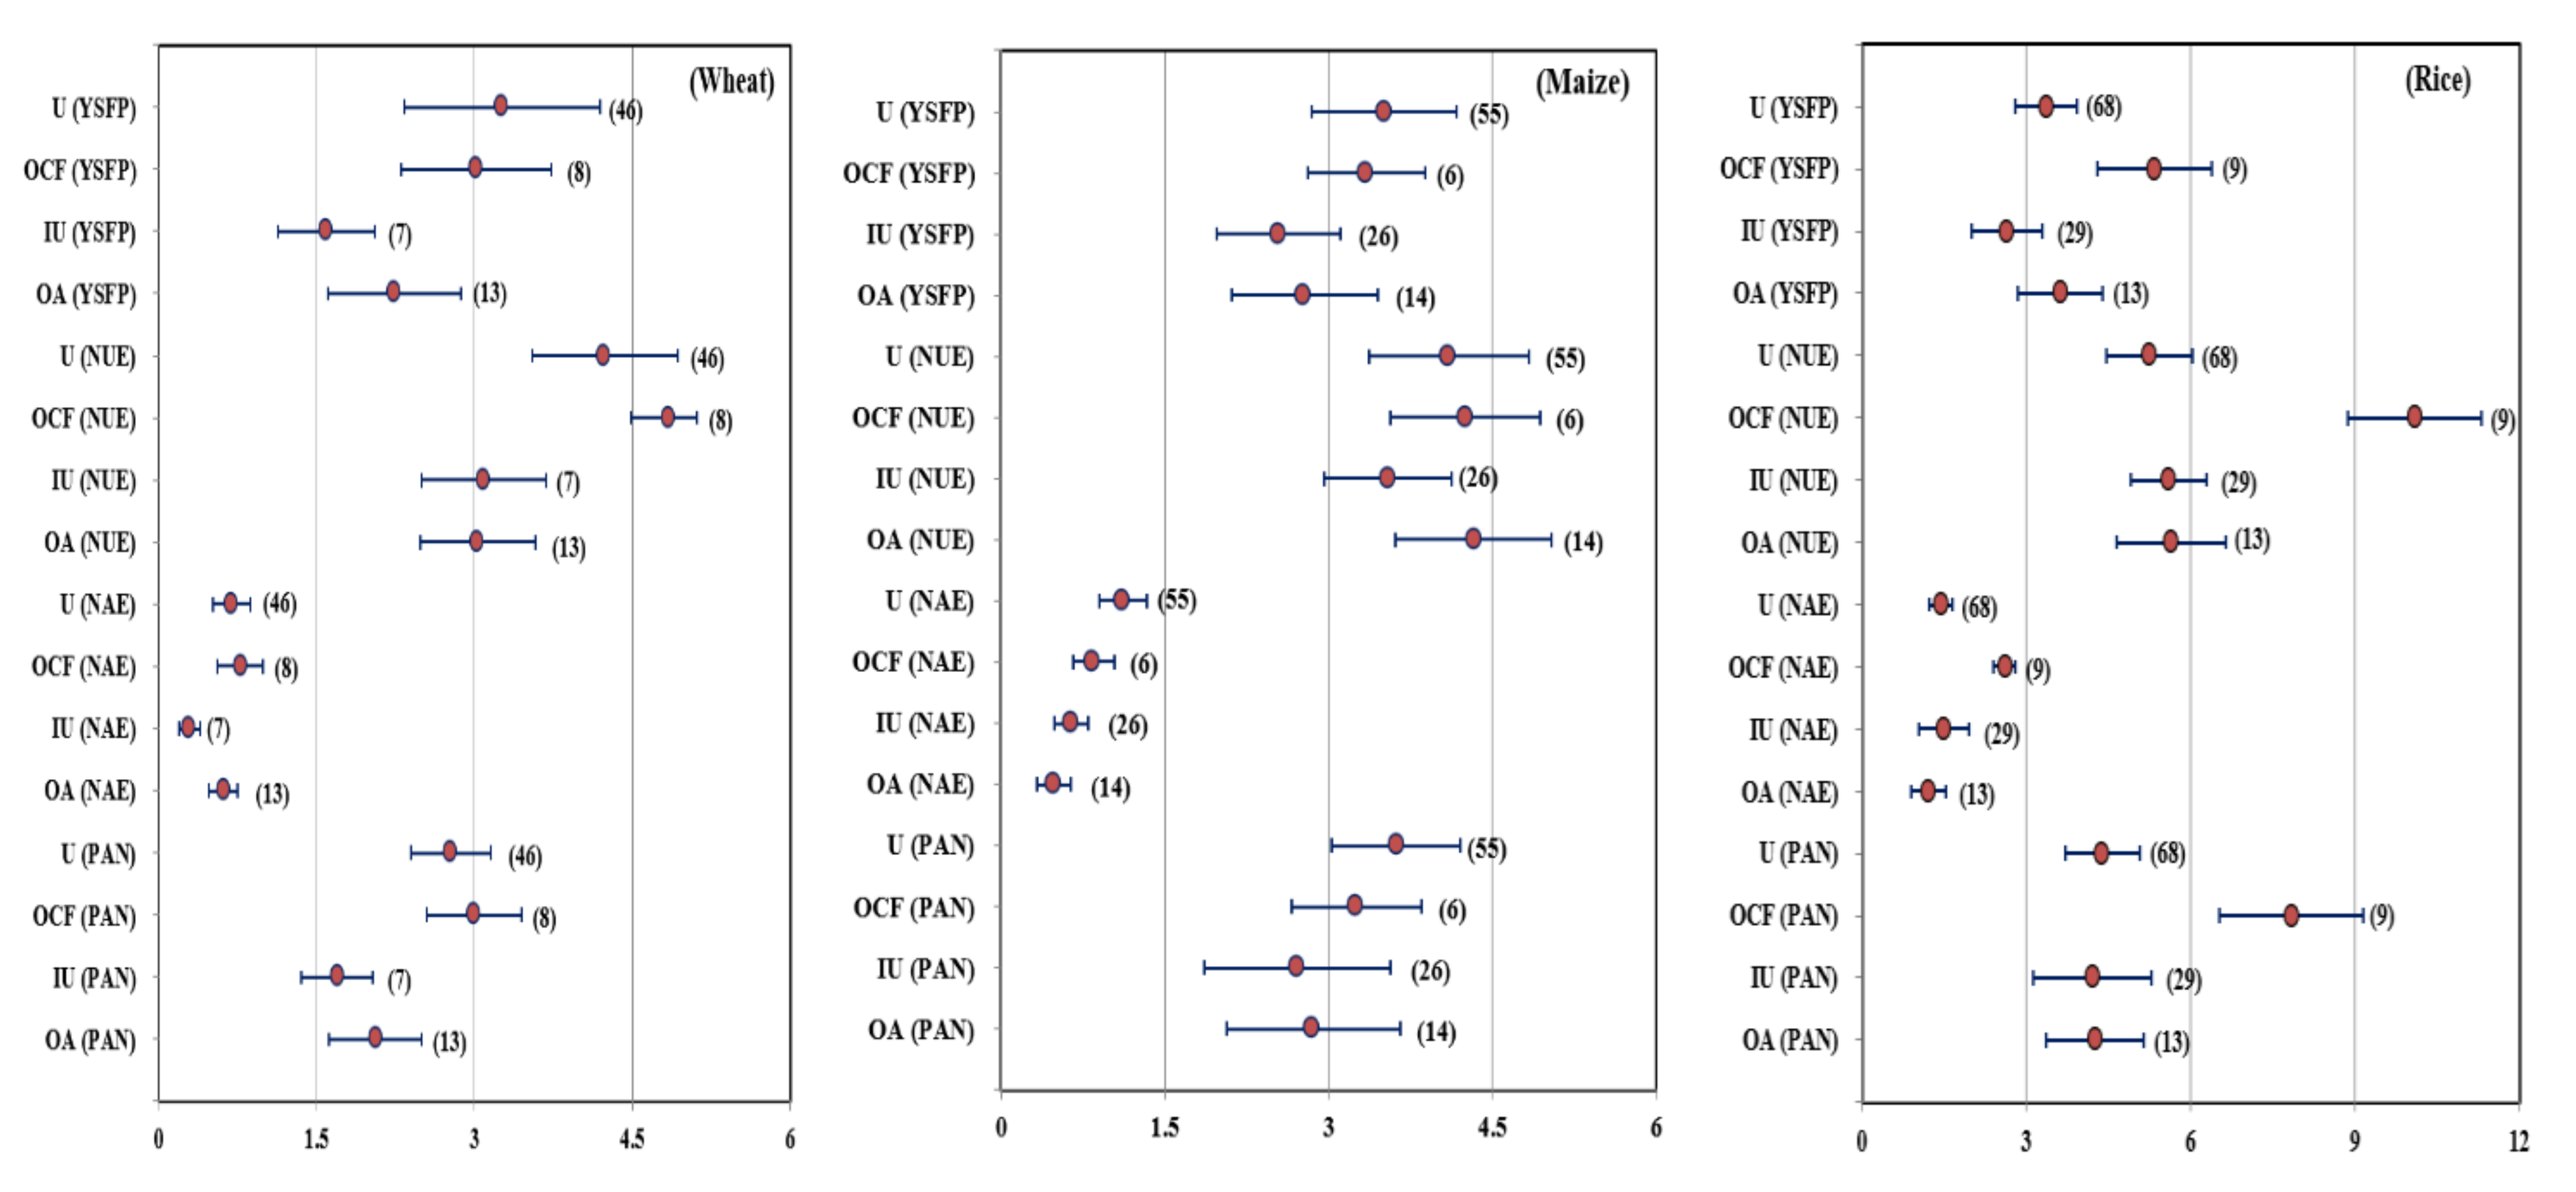
3.3. Induced AV Responses of Agronomic Parameters to N Fertilizers Type

Using the improved N fertilizers (slow released fertilizers, IU) showed notable reductions in the mean differences of wheat agronomic parameters in response to AV as compared with other N fertilizer types (Figure 5). IU recorded the lowest reductions in YSFP, NAE, and PAN by 1.59, 0.29, and 1.70, respectively, at CI = 95%, while NUE recorded the lowest reduction (3.03) under the application of organic amendments (OA) less than IU by only 0.06. Using mineral N fertilizers, even U or others (OCF) reported the highest reductions in all agronomic parameters. OCF reported the maximum reductions in NUE, NAE, and PAN of 4.85, 0.78, and 3.00 at CI = 95%, while the maximum reduction in YSFY of 3.26 resulted under U type. Differently, the highest reductions in YSFP, NAE, and PAN of 3.51, 1.11, and 3.62 at CI = 95% were recorded under U type while it was (4.33) for NUE under OA type in maize (Figure 5). Using IU fertilizers resulted in the lowest reductions in YSFP, NUE, and PAN of 2.54, 3.54, and 2.71, respectively, at CI = 95%, while the lowest reduction in NAE (0.84) was obtained under OA application. OCF fertilizers resulted in the highest decrease in all rice agronomic parameters (YSFP, NUE, NAE, and PAN) of 5.35, 10.09, 2.62, and 7.84, respectively at CI = 95% (Figure 5). Contrarily, the application of IU fertilizers resulted in the lowest decrease in YSFP and PAN by 2.65 and 4.21, while the lowest decreases in NUE (5.25) and NAE (1.21) were reported under the application of U and OA, respectively.
On average, of the three crops, OCF showed the highest reduction in all parameters by 3.90, 6.40, 1.41, and 4.70 at CI = 95% for YSFP, NUE, NAE, and PAN, respectively, while the application of IU resulted in the lowest reductions in YSFP, NUE, and PAN by 2.26, 4.08, and 2.87, respectively. NAE recorded the lowest value (0.77) under OA application.

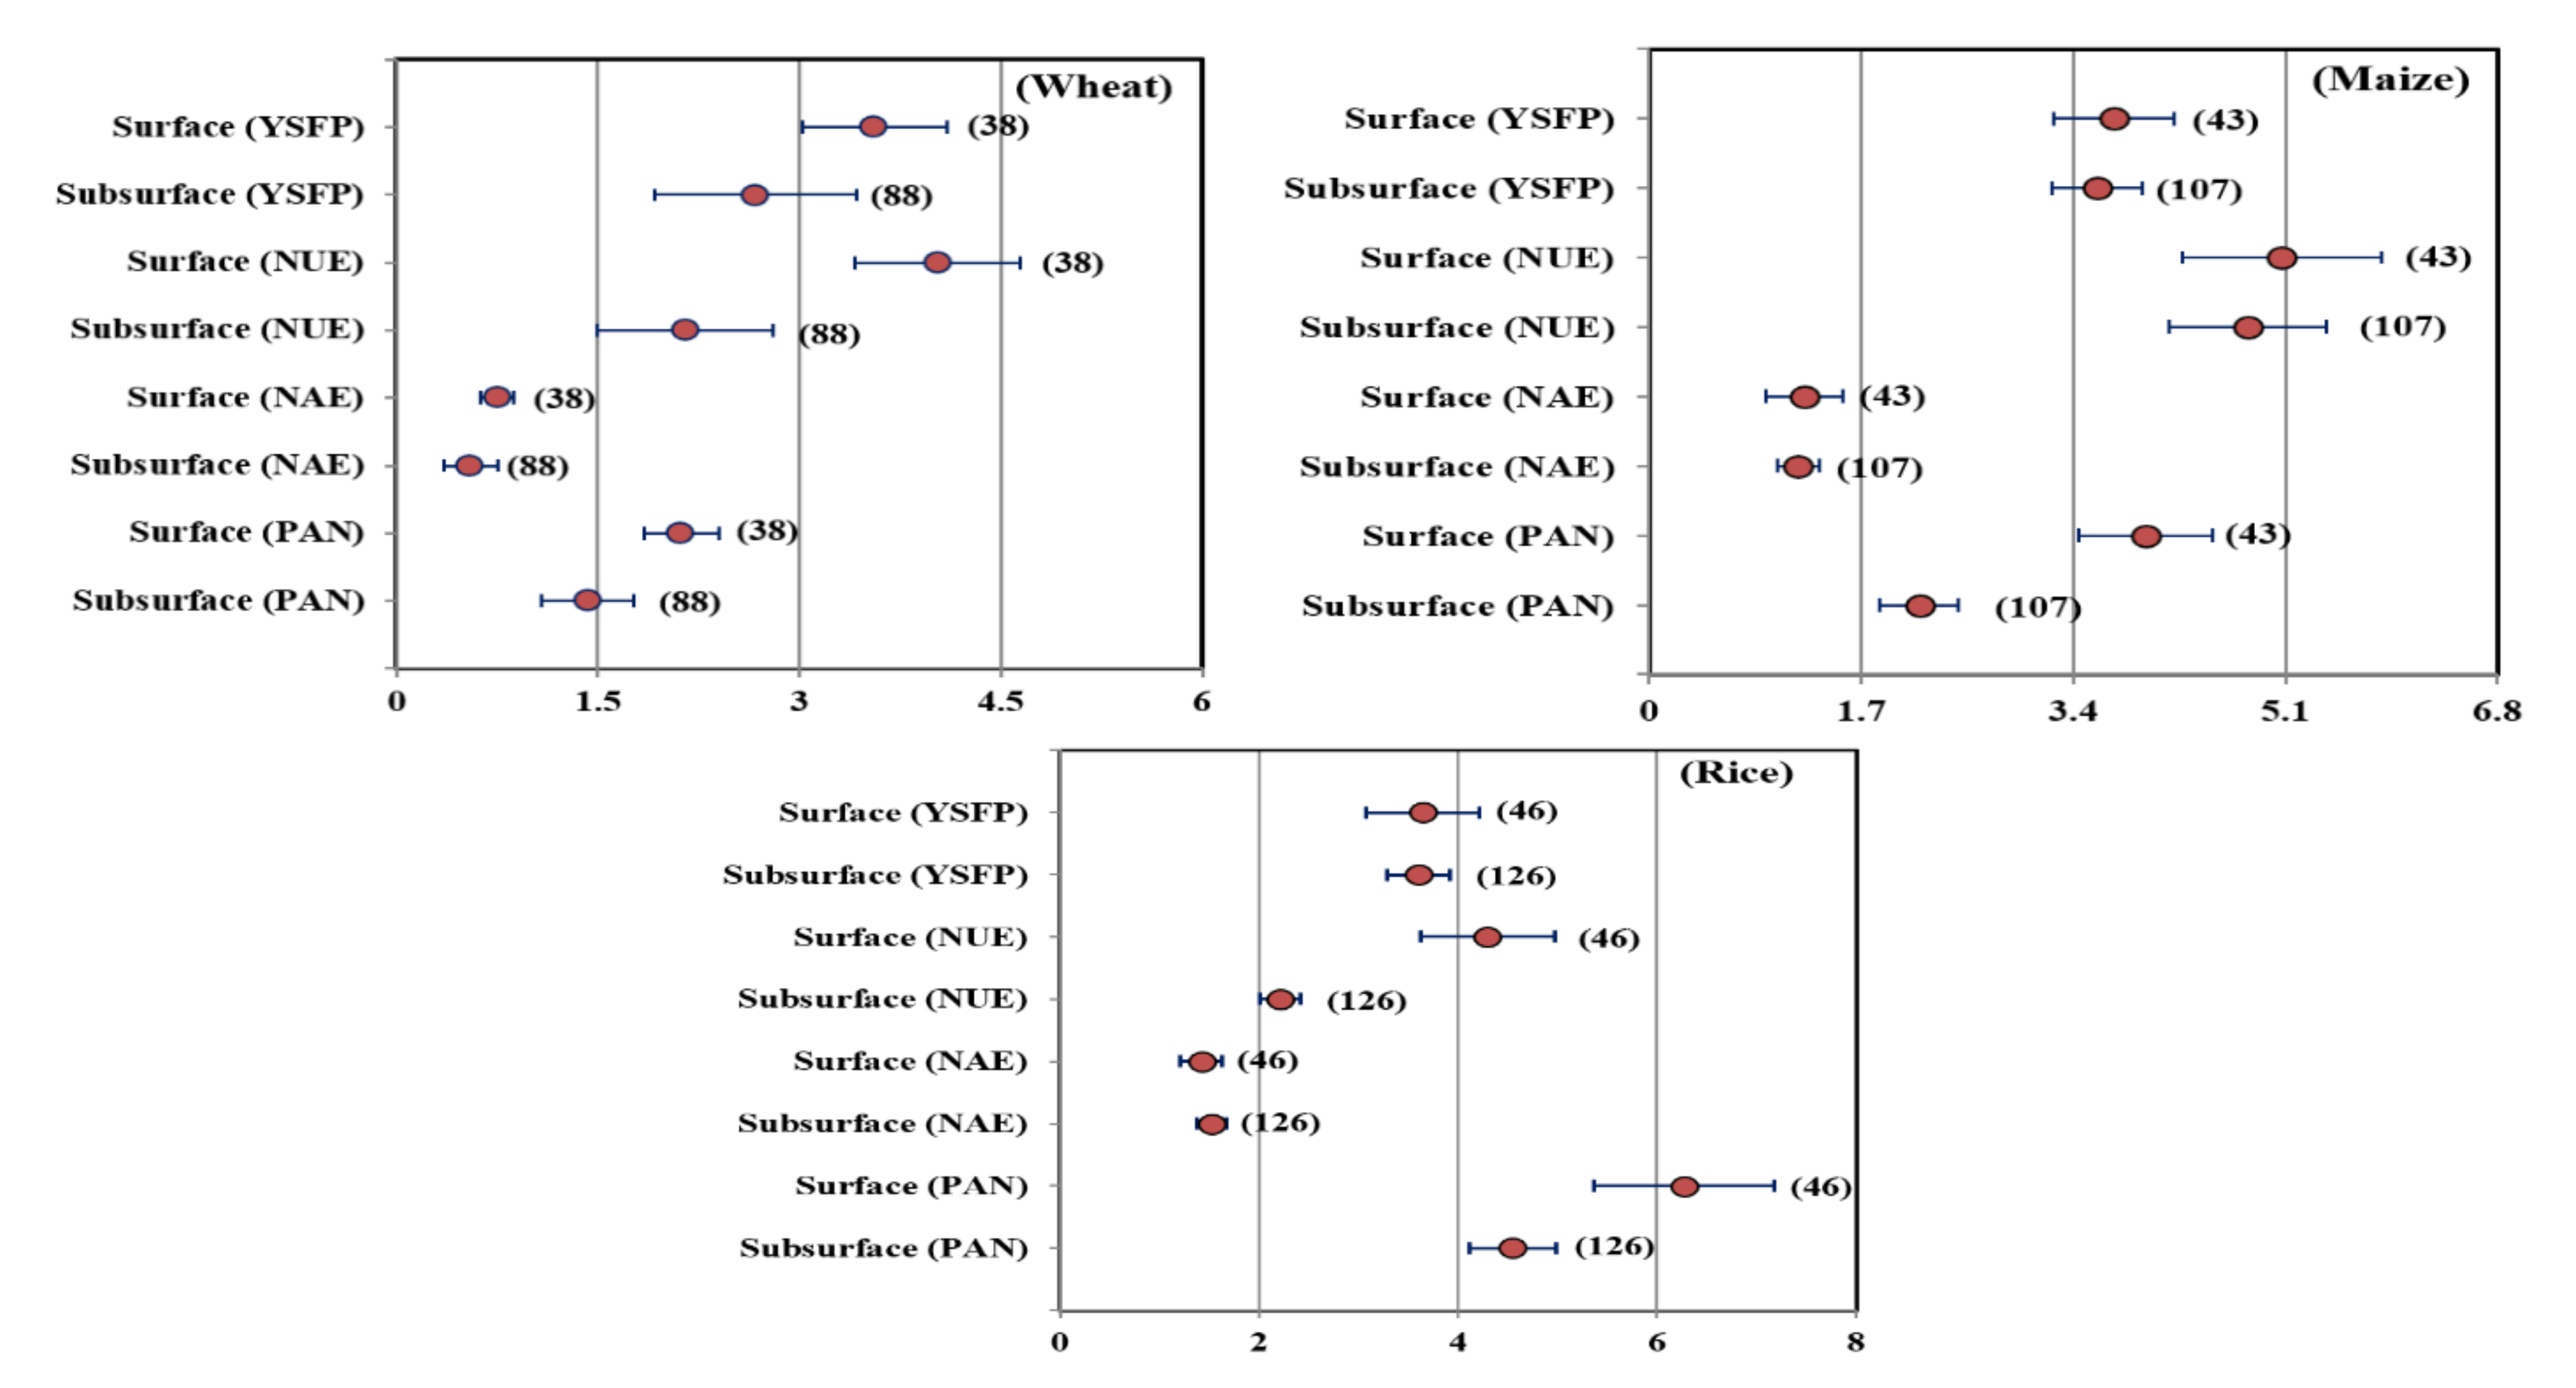
3.4. Controlling AV Effects on Agronomic Parameters by Subsurface N Application

Subsurface application of urea fertilizers resulted in notable reductions in the mean differences of all wheat agronomic parameters as compared with surface application at CI = 95% (Figure 6). The reductions in YSFP, NUE, NAE, and PAN in response to AV dropped down significantly from 3.56, 4.03, 0.75, and 2.12 under surface application to 2.67, 2.16, 0.55, and 1.43, respectively under subsurface application for wheat. Similarly, decreases in these parameters as affected by AV in maize crop reduced from 3.72, 5.07, 1.24, and 3.98 under surface application to 3.59, 4.80, 1.19, and 2.17, respectively, under subsurface application strategy (Figure 6). Responses of these parameters to AV in rice crop showed a different trend with NAE, which increases from 1.42 under surface application to 1.53 under subsurface amendment. Other parameters including YSFP, NUE, and PAN showed similar response trends to maize and wheat where their reductions dropped down from 3.65, 4.29, and 6.27 under surface amendment to 3.60, 2.21, and 4.55 under subsurface application.
Generally, YSFP showed higher response in wheat (0.89) to the changes in AV caused by application depth than maize (0.13) and rice (0.05), while the response of NUE was higher in rice (2.08) than wheat (1.87) and maize (0.27). Changes in AV in response to application depth affected maize PAN (1.81) higher than rice (1.72) and then wheat (0.69). The linear regression analysis indicated a significant contribution of fertilizer rate when studying the application depth effect on all agronomic parameters of the three crops except wheat NUE and rice NAE (Table 2).

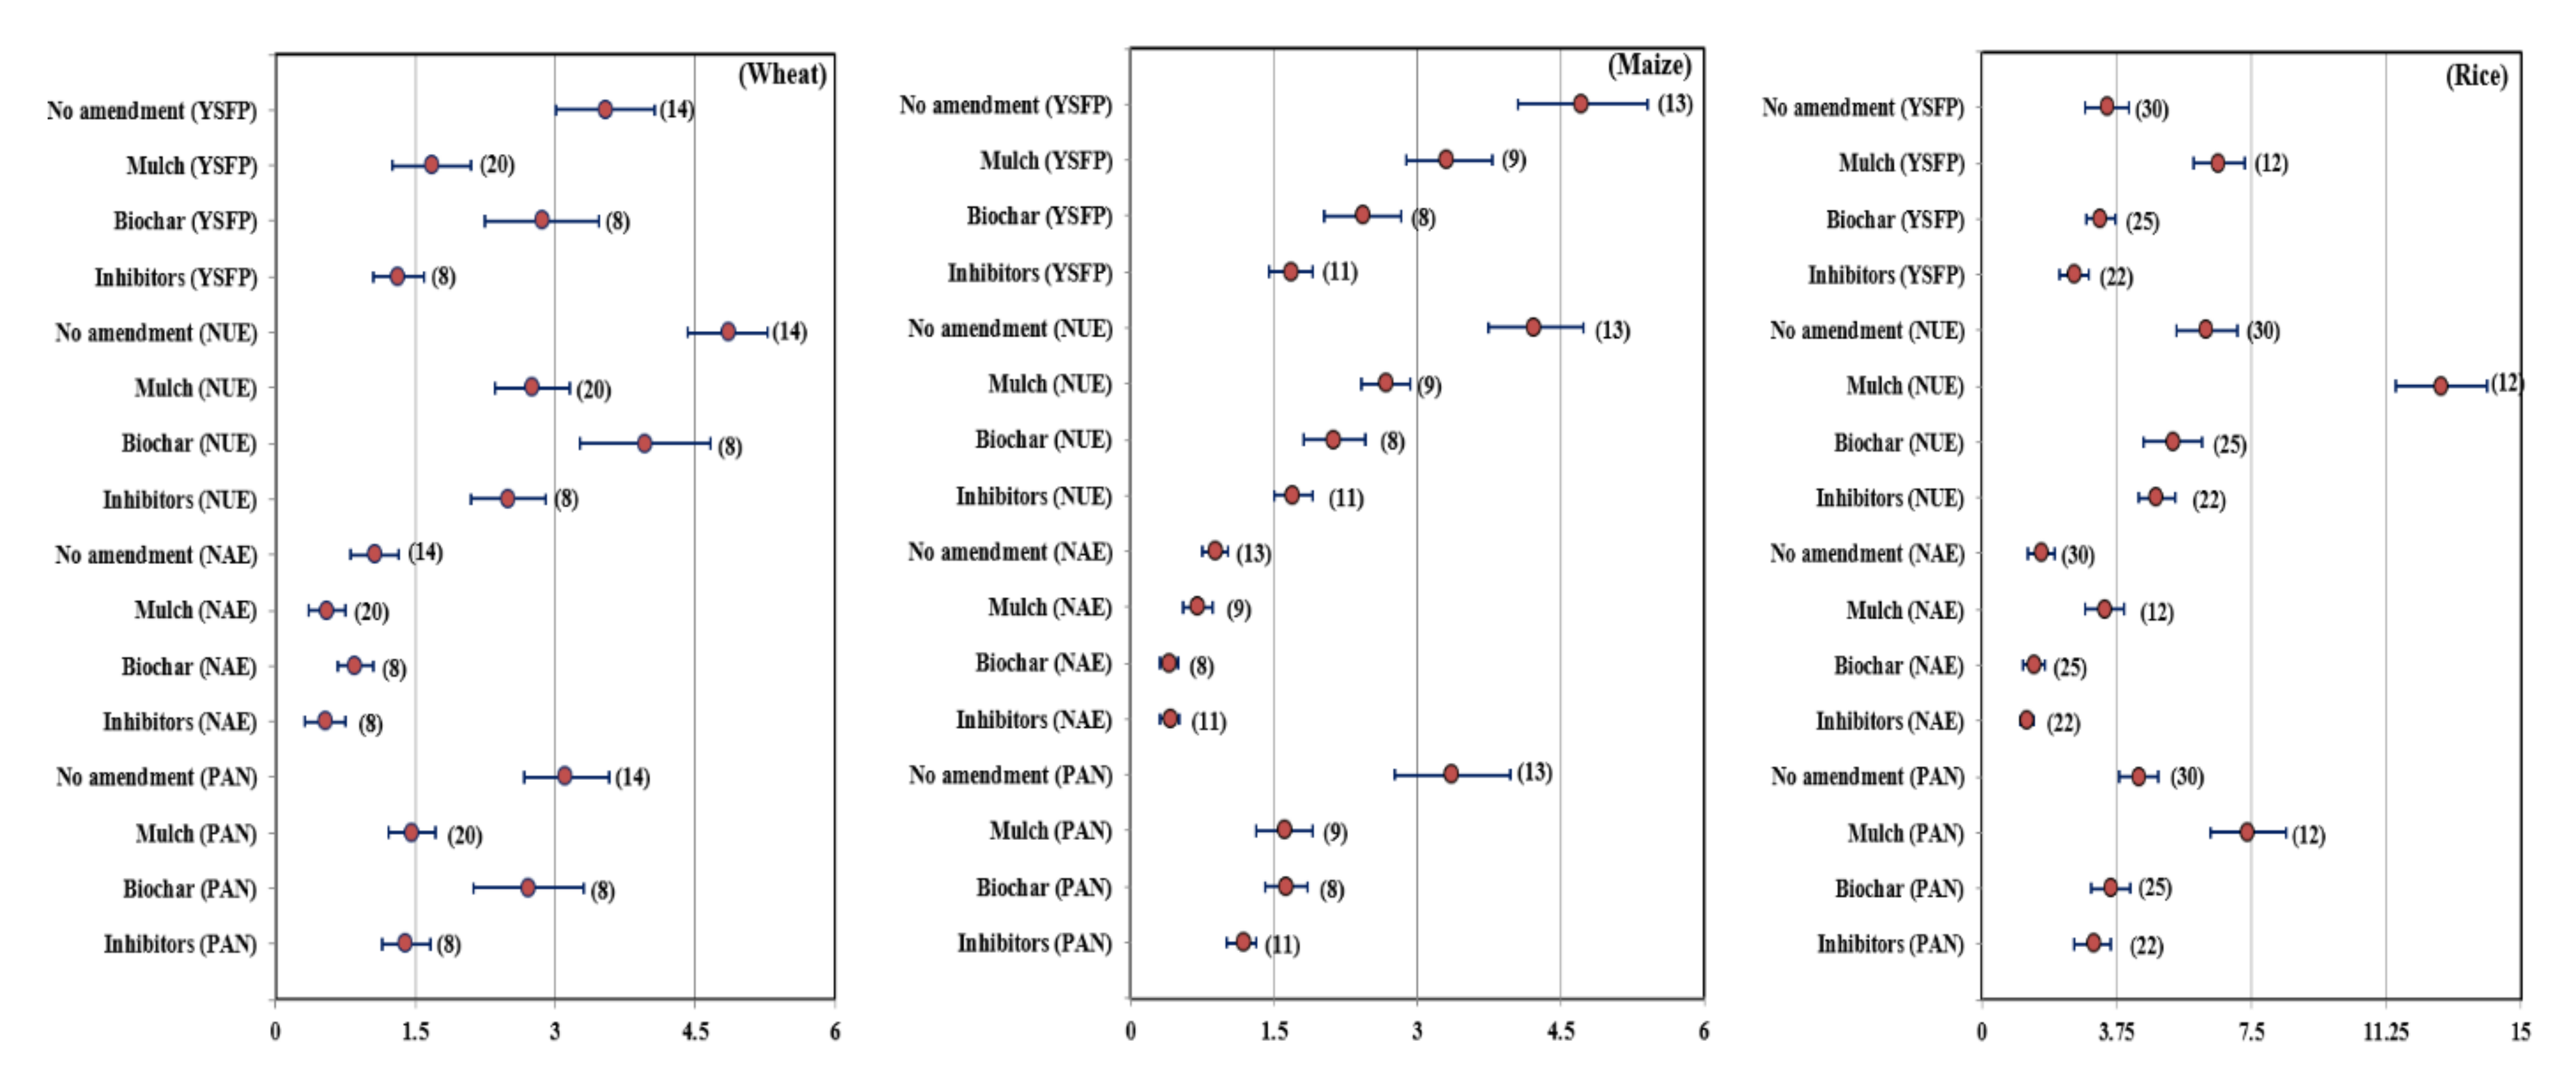
3.5. Role of Amendments in Mitigating AV—Induced Reductions in Agronomic Parameters

Applying amendments such as mulch, biochar, and inhibitors resulted in significant decreases in the mean differences of all agronomic parameters of wheat in response to AV as compared with no amendments application (Figure 7). Inhibitors indicated the lowest reductions in YSFP, NUE, NAE, and PAN by 1.32, 2.50, 0.54, and 1.4 at CI = 95% as compared with no amendments, which recorded the highest reductions in these parameters by 3.54, 4.86, 1.07, and 3.11, respectively. The effects of amendments in mitigating the reductions in wheat agronomic parameters as affected by AV took the following order: Inhibitors > mulch > biochar > no amendments. Similarly, the lowest reductions in maize in YSFP, NUE, and PAN (1.68, 1.70 and 1.19 at CI = 95%) were recorded under inhibitors, while biochar resulted in the lowest decrease in NAE by 0.40 (Figure 7). On the other hand, no amendments application reported the highest decreases in YSFP, NUE, NAE, and PAN by 4.72, 4.22, 0.89, and 3.36, respectively at CI = 95% in maize. The role of these amendments in controlling the reductions in maize parameters took the same trend of wheat except for NAE, which was: Inhibitors > biochar > mulch > no amendments. The effects of AV on rice agronomic parameters showed different responses of wheat and maize to the amendments as compared with no applications (Figure 7). The lowest decreases in YSFP, NUE, NAE, and PAN (2.57, 4.87, 1.27 and 3.13 at CI = 95%) were reported under inhibitors application, while the highest reductions (6.6, 12.78, 3.42, and 7.41 at CI = 95%), respectively, were not recorded with no amendments but mulch application. Accordingly, the trend of these amendments on controlling the reductions in all rice agronomic parameters influenced by AV took this trend: Inhibitors > biochar > no amendments > mulch.
On average, of the three crops, inhibitors followed by biochar showed the highest effect on controlling the reductions in all agronomic parameters, while mulch increased the reductions in NUE and NAE as compared with no amendments application. The responses of these parameters to inhibitors and biochar applications took the following order as percentages of no amendments: YSFP (52.63% and 26.87%) > PAN (47.18% and 26.78%) > NUE (40.83% and 25.51%) > NAE (38.75% and 25.34%). The regression analysis showed no significant relation (R2) between the fertilization rate and effect of amendments on the difference in means of 53all agronomic parameters of the three crops except wheat NAE and PAN (0.14 and 0.26, respectively) and rice YSFP and PAN (0.13 and 0.13), which showed significant relations (Table 2).

4. Discussion

4.1. Overall Description of the Study Variables

The meta-analysis values presented by the forest plots refer to the reductions in agronomic parameters as a result of N losses through AV. AV-induced N loss means more N are needed to maintain the same yield, which will result in reducing the agronomic weights of nitrogen fertilization. Additionally, these losses decrease the crop yield, which negatively affects the agronomic weights (YSFP, NUE, NAE, and PAN). No direct measurements have been introduced to weight the agronomic AV effects, but a statistical description of these responses was introduced in numerous studies [41,54]. There were negative correlations between AV and agronomic parameters of wheat, maize, and rice (NAE, PAN as nitrogen partial factor productivity and NUE) [20,54,55]. These parameters responded significantly to AV in rice higher than maize and then wheat as a result of differences between AV rates from each crop, wherein AV losses represented 30–39% of the applied N in rice, 11–48% in maize, and less in wheat (1–20%) [14]. Recently, Abdo, Shi, Li, Yang, Wang, Li, Abdel-Hamed, Merwad and Wang [7] reported in a meta-analysis study that AV as change ratio at CI = 95% in rice was higher than maize and wheat by 18.21% and 5.13%, and these changes were significantly correlated with agronomic conditions (air temperature, precipitation, and soil properties). Additionally, another meaningful explanatory factor for variations in the responses of agronomic parameters to N losses (AV) is yield stability measured by Sustainable yield index (SYI). The overall SYI of maize (0.84) was higher than wheat (0.75), especially under high N fertilization rates, while the yield stability of wheat was higher than maize when reducing applied N by 25–50% [55]. Under the same N fertilization treatment, wheat showed higher SYI (0.41) than rice (0.33) [56]. Reductions in yield stability explained the higher sensitivity of rice than maize and then wheat to AV losses.
The strong coefficient of determination (R2) between YSFP (followed by PAN) and AV in wheat and rice indicates the importance of these two parameters in evaluating the effects of AV on yield reductions. On the other hand, NUE is an efficient parameter with the highest R2 to measure the response of maize yield to N losses via AV. Notably, YSFP and PAN parameters, which are functions of same two factors (N rate and grain yield, Equations (4) and (7)), were effective in weighting AV agronomic weights of high density crops (wheat and rice), while NUE parameter, which is a function of the difference between N uptake of treatment and control and applied N rate (Equation (5)), was effective with maize (low density crop). It seems that the plant density had an indirect effect on these agronomic parameters through affecting AV. Emitted NH3 decreased with the increased plant density as the crop canopy can change microclimates [57]. Wheat YSFP as yield-scaled NH3 emission and maize NUE were presented as valuable parameters for balancing the trade-off between AV and yield performance [58]. In contrast, using the difference between grain yield of the treatment and control and N rate (NAE, Equation (6)) failed to describe the changes in agronomic parameters in response to AV effectively in the three crops. Similarly, there were moderate negative correlations (r < 0.40) between wheat parameters (NUE as nitrogen recovery efficiency and NAE) [59]. Additionally, the strong correlation between NUE and PAN in the three crops indicates the suitability of using one of them as an efficient measurement for weighting the agronomic impact of AV.
The overall reductions in the agronomic parameters caused by AV were affected positively or negatively by the agronomic conditions and practices as illustrated by the path analysis. These conditions and practices affect both AV and plant growth and yield of the three crops. NH3 volatilization is a complex process of inseparable factors (crop, climate, and soil properties) [60]. As observed in the present study, temperature increased the reductions in the agronomic parameters in wheat and rice while mitigating these reductions in maize (Figure 3). Precipitation increased the decreases in these parameters in maize and rice, while it decreased them in wheat. Temperature and precipitation are important factors for N fertilizer hydrolysis and NH3 formation and diffusion rate [17,61]. AV showed significant variations across China in response to differences in soil properties (especially soil pH, clay content, soil organic matter content, and soil total nitrogen), which was presented by stepwise regression equation as potential AV (Y) = 2.89 − 0.0059 clay − 0.0453 SOM + 0.1431 pH + 0.1477 STN [11]. Detailed discussions about these interactions are available in our previous work [7]. In parallel, soil properties (fertility level) affect plant growth and production, which could indicate variations in AV agronomic weights.

4.2. Response of AV Agronomic Weights to N Rates

A relative increment in AV with increasing N rate has been stated as a scientific rule by extensive search findings, with an overall average of 18% emitted from the applied N [62,63]. However, our study showed an irrelative increase in the reductions of agronomic parameters as affected by AV with the increased N rate, which indicates an irregular response of grain yield and N uptake to the increased N rates. The reversible correlation between YSFP and PAN (Equations (4) and (7)) was presented in our study, especially with wheat and maize, wherein C1 and C2 recorded the highest reductions in YSFP and lowest reductions in PAN, while the opposite trend was recorded under C5 and C6. Hence, the two parameters are effective in reflecting the effect of N rate on agronomic AV changes in wheat and maize, while NAE could be the most appropriate parameter for rice crop, which had the highest reduction at C6 and the lowest at C2. Crop characteristics such as plant height, plant density, leaf area, growth season and period, and N needs may affect AV indirectly or directly, which consequently results in AV variations according to crop type [64]. An irrelative response of AV to N rate as reported in the meta-analysis study by Abdo, Shi, Li, Yang, Wang, Li, Abdel-Hamed, Merwad and Wang [7] is an important explanatory case for the irregular changes in agronomic AV weights. They illustrated that there were large variations in AV from the wheat field among C1 to C4, while these variations were smaller among C4 to C6. Also, AV from maize fields increased notably with increasing N rate from C1 to C2 and from C3 to C4 while other rates showed small increases in AV. Likewise, AV from rice fields showed a higher response to increased N rates from C1 to C2 and C4 to C5 as compared with other N rates. Additionally, grain yield and N uptake (the main variables of calculating agronomic parameters) showed irrelative responses to the increased N rates [65], which affected the agronomic weights of AV according to our findings. The response of AV to application depth at different N rates represented in our regression analysis may affect AV agronomic weights especially in wheat crop.

4.3. Response of AV Agronomic Weights to Fertilizer Type

Significant reductions in the AV-induced decreases in agronomic parameters were reported under the application of slow-release fertilizers (IU). Slow N release from a rich N source (coated urea) for a longer time would mitigate AV by decreasing the hydrolysis and ammonification rate in parallel with increasing the N uptake by plants [66,67]. In addition to containing very slow-releasing nitrogen, organic amendments (OA) notably improve soil’s physical, chemical, and microbial properties, which improve plant growth and production and reduce AV. That would explain the lowest reductions in NUE of wheat and NAE of maize and rice in our analysis [68]. Nevertheless, crop yield is significantly decreased as more mineral N was replaced by OA due to its relatively lower availability than synthetic N [66], an observation which is supported by our results about the highest reduction in maize NUE under OA application. Our results indicated that the commercial fertilizers classified to urea (U) as the most common fertilizer in China and other sources (OCF) reported the highest reductions in agronomic parameters in response to AV. These fertilizers showed higher AV than OA and IU owing to higher available N contents [U (466 g N kg−1), OCF such as ammonium nitrate (335 g N kg−1), calcium ammonium nitrate (260 g N kg−1), ammonium sulfate (205 g N kg−1), and ammonium bicarbonate (155 g N kg−1)]. However, our meta-analysis robustly demonstrates a new important finding, i.e., the highest reductions in NUE of wheat and NAE of maize and rice under OA application indicate a lower response of grain yield and N uptake with a higher response of AV to the applied N as OA. Also, OCF reported the highest reductions in wheat and rice agronomic parameters as affected by AV, while in maize, U recorded the highest reductions. These results were comparable with that obtained by Abdo, Shi, Li, Yang, Wang, Li, Abdel-Hamed, Merwad and Wang [7], who reported increments in U (AV) from wheat and maize fields by 13.4% and 7.5% and a decrease by 12.9% when compared with OCF (AV). This could be linked with the lower N content in OCF than U, which means less response of grain yield and N uptake, while the water-logged conditions in rice fields seem to be more favorable for OCF hydrolysis, especially diammonium phosphate (DAP) ammonium nitrate and ammonium sulfate [69,70]. It is worth mentioning that the lowest reduction in rice NUE as a response to AV was recorded with U not IU applications, although IU had the highest effect on mitigating AV from rice fields [7]. This could be explained by the low rates of IU used in our analysis compared with U rates. Accordingly, YSFP and PAN are more efficient parameters in weighting AV agronomic response to fertilizer type strategy than NUE and NAE.

4.4. Response of AV Agronomic Weights to Application Depth

Our meta-analytic study reported significant efficacy of the subsurface application of N fertilizers on reducing the weight of agronomic AV losses compared with surface application, which agreed with the findings of Huang, Lv, Bloszies, Shi, Pan and Zeng [66], who reported an increase in crop yield and a decrease in yield scaled NH3 under subsurface application technique. It has been widely established that deep application of N fertilizer into the soil mitigates emitted NH3 through a number of mechanisms, including alternation of soil urease activity, reduction of NH4+ concentrations in paddy floodwater and surface soils, and augmentation of NH4+ immobilization [7,71]. We noticed differences in the response of each parameter to AV among the three crops, where YSFP recorded the highest sensitivity to AV in wheat, while NUE and PAN were the most sensitive to AV in rice and maize, respectively. Wide variations among the grain yield of these crops could have a significant contribution in these differences in addition to variations in AV according to crop type as stated previously. N rates showed a significant effect on the response of weighted AV agronomic parameters to the depth of application, as illustrated by the regression analysis (Table 2). We found previously that reductions in AV in response to subsurface application were increased with increasing fertilization rate, especially higher than C3. Also, applying N at rate (C4) reported a higher response of AV to subsurface application in wheat than maize and then rice, while using the highest N rates (C5 and C6) resulted in higher response of AV to application depth in rice than maize and wheat [7]. These findings clearly point out the differences in the sensitivity of the investigated parameters to AV among the three crops in response to the application depth technique. Also, they indicate the efficiency of using YSFP with wheat, NUE with rice, and PAN with maize when studying the effect of application depth on agronomic AV weights.

4.5. Response of AV Agronomic Weights to Applied Amendments

Our analysis indicated a higher promotion effect of inhibitors to the agronomic properties of wheat, maize, and rice against the losses by AV than other amendments. This promotion effect illustrated by the reductions in the mean difference between observed and adjusted agronomic properties has two main pathways: the first is altering AV by inhibiting the urease activity stronger than mulch and biochar [7,72]. The second is that inhibitors showed positive effects on crop yield (5.3% increase more than single urea in a meta-analysis by Silva, et al. [73]) and resulted in higher NUE than biochar and mulch [54,74]. Additionally, there are numerous contradictory findings about the role of biochar in reducing agronomic-scaled NH3, where biochar’s effect on mitigating AV and optimizing crop yield depends mainly on its type, rate, and soil properties, especially pH [75]. In parallel, Vaccari, et al. [76] reported an increment in wheat yield of 28.5% after biochar application, while Blackwell, et al. [77] indicated a negative influence of biochar at a high rate on wheat yield. Interestingly, Xie, et al. [78] reported no apparent effect of biochar on rice yield. Biochar may increase AV by increasing soil pH and C:N ratio, but it also can improve crop yield due to increasing the retention of NH4+-N and NO3-N against leaching [79,80]. Our analysis robustly indicated a lower effect of mulch on controlling the reductions in agronomic parameters induced by AV, as our study included all mulching types with different N rates. Mulch increased the reductions in AV agronomic weights over no amendment application in rice. Film and stalk mulches can reduce AV significantly [33,81], however, Sun, et al. [82] reported that straw mulching could increase AV with no effect on the crop yield or NUE in wheat–rice rotation system. Generally, it could be stated that the application of inhibitors is the best strategy for enhancing the agronomic parameters of wheat, maize, and rice against AV losses, while mulching is not an effective strategy with rice, but better than biochar with wheat. Biochar application is effective in promoting the yield-scaled AV of maize and rice more than mulching. The responses of crop production to AV could be weighted efficiently following the order: YSFP > PAN > NUE > NAE when neglecting the fertilizer rate effect. When including N rates, it is better to use PAN and NAE for wheat and YSFP or PAN for rice, as reported by the regression analysis. Our recent study showed significant variations among the effect of amendments on AV mitigation in response to crop type, fertilizer rate, and agronomic conditions [7]. All parameters followed the same order within each crop except NAE of maize, which indicates a dominant effect of controlling grain yield, thus it could not be an effective parameter for weighting agronomic AV reductions from maize fields.

5. Conclusions

Besides causing environmental adversity, ammonia volatilization from N fertilizers induces significant economic losses directly through losing N fertilizer or indirectly through reduction in crop yield. Our analysis was directed to weight the reductions in crop yield by AV using four agronomic parameters. We found differences in the efficacy of these parameters in weighting agronomic AV losses according to crop type, fertilizer type and rate, application depth, and applied amendments, in addition to agronomic conditions. Generally, a direct proportion of yield and AV, as used by YSFP and PAN, showed higher stability under various conditions and mitigation strategies of AV especially with wheat and maize, while NUE was effective with rice. However, adding yield of control to the equation (NAE) had a negative effect on the parameter sensitivity to AV agronomic losses. These parameters were not efficient in weighting the response of AV agronomic losses to applied N rates and amendments (except inhibitors), especially with rice, while they all weighted AV agronomic losses in response to application depth and fertilizer type effectively. Accordingly, the lowest AV agronomic losses (except YSFP) were reported under the highest fertilization rate (C6) in wheat and maize, while these losses were the lowest under fertilization rate (C2:C4) in rice. IU recorded the lowest AV agronomic losses in wheat and maize, while the lowest losses with NUE and NAE in rice were reported under the application of urea and organic amendments. Further research has to be done to find out an applicable parameter reflecting all controlling factors when weighting AV agronomic losses.

Supplementary Materials

The following are available online at https://www.mdpi.com/article/10.3390/agronomy11122593/s1, Figure S1: Normal distribution of the observed data included in the meta-analysis after bootstrapping by SPSS Statistics 20 (IBM, USA); Table S1: Agronomic conditions and practices of the collected studies and scaled agronomic NH3 using the emitted ammonia and increased in yield; Table S2: List of abbreviations.

Author Contributions

Conceptualization, methodology, visualization, writing—original draft: A.I.A. and E.-S.E.A.E.-S.; data curation, formal analysis, software: A.I.A. and D.S.; Investigation: A.I.A. and H.W.; Project administration, resources, validation, writing—review and editing: H.W. and J.Z.; Funding acquisition, supervision: J.Z. All authors have read and agreed to the published version of the manuscript.

Funding

This study was supported by Science and Technology Planning Project of Guangdong Province of China (grant number 2019B030301007) and Special Funds for the Cultivation of Guangdong College Students’ Scientific and Technological Innovation (grant number pdjh2020b0092).

Institutional Review Board Statement

Not applicable.

Informed Consent Statement

Not applicable.

Data Availability Statement

All data generated or analyzed during this study are included in this published article and its Supplementary Information Files.

Conflicts of Interest

The authors declare no competing interests.

References

  1. FAO. Crop Production by Country. Available online: http://www.fao.org/faostat/en/#data (accessed on 25 May 2021).
  2. IFA. Nitrogen Statistics from 1961–2015; IFA: Belfast, UK, 2018. [Google Scholar]
  3. Zhang, X.; Davidson, E.A.; Mauzerall, D.L.; Searchinger, T.D.; Dumas, P.; Shen, Y. Managing nitrogen for sustainable development. Nature 2015, 528, 51–59. [Google Scholar] [CrossRef] [Green Version]
  4. Lassaletta, L.; Billen, G.; Grizzetti, B.; Anglade, J.; Garnier, J. 50 year trends in nitrogen use efficiency of world cropping systems: The relationship between yield and nitrogen input to cropland. Environ. Res. Lett. 2014, 9, 105011. [Google Scholar] [CrossRef]
  5. Fu, X.; Wang, S.X.; Ran, L.M.; Pleim, J.E.; Cooter, E.; Bash, J.O.; Benson, V.; Hao, J.M. Estimating NH3 emissions from agricultural fertilizer application in China using the bi-directional CMAQ model coupled to an agro-ecosystem model. Atmos. Chem. Phys. 2015, 15, 745–778. [Google Scholar] [CrossRef] [Green Version]
  6. Yang, W.; Que, H.; Wang, S.; Zhu, A.; Zhang, Y.; He, Y.; Xin, X.; Zhang, X.; Ding, S. High temporal resolution measurements of ammonia emissions following different nitrogen application rates from a rice field in the Taihu Lake Region of China. Environ. Pollut. 2020, 257, 113489. [Google Scholar] [CrossRef] [PubMed]
  7. Abdo, A.I.; Shi, D.; Li, J.; Yang, T.; Wang, X.; Li, H.; Abdel-Hamed, E.M.; Merwad, A.-R.M.; Wang, L. Ammonia emission from staple crops in China as response to mitigation strategies and agronomic conditions: Meta-analytic study. J. Clean. Prod. 2021, 279, 123835. [Google Scholar] [CrossRef]
  8. Wang, G.; Chen, X.; Cui, Z.; Yue, S.; Zhang, F. Estimated reactive nitrogen losses for intensive maize production in China. Agric. Ecosyst. Environ. 2014, 197, 293–300. [Google Scholar] [CrossRef]
  9. Han, K.; Zhou, C.-J.; Wang, L.-Q. Reducing ammonia volatilization from maize fields with separation of nitrogen fertilizer and water in an alternating furrow irrigation system. J. Integr. Agric. 2014, 13, 1099–1112. [Google Scholar] [CrossRef] [Green Version]
  10. Yan, X.; Akimoto, H.; Ohara, T. Estimation of nitrous oxide, nitric oxide and ammonia emissions from croplands in East, Southeast and South Asia. Glob. Chang. Biol. 2003, 9, 1080–1096. [Google Scholar] [CrossRef]
  11. Duan, Z.; Xiao, H. Effects of soil properties on ammonia volatilization. Soil Sci. Plant Nutr. 2000, 46, 845–852. [Google Scholar]
  12. Xiao, J.; Fan, J.; Ye, G.; Liu, D.; Yan, J.; Luo, J.; Houlbrooke, D.; Ding, W. Ammonia volatilization from fluvo-aquic clay soil and its influencing factors during wheat growing season under different fertilization. J. Agro-Eviron. Sci. 2016, 35, 2011–2018. [Google Scholar]
  13. Ji, Y.; Ju, X.; Liu, X.; Zhang, L.; Li, X.; Liu, N. Ampact of different nitrogen application on nitrogen movement and gaseous loss of winter wheat fields. J. Soil Water Conserv. 2010, 24, 113–118. [Google Scholar]
  14. Cai, G.; Chen, D.; Ding, H.; Pacholski, A.; Fan, X.; Zhu, Z. Nitrogen losses from fertilizers applied to maize, wheat and rice in the North China Plain. Nutr. Cycl. Agroecosyst. 2002, 63, 187–195. [Google Scholar] [CrossRef]
  15. Ma, B.L.; Wu, T.Y.; Tremblay, N.; Deen, W.; Mclaughlin, N.B.; Morrison, M.J.; Stewart, G. On-Farm Assessment of the Amount and Timing of Nitrogen Fertilizer on Ammonia Volatilization. Agron. J. 2010, 102, 134–144. [Google Scholar] [CrossRef]
  16. Wu, P.; Liu, J.; Yang, X.; Shang, Q.; Zhou, Y.; Xie, X.; Shen, Q.; Guo, S. Effects of different fertilization systems on ammonia volatilization from double-rice cropping field in red soil region. Chin. J. Rice Sci. 2009, 23, 85–93. [Google Scholar]
  17. Fan, X.; Li, Y.; Alva, A. Effects of temperature and soil type on ammonia volatilization from slow-release nitrogen fertilizers. Commun. Soil Sci. Plant Anal. 2011, 42, 1111–1122. [Google Scholar] [CrossRef]
  18. Nakhshiniev, B.; Perera, C.; Biddinika, M.K.; Gonzales, H.B.; Sumida, H.; Yoshikawa, K. Reducing ammonia volatilization during composting of organic waste through addition of hydrothermally treated lignocellulose. Int. Biodeterior. Biodegrad. 2014, 96, 58–62. [Google Scholar] [CrossRef]
  19. Ju, X.-T.; Xing, G.-X.; Chen, X.-P.; Zhang, S.-L.; Zhang, L.-J.; Liu, X.-J.; Cui, Z.-L.; Yin, B.; Christie, P.; Zhu, Z.-L. Reducing environmental risk by improving N management in intensive Chinese agricultural systems. Proc. Natl. Acad. Sci. USA 2009, 106, 3041–3046. [Google Scholar] [CrossRef] [PubMed] [Green Version]
  20. Li, Q.; Yang, A.; Wang, Z.; Roelcke, M.; Chen, X.; Zhang, F.; Pasda, G.; Zerulla, W.; Wissemeier, A.H.; Liu, X. Effect of a new urease inhibitor on ammonia volatilization and nitrogen utilization in wheat in north and northwest China. Field Crop. Res. 2015, 175, 96–105. [Google Scholar] [CrossRef]
  21. Sanz-Cobena, A.; Misselbrook, T.; Camp, V.; Vallejo, A. Effect of water addition and the urease inhibitor NBPT on the abatement of ammonia emission from surface applied urea. Atmos. Environ. 2011, 45, 1517–1524. [Google Scholar] [CrossRef] [Green Version]
  22. Xiao, X.; Yang, L.; Deng, Y.; Wang, J. Effects of irrigation and nitrogen fertilization on ammonia volatilization in paddy field. J. Agro-Environ. Sci. 2012, 31, 2066–2071. [Google Scholar]
  23. Xing, G.; Zhu, Z. An assessment of N loss from agricultural fields to the environment in China. Nutr. Cycl. Agroecosyst. 2000, 57, 67–73. [Google Scholar] [CrossRef]
  24. Deng, M.; Yin, B.; Zhang, S.; Zhu, Z.; Shi, X. Effects of rate and method of N application on ammonia volatilization in paddy fields. Soils 2006, 38, 263–269. [Google Scholar]
  25. Choudhury, A.; Kennedy, I. Nitrogen fertilizer losses from rice soils and control of environmental pollution problems. Commun. Soil Sci. Plant Anal. 2005, 36, 1625–1639. [Google Scholar] [CrossRef]
  26. Wang, S.; Shan, J.; Xia, Y.; Tang, Q.; Xia, L.; Lin, J.; Yan, X. Different effects of biochar and a nitrification inhibitor application on paddy soil denitrification: A field experiment over two consecutive rice-growing seasons. Sci. Total Environ. 2017, 593, 347–356. [Google Scholar] [CrossRef] [PubMed] [Green Version]
  27. Yang, Y.; Zhang, M.; Li, Y.; Fan, X.; Geng, Y. Controlled release urea improved nitrogen use efficiency, activities of leaf enzymes, and rice yield. Soil Sci. Soc. Am. J. 2012, 76, 2307–2317. [Google Scholar] [CrossRef]
  28. Rawluk, C.; Grant, C.; Racz, G. Ammonia volatilization from soils fertilized with urea and varying rates of urease inhibitor NBPT. Can. J. Soil Sci. 2001, 81, 239–246. [Google Scholar] [CrossRef]
  29. Huijsmans, J.; Hol, J.; Vermeulen, G. Effect of application method, manure characteristics, weather and field conditions on ammonia volatilization from manure applied to arable land. Atmos. Environ. 2003, 37, 3669–3680. [Google Scholar] [CrossRef]
  30. Zhang, T.; Liu, H.; Luo, J.; Wang, H.; Zhai, L.; Geng, Y.; Zhang, Y.; Li, J.; Lei, Q.; Bashir, M.A. Long-term manure application increased greenhouse gas emissions but had no effect on ammonia volatilization in a Northern China upland field. Sci. Total Environ. 2018, 633, 230–239. [Google Scholar] [CrossRef]
  31. Zhao, X.; Yan, X.; Wang, S.; Xing, G.; Zhou, Y. Effects of the addition of rice-straw-based biochar on leaching and retention of fertilizer N in highly fertilized cropland soils. Soil Sci. Plant Nutr. 2013, 59, 771–782. [Google Scholar] [CrossRef]
  32. Feng, Y.; Sun, H.; Xue, L.; Liu, Y.; Gao, Q.; Lu, K.; Yang, L. Biochar applied at an appropriate rate can avoid increasing NH3 volatilization dramatically in rice paddy soil. Chemosphere 2017, 168, 1277–1284. [Google Scholar] [CrossRef]
  33. He, T.; Liu, D.; Yuan, J.; Luo, J.; Lindsey, S.; Bolan, N.; Ding, W. Effects of application of inhibitors and biochar to fertilizer on gaseous nitrogen emissions from an intensively managed wheat field. Sci. Total Environ. 2018, 628, 121–130. [Google Scholar] [CrossRef]
  34. Sun, Y.; Xia, G.; He, Z.; Wu, Q.; Zheng, J.; Li, Y.; Wang, Y.; Chen, T.; Chi, D. Zeolite amendment coupled with alternate wetting and drying to reduce nitrogen loss and enhance rice production. Field Crop. Res. 2019, 235, 95–103. [Google Scholar] [CrossRef]
  35. Yang, Y.; Zhou, C.; Li, N.; Han, K.; Meng, Y.; Tian, X.; Wang, L. Effects of conservation tillage practices on ammonia emissions from Loess Plateau rain-fed winter wheat fields. Atmos. Environ. 2015, 104, 59–68. [Google Scholar] [CrossRef]
  36. Sanz-Cobena, A.; Lassaletta, L.; Estellés, F.; Prado, A.D.; Guardia, G.; Abalos, D.; Aguilera, E.; Pardo, G.; Vallejo, A.; Sutton, M.A. Yield-scaled mitigation of ammonia emission from N fertilization: The Spanish case. Environ. Res. Lett. 2014, 2014, 1–12. [Google Scholar] [CrossRef]
  37. Pittelkow, C.M.; Adviento-Borbe, M.A.; Kessel, C.V.; Hill, J.E.; Linquist, B.A. Optimizing rice yields while minimizing yield-scaled global warming potential. Glob. Chang. Biol. 2014, 20, 1382–1393. [Google Scholar] [CrossRef] [PubMed]
  38. Zhao, M.; Tian, Y.; Ma, Y.; Zhang, M.; Yao, Y.; Xiong, Z.; Yin, B.; Zhu, Z. Mitigating gaseous nitrogen emissions intensity from a Chinese rice cropping system through an improved management practice aimed to close the yield gap. Agric. Ecosyst. Environ. 2015, 203, 36–45. [Google Scholar] [CrossRef]
  39. Chen, G.; Chen, Y.; Zhao, G.; Cheng, W.; Guo, S.; Zhang, H.; Shi, W. Do high nitrogen use efficiency rice cultivars reduce nitrogen losses from paddy fields? Agric. Ecosyst. Environ. 2015, 209, 26–33. [Google Scholar] [CrossRef] [Green Version]
  40. Delogu, G.; Cattivelli, L.; Pecchioni, N.; De Falcis, D.; Maggiore, T.; Stanca, A. Uptake and agronomic efficiency of nitrogen in winter barley and winter wheat. Eur. J. Agron. 1998, 9, 11–20. [Google Scholar] [CrossRef]
  41. Jia, X.; Shao, L.; Liu, P.; Zhao, B.; Gu, L.; Dong, S.; Bing, S.H.; Zhang, J.; Zhao, B. Effect of different nitrogen and irrigation treatments on yield and nitrate leaching of summer maize (Zea mays L.) under lysimeter conditions. Agric. Water Manag. 2014, 137, 92–103. [Google Scholar] [CrossRef]
  42. Shangguan, W.; Dai, Y.J.; Liu, B.Y.; Zhu, A.X.; Duan, Q.Y.; Wu, L.Z.; Ji, D.Y.; Ye, A.Z.; Yuan, H.; Zhang, Q. A China data set of soil properties for land surface modeling (EI). J. Adv. Model. Earth Syst. 2013, 5, 212–224. [Google Scholar] [CrossRef]
  43. Staff, S.S. Web Soil Survey. Available online: https://websoilsurvey.sc.egov.usda.gov/App/HomePage.htm (accessed on 1 June 2021).
  44. Jian, J.; Du, X.; Reiter, M.S.; Stewart, R.D. A meta-analysis of global cropland soil carbon changes due to cover cropping. Soil Biol. Biochem. 2020, 143, 107735. [Google Scholar] [CrossRef]
  45. Nkebiwe, P.M.; Weinmann, M.; Bar-Tal, A.; Müller, T. Fertilizer placement to improve crop nutrient acquisition and yield: A review and meta-analysis. Field Crop. Res. 2016, 196, 389–401. [Google Scholar] [CrossRef]
  46. Borenstein, M.; Hedges, L.V.; Higgins, J.; Rothstein, H.R. Comprehensive Meta-Analysis; National Institutes of Health: Bethesda, MD, USA, 2006. [Google Scholar]
  47. Pierce, C. Comprehensive Meta-Analysis. 2008. Available online: https://www.meta-analysis.com/index.php (accessed on 1 June 2021).
  48. Piepho, H.P.; Williams, E.R.; Madden, L.V. The Use of Two-Way Linear Mixed Models in Multitreatment Meta-Analysis. Biometrics 2013, 68, 1269–1277. [Google Scholar] [CrossRef] [PubMed]
  49. Higgins, J. Introduction to Meta-Analysis; John Wiley & Sons, Ltd.: Hoboken, NJ, USA, 2009. [Google Scholar]
  50. Rosenberg, M.S.; Adams, D.C.; Gurevitch, J. Meta Win: Statistical Software for Meta-Analysis with Resampling Tests; Ver. 1.0.; Sinauer Associates: Sunderland, MA, USA, 1997. [Google Scholar]
  51. Silva, T.N.; Moro, G.V.; Moro, F.V.; Santos, D.; Buzinaro, R. Correlation and path analysis of agronomic and morphological traits in maize. Rev. Cienc. Agron. 2016, 47, 351–357. [Google Scholar] [CrossRef] [Green Version]
  52. Yang, G.; Ji, H.; Sheng, J.; Zhang, Y.; Chen, L. Combining Azolla and urease inhibitor to reduce ammonia volatilization and increase nitrogen use efficiency and grain yield of rice. Sci. Total Environ. 2020, 743, 140799. [Google Scholar] [CrossRef]
  53. He, T.; Liu, D.; Yuan, J.; Ni, K.; Zaman, M.; Luo, J.; Lindsey, S.; Ding, W. A two years study on the combined effects of biochar and inhibitors on ammonia volatilization in an intensively managed rice field. Agric. Ecosyst. Environ. 2018, 264, 44–53. [Google Scholar] [CrossRef]
  54. Zhong, X.; Zhou, X.; Fei, J.; Huang, Y.; Peng, J. Reducing ammonia volatilization and increasing nitrogen use efficiency in machine-transplanted rice with side-deep fertilization in a double-cropping rice system in Southern China. Agric. Ecosyst. Environ. 2021, 306, 107183. [Google Scholar] [CrossRef]
  55. Yang, Q.; Liu, P.; Dong, S.; Zhang, J.; Zhao, B. Effects of fertilizer type and rate on summer maize grain yield and ammonia volatilization loss in northern China. J. Soils Sediments 2019, 19, 2200–2211. [Google Scholar] [CrossRef]
  56. Liu, Z.; Sun, K.; Liu, W.; Gao, T.; Li, G.; Han, H.; Li, Z.; Ning, T. Responses of soil carbon, nitrogen, and wheat and maize productivity to 10 years of decreased nitrogen fertilizer under contrasting tillage systems. Soil Tillage Res. 2020, 196, 104444. [Google Scholar] [CrossRef]
  57. Manna, M.C.; Swarup, A.; Wanjari, R.H.; Ravankar, H.N.; Mishra, B.; Saha, M.N.; Singh, Y.V.; Sahi, D.K.; Sarap, P.A. Long-term effect of fertilizer and manure application on soil organic carbon storage, soil quality and yield sustainability under sub-humid and semi-arid tropical India. Field Crop. Res. 2005, 93, 264–280. [Google Scholar] [CrossRef]
  58. Peng, S.; Buresh, R.J.; Huang, J.; Zhong, X.; Zou, Y.; Yang, J.; Wang, G.; Liu, Y.; Hu, R.; Tang, Q. Improving nitrogen fertilization in rice by site-specific N management. A review. Agron. Sustain. Dev. 2010, 30, 649–656. [Google Scholar] [CrossRef]
  59. Guo, R.; Miao, W.; Fan, C.; Li, X.; Shi, X.; Li, F.; Qin, W. Exploring optimal nitrogen management for high yielding maize in arid areas via 15 N-labeled technique. Geoderma 2021, 382, 114711. [Google Scholar]
  60. Wan, X.B.; Wu, W.A.; Shah, F.C. Nitrogen fertilizer management for mitigating ammonia emission and increasing nitrogen use efficiencies by 15 N stable isotopes in winter wheat. Sci. Total Environ. 2021, 790, 147587. [Google Scholar] [CrossRef] [PubMed]
  61. Behera, S.N.; Sharma, M.; Aneja, V.P.; Balasubramanian, R. Ammonia in the atmosphere: A review on emission sources, atmospheric chemistry and deposition on terrestrial bodies. Environ. Sci. Pollut. Res. Int. 2013, 20, 8092–8131. [Google Scholar] [CrossRef]
  62. Fenn, L.B.; Hossner, L.R. Ammonia Volatilization from Ammonium or Ammonium-Forming Nitrogen Fertilizers. Adv. Soil Sci. 1985, 123–169. [Google Scholar] [CrossRef]
  63. Han, K.; Han, X.; Curtis, D.J.; Kleinman, P.J.A.; Wang, D.; Wang, L. Impact of Irrigation, Nitrogen Fertilization, and Spatial Management on Maize. Agron. J. 2016, 108, 1794–1804. [Google Scholar] [CrossRef]
  64. Wang, H.; Zhang, D.; Zhang, Y.; Zhai, L.; Yin, B.; Zhou, F.; Geng, Y.; Pan, J.; Luo, J.; Gu, B. Ammonia emissions from paddy fields are underestimated in China. Environ. Pollut. 2018, 235, 482–488. [Google Scholar] [CrossRef] [PubMed]
  65. Sommer, S.G.; Schjoerring, J.K.; Denmead, O.T. Ammonia emission from mineral fertilizers and fertilized crops. Adv. Agron. 2004, 82, 557–622. [Google Scholar]
  66. Pelzer, E.; Hombert, N.; Jeuffroy, M.H.; Makowski, D. Meta-Analysis of the Effect of Nitrogen Fertilization on Annual Cereal-Legume Intercrop Production. Agron. J. 2014, 106, 1775–1786. [Google Scholar] [CrossRef]
  67. Huang, S.; Lv, W.; Bloszies, S.; Shi, Q.; Pan, X.; Zeng, Y. Effects of fertilizer management practices on yield-scaled ammonia emissions from croplands in China: A meta-analysis. Field Crop. Res. 2016, 192, 118–125. [Google Scholar] [CrossRef]
  68. Qiao, C.; Liu, L.; Hu, S.; Compton, J.E.; Greaver, T.L.; Li, Q. How inhibiting nitrification affects nitrogen cycle and reduces environmental impacts of anthropogenic nitrogen input. Glob. Chang. Biol. 2015, 21, 1249–1257. [Google Scholar] [CrossRef]
  69. Bell, M.J.; Hinton, N.J.; Cloy, J.M.; Topp, C.; Rees, R.M.; Williams, J.R.; Misselbrook, T.H.; Chadwick, D.R. How do emission rates and emission factors for nitrous oxide and ammonia vary with manure type and time of application in a Scottish farmland? Geoderma 2016, 264, 81–93. [Google Scholar] [CrossRef]
  70. Li, Y.; Huang, L.; Zhang, H.; Wang, M.; Liang, Z. Assessment of Ammonia Volatilization Losses and Nitrogen Utilization during the Rice Growing Season in Alkaline Salt-Affected Soils. Sustainability 2017, 9, 132. [Google Scholar] [CrossRef] [Green Version]
  71. Zhang, Y.; Luan, S.; Chen, L.; Shao, M. Estimating the volatilization of ammonia from synthetic nitrogenous fertilizers used in China. J. Environ. Manag. 2011, 92, 480–493. [Google Scholar] [CrossRef] [PubMed]
  72. Liu, T.Q.; Fan, D.J.; Zhang, X.X.; Chen, J.; Li, C.F.; Cao, C.G. Deep placement of nitrogen fertilizers reduces ammonia volatilization and increases nitrogen utilization efficiency in no-tillage paddy fields in central China. Field Crop. Res. 2015, 184, 80–90. [Google Scholar] [CrossRef]
  73. Saggar, S.; Singh, J.; Giltrap, D.L.; Zaman, M.; Luo, J.; Rollo, M.; Kim, D.G.; Rys, G.; Weerden, T. Quantification of reductions in ammonia emissions from fertiliser urea and animal urine in grazed pastures with urease inhibitors for agriculture inventory: New Zealand as a case study. Sci. Total Environ. 2013, 465, 136–146. [Google Scholar] [CrossRef] [PubMed]
  74. Silva, A.; Sequeira, C.H.; Sermarini, R.A.; Otto, R. Urease Inhibitor NBPT on Ammonia Volatilization and Crop Productivity: A Meta-Analysis. Agron. J. 2017, 109, 1–13. [Google Scholar] [CrossRef]
  75. Dawar, K.; Khan, A.; Sardar, K.; Fahad, S.; Danish, S. Effects of the nitrification inhibitor nitrapyrin and mulch on N2O emission and fertilizer use efficiency using 15 N tracing techniques. Sci. Total Environ. 2020, 757, 143739. [Google Scholar] [CrossRef] [PubMed]
  76. Sha, Z.; Li, Q.; Lv, T.; Misselbrook, T.; Liu, X. Response of ammonia volatilization to biochar addition: A meta-analysis. Sci. Total Environ. 2019, 655, 1387–1396. [Google Scholar] [CrossRef]
  77. Vaccari, F.P.; Baronti, A.S.; Lugato, A.E.; Genesio, A.L.; Castaldi, B.S.; Fornasier, F.; Miglietta, F. Biochar as a strategy to sequester carbon and increase yield in durum wheat. Eur. J. Agron. 2011, 34, 231–238. [Google Scholar] [CrossRef]
  78. Blackwell, P.; Krull, E.; Butler, G.; Herbert, A.; Solaiman, Z. Effect of banded biochar on dryland wheat production and fertiliser use in south-western Australia: An agronomic and economic perspective. Soil Res. 2010, 48, 531–545. [Google Scholar] [CrossRef]
  79. Xie, Z.; Xu, Y.; Liu, G.; Qi, L.; Hu, S. Impact of biochar application on nitrogen nutrition of rice, greenhouse-gas emissions and soil organic carbon dynamics in two paddy soils of China. Plant Soil 2013, 370, 527–540. [Google Scholar] [CrossRef]
  80. Ghorbani, M.; Asadi, H.; Abrishamkesh, S. Effects of rice husk biochar on selected soil properties and nitrate leaching in loamy sand and clay soil. Int. Soil Water Conserv. Res. 2019, 7, 258–265. [Google Scholar] [CrossRef]
  81. Li, H.; Wang, L.; Peng, Y.; Zhang, S.; Wang, L. Film mulching, residue retention and N fertilization affect ammonia volatilization through soil labile N and C pools. Agric. Ecosyst. Environ. 2021, 308, 107272. [Google Scholar] [CrossRef]
  82. Sun, L.; Wu, Z.; Ma, Y.; Liu, Y.; Xiong, Z. Ammonia volatilization and atmospheric N deposition following straw and urea application from a rice-wheat rotation in southeastern China. Atmos. Environ. 2018, 181, 97–105. [Google Scholar] [CrossRef]
Figure 1. Differences in means of the reductions in agronomic parameters in response to ammonia volatilization (kg N ha−1). YSFP is yield scaled fertilizer productivity (kg N Mg−1 grains), NUE is nitrogen use efficiency (%), NAE is Nitrogen agronomic efficiency (kg grains kg−1 N), and PAN is productivity of applied nitrogen (kg grains kg−1 N). Numbers between brackets are the number of pairwise comparisons (datasets).
Agronomy 11 02593 g001
Figure 2. Constrained multiple regression models of the overall agronomic parameters in response to ammonia volatilization (AV, kg N ha−1). YSFP is yield scaled fertilizer productivity (kg N Mg−1 grains), NUE is nitrogen use efficiency (%), NAE is nitrogen agronomic efficiency (kg grains kg−1 N), and PAN is productivity of applied nitrogen (kg grains kg−1 N). The number of observations included in the regression analysis (n) for each parameter were 213 in wheat, 250 in maize, and 370 in rice at p < 0.05.
Agronomy 11 02593 g002
Figure 3. Path analysis of agronomic conditions and practices effects on the overall mean differences of agronomic parameters as a response to ammonia volatilization (kg N ha−1) and the correlations between these parameters. YSFP is yield scaled fertilizer productivity (kg N Mg−1 grains), NUE is nitrogen use efficiency (%), NAE is Nitrogen agronomic efficiency (kg grains kg−1 N), and PAN is productivity of applied nitrogen (kg grains kg−1 N). FT is fertilizer type; FR is fertilizer rate (kg ha−1); AD is the application depth (surface or subsurface); A is the amendments applied including mulch, biochar, and inhibitors; T is accumulative temperature during growth season (°C); P is the accumulative precipitation during growth season (mm); C is the clay content (g kg−1); pH is soil pH; SOM is soil organic matter content (g kg−1); and STN is soil N content (g kg−1). Red arrows refer to negative effects, blue arrows refer to positive effects, both sides arrows refer to correlation between parameters, and scattered arrows refer to insignificant effects. (A) is wheat, (B) is maize, and (C) is rice.
Agronomy 11 02593 g003aAgronomy 11 02593 g003b
Figure 4. Differences in means of the reductions in agronomic parameters in response to ammonia volatilization (kg N ha−1) under different N fertilizer rates. YSFP is yield scaled fertilizer productivity (kg N Mg−1 grains), NUE is nitrogen use efficiency (%), NAE is Nitrogen agronomic efficiency (kg grains kg−1 N), and PAN is productivity of applied nitrogen (kg grains kg−1 N). C is the fertilizer rate class (kg ha−1), (C1) 1–80, (C2) 81–139, (C3) 140–179, (C4) 180–239, (C5) 240–300, and (C6) ≥300. Numbers between brackets are the number of pairwise comparisons (datasets).
Agronomy 11 02593 g004
Figure 5. Differences in means of the reductions in agronomic parameters in response to ammonia volatilization (kg N ha−1) under different N fertilizer types. YSFP is yield scaled fertilizer productivity (kg N Mg−1 grains), NUE is nitrogen use efficiency (%), NAE is Nitrogen agronomic efficiency (kg grains kg−1 N), and PAN is productivity of applied nitrogen (kg grains kg−1 N). U is urea, OCF is other commercial N fertilizers, IU is slow-released fertilizers, and OA is organic sources. Numbers between brackets are number of pairwise comparisons (datasets).
Agronomy 11 02593 g005
Figure 6. Differences in means of the reductions in agronomic parameters in response to ammonia volatilization (kg N ha−1) under surface and subsurface applications. YSFP is yield scaled fertilizer productivity (kg N Mg−1 grains), NUE is nitrogen use efficiency (%), NAE is Nitrogen agronomic efficiency (kg grains kg−1 N), and PAN is productivity of applied nitrogen (kg grains kg−1 N). Numbers between brackets are number of pairwise comparisons (datasets).
Agronomy 11 02593 g006
Figure 7. Differences in means of the reductions in agronomic parameters in response to ammonia volatilization (kg N ha−1) under different amendments. YSFP is yield scaled fertilizer productivity (kg N Mg−1 grains), NUE is nitrogen use efficiency (%), NAE is Nitrogen agronomic efficiency (kg grains kg−1 N), and PAN is productivity of applied nitrogen (kg grains kg−1 N). Numbers between brackets are number of pairwise comparisons (datasets).
Agronomy 11 02593 g007
Table 1. The equations used in calculating the missing observed data of observed agronomic parameters (Equations (1)–(10)) and the scaled agronomic NH3 (Equations (11)–(14)).
Equ. No.Observed ParametersReference
(1). A V F   % = E T k g     h a 1 E C k g     h a 1 T N k g     h a 1 × 100 [40,41]
(2). R F G Y T   k g   g r a i n s   k g 1   N = G Y T k g     h a 1 G Y C k g     h a 1 T N k g     h a 1 × A V k g   h a 1
(3). Adj .   G Y T   kg   h a 1 = G Y T k g     h a 1 + R F G Y T   k g   g r a i n s   h a 1
Adj .   G Y T     Mg   h a 1 = G Y T M g     h a 1 + R F G Y T   M g   g r a i n s   h a 1
(4). Y S F P     k g   N   M g 1 = T N k g     h a 1 G Y T M g     h a 1 [40,41]
(5). N U E   % = N U T k g     h a 1 N U C k g     h a 1 T N k g     h a 1 × 100 [42]
(6). N A E   k g     k g 1 = G Y T k g     h a 1 G Y C k g     h a 1 T N k g     h a 1 [42]
(7). P A N   k g     k g 1 = G Y T k g     h a 1 T N k g     h a 1 [43]
(8). N   uptake   k g     h a 1 = g r a i n s   N   c o n t e n t   k g   M g 1 × G Y M g     h a 1 [40,41]
(9). R F N U T k g   N   u p t a k e   k g 1   N   a p p l i e d = N U T k g     h a 1 N U C k g     h a 1 T N k g     h a 1 × A V ( k g   h a 1 )
(10). Adj .   N U T   k g   N   h a 1 = N U T k g     h a 1 + R F N U T k g   N   u p t a k e   k g 1   N   a p p l i e d
(11). Y S F P A V   k g   N   M g 1 = T N k g     h a 1 + T N × A E 100 G Y M g     h a 1 + Adj .   G Y T     Mg   h a 1
(12). N U E A V   % = N U T k g     h a 1 + Adj .   N U T   k g   N   h a 1 N U C k g     h a 1 T N k g     h a 1 T N k g     h a 1 × A E 100 ) × 100
(13). N A E A V   k g     k g 1 = G Y T k g     h a 1 + Adj .   G Y T   kg   h a 1 G Y C k g     h a 1 T N k g     h a 1 T N × A E 100
(14). P A N A V   k g     k g 1 = G Y T k g     h a 1 + Adj .   G Y T   kg   h a 1 T N k g     h a 1 T N × A E 100
A V F is ammonia emission factor; E T and E C are emitted ammonia from treatment and control, respectively; and T N is the applied N rate. G Y , G Y T , and G Y C are grain yield observed, treatment, and control, respectively. A V is ammonia volatilization, N U T and N U C are N uptake from treatment and control, R F G Y T is response factor of grain yield, and R F N U T is response factor of N uptake. Adj .   G Y T and Adj .   N U T are the adjusted grain yield and N uptake. Y S F P is yield scaled fertilizer productivity (kg N Mg−1 grains), N U E   is nitrogen use efficiency (%), N A E is nitrogen agronomic efficiency (kg grains kg−1 N), and P A N is productivity of applied nitrogen (kg grains kg−1 N). Y S F P A V , N U E A V , N A E A V , and P A N A V are the AV-scaled agronomic parameters. All measurement units for each variable are presented between brackets. All abbreviations are listed in Table S2.
Table 2. The coefficient of determination (R2) resulted from regression analysis when studying the interaction effects between study factors included in the same pooled effect size in the meta-analysis.
Factors
Parameters
Fertilizer Rate (a)Application DepthFertilizer Rate (b)Amendments
Wheat
YSFP0.076 **0.033 *0.0200.070
NUE0.0030.093 **0.0220.044
NAE0.039 *0.033 *0.144 **0.064
PAN0.096 **0.042 *0.258 **0.044
Maize
YSFP0.032 *0.000.0130.282 **
NUE0.036 *0.0090.0170.186 *
NAE0.070 **0.0060.1570.206 **
PAN0.212 **0.0110.0720.255 **
Rice
YSFP0.231 **0.000.125 **0.041
NUE0.056 **0.0120.0100.037
NAE0.0010.0050.0130.052 *
PAN0.144 **0.041 **0.134 **0.043
YSFP is yield scaled fertilizer productivity (kg N Mg−1 grains), NUE is nitrogen use efficiency (%), NAE is Nitrogen agronomic efficiency (kg grains kg−1 N), and PAN is productivity of applied nitrogen (kg grains kg−1 N). * is the significance at p < 0.01, and ** is the significance at p < 0.05. Number of observations included in the regression analysis (n) for each parameter was 85 in wheat, 152 in maize, and 195 in rice. Fertilizer rate (a) was included when calculating the pooled effect size of application depth effect, while fertilizer rate (b) was included when calculating the pooled effect size of amendments effect.
Publisher’s Note: MDPI stays neutral with regard to jurisdictional claims in published maps and institutional affiliations.

