
Investigating the Quality and Efficiency of Biosolid Produced in Qatar as a Fertilizer in Tomato Production


Abstract
:1. Introduction
2. Materials and Methodology
2.1. Biosolid Quality
2.1.1. Physical Analysis of Biosolids
2.1.2. pH and EC
2.1.3. Sodium Adsorption Ratio (SAR) and Exchangeable Sodium
2.1.4. Nitrate NO3
2.1.5. Chloride Content
2.1.6. Free Carbonate
2.1.7. Organic Matter % (OM)
2.1.8. Total Nitrogen, Available Phosphate, Total Phosphorus and Heavy Metals
2.2. Experimental Design
2.2.1. Biosolid Treatment
2.2.2. Cultivation of Tomatoes
2.2.3. Morphophysiological Analysis of Tomatoes
2.2.4. Chemical Analysis on Tomatoes
2.3. Statistical Analysis
3. Results and Discussion
3.1. Biosolid Quality
3.1.1. Physical Characteristics
3.1.2. Chemical Characteristics
3.1.3. Heavy Metal Content of Biosolids
3.1.4. Comparison of Pollutant Contents against International Standards
3.2. The Effect of Biosolids on Tomatoes
3.3. Chemical Analysis
3.4. Comprehensive Analysis
4. Conclusions
Author Contributions
Funding
Institutional Review Board Statement
Informed Consent Statement
Data Availability Statement
Conflicts of Interest
Ethical Statement
References
- Boguniewicz-Zablocka, J.; Klosok-Bazan, I.; Capodaglio, A.G. Sustainable management of biological solids in small treatment plants: Overview of strategies and reuse options for a solar drying facility in Poland. Environ. Sci. Pollut. Res. 2020, 20, 24680–24693. [Google Scholar] [CrossRef]
- Alvarez-Campos, O.; Evanylo, G. Environmental Impact of Exceptional Quality Biosolids Use in Urban Agriculture. J. Environ. Qual. 2019, 48, 1872–1880. [Google Scholar] [CrossRef]
- Stürmer, B.; Pfundtner, E.; Kirchmeyr, F.; Uschnig, S. Legal requirements for digestate as fertilizer in Austria and the European Union compared to actual technical parameters. J. Environ. Manag. 2020, 253, 50–56. [Google Scholar] [CrossRef]
- Canziani, R.; Spinosa, L. Sludge from wastewater treatment plants. Ind. Munic. Sludge 2019, 54, 3–30. [Google Scholar]
- Li, J.; Luo, G.; Xu, J. Fate and Ecological Risk Assessment of Nutrients and Metals in Sewage Sludge from Ten Wastewater Treatment Plants in Wuxi City, China. Bull. Environ. Contam. Toxicol. 2019, 102, 259–267. [Google Scholar] [CrossRef]
- Wang, P.-H.; Chang, Y.-R.; Lee, D.-J. Shape stable poly(vinyl alcohol) hydrogels with immobilized activated sludge at repeated dry-rewet cycles. Bioresour. Technol. 2019, 121662, 78–89. [Google Scholar] [CrossRef]
- Hall, J. Public Work Authority, K.s.E.S.P.L.; Internal Study Submitted to the Ministry of Municipality & Environment: Doha, Qatar, 2017; Volume 34, pp. 12–45. [Google Scholar]
- Bevington, J.; Scudiero, E.; Teatini, P.; Vellidis, G.; Morari, F. Factorial kriging analysis leverages soil physical properties and exhaustive data to predict distinguished zones of hydraulic properties. Comput. Electron. Agric. 2019, 156, 426–438. [Google Scholar] [CrossRef]
- Rajkovic, A.; Smigic, N.; Djekic, I.; Popovic, D.; Tomic, N.; Krupezevic, N.; Uyttendaele, M.; Jacxsens, L. The performance of food safety management systems in the raspberries chain. Food Control 2017, 80, 151–161. [Google Scholar] [CrossRef]
- Epstein, A.A. The European Approach to Sustainable Food Security: What Role for the Common Agricultural Policy? University of Leeds: Leeds, UK, 2017. [Google Scholar]
- Imai, K.; Cheng, W.; Gaiha, R. Dynamic and long-term linkages among agricultural and non-agricultural growth, inequality and poverty in developing countries. Int. Rev. Appl. Econ. 2016, 31, 318–338. [Google Scholar] [CrossRef]
- Janmohammadi, M.; Seifi, A.; Pasandi, M.; Sabaghnia, N. The impact of organic manure and nano-inorganic fertilizers on the growth, yield and oil content of sunflowers under well-watered conditions. Biologija 2017, 62, 1–6. [Google Scholar] [CrossRef] [Green Version]
- Angin, I.; Aslantas, R.; Gunes, A.; Kose, M.; Ozkan, G. Effects of Sewage Sludge Amendment on Some Soil Properties, Growth, Yield and Nutrient Content of Raspberry (Rubus idaeus L.). Erwerbs-Obstbau 2016, 59, 93–99. [Google Scholar] [CrossRef]
- Tamburino, A. Water technology in ancient mesopotamia. In Ancient Water Technologies; Springer: New York, NY, USA, 2010; pp. 29–51. [Google Scholar]
- El Bastawesy, M.; El Ella, A. Quantitative estimates of flash flood discharge into waste water disposal sites in Wadi Al Saaf, the Eastern Desert of Egypt. J. Afr. Earth Sci. 2017, 136, 312–318. [Google Scholar] [CrossRef]
- Kumar, V.; Chopra, A.; Kumar, A. A Review on Sewage Sludge (Biosolids) a Resource for Sustainable Agriculture. Arch. Agric. Environ. Sci. 2017, 2, 340–347. [Google Scholar] [CrossRef]
- Pellegrini, M.; Saccani, C.; Bianchini, A.; Bonfiglioli, L. Sewage sludge management in Europe: A critical analysis of data quality. Int. J. Environ. Waste Manag. 2016, 18, 226–238. [Google Scholar] [CrossRef]
- Zhang, Q.; Hu, J.; Lee, D.; Chang, Y.; Lee, Y. Sludge treatment: Current research trends. Bioresour. Technol. 2017, 243, 1159–1172. [Google Scholar] [CrossRef]
- Kelessidis, A.; Stasinakis, A. Comparative study of the methods used for treatment and final disposal of sewage sludge in European countries. Waste Manag. 2012, 32, 1186–1195. [Google Scholar] [CrossRef] [PubMed]
- Liu, H.; Yao, T. Usage Urban Sludge to Closed Mine Reclamation and Slope Treatment. Adv. Mater. Res. 2014, 1049, 300–303. [Google Scholar] [CrossRef]
- Plan, A. Communication from the Commission to the European Parliament, the Council, the European Economic and Social Committee and the Committee of the Regions. Eur. Commun. 2011, 76, 54–65. [Google Scholar]
- Panter, K.; Hawkins, J. The manufacture of a quality assured growing medium by amending soil with sewage sludge. In Alternative Uses for Sewage Sludge; Elsevier: London, UK, 1991; pp. 311–322. [Google Scholar]
- Smith, K.; Fowler, G.; Pullket, S.; Graham, N. Sewage sludge-based adsorbents: A review of their production, properties and use in water treatment applications. Water Res. 2009, 43, 2569–2594. [Google Scholar] [CrossRef]
- Lowman, A.; McDonald, M.; Wing, S.; Muhammad, N. Land Application of Treated Sewage Sludge: Community Health and Environmental Justice. Environ. Health Perspect. 2013, 121, 537–542. [Google Scholar] [CrossRef]
- Qatar Construction Specifications QCS, 2018, Section 28—Part 1; Adminstration of Quality Control Unit: Doha, Qatar, 2018. Available online: https://www.mme.gov.qa/cui/view.dox?id=1441&contentID=3815&siteID=2 (accessed on 4 May 2015).
- Baldi, E.; Cavani, L.; Mazzon, M.; Marzadori, C.; Quartieri, M.; Toselli, M. Fourteen years of compost application in a commercial nectarine orchard: Effect on microelements and potential harmful elements in soil and plants. Sci. Total Environ. 2021, 752, 141–159. [Google Scholar] [CrossRef] [PubMed]
- Guimarães, R.; Lamandé, M.; Munkholm, L.; Ball, B.; Keller, T. Opportunities and future directions for visual soil evaluation methods in soil structure research. Soil Tillage Res. 2017, 173, 104–113. [Google Scholar] [CrossRef]
- Ryan, J.; Garabet, S.; Harmsen, K.; Rashid, A. Soil test standardization in the West Asia-North Africa region. Commun. Soil Sci. Plant. Anal. 1996, 25, 1641–1653. [Google Scholar] [CrossRef]
- Association of Official Analytical Chemists. Official Methods of Analysis: Changes in Official Methods of Analysis Made at the Annual Meeting. Suppl. Assoc. Off. Anal. Chem. 1990, 15. [Google Scholar]
- Qatar Construction Specifications (QCS), Section 28. 2014. Available online: http://www.mme.gov.qa/cui/view.dox?id=1441&contentID=3815&siteID=2 (accessed on 4 May 2015).
- ASTM. Standard Test. Method for Particle-Size Analysis of Soils; ASTM International: West Conshohocken, PA, USA, 2007. [Google Scholar]
- ASTM. Standard Test. Method for Sieve Analysis of Fine and Coarse Aggregates; ASTM International: West Conshohocken, PA, USA, 2006. [Google Scholar]
- Richards, L.; Allison, L. Improvement and management of soils in arid and semiarid regions in relation to salinity and alkali. In Diagnosis and Improvement of Saline and Alkali Soils; Department of Agriculture, Government Printing Office: Washington, DC, USA, 1954; pp. 34–40. [Google Scholar]
- Rayment, G.; Lyons, D. Soil Chemical Methods-Australasia; CSIRO Publishing: Collingwood, Australia, 2014; pp. 23–45. [Google Scholar]
- Nelson, P. Index to EPA Test. Methods: The United States Environmental Protection Agency, Region. I; United States Department of Agriculture: Washington, DC, USA, 2003; pp. 1–85. [Google Scholar]
- Richards, L.; Allison, L. Significance of indicator plants for saline soils. In Diagnosis and Improvement of Saline and Alkali Soils; Government Printing Office: Washington, DC, USA, 1954; pp. 56–77. [Google Scholar]
- Laboratory Manual on Soil and Plant Analysis. Climate Resilient Soil Management Strategies for Sustainable Agriculture. Available online: http://www.jnkvv.org/PDF/SoilScience/Lab%20Manual/LabManual2015.pdf (accessed on 3 November 2015).
- Richards, L. Diagnosis and Improvement of Saline and Alkali Soils. Soil Sci. 1954, 78, 154. [Google Scholar] [CrossRef]
- United States Environmental Protection Agency. Method 6010C (SW-846): Inductively Coupled Plasma-Atomic Emission Spectrometry, Revision 3; EPA: Washington, DC, USA, 2007; p. 45. Available online: https://19january2017snapshot.epa.gov/homeland-security-research/epa-method-6010c-sw-846-inductively-coupled-plasma-atomic-emission_.html (accessed on 12 September 2016).
- Association of Official Analytical Chemists. Metals and other elements in plants and pet foods: Inductively coupled plasma spectroscopic method. In AOAC Official Method 985.01; AOAC International: Arlington, VA, USA, 2003. [Google Scholar]
- Alayu, E.; Leta, S. Brewery sludge quality, agronomic importance and its short-term residual effect on soil properties. Int. J. Environ. Sci. Technol. 2020, 17, 2337–2348. [Google Scholar] [CrossRef] [Green Version]
- Schjoerring, J.K.; Cakmak, I.; White, P.J. Plant. Nutrition and Soil Fertility: Synergies for Acquiring Global Green Growth and Sustainable Development; Springer: London, UK, 2019; Volume 3455, pp. 34–101. [Google Scholar]
- Jiang, M.; Zhou, Y.; Cao, X.; Ji, X.; Zhang, W.; Huang, W.; Zhang, J.; Zheng, Z. The concentration thresholds establishment of nitrogen and phosphorus considering the effects of extracellular substrate-to-biomass ratio on cyanobacterial growth kinetics. Sci. Total Environ. 2019, 662, 307–312. [Google Scholar] [CrossRef] [PubMed]
- Du, R.; Cao, S.; Zhang, H.; Peng, Y. Formation of partial-denitrification (PD) granular sludge from low-strength nitrate wastewater: The influence of loading rates. J. Hazard. Mater. 2020, 384, 121–273. [Google Scholar] [CrossRef] [PubMed]
- Zhang, F.; Peng, Y.; Wang, Z.; Jiang, H. High-efficient nitrogen removal from mature landfill leachate and waste activated sludge (WAS) reduction via partial nitrification and integrated fermentation-denitritation process (PNIFD). Water Res. 2019, 160, 394–404. [Google Scholar] [CrossRef]
- Dan, E.; Inam, E.; Fatunla, O.; Essien, J.; Odon, A.; Kang, S.; Semple, K. Effect of pyrolysis temperature on properties of sludge from wastewater treatment plant in nigeria. J. Chem. Soc. Niger. 2019, 44, 45–78. [Google Scholar]
- Yu, L.-Y.; Huang, H.-B.; Wang, X.-H.; Li, S.; Feng, N.-X.; Zhao, H.-M.; Huang, X.-P.; Li, Y.-W.; Li, H.; Cai, Q.-Y. Novel phosphate-solubilising bacteria isolated from sewage sludge and the mechanism of phosphate solubilisation. Sci. Total Environ. 2019, 658, 474–484. [Google Scholar] [CrossRef]
- Masciandaro, G.; Peruzzi, E.; Nielsen, S. Sewage sludge and waterworks sludge stabilization in sludge treatment reed bed systems. Water Sci. Technol. 2017, 171, 45–78. [Google Scholar] [CrossRef] [Green Version]
- Zornoza, R.; Acosta, J.; Bastida, F.; Domínguez, S.; Toledo, D.; Faz, A. Identification of sensitive indicators to assess the interrelationship between soil quality, management practices and human health. Soil 2015, 1, 173–185. [Google Scholar] [CrossRef] [Green Version]
- Asche, K.; Fontenot, S.; Lee, S. City of Morris-Chloride Discharge Assessment; Center for Small Towns: Morris, MN, USA, 2013; pp. 45–76. [Google Scholar]
- Al-Thani, R.F.; Yasseen, B.T. Halo-thermophilic bacteria and heterocyst cyanobacteria found adjacent to halophytes at Sabkhas, Qatar: Preliminary study and possible roles. Afr. J. Microbiol. Res. 2017, 11, 1346–1354. [Google Scholar]
- Rao, P.S.; Thomas, T.; Hasan, A.; David, A. Determination of Heavy Metals Contamination in Soil and Vegetable Samples from Jagdalpur, Chhattisgarh State, India. Int. J. Curr. Microbiol. App. Sci. 2017, 6, 2909–2914. [Google Scholar] [CrossRef] [Green Version]
- Jupp, B.P.; Fowler, S.W.; Dobretsov, S.; van der Wiele, H.; Al-Ghafri, A. Assessment of heavy metal and petroleum hydrocarbon contamination in the Sultanate of Oman with emphasis on harbours, marinas, terminals and ports. Mar. Pollut. Bull. 2017, 46, 34–78. [Google Scholar] [CrossRef]
- Alvarez-Campos, O.M. Assessment of Exceptional Quality Biosolids for Urban. Agriculture; Virginia Tech: Blacksburg, VA, USA, 2019; pp. 45–89. [Google Scholar]
- Udayanga, W.C.; Veksha, A.; Giannis, A.; Lisak, G.; Chang, V.W.-C.; Lim, T.-T. Fate and distribution of heavy metals during thermal processing of sewage sludge. Fuel 2018, 226, 721–744. [Google Scholar] [CrossRef]
- Kulkarni, S.; Goswami, A. Effect of Excess Fertilizers and Nutrients: A Review on Impact on Plants and Human Population. SSRN Electron. J. 2019, 56, 6–10. [Google Scholar] [CrossRef]
- US Environmental Protection Agency. Guide to the EPA Part 503 Biosolid Rule; US Environmental Protection Agency: Washington, DC, USA, 1994; pp. 1–55. [Google Scholar]
- Public Work Authority. Water Statistics in the State of Qatar. 2017. Available online: https://www.psa.gov.qa/en/statistics/Statistical%20Releases/Environmental/Water/2017/Water-Statistics-2017-EN.pdf (accessed on 1 December 2018).
- Ministry of Water and Electricity. Guidelines on Integrating Water Reuse into Water Planning and Management in the Context of the WFD -Document Endorsed by EU Water Directors at Their Meeting in Amsterdam on 10 June 2016. Available online: https://ec.europa.eu/environment/water/blueprint/pdf/EU_level_instruments_on_water-2nd-IA_support-study_AMEC.pdf (accessed on 10 June 2016).
- Dubai Municipality Technical Guidelines No.13, Environmental Regulations for the Reuse of Treated Wastewater for Irrigation and Thermal Treated Sluge for Agricultural Purposes. June 2011. Available online: https://www.scribd.com/document/216584013/Environmental-Regulations-for-the-Reuse-of-Treated-Wastewater (accessed on 1 June 2011).
- Van der Krol, A.R.; Immink, R. Secrets of the world’s most popular bedding plant unlocked. Nat. Plants 2016, 2, 1682. [Google Scholar] [CrossRef] [PubMed]
- Ali, M.; Ahmed, T.; Al-Ghouti, M.A. Potential Benefits and Risk Assessments of Using Sewage Sludge on Soil and Plants: A Review. Int. J. Environ. Waste Manag. 2019, 23, 352–369. [Google Scholar] [CrossRef]
- Barry, C.S.; Aldridge, G.M.; Herzog, G.; Ma, Q.; McQuinn, R.P.; Hirschberg, J.; Giovannoni, J.J. Altered chloroplast development and delayed fruit ripening caused by mutations in a zinc metalloprotease at the lutescent2 locus of tomato. Plant Physiol. 2012, 159, 1086–1098. [Google Scholar] [CrossRef] [Green Version]
- Sturião, W.P.; Martinez, H.E.P.; Milagres, C.D.C.; Lopes, I.P.D.C.; Clemente, J.M.; Ventrella, M.C.; Cecon, P.R. Boron lack affects the anatomy of leaf, stem and root of cherry tomato. Braz. J. Bot. 2020, 8, 1–9. [Google Scholar] [CrossRef]
- Geng, Y.; Wang, J.; Sun, Z.; Ji, C.; Huang, M.; Zhang, Y.; Xu, P.; Li, S.; Pawlett, M.; Zou, J. Soil N-oxide emissions decrease from intensive greenhouse vegetable fields by substituting synthetic N fertilizer with organic and bio-organic fertilizers. Geoderma 2020, 383, 114–130. [Google Scholar] [CrossRef]
- Arriaza, B.; Blumenstiel, D.; Amarasiriwardena, D.; Standen, V.G.; Vizcarra, A. Five thousand years of bellyaches: Exploring boron concentration in ancient populations of the Atacama Desert. Am. J. Phys. Anthropol. 2020, 12, 32–37. [Google Scholar] [CrossRef]
- Badiaa, O.; Yssaad, H.A.R.; Topcuoglu, B. Effect of Heavy Metals (Copper and Zinc) on Proline, Polyphenols and Flavonoids Content of Tomato (Lycopersicon esculentum Mill.); Springer: New York, NY, USA, 2020; pp. 32–40. [Google Scholar]
- Samarajeewa, A.; Schwertfeger, D.; Princz, J.; Subasinghe, R.; Scroggins, R.; Beaudette, L. Ecotoxicological effects of copper oxide nanoparticles (nCuO) on the soil microbial community in a biosolids-amended soil. Sci. Total Environ. 2020, 143, 37. [Google Scholar] [CrossRef] [PubMed]
- Guan, X.; Wang, X.; Liu, B.; Wu, C.; Liu, C.; Liu, D.; Zou, C.; Chen, X. Magnesium Supply Regulate Leaf Nutrition and Plant. Growth of Soilless Cultured Cherry Tomato-Interaction with Potassium; Research Square: Oxford, UK, 2020; pp. 23–56. [Google Scholar]
- Alejandro, S.; Höller, S.; Meier, B.; Peiter, E. Manganese in plants: From acquisition to subcellular allocation. Front. Plant Sci. 2020, 11, 8–17. [Google Scholar] [CrossRef] [Green Version]
- Mondal, M.; Hoque, M. Effect of Phosphorus and Mulching on Yield of Tomato. SAARC J. Agric. 2020, 18, 153–160. [Google Scholar] [CrossRef]
- El-Mokadem, E.; Mona, S. Effect of Bio and Chemical Fertilizers on Growth and Flowering of Petunia hybrid Plants. Am. J. Plant Physiol. 2014, 9, 68–77. [Google Scholar] [CrossRef] [Green Version]
- Kissel, D.E.; Sander, D.; Ellis, R., Jr. Fertilizer-plant interactions in alkaline soils. Fertil. Technol. Use 1985, 5, 153–196. [Google Scholar]
- Shabani, E.; Tabatabaei, S.J.; Bolandnazar, S.; Ghasemi, K. Vegetative growth and nutrient uptake of salinity stressed cherry tomato in different calcium and potassium level. Int. Res. J. Appl. Basic Sci. 2012, 3, 1845–1853. [Google Scholar]
- Almeselmani, M.; Pant, R.; Singh, B. Potassium level and physiological response and fruit quality in hydroponically grown tomato. Int. J. Veg. Sci. 2009, 16, 85–99. [Google Scholar] [CrossRef]
- Queddeng, M.Q. Toxicity and Nutrient Testing of Local Roselle (Hibiscus sabdariffa L.) Fruit. UNP Res. J. 2020, 25, 97–107. [Google Scholar]
- Nisa, K.U.; Khan, N. Detection of Heavy metals in Fruits and Vegetables available in the Market of Quetta city. Al-Nahrain J. Sci. 2020, 23, 47–56. [Google Scholar] [CrossRef]
- Pivovarov, V.; Pronina, E. Main Directions and Results of Vegetable Breeding and Seed Production of Vegetable Crops of Legumes in Vniissok. Veg. Crop. Russ. 2013, 1, 4–11. [Google Scholar] [CrossRef]
- Duan, W.; Xu, C.; Liu, Q.; Xu, J.; Weng, Z.; Zhang, X.; Basnet, T.B.; Dahal, M.; Gu, A. Levels of a mixture of heavy metals in blood and urine and all-cause, cardiovascular disease and cancer mortality: A population-based cohort study. Environ. Pollut. 2020, 76, 114–130. [Google Scholar] [CrossRef] [PubMed]
- Toyofuku, H.; Kasuga, F. Principles and Guidelines for Incorporating Microbiological Risk Assessment in the Development of Food Safety Standards, Guidelines and Related Texts-Report of Joint FAO/WHO Consultation. J. Vet. Epidemiol. 2003, 7, 33–44. [Google Scholar] [CrossRef]
- NSW Environment Protection Authority. Environmental Guidelines: Use and Disposal of Biosolids Products; NSW Environment Protection Authority: Sydney, Australia, 1997. [Google Scholar]


| Sieve Size (mm) | Percentage Passing by Weight | ||
|---|---|---|---|
| Sieve Analysis Mean for Sample 1 | Sieve Analysis Mean for Sample 2 | Sieve Analysis Mean for Sample 3 | |
| 75.000 | 100.0 | 100.0 | 100.0 |
| 63.000 | 100.0 | 100.0 | 100.0 |
| 50.000 | 100.0 | 100.0 | 100.0 |
| 37.500 | 100.0 | 100.0 | 100.0 |
| 25.000 | 100.0 | 100.0 | 100.0 |
| 19.000 | 100.0 | 100.0 | 100.0 |
| 12.500 | 100.0 | 100.0 | 100.0 |
| 9.500 | 100.0 | 100.0 | 100.0 |
| 4.750 | 100.0 | 100.0 | 100.0 |
| 2.000 | 9.0 | 6.0 | 5.2 |
| 0.425 | 2.1 | 1.4 | 2.2 |
| 0.075 | 1.9 | 1.0 | 2.1 |
| Hydrometer Analysis | Sample 1 | Sample 2 | Sample 3 |
| 0.020 | 1.2 | 0.8 | 0.8 |
| 0.005 | 1.5 | 0.4 | 0.4 |
| 0.001 | 0.0 | 0.2 | 0.2 |
| SOV | DF | Mean Squares | ||||||||||||
|---|---|---|---|---|---|---|---|---|---|---|---|---|---|---|
| pH Value | Electrical Conductivity | Sodium Adsorption Ratio (SAR) | Exchangeable Sodium | Nitrate | Chloride Content | Free Carbonates | Organic Matter | Total N | Total Sulphate Content | Available Phosphate as PO4-P | Available Z | Total P | ||
| Treatment | 2 | 0.040 * | 3.316 ** | 0.680 | 60.060 * | 724 ** | 0.140 ** | 5.251 ** | 51.783 ** | 161 | 0.0004 | 317 ** | 748.29 ** | 562 * |
| Error | 9 | 0.003 | 0.009 | 1.173 | 4.857 | 2450 | 0.001 | 0.038 | 0.432 | 522 | 0.001 | 168 | 11.62 | 564 |
| Total | 11 | |||||||||||||
| Test | Samples of Biosolids Took in February 2018 | Samples of Biosolids Took in May 2018 | Samples of Biosolids Took in August 2018 | |||
|---|---|---|---|---|---|---|
| Mean | Standard Deviation ± | Mean | Standard Deviation ± | Mean | Standard Deviation ± | |
| pH Value | 6.32 B | 0.05 | 6.32 B | 0.10 | 6.5 A | 0.05 |
| Electrical Conductivity mS/cm | 4.1 A | 0.06 | 2.40 C | 0.16 | 3.82 B | 0.02 |
| Sodium Adsorption Ratio (SAR) | 5.41 A | 1.18 | 6.16 A | 1.68 | 6.08 A | 0.67 |
| Exchangeable Sodium | 10.15 A | 1.04 | 5.82 A,B | 2.20 | 2.43 B | 2.94 |
| Nitrate mg/Kg | 278 B | 48.94 | 398.25 A | 69.01 | 129.55 C | 13.82 |
| Chloride Content % | 0.46 A | 0.06 | 0.15 B | 0.03 | 0.13 B | 0.03 |
| Free Carbonates % | 1.09 B | 0.24 | 0.69 C | 0.16 | 2.84 A | 0.19 |
| Organic Matter % | 59.35 C | 0.96 | 66.50 A | 0.40 | 63.59 B | 0.46 |
| Total Nitrogen mg/Kg | 52 A | 1.85 | 54,21 A | 0.37 | 55,61 A | 3.48 |
| Total Sulfates Content % | 0.29 A | 0.04 | 0.29 A | 0.04 | 0.27 A | 0.03 |
| Available Zinc mg/Kg | 33.45 C | 1.25 | 50.60 B | 1.60 | 60.48 A | 5.54 |
| Total Phosphorus mg/Kg | 21 A,B | 0.34 | 29,94 A | 2.39 | 6.44 B | 15.53 |
| SOV | Mean Squares | ||||||||||||||
|---|---|---|---|---|---|---|---|---|---|---|---|---|---|---|---|
| DF | AL | K | Mg | Na | As | Cd | Co | Cr | Ni | Pb | Sn | Zn | Cu | Hg | |
| Treatment | 2 | 5.4 * | 0.87 * | 17.78 | 1.21 * | 0.00001 | ND | ND | 0.000004 | 0.000007 | 0.00007 | 0.000026 * | 0.005 | 7888.7 ** | ND |
| Error | 9 | 0.63 | 0.18 | 4.53 | 0.15 | 0.000004 | ND | ND | 0.00003 | 0.00001 | 0.00004 | 0.000006 | 0.011 | 205.5 | ND |
| Total | 11 | ||||||||||||||
| Heavy Metals (mg/kg) | Samples of Biosolids in February 2018 | Samples of Biosolids in May 2018 | Samples of Biosolids in August 2018 | |||
|---|---|---|---|---|---|---|
| Mean | Standard Deviation ± | Mean | Standard Deviation ± | Mean | Standard Deviation ± | |
| Al | 5.1 B | 0.37 | 6.77 A | 1.33 | 4.54 B | 0.02 |
| K | 3.3 A | 0.23 | 3.45 A | 0.69 | 2.61 A | 0.12 |
| Mg | 11.1 A | 0.96 | 14.6 A | 3.00 | 10.76 A | 1.91 |
| Na | 3.6 A | 0.39 | 2.5 B | 0.43 | 3.015 A,B | 0.36 |
| As | 0.002 A | 0.00 | 0.005 A | 0.00 | 0.004 A | 0.00 |
| Cd | N.D | - | ND | - | - | - |
| Hg | ND | - | ND | - | - | - |
| Co | ND | - | ND | - | - | - |
| Cr | 0.04 A | 0.00 | 0.04 A | 0.01 | 0.04 A | 0.00 |
| Ni | 0.02 A | 0.01 | 0.03 A | 0.00 | 0.02 A | 0.01 |
| Pb | 0.017 A | 0.00 | 0.02 A | 0.00 | 0.02 A | 0.00 |
| Sn | 0.005 A,B | 0.03 | 0.008 A | 0.16 | 0.003 B | 0.09 |
| Cu | 114.3 | 0.37 | 30.57 | 1.33 | 46.87 | 0.02 |
| Zn | 0.92 A | 0.23 | 0.86 A | 0.69 | 0.86 A | 0.12 |
| Sludge Quality Standards | |||||||||||||
|---|---|---|---|---|---|---|---|---|---|---|---|---|---|
| Agriculture | Landscaping | ||||||||||||
| Parameters | Unit | Weighted Average Sludge Content (2009) | USEPA (Part 503 Rule) | Qatar Biosolid | *GCC | Abu Dhabi | Bahrain | Australia and New Zealand | EC(86/278/EEC) | *QCS 2014 | |||
| Exceptional Quality Limit | Mean of All Samples | Limit | Average as % of Limit Value | Unrestricted Use | Restricted Use | (Proposed) | *C1 Soil Contaminant if Ceiling Exceeded Ceiling Should Not Be Used | *C2 If Exceeded Should Not Be Used | Upper Limit | Maximum Concentration | |||
| Zn | mg/kg | 801.0 | 2800 | 0.00 | 500 | 160% | 300 | 2500 | 2800 | 200–250 | 2500 | 4000 | 200 |
| Cu | mg/kg | 591.0 | 1500 | n.d. | 400 | 148% | 150 | 1000 | 1500 | 100–200 | 2500 | 1750 | 100 |
| Ni | mg/kg | 26.0 | 420 | 0.02 | 200 | 13% | 60 | 300 | 420 | 60 | 270 | 400 | 60 |
| Cd | mg/kg | 0.9 | 39 | 0.2 n.d. | 20 | 4% | 1 | 20 | 39 | 11 | 20 | 40 | 1 |
| Pb | mg/kg | 24.3 | 300 | 0.016 | 300 | 8% | 300 | 750 | 300 | 150–300 | 420 | 1200 | 150 |
| Hg | mg/kg | 1.5 | 17 | n.d. | 10 | 14% | 1 | 10 | 17 | 1 | 15 | 25 | 1 |
| Cr | mg/kg | 32.0 | / | 0.04 | 300 | 11% | 400 | 1000 | 1200 | 100–400 | 500–3000 | / | 100 |
| As | mg/kg | 2.7 | 18 | 0.003 | 10 | 26% | 20 | 75 | 41 | 20 | 60 | / | 20 |
| Se | mg/kg | 1.6 | 36 | n.d. | 50 | 3% | 3 | 50 | 36 | 3 | 50 | / | 5 |
| Mo | mg/kg | 9.2 | 41 | n.d. | 20 | 46% | 20 | 75 | / | / | / | / | / |
| Co | mg/kg | 9.2 | 0.3 n.d. | ||||||||||
| Mg | % | 1.7 | 36.54 | ||||||||||
| pH | 6.1 | 6.38 | |||||||||||
| EC | dS/m | 3.5 | 3.43 | 10 | 35% | ||||||||
| OM | % | 66.3 | 63.14 | >35 | |||||||||
| N | % | 5.5 | 53.94 | ||||||||||
| N03-N | mg/kg | <0.1 | 6.13 | ||||||||||
| P | % | 1.8 | 19.12 | ||||||||||
| K | % | 0.4 | 3.14 | ||||||||||
| Treatments | Average of Plant Height (cm) | St. D ± | Average of Fruit Densities (pcs) | St. D ± | Average of Stem Diameter cm | St. D ± | Average of Leaves Length cm | St. D ± | Average of Leaves width cm | St. D ± | Average of Fruit Size Perimeter/cm | St. D ± |
|---|---|---|---|---|---|---|---|---|---|---|---|---|
| Control 5 kg cow manure and 20 L peat moss | 114 | ±6 | 6 | ±2 | 7.22 | ±0.88 | 12.20 | ±0.33 | 5.66 | ±0.73 | 9.43 | ±1.15 |
| 7 kg Biosolids + Soil | 116 | ±20 | 8 | ±2 | 6.72 | ±0.62 | 11.53 | ±0.66 | 5.16 | ±0.24 | 9.18 | ±0.22 |
| 5 kg Biosolids + Soil | 106 | ±21 | 8 | ±1 | 7.07 | ±0.39 | 12.56 | ±0.66 | 5.70 | ±0.51 | 8.95 | ±0.86 |
| Treatment | Tot. N | St. D. | B | St. D. | Ca | St. D. | Cu | St. D. | Mg | St. D. | Mn | St. D. | P | St. D. | K | St. D. | Zn | St. D. |
|---|---|---|---|---|---|---|---|---|---|---|---|---|---|---|---|---|---|---|
| Control 5 kg/m2 Manure and 20 L/m2 Peat Moss | 11.65 | ±5.05 | 22.12 | ±8.32 | 5.26 | ±1.56 | 159.21 | ±92.5 | 4.38 | ±2.26 | 53.18 | ±30.1 | 16.56 | ±6.4 | 129.54 | ±71.4 | 108.3 | ±39.7 |
| 5 kg/m2 Biosolid | 3.27 | ±0.75 | 43.7 | ±10.78 | 48.84 | ±69.30 | 274.13 | ±143.4 | 8.93 | ±4 | 53.77 | ±21 | 23.49 | ±13.9 | 147 | ±90 | 137.8 | ±35.1 |
| 7 kg/m2 Biosolid | 3.72 | ±2.38 | 36.42 | ±18.09 | 23.92 | ±23.58 | 260.27 | ±98.8 | 8.84 | ±2.3 | 43.32 | ±21.8 | 27.15 | ±4.2 | 214.53 | ±35.3 | 112.7 | ±47.8 |
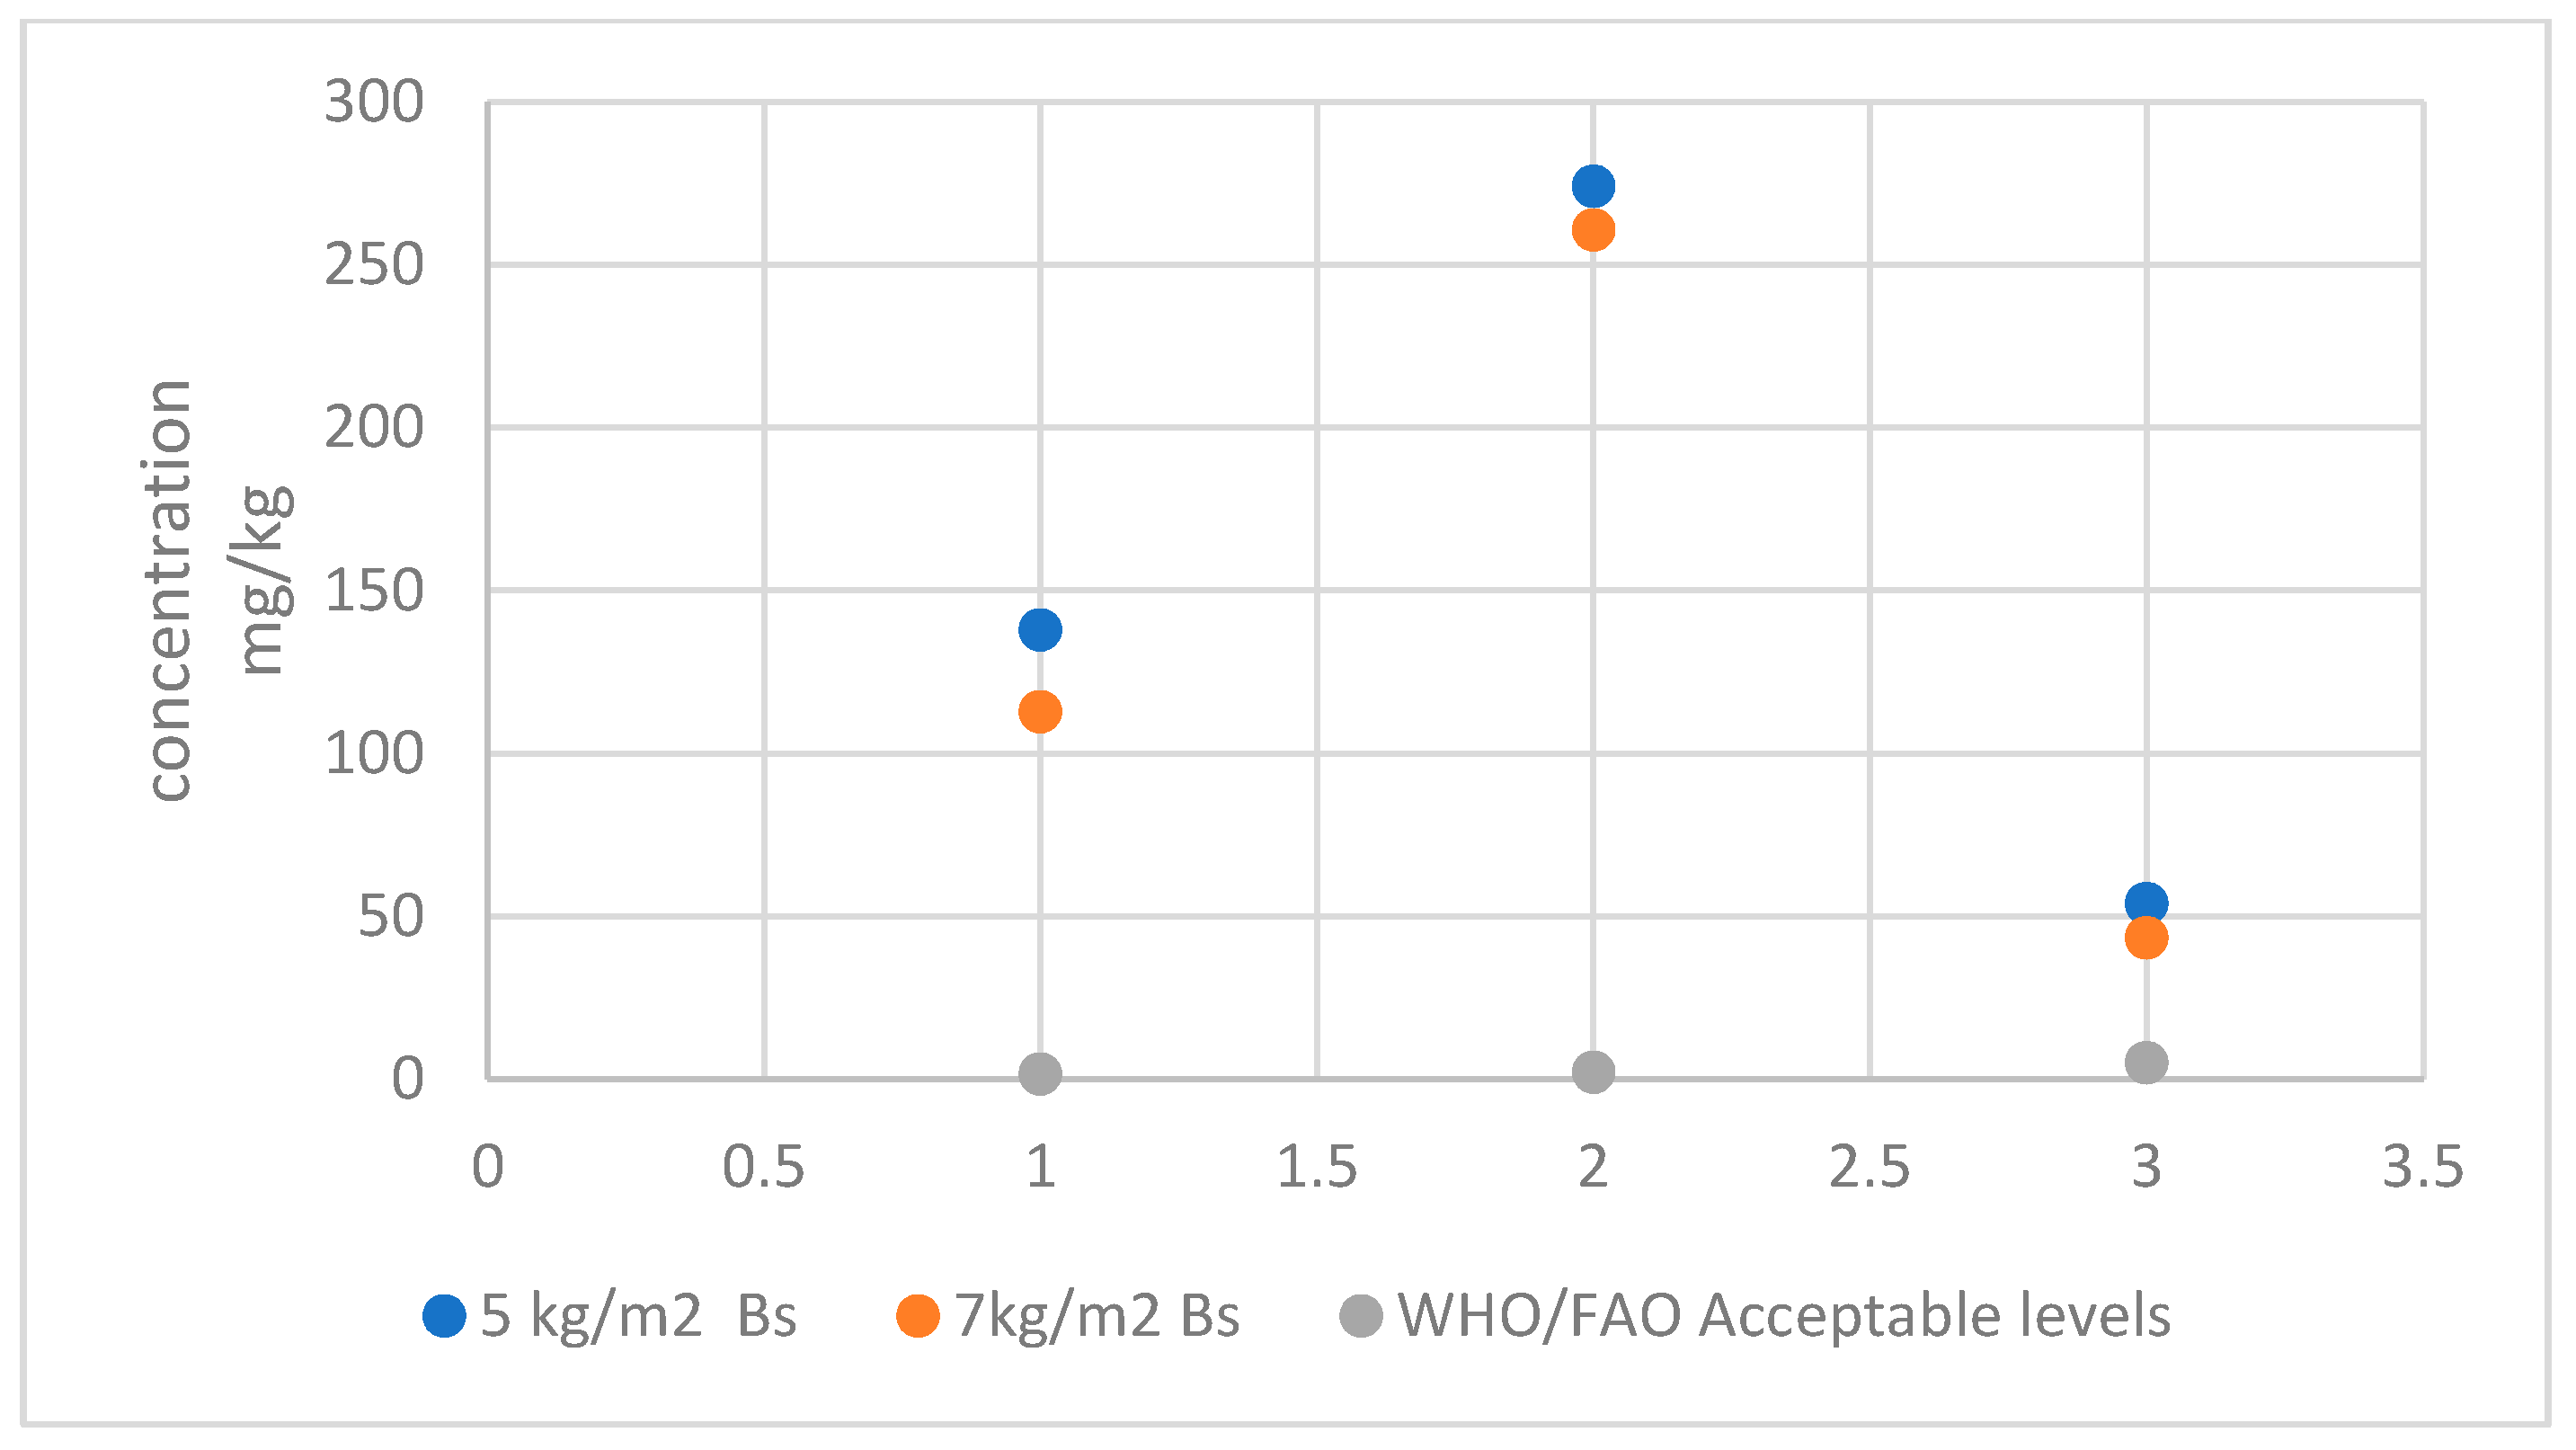
| Pollutants | Levels of Tested Parameters of Biosolids | WHO/FAO Maximum Acceptable Levels in Tomatoes mg/kg | |
|---|---|---|---|
| 5 kg Biosolids | 7 kg Biosolids | ||
| Zinc (Zn) mg/kg | 137.82 | 112.71 | 1.5 |
| Cupper (Cu) mg/kg | 274.13 | 260.72 | 2.00 |
| Manganese (Mn) mg/kg | 53.77 | 43.32 | 5.00 |
Publisher’s Note: MDPI stays neutral with regard to jurisdictional claims in published maps and institutional affiliations. |
© 2021 by the authors. Licensee MDPI, Basel, Switzerland. This article is an open access article distributed under the terms and conditions of the Creative Commons Attribution (CC BY) license (https://creativecommons.org/licenses/by/4.0/).
Share and Cite
Ali, M.; Ahmed, T.; Abu-Dieyeh, M.; Al-Ghouti, M.A. Investigating the Quality and Efficiency of Biosolid Produced in Qatar as a Fertilizer in Tomato Production. Agronomy 2021, 11, 2552. https://doi.org/10.3390/agronomy11122552
Ali M, Ahmed T, Abu-Dieyeh M, Al-Ghouti MA. Investigating the Quality and Efficiency of Biosolid Produced in Qatar as a Fertilizer in Tomato Production. Agronomy. 2021; 11(12):2552. https://doi.org/10.3390/agronomy11122552
Chicago/Turabian StyleAli, Majeed, Talaat Ahmed, Mohammed Abu-Dieyeh, and Mohammad A. Al-Ghouti. 2021. "Investigating the Quality and Efficiency of Biosolid Produced in Qatar as a Fertilizer in Tomato Production" Agronomy 11, no. 12: 2552. https://doi.org/10.3390/agronomy11122552