Article

Sustainability Estimation of Oat:Pea Intercrops from the Agricultural Life Cycle Assessment Perspective

by
Jaroslav Bernas
1,*,
Tereza Bernasová
2,
Hans-Peter Kaul
3,
Helmut Wagentristl
4,
Gerhard Moitzi
4 and
Reinhard W. Neugschwandtner
3
1
Department of Agroecosystems, Faculty of Agriculture, University of South Bohemia in Ceske Budejovice, Studentska 1668, 37005 Ceske Budejovice, Czech Republic
2
Department of Applied Ecology, Faculty of Agriculture, University of South Bohemia in Ceske Budejovice, Studentska 1668, 37005 Ceske Budejovice, Czech Republic
3
Department of Crop Sciences, Institute of Agronomy, University of Natural Resources and Life Sciences Vienna (BOKU), 3430 Tulln, Austria
4
Experimental Farm Groß-Enzersdorf, Department of Crop Sciences, University of Natural Resources and Life Sciences Vienna (BOKU), 2301 Groß-Enzersdorf, Austria
*
Author to whom correspondence should be addressed.
Agronomy 2021, 11(12), 2433; https://doi.org/10.3390/agronomy11122433
Submission received: 14 October 2021 / Revised: 20 November 2021 / Accepted: 25 November 2021 / Published: 29 November 2021

Abstract

:
Winter cereal:legume intercropping is considered a sustainable arable farming system not only in temperate regions but also in Mediterranean environments. Previous studies have shown that with suitable crop stand composition, high grain yield can be achieved. In this study, a life cycle assessment (LCA) of the influence of sowing ratio and nitrogen (N) fertilization on grain nitrogen yield of oat (Avena sativa L.) and pea (Pisum sativum L.) in intercrops was performed to find the optimal design to achieve low environmental impact. This study compared the environmental impact of oat:pea intercrops using agricultural LCA. Monocrops of oat and pea and substitutive intercrops, which were fertilized with different levels of N, were compared. The system boundaries included all the processes from cradle to farm gate. Mass-based (grain N yield) and area-based (land demand for generating the same grain N yield) functional units were used. The results covered the impact categories related to the agricultural LCAs. The ReCiPe 2016 Midpoint and Endpoint characterization model was used for the data expression. According to the results, an unfertilized combination of oat and pea (50%:50%) had the lowest environmental impact in comparison with the other 14 assessed variants and selected impact categories. In the assessed framework, pea monocrops or intensively fertilized oat monocrops can also be considered as alternatives with relatively low impact on the environment. However, an appropriate grain N yield must be reached to balance the environmental impact resulting from the fertilizer inputs. The production and use of fertilizers had the greatest impact on the environment within the impact categories climate change, eutrophication, and ecotoxicity. The results indicated that high fertilizer inputs did not necessarily cause the highest environmental impact. In this respect, the achieved grain N yield level, the choice of allocation approach, the functional unit, and the data expression approach played dominant roles.

1. Introduction

The common agricultural policy (CAP) combines social, economic, and environmental approaches for achieving a sustainable agricultural system in the European Union [1]. The aim of the ‘‘European Green Deal’’, and one of the targets of the ‘‘From Farm to Fork strategy’’, is to find ways to reduce the excess of nutrients in the environment, which are a major source of air, soil, and water pollution and thereby negatively impacts biodiversity and climate. The target of the agricultural policy is to reduce nutrient losses by at least 50% and reduce fertilizer use by at least 20% by the year 2030 while ensuring no deterioration of soil fertility [2]. Different strategies can help meet these goals [3]; among those is the inclusion of legumes into the crop rotations or their use in intercrops to improve nutrient management [4].
Winter cereal:legume intercrops for grain production performed well in terms of productivity and environmental impacts, as well as energetic and economic performances [5]. In addition, the concept of intercropping corresponds to the principles of agroecology [6]. For example, wheat:pea intercropping was proved to be a cropping strategy for using N sources efficiently due to its self-regulating spatial dynamics, where pea improves its interspecific competitive ability in areas with lower soil N levels, and vice versa for wheat, paving the way for future option to reduce N inputs and negative environmental impacts of agricultural crop production [7]. Intercropping with legumes is particularly suitable for systems with low N availability, but a deeper mechanistic understanding is required to propose general crop management procedures. The advantages of intercropping fall into three basic categories, according to Mohler and Stoner [8]. Firstly, an intercrop may use the limited resources of light, water, and nutrients more efficiently than monocrops, and this can improve yields. Secondly, intercrops frequently have lower pest and disease incidence, especially insect pests, because the mixture confuses the insects, and a carefully chosen mixture attracts beneficial predators. Thirdly, intercropping may allow more effective management of cover crops. Intercrops are already largely adopted in organic farming, but additional research efforts are needed for their adoption in conventional farming, particularly for grain production. For instance, depending on the aim of the cereal:legume intercrop (food, feed, or bioenergy production), the choice and adaptation of species, cultivars, crop management, or agricultural machinery are crucial. This underlines the need for future investigation [5].
In substitutive intercrops of oat and pea, which were fertilized with different levels of N, the total grain yields were generally lower than in the respective monocrops. Still, grain N concentration of oat and pea increased (1) with N fertilization and (2) in intercrops for oat with lower oat share, whereas that of peas was not affected by the sowing ratio. Consequently, intercrops could attain a higher grain N yield in unfertilized treatments due to higher grain N concentrations of oat in intercrops. Thus, growing oat:pea intercrops can be reasonable for producing grain feed at a low N input level [4,9]. Further, concentrations of macro-and micronutrients in grain and residues of oat and pea can be affected by sowing ratio and N fertilization [10,11]. A low N fertilization rate did not impair N2 fixation in oat: pea intercrops [12].
Each agricultural activity causes certain environmental impacts that can be expressed or quantified, for example, by the life cycle assessment (LCA) method [13]. With a suitable data source, equal system boundary settings, and a correctly chosen allocation principle, data can be generated that can adequately predict the environmental impacts of the selected system. LCA, coupled with other approaches, provides reliable and comprehensive information to environmentally conscious policymakers, producers, and consumers in selecting sustainable products and production processes [14]. Combinations of multiple functional units can contribute to more accurate and fair data expression [15].
In this study, intercrops of oat and pea were assessed for grain nitrogen (N) accumulation. The study focused on the agricultural life cycle assessment of 15 different combinations of oats and peas or their monocrops under different fertilization intensities and varying yield levels. The attributional approach, the mass allocation principle, and the characterization model were chosen. As functional units, the yield (1 kg of grain N yield) and the equivalent area, i.e., the land demand to gain the same yield (grain N yield), are used for data interpretation.

2. Materials and Methods

2.1. Data Source and Life Cycle Inventory

The study was based on a two-year field study by Neugschwandtner and Kaul [4,9], where intercrops of oat (Avena sativa L.) and pea (Pisum sativum L.) were assessed as affected by sowing ratio and N fertilization. Monocrops of oat and pea and three substitutive oat:pea intercrops were sown in the following ratios of oat:pea (%:%): 100:0, 75:25, 50:50, 25:75, and 0:100. All the crop stands were fertilized with N as calcium ammonium nitrate (CAN, 27% N) at the following levels: unfertilized control (C), 60 kg N ha−1 (N60), and 120 kg N ha−1 (N120). The experiment was carried out in eastern Austria (Raasdorf; 48°14′ N, 16°33′ E) in 2010 and 2011. The soil is classified as chernozem of alluvial origin and rich in calcareous sediments (pH 7.6, silty loam, 2.2–2.3% organic substance). The mean annual temperature is 10.6 °C, the mean annual precipitation is 538 mm (1980–2009). More details for the trial site, soil characteristics, weather data, and crop varieties are described in the methodology parts of the above-mentioned studies, which were the primary data source for the life cycle inventory (LCI) (Table 1). Secondary data for background processes were taken from the Ecoinventv3.7.1 database, which includes data from central Europe [16], Agri-footprint v4.0 [17], and WFLDB [18].

2.2. Goal and Scope Definition

The goal of this study was to quantify the environmental impacts of the oat:pea intercrops by using LCA (the method of assessing the life cycle of a product or service in terms of its impact on the environment) and find the optimal intercropping design from the environmental point of view. Functional units (FUs) related to a production unit (1 kg of grain N yield ha−1) or an area unit (land demand for generating the same grain N yield) were chosen for the quantification of an environmental impact. The system boundaries included all the processes ‘‘from cradle to farm gate’’. Data geographically related to central Europe were used. Agrotechnological operations were also incorporated into the model system: from pre-seeding preparation, through harvesting of the main product, to the transport of farming machinery, the production and use of crop-protecting agents, the production and use of fertilizers, and the harvest and transport of the main product from the harvest site. Land-use changes were taken into account. Infrastructure processes were part of database inputs. Waste management was excluded from this research because waste production was not expected within the monitored cropping systems. In the frame of this research, the transport distance from the farm to the field did not exceed the distance of 5 km. A mass allocation approach (allocation based on significant characteristics of co-products; grain and straw N yield) was employed in this study. The results of the research might be used as a source of information for agricultural subjects that focus on good farming practices and to motivate environmentally friendly farming systems. The data were analyzed and evaluated by LCA standards [19,20].

2.3. Software Data Inventorization

For the study, data related to the grain yield, grain N yield, and residue N yield from the studies of Neugschwandtner and Kaul [4,9] were summarized (Table 1). The primary data sources were statistically evaluated. The following parameters were assessed: Grain and residue yield; Yield components of oat and pea; N concentration, N yield and N harvest index of oat and pea; Total grain and nitrogen yield, Land equivalent ratio of N yields (LERN); Nitrogen use and utilization efficiency. These results are part of the primary sources [4,9] for LCI. These data were also used to determine the proportion of environmental impacts that arose during the transport of harvested phytomass. For this reason, the determination of the tonne-kilometer (tkm) was performed. For a correct assessment of these environmental impacts, the mass allocation principle was used. To apply the mass allocation principle, the determination of the residue N yield was necessary. Grain yield, grain N yield, and residue N yield of individual variants and the frequency of agrotechnical inputs, inputs from technosphere, inputs from nature, information about emissions to water and air are summarized in Table 1.

2.4. Determination of Field Emissions

The application of mineral nitrogenous fertilizers results in the release of direct and indirect emissions. The following were considered in monitoring field and agricultural emissions: NH3 and NOx volatilization, NO3 leaching to groundwater, and N loss from leaching and surface outflow (expressed as dinitrogen monoxide, nitrate, and ammonia in Table 1). The emission loads were determined following Nemecek and Kägi [21]. The nitrogen generated from the biological N2–fixation of pea was not considered within the field emissions cultivation; therefore, NH3 and NO3 emissions to air and water were not taken into account in this case. The risk of erosion was not considered in the study. The production of pesticides, respectively their active substances, and their distribution has been taken into account by using data from the Ecoinvent database [16], but the fate of the pesticides in the environment did not. Therefore, the toxicity impact cannot be considered as fully reflected.

2.5. Impact Assessment

An LCA method was used for the quantification of environmental impacts. The system boundaries were set from ‘‘the cradle to the farm gate’’. The results of this research were related to the impact categories of climate change (kg CO2eq), terrestrial acidification (kg SO2eq), freshwater eutrophication (kg P eq), marine eutrophication (g Neq), human toxicity (kg 1,4-DBeq)-non-carcinogenic toxicity, terrestrial ecotoxicity (g 1,4-DBeq), freshwater ecotoxicity (g 1,4-DBeq), water depletion (m3eq), and fossil depletion (kg oil eq). The Attributional approach was used for this study. Selected impact categories are suitable for agricultural LCAs [13,22]. The SimaPro 9.2.0.1 software, ReCiPe 2016 Midpoint and Endpoint, Hierarchical (H) V1.05/World (2010) H, an integrated method, and the Cut-off System Model approach were used for the assessment of the environmental aspects. One kg of the final product (1 kg of grain N yield) and an area unit (land demand for generating the same grain N yield) were used as functional units. The Characterization approach was primarily used for data expression. Weighting was used as a final step for applying a value judgment to the LCA result.

3. Results and Data Interpretation

A life cycle of the monocrops of oat and pea, and cereal:legume intercropping systems was created according to the methodology and the data available; the environmental impacts per 1 kg of grain N yield, and for the land demand for generating the same grain N yield were quantified. The interpretation approach was based on a combination of two functional units. It enabled an equal expression of data and demonstrated trends in individual cultivation technologies within all evaluated impact categories and data from multi-year field experiments.
The results were related to nine impact categories relevant for agricultural LCAs. The results are presented in Table 2 and Table 3.

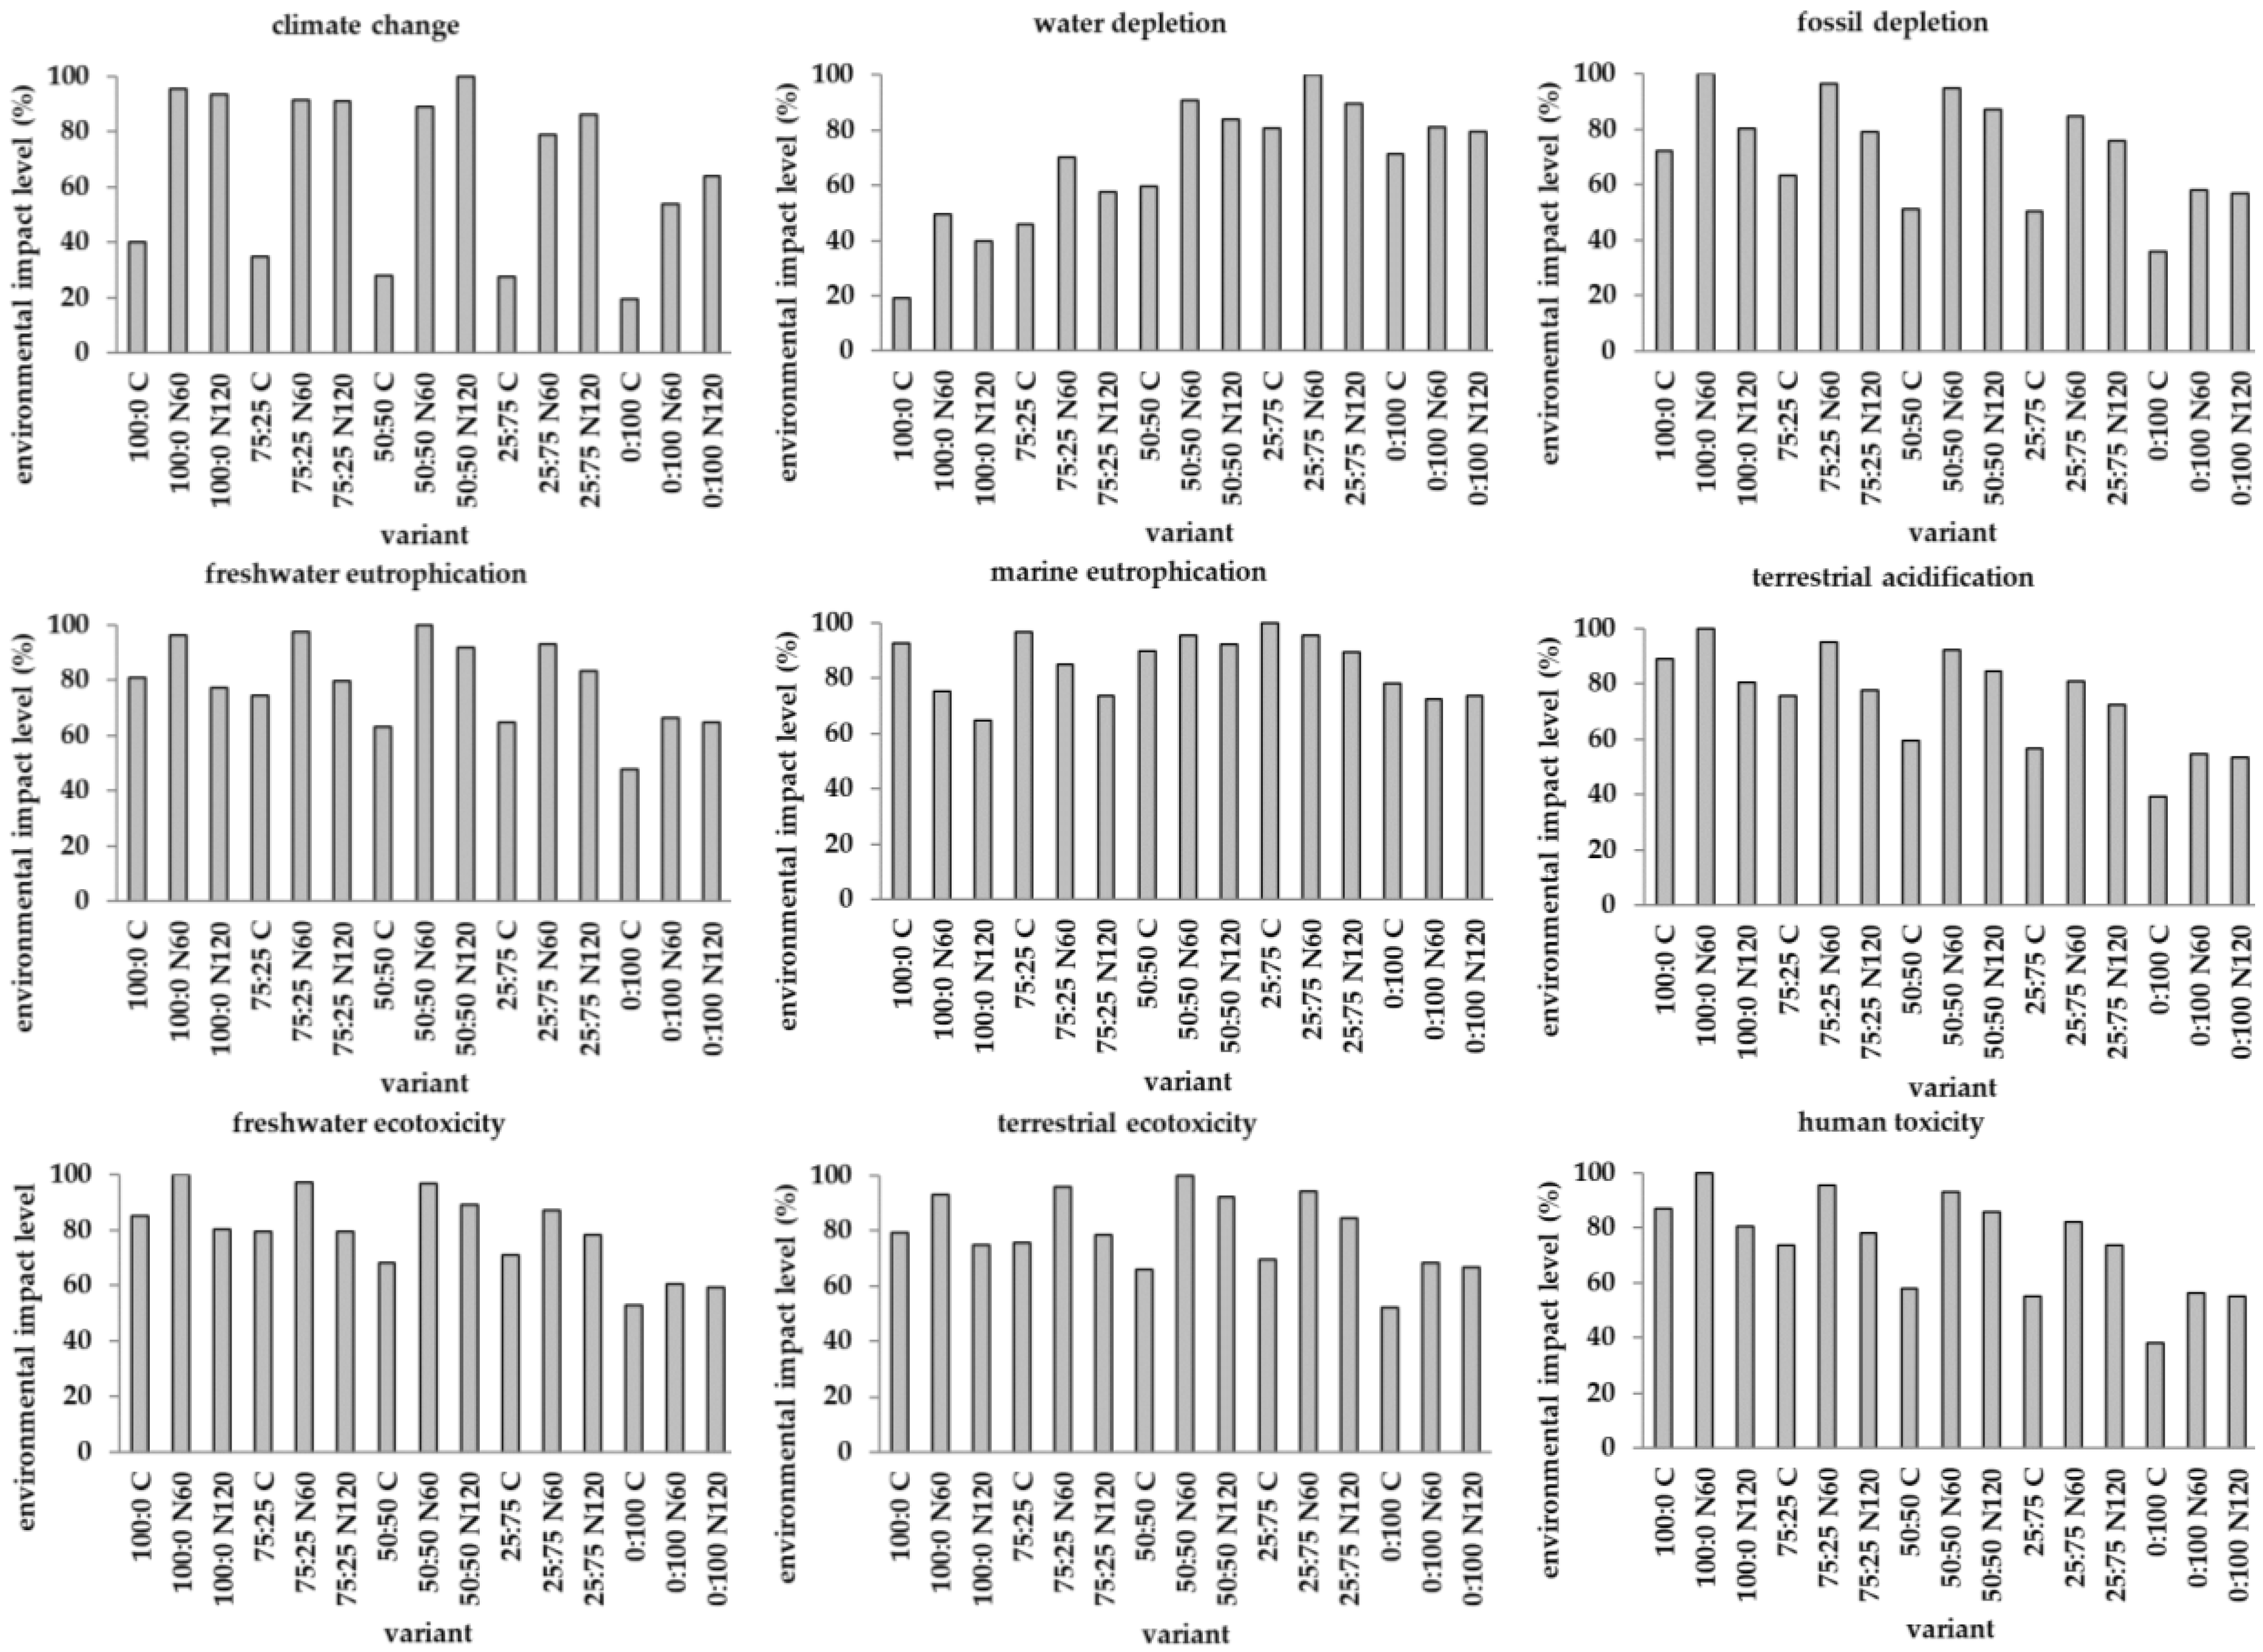
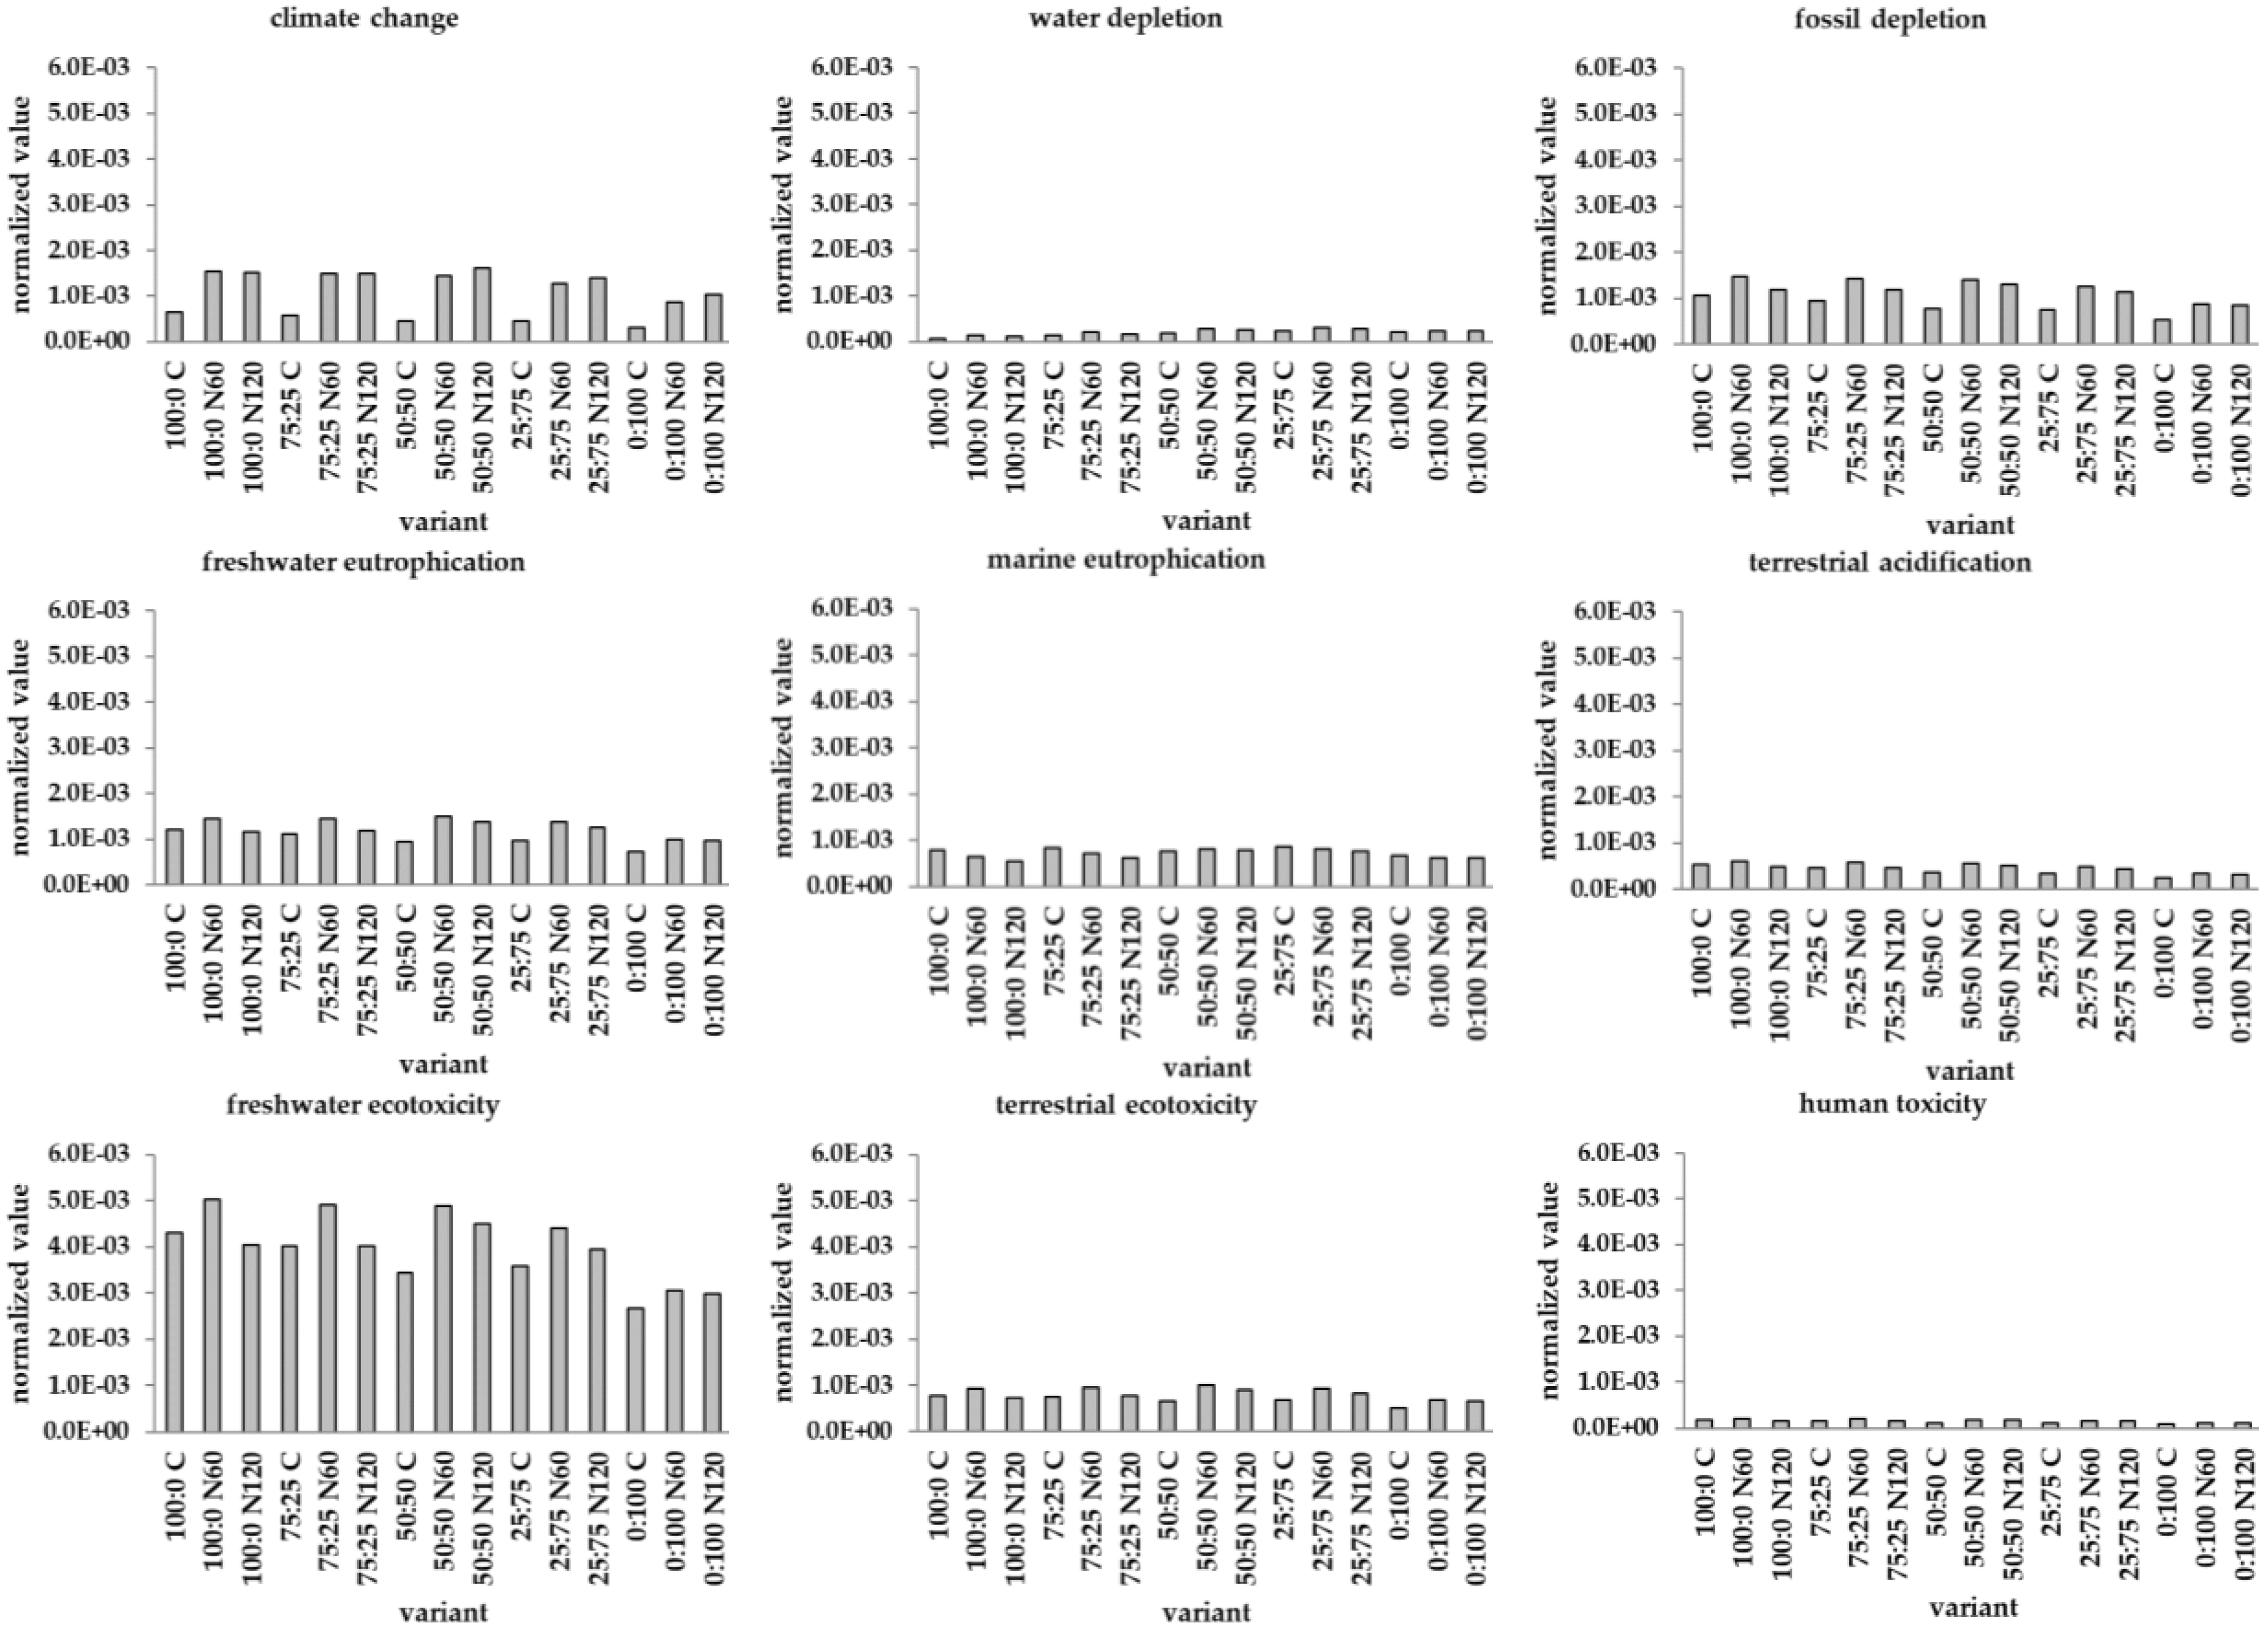
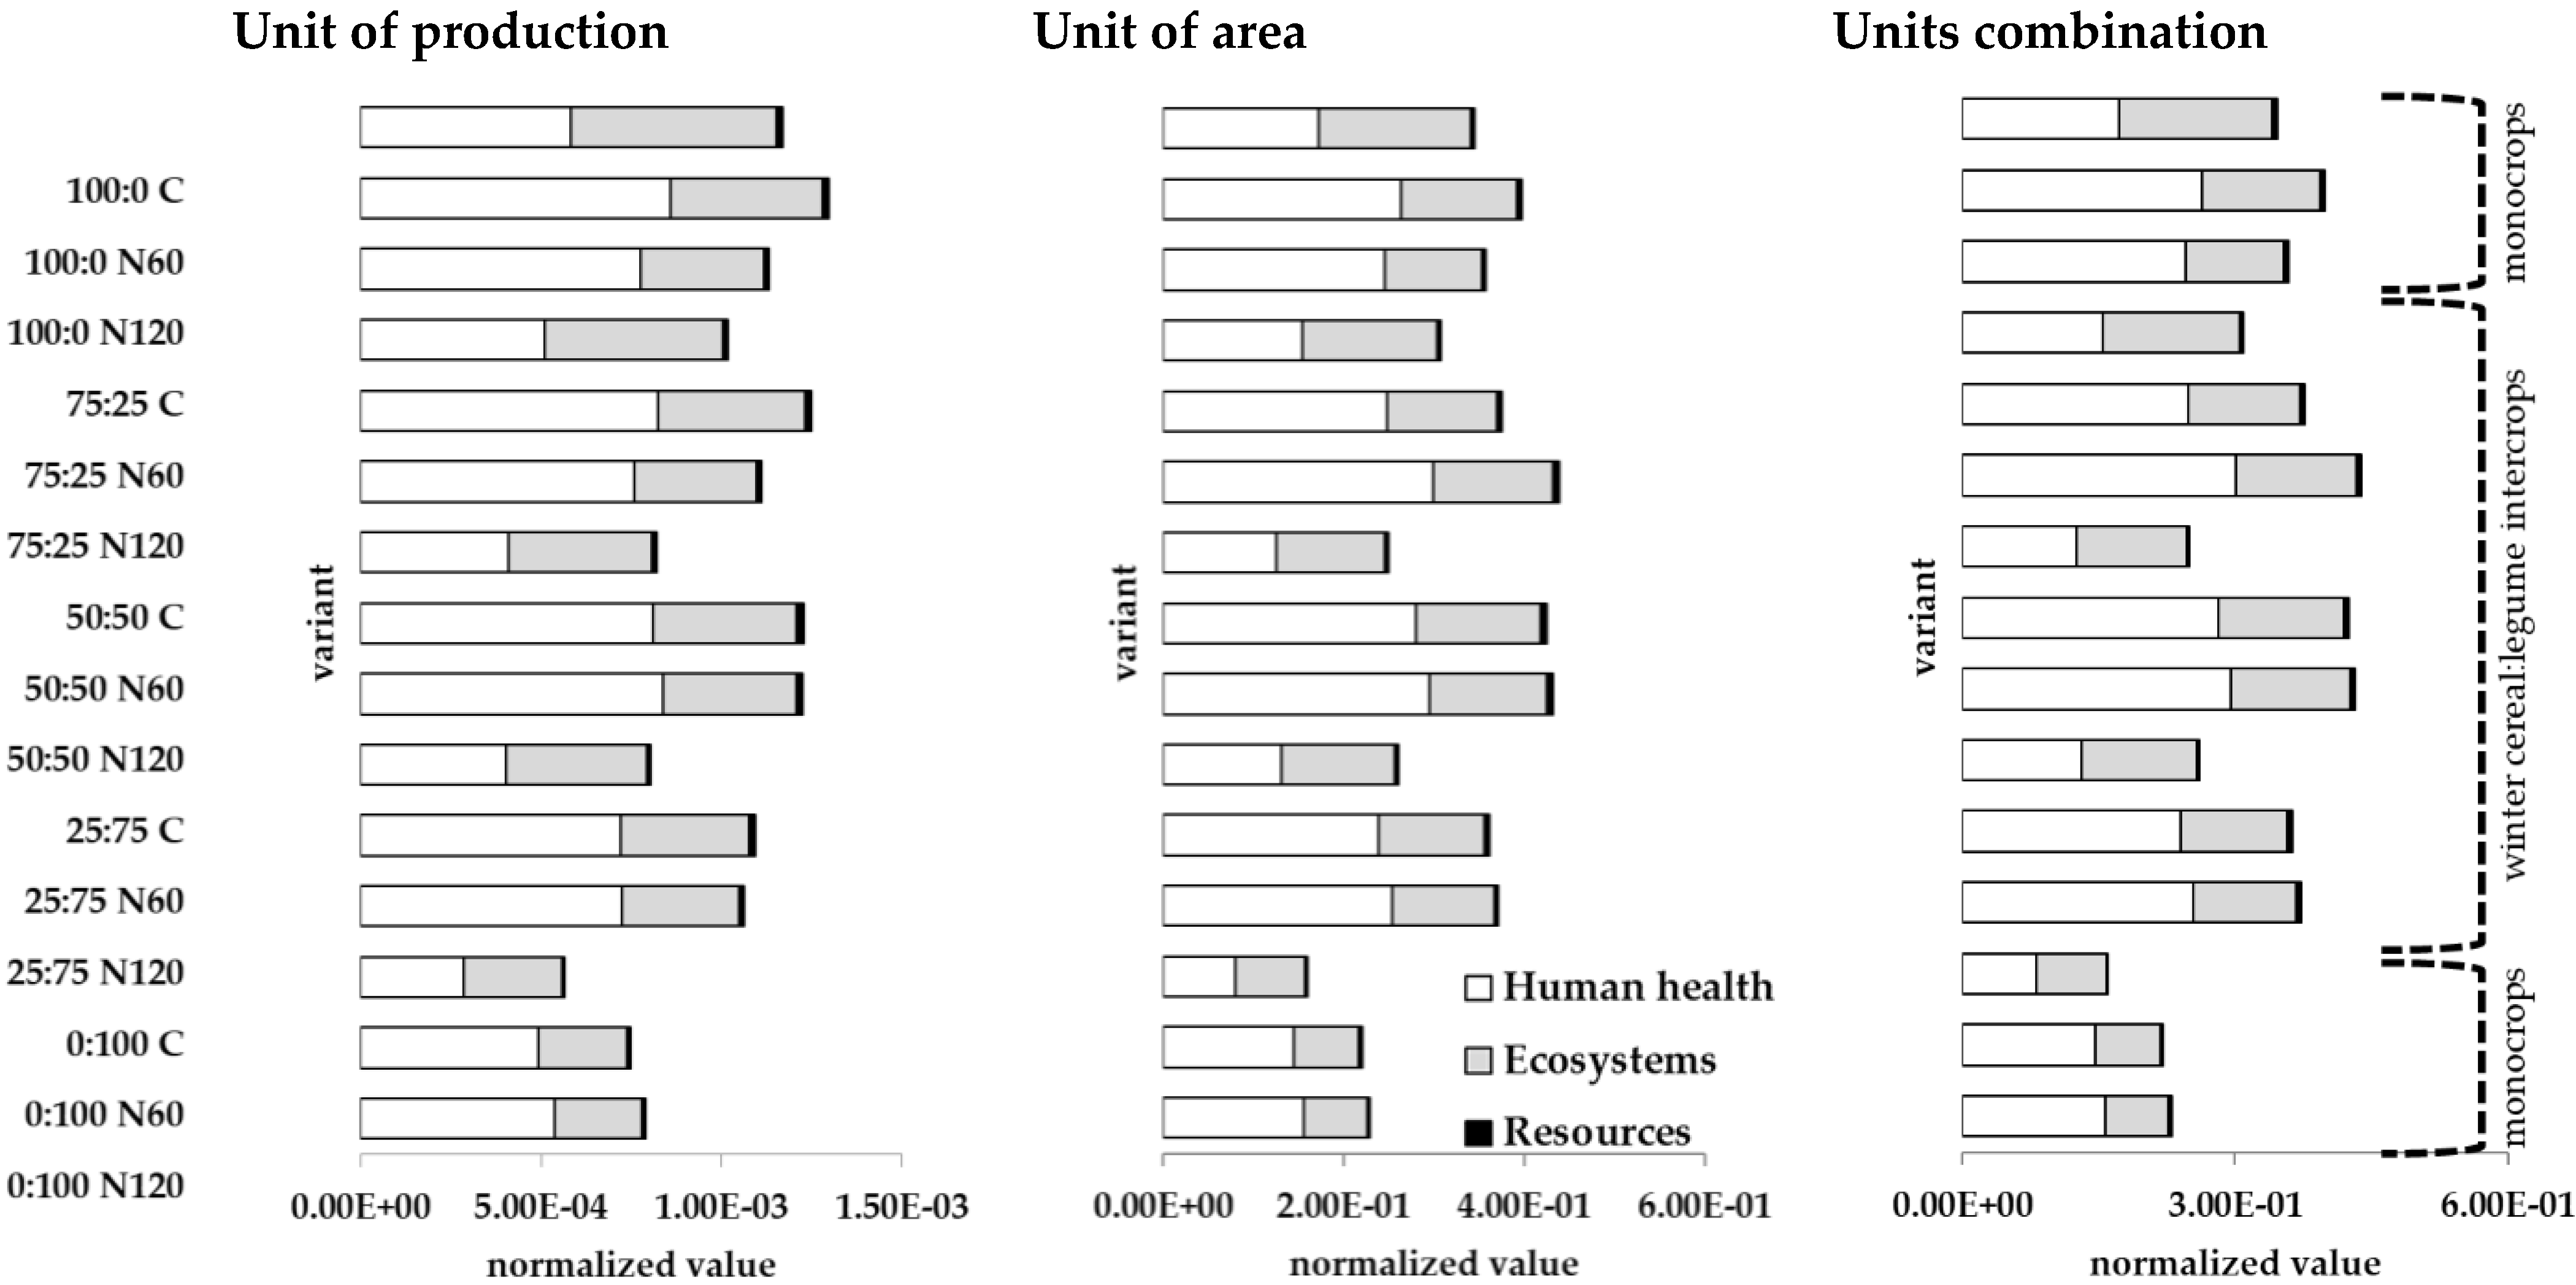
3.1. Unit of Production and the Sensitivity Analysis

In Table 2, the grain N yield ha−1 was considered. Within all assessed variants and trends, pea monocrops had generally low values in individual impact categories. Further, low levels of environmental impact were found for the following variants: 100:0 N120, 50:50 C, or 75:25 N120. On the contrary, the highest environmental impacts were found for 100:0 N60, 75:25 N60, 50:50 N60, or 25:75 N60. This, of course, depends on the level of grain N yield and inputs to the life cycle. The input of N and thereby the related emissions were a significant component of the total environmental impacts.
Concerning results, 50:50 C,75:25 N120, and 25:75 C intercrops could be considered as potentially sustainable from the point of view of FU of production (grain N yield ha−1). Values of environmental impacts were expressed in% within the individual impact categories, where 100% meant the highest value within the assessed variants and selected impact categories (Figure 1).
From a general point of view, trends suggested that the highest environmental impact (within FU of production) was associated with oat monocrops (100:0 C, and 100:0 N60), and oat:pea intercrops with the input of 60 kg N ha−1, especially in the impact categories of terrestrial acidification, freshwater eutrophication, marine eutrophication, human toxicity, terrestrial ecotoxicity, and freshwater ecotoxicity. For example, the highest environmental impact within the water depletion impact category was then associated with 25:75 N60.
A normalization approach was used to inform about the relative magnitude of each of the characterized scores for the different impact categories by expressing them relative to a common set of reference impacts (one reference impact per impact category) (Figure 2). The result of the normalization is the normalized impact profile of the product system in which all category indicator scores were expressed in the same metric.
The normalization of the data showed the most affected impact categories. However, it should be added that the results were related to the functional unit of production, which was therefore strongly influenced by the grain yield or grain N yield. In general, and due to the character and intensity of inputs into the growing framework, the most affected category was freshwater ecotoxicity, a category that was affected by the production of seeds used (oat and pea), the input of N fertilizer, agrotechnological operations, transport and use of pyrethroid insecticide.
Within the normalization model, it was also possible to point out the influence of fertilizer (CAN) input on differences in environmental impacts most visibly within the climate change impact category. Respectively, the environmental impact for unfertilized variants was about one-third in comparison with fertilized variants. The influence of the used seed in the impact category of terrestrial ecotoxicity was also manifested. Thus, with the decreasing rate of oat seeds, the overall environmental impact decreased and vice versa. This was generally due to more intensive cultivation practices in oats and grain production, leading to a higher environmental impact than pea seed. It is also necessary to draw attention to the category of human toxicity and water depletion, where the impact on the environment within the standardization was practically negligible compared to the other categories. The water consumption was practically not reflected in the normalization model due to the generally low input.

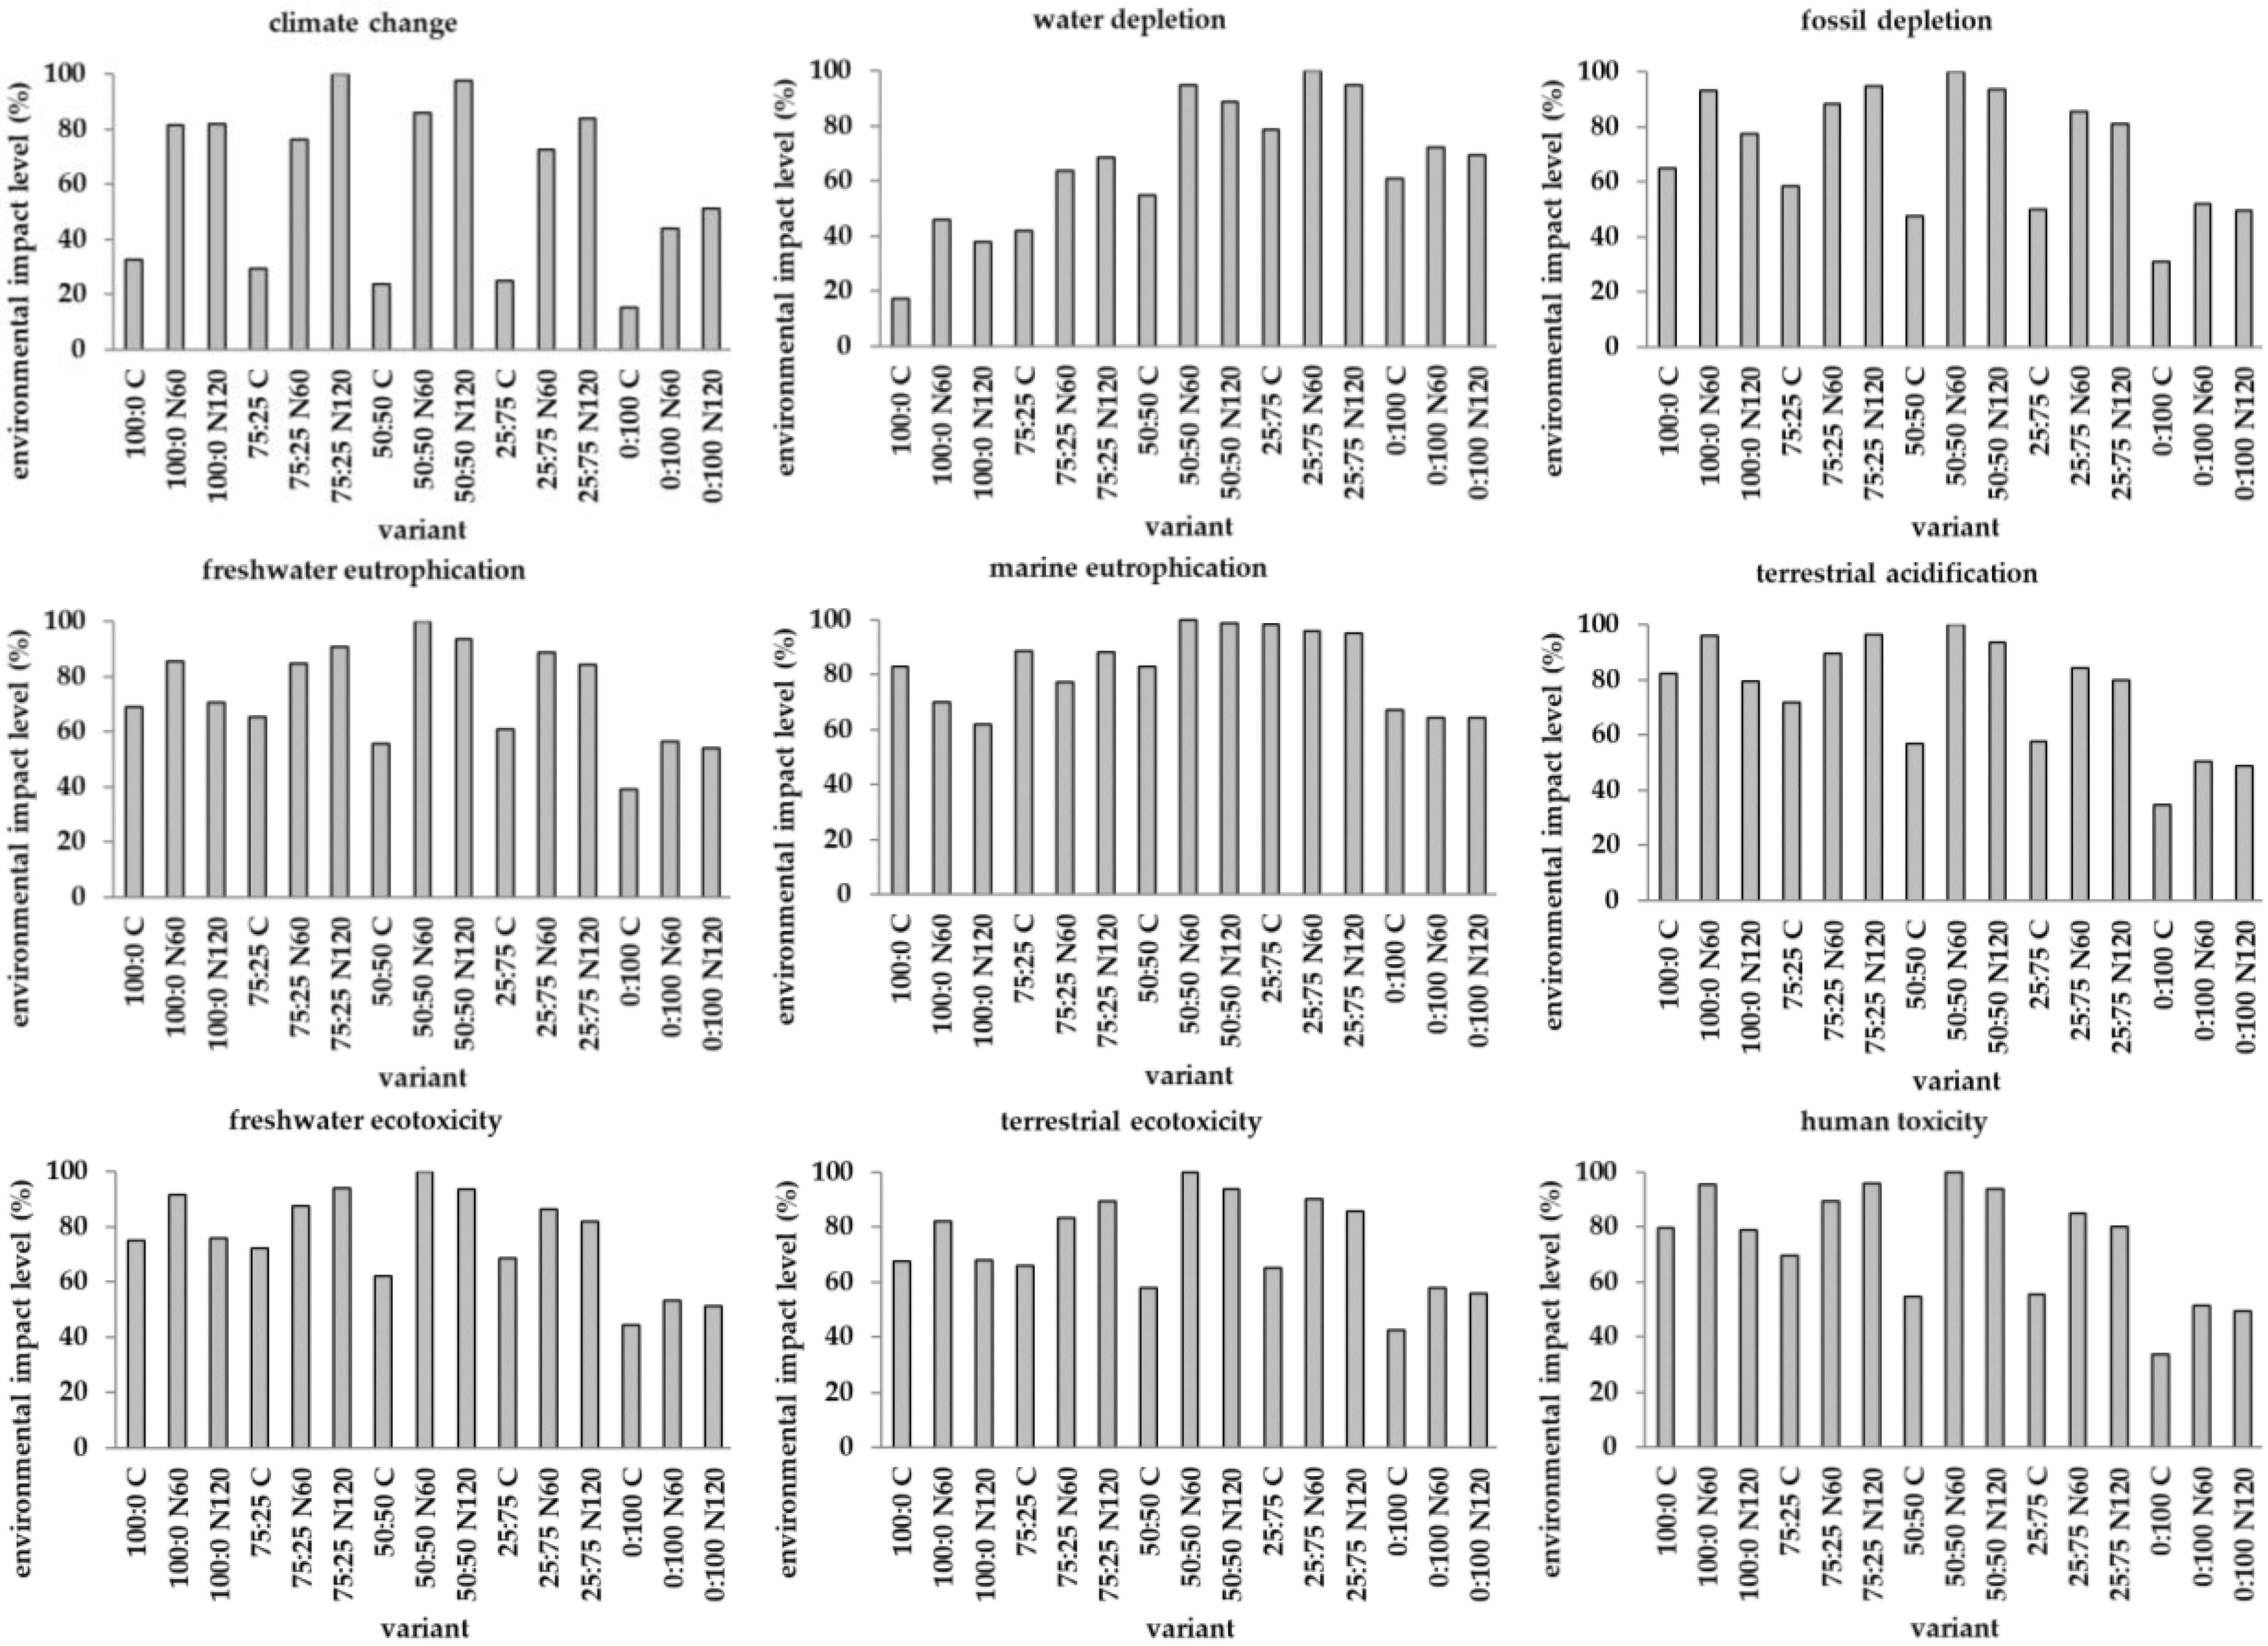
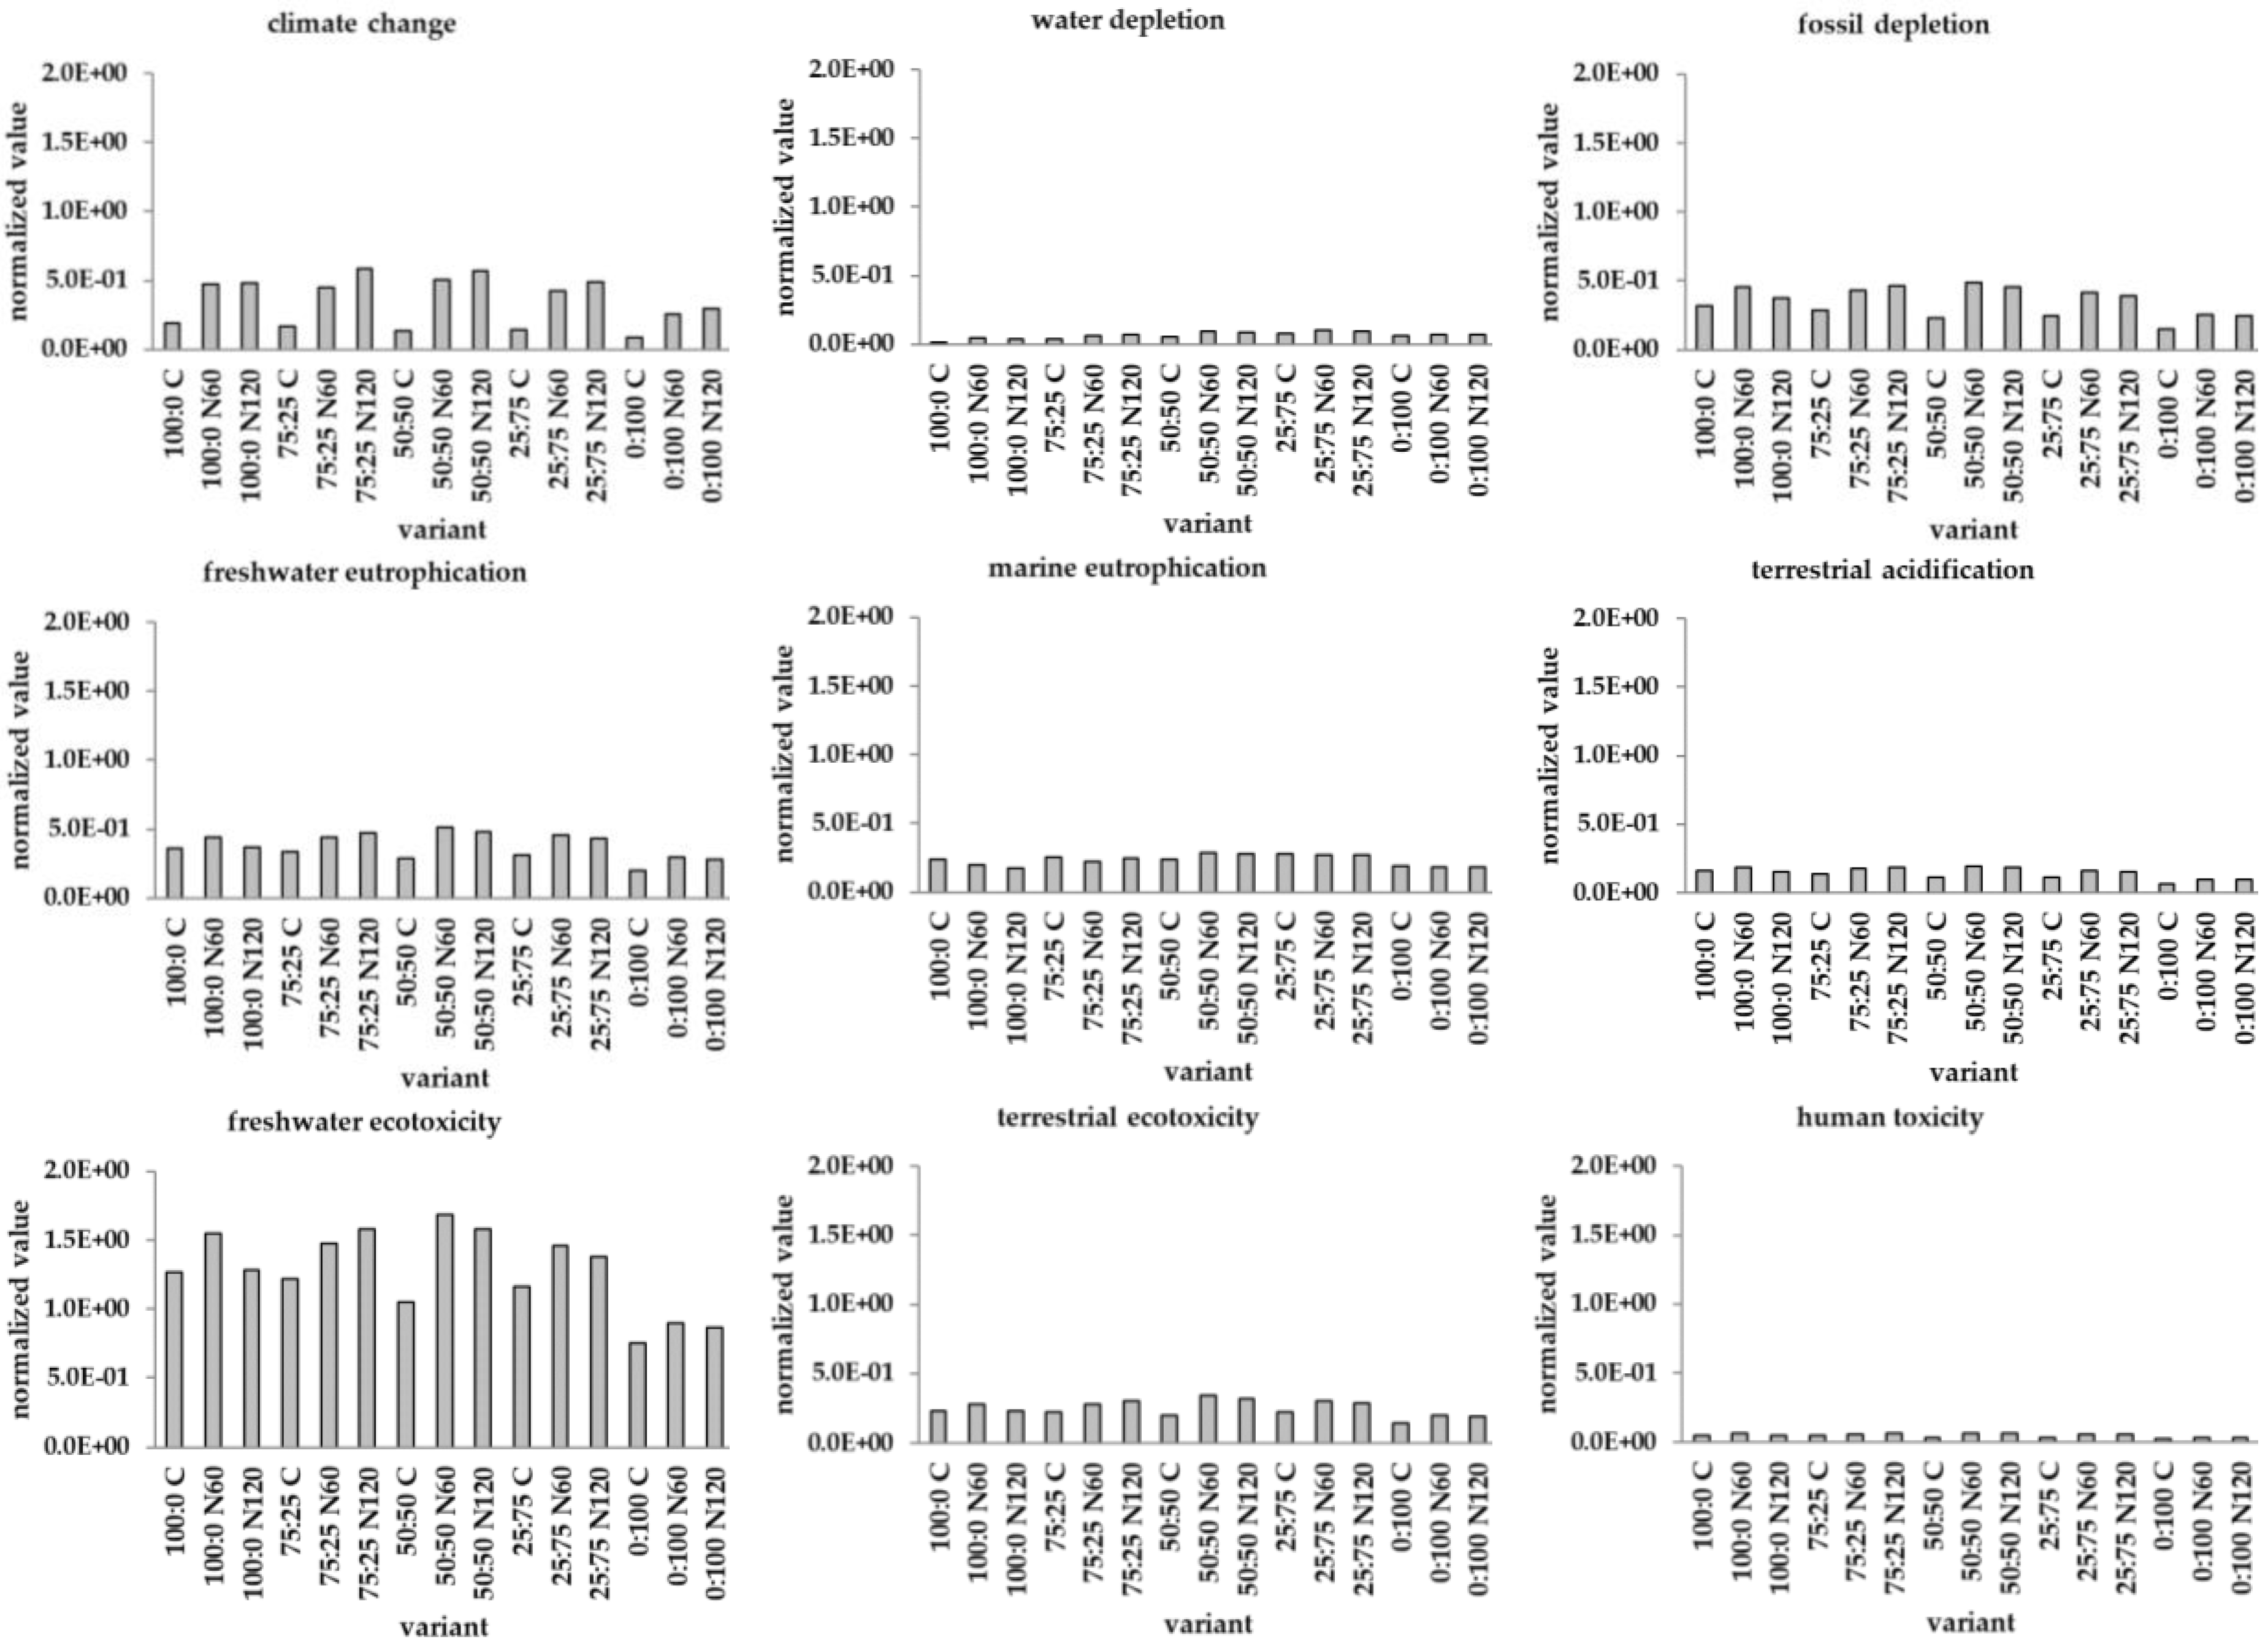
3.2. Unit of the Area and the Sensitivity Analysis

In this evaluation, the land demand for generating the same grain N yield (equivalent area) was calculated (cf. Table 1). In Table 3 and Figure 3, the environmental impact related to land demand was considered. The smallest land demand corresponds to the area of one hectare (1 ha), to the highest grain N yield, respectively. The 0:100 N120 variant achieved this. On the contrary, the highest land demand (land demand for grain N yield as by 0:100 N120) corresponded to variant 100:0 C (2.68 ha).
Among all the assessed variants, pea monocrops generally had the lowest values in individual impact categories, i.e., the lowest environmental impact. On the contrary, the highest environmental impact was associated with 50:50 N60, with75:25 N120, and 25:75 N60. This was due to the higher land demand to obtain the same grain N yield.
The highest and lowest values within the individual oat:pea intercrops among the stated impact categories (without monocrops) were selected to find the optimal variant in terms of environmental impact. From the point of view of the FU of area (land demand for generating the same grain N yield), 50:50 C and 25:75 C intercrops can be considered environmentally friendly, and the best choice seems to be 50:50 C.
The resulting values, therefore, indicated that the lowest environmental impacts within the selected impact categories were obtained with the cultivation of pea monocrops, except for the category water depletion. This can be considered as the expected result due to the high grain yields, respectively, grain N yields in comparison with other cropping designs (cf. Table 1). For the opposite reason, i.e., due to relatively low grain N yield levels, high environmental impacts were associated with oat monocrops, and because of the nitrogen input with the intercrop with 50:50 N60 and N120, and 25:75 N60 and N120.
The normalization approach was also used for other data interpretation (Figure 4). The normalization of the data showed the most affected impact categories. The results were related to the functional unit of equivalent area, which was needed for generating the same grain N yield. Similar to the FU of the production, the most affected category was freshwater ecotoxicity, which was affected by the production of seeds used (oat and pea), the input of N fertilizer (CAN), agrotechnological operations, transport and use of pyrethroid insecticide. The general trend direction (related to selected impact categories) was the same as for FU production (Figure 2).

3.3. Contribution Analysis Summarization

Due to the study’s goal to follow the complete and already presented variants as a whole and their environmental impact trends with their yield levels, no contribution analysis related to individual variants was performed within the graphical interpretation. The results in this respect would differ mainly due to differences in the dose of applied fertilizers and the seed ratio according to variants. The other inputs were the same for all variants. The obtained data would not bring new significant findings, and the aim was not to propose changes in cultivation practices. However, a brief summarization of the contribution analysis was made. Within the climate change impact category, for variants with 60 or 120 kg N (CAN) ha−1, the so-called field emission emissions (around 43 to 53%) arising after its application and emissions related to its input of CAN (about 20%) contributed the most to the total environmental impact. The share of CAN input represented about 25–30% of the total impact within the categories terrestrial acidification, freshwater eutrophication, human toxicity, freshwater ecotoxicity, terrestrial ecotoxicity, water depletion, and fossil depletion. A smaller share (<10%) then represented the input of CAN in the category of marine eutrophication. In the case of unfertilized variants, the input of agrotechnology (about 65%) and land use (25%) predominates in the total environmental impact due to the lack of N input. Agrotechnical operations, inputs associated with tillage, application of fertilizers or plant protection product, and harvest of the main product, respectively, represented an important share of the total environmental impact (around 10 to 45%) in other categories of impact, depending on the variant. The impact of the pyrethroid insecticides share did not exceed 5% across the selected impact categories. This was also the same for the environmental impact associated with the transport of the harvested product (<5%). The dominant share in the total environmental impact was represented by seed inputs (pea and oat), their production, respectively. The intensity of the impact on the environment varied according to the variant and the proportion of seed. Across variants and impact categories, this share ranged from 5 to 85%. The categories of marine eutrophication, terrestrial ecotoxicity, and water depletion were most affected by this input (>45% in all impact categories and variants). For unfertilized variants, this input had a generally higher share in all impact categories (due to missing input of N). Oat seed input then had a more substantial effect on the marine eutrophication or terrestrial ecotoxicity impact category, while pea seed input had a more significant impact on the water depletion category. This was due to inputs into the cultivation technology modelled by the Ecoinvent source database [16].

3.4. Trends of the Environmental Impacts (LCA Weighing)

The combined assessment of obtained data is shown in Figure 5. This part was considered as a weighing, applying a value judgment to LCA results, respectively. For this part, the interpretation of data was used, which allowed the assessment of all monitored variants, all impact categories, and both specified functional units together. Thus, this interpretation of data allowed a broad view of the topic. The data used for this interpretation were obtained on the basis of a normalization model expressed in the Endpoint categories: Resources, Ecosystems, Human health. From a general point of view, Human health would be potentially the most affected impact endpoint category. The category representing the impact on ecosystems, respectively the endpoint category Ecosystems, reached about 50% of the impact level compared to the Human health category. The lowest impact, even negligible, would then be related to the Resources category.
The combination of both FUs showed that all pea monocrops had the lowest environmental impact from the environmental perspective, followed by the unfertilized intercrops. In the case of intercrops, the trend of the lowest environmental impact within the 50:50 C variant was confirmed in the unfertilized variant combining oats and peas. In comparison, fertilized intercrops and oat monocrops had a higher environmental impact. However, the 100:0 N120 variant was one of the treatments with comparatively low environmental impact.

4. Discussion

The results of the agricultural LCA of monocrops and intercrops of oat and pea were affected by the achieved grain N yield. With increasing grain N yields, the impact on the environment generally decreased. However, there should be an even certain balance between inputs and outputs. The level of the environmental impact of the evaluated variants was possible to express through trends connected with their life cycle (results and data interpretation part). The grain N yield level was then also reflected in the size of the area that would potentially be needed to achieve the same amount of grain N yield within all the 15 assessed variants. The smallest land demand (1 ha) was estimated for the highest fertilized pea monocrop (0:100 N120). Pea monocrops and unfertilized intercrops can be considered sustainable cropping systems from the agricultural LCA perspective as monocrops had the highest grain N yields among crop stands, and the grain N yields of unfertilized intercrops were in the range of those of fertilized intercrops. Although oat:pea intercrops could not achieve higher grain yields than corresponding monocrops on the fertile soil of the present study [9,23], in these intercrops, the grain N yields were high even without N fertilization, and thereby the environmental impact associated with N fertilization did not arise. In relation to these aspects, Neugschwandtner and Kaul [4,9] stated that N fertilization significantly increased grain and residue yields of oat but did not affect these parameters in a pea. Oat was the dominant partner in the mixtures, strongly outcompeting pea. Decreasing sowing ratios resulted in lower yields of both crops. Grain and residue yield of oat slightly decreased with decreasing share in the intercrops, whereas pea yields were strongly affected. The harvest index (HI) of pea was reduced by fertilization, whereas that of oat was not affected. Intercropping resulted in a decrease in the HI of both crops.
In the case of oat monocrops, a relatively high N fertilization rate (120 kg N ha−1) was necessary to achieve an adequate grain yield (5752 kg ha−1) or grain N yield (135.4 kg ha−1). The inputs of mineral fertilizers dominantly affected the impact categories climate change, eutrophication, and ecotoxicity. Pea monocrops can be considered as an environmentally friendly option in this assessment. But in two cases (N60 and N120), there was an application of mineral fertilizers, which increased the yield per unit area (according to results presented by Neugschwandtner and Kaul [4,9]) and thus, offset the negative impacts associated with them. From an environmental point of view, a variant without fertilization may be suitable, but it did not provide such high yields per unit area. In addition, it must be taken into account that a pea monocrop can be included only once in a four-year rotation. This leaves variant 50:50 C, which can be considered interesting from the point of view of both yield and environmental aspects. Besides, it is not a monocrop, and the oat can be benefited by its leguminous, N2-fixing companion, and therefore no additional mineral fertilizer input is required.
The reduction of nutrient supply (especially N) is one of the sustainability strategies [2], as emissions of N in the form of nitrate (NO3) can result in eutrophication of nearby water bodies (freshwater eutrophication) and, ultimately, of the ocean and the sea (marine eutrophication) [13]. Yet, our results have shown for oat and pea monocrops that even high N inputs did not necessarily cause high environmental impacts. Whereas in the case of intercrops, unfertilized variants were much more environmentally friendly than fertilized ones. From this point of view, the use of unfertilized oat:pea intercrops seems an interesting way for achieving high grain N yields with low environmental impact. To achieve high yields, only the benefit from the biological N2-fixation, which is mediated by pea, was exploited here [24], and LCAs with legume cropping systems should then account for these benefits optimally [25]. According to Pelzer et al. [5] and Naudin et al. [15], it is more environmentally sustainable to grow intercrops than monocrops. Neugschwandtner and Kaul [9] showed that sowing ratio and fertilization affected yield component parameters of oat and pea compared to the corresponding monocrops. Oat in intercrops used available environmental resources for increasing grain and panicles yield beyond those of oat in monocrops, whereas harvest index and grain weight of pea were negatively affected in the intercrops. But the mixing ratio of intercrops is important, e.g., in the study by Monti et al. [26], a 50%:50% cereal:pea combination (based on full monocrop densities) enabled a higher share of the legume on the total intercrop grain yield and provided a well-balanced mixture in drought-prone environments, while with a combination of 100%:50%, not only the legume was highly outcompeted by the companion cereal but also the cereal failed to achieve in several cases similar yields as in the respective monocrop.
The LCA of selected cropping systems was influenced by several factors, one of those was the allocation approach. The choice of allocation approach fundamentally affects the results [27]. For the study, mass allocation, grain N yield, respectively, were used. A similar approach, termed “nitro allocation”, was used, for example, by Naudin et al. [15], who also calculated with the land equivalent ratio the unit area needed for achieving similar yields. For functional units related to agricultural LCAs, the combination of production/area/time is recommended [28]. According to Naudin et al. [15], intercrops are an interesting example of the ecological intensification of cropping systems by improving resource use and decreasing environmental impacts for all impact categories considered based on the equivalence of production. This statement was not confirmed in this study because, in several impact categories, intercrops showed higher environmental impacts per unit of production and unit area compared to monocrops (especially those of peas).
Our results showed different values of the environmental impact related to the life cycles of individual crops and variants of cultivation. Fertilizer inputs have had a significant effect, as already shown for agricultural LCA by Hauschild et al. [22], especially when applying the ‘‘from cradle to farm gate’’ approach. For this reason, too, a 50:50 C (unfertilized oat:pea intercrop) was found to be a very interesting variant, with relatively high grain yield and grain N yield and high sustainability potential. In the agricultural LCAs, there is always the question of the field emissions, respectively emissions arising from the N fertilizers production and application. Fertilizer consumption typically contributes to potential impacts due to field emissions into all environmental compartments: air, water, and soil. Reducing the dose of fertilizers used in the agricultural sector has long been considered a key activity in reducing N2O and NO emissions in particular [29]. N2O can be considered as the main greenhouse gas, and ecological management systems usually produce less (also CO2) due to generally lower inputs [30]. More specifically, on-farm use of fertilizers results in NO3 leaching to groundwater, emissions of ammonia (NH3), nitrous oxide (N2O), and nitrogen oxides (NOx) to air, contributing to impact categories such as acidification, climate change, and eutrophication [13].
A further approach for reducing the overall environmental impacts is organic production, which is, in particular, decreasing the impact categories related to toxicity. Organic oat production was generally perceived as more environmentally friendly than conventional production. But under organic production, a decrease in the grain yield and, consequently, economic profits can occur [31]. However, the opposite situation was also reported in pea, i.e., organically grown pea could increase environmental impacts. For example, within the Ecoinvent database sources [16], the higher environmental impact (within 18 impact categories) was connected with 1 kg of organically produced pea compared to conventionally grown one due to yield level. There is a risk that the importance of some impact categories may be under or overestimated due to database sources. For a meaningful packaging LCA, good quality of secondary data and reliability of the LCI methods are absolute prerequisites [32].
Pesticides and other plant protection substances are another source of environmental damage, which should be eliminated according to CAP plans [1]. Pesticides may be leached out of the soil for 15 years or more after the end of their use (as in the case of atrazine used in maize crops). Besides, they produce many metabolites, which may have even greater effects than their original parent compound. The intensity of their leaching was strongly connected with precipitation-runoff events [33]. In agricultural LCAs, pesticides mainly affect environmental toxicity categories [34,35], and field emissions that are linked to pesticides can be estimated [36]. In this study, the pesticides were incorporated in the growing cycle of all variants through the Ecoinvent database [16]. So, in the toxicity categories, one of the inputs was chemical protection, i.e., emission from pyrethroid insecticides, deltamethrin specifically, with relatively small impact (˂5%). Deltamethrin was considered rapidly degraded with a half-life of 8 to 48 h, depending on the mechanism of distribution into water [37]. The monitoring of pyrethroid compounds and their fate in the environment is important [38].
Together with pesticides, nitrates also leak into the surface and ground waters. Specific outflows of both pollutants were significantly linked with specific water runoff, respectively, with precipitation episodes. The situation in large agricultural and residential catchments can be even worse and more complicated. The results show that it is still important to monitor the fate of pollutants and foreign substances in the environment. There are still many questions about their transport and behaviour, interactions in mixture with other substances, and the impact on human health. Effective ways for reduction of their amount and suitable management must be found. To reduce the outflow of pesticides and fertilizers into surface waters, especially in the agricultural landscape, an establishment of perennial green structures (as meadows, pastures, or perennial forage crops) seems to be a perspective way [33]. Such green structures are among the generally recommended strategies in the field of agrotechnology [39]. In this respect, intercrops can also underpin this function well.
Although the agricultural LCA method has been followed, a few limitations still exist in this study. The LCA results can be influenced by various uncertainties, such as model choices, initial assumptions, and data quality [22]. The data relating to the yield components were adopted from multi-year field experiments [4,9]. But for the comprehensive evaluation of the potential environmental impacts, data corresponding to conditions of the experiment optimally (related to agrotechnical operations parameters, seed production, land occupation, etc.) should be considered, which is also mentioned in the guidelines of the Intergovernmental Panel on Climate Change (IPCC) [40]. In this study, the inputs data were integrated from the libraries of the Ecoinventv3.7.1 database [16], Agri-footprint v4.0 [17], and WFLDB [18]. In relation to the limits, also ecosystem services associated with intercropping, content of soil organic matter (SOM), and benefits of carbon sequestration are not implemented in the life cycle impact assessment method. There is also a need to overcome currently prevailing assumptions for pesticide emissions (leading to overestimation of freshwater ecotoxicity when considering field soil part of the ecosphere) and to consider pesticide residues in crops as a contributor to human toxicity, which is currently mostly missing in LCA studies (leading to underestimation of human toxicity impacts) [41].

5. Conclusions and Prospects

Intercropping is an agricultural practice with the potential to increase the sustainability of agricultural systems. Monocrops and intercrops of oat and pea with different sowing ratios and amounts of calcium ammonium nitrate inputs were assessed by agricultural LCA. The results showed that from an environmental point of view, oat:pea intercrops primarily without N application had a low environmental impact. The results were influenced by the yield level (grain N yield) and cannot be considered constant. However, an unfertilized oat:pea intercrop seemed to be a sustainable and effective cropping system from the perspective of environmental impact assessment, together with pea monocrops.
The results also indicated that intensive cultivation practices, i.e., practices with high fertilizer inputs, do not necessarily confer the highest environmental impact. In this respect, the achieved yield level, the choice of allocation approach, and the functional unit play a dominant role. For agricultural LCA, it is possible to recommend the attributional approach, the multi-output processes for allocation, and the combination of functional units for data interpretation optimally. The study also pointed to the importance of field trials to collect adequate and objective data for LCI. The results of multi-year field experiments should be considered as relevant input data. The results can contribute to the implementation of intercropping in strategic plans, for example, in the area of the Green Deal for Europe.
Nevertheless, further research works, as well as methodological developments, are still needed to keep on improving agricultural LCAs and intercrops:
(1)
To focus on intercropping systems, whose high diversity contrasts with the low rate of data available
(2)
The modelling of field emissions of nutrients based on combining parameters of soil, climate, biological fixation on nitrogen, and practices
(3)
The fate of pesticides in the environment and their environmental impact
Economic aspects evaluation should be performed to develop the intercropping strategy.

Author Contributions

J.B.: conceptualization; original draft writing; methodology; software analyses; investigation; interpretation; writing—review & editing; T.B.: original draft writing; data interpretation; visualization; writing—review & editing; H.-P.K.: data support for LCI; supervision; H.W.: data support for LCI; supervision; G.M.: supervision; R.W.N.: conceptualization; data support for LCI; original draft writing; visualization; writing—review & editing. All authors have read and agreed to the published version of the manuscript.

Funding

The research was financially supported by the Grant Agency of the University of South Bohemia in České Budějovice, Czech Republic under grant number GA JU 045/2019/Z, and by the Faculty of Agriculture, the University of South Bohemia in České Budějovice.

Institutional Review Board Statement

Not applicable.

Informed Consent Statement

Not applicable.

Data Availability Statement

All the data related to this manuscript are available in this document or they were cited in the references.

Acknowledgments

The authors would like to thank the Faculty of Agriculture, the University of South Bohemia in České Budějovice, for their financial and material support. We would like to thank our colleagues for their help with administrative support and manuscript preparation. We finally want to warmly thank the editorial office of the Agronomy Journal and the anonymous reviewers for their comments, which improved the quality of the paper.

Conflicts of Interest

The authors declare no conflict of interest.

Abbreviations

CANcalcium ammonium nitrate
CAPThe common agricultural policy
CO2carbon dioxide
C variantcontrol variant
ECEuropean Commission
eqequivalent
FUFunctional unit
HIHarvest index
IPCCIntergovernmental Panel on Climate Change
ISOInternational Organization for Standardization
LCAthe life cycle assessment
LCIthe life cycle inventory
LERNland equivalent ratio of N yields
Nnitrogen
N2dinitrogen
NH3ammonia
NOnitric oxide
N2Onitrous oxide
NO3nitrate
NOxnitrogen oxides
N60 variantvariant with the input of 60 kg N ha−1
N120 variantvariant with the input of 120 kg N ha−1
Pphosphorus
SO2sulfur dioxide
tkmthe tonne-kilometer
SOMsoil organic matter
WFLDBWorld Food LCA Database
1.4-DB1.4-dichlorobenzene

References

  1. European Commission. Common Agricultural Policy (CAP). Sustainable Agriculture in the Common Agricultural Policy. 2021. Available online: https://ec.europa.eu/info/food-farming-fisheries/sustainability/sustainable-cap_en/ (accessed on 24 January 2021).
  2. European Commission (EC). From Farm to Fork: Our food, Our Health, Our Planet, Our Future. 2021. Available online: https://ec.europa.eu/info/strategy/priorities-2019–2024/european-green-deal/actions-being-taken-eu/farm-fork_en/ (accessed on 24 January 2021).
  3. Sanz-Cobena, A.; Lassaletta, L.; Aguilera, E.; del Prado, A.; Garnier, J.; Billen, G.; Iglesias, A.; Sánchez, B.; Guardia, G.; Abalos, D.; et al. Strategies for Greenhouse Gas Emissions Mitigation in Mediterranean Agriculture: A Review. Agric. Ecosyst. Environ. 2017, 238, 5–24. [Google Scholar] [CrossRef] [Green Version]
  4. Neugschwandtner, R.W.; Kaul, H.-P. Nitrogen Uptake, Use and Utilization Efficiency by Oat–Pea Intercrops. Field Crops Res. 2015, 179, 113–119. [Google Scholar] [CrossRef]
  5. Pelzer, E.; Bazot, M.; Makowski, D.; Corre-Hellou, G.; Naudin, C.; Al Rifaï, M.; Baranger, E.; Bedoussac, L.; Biarnès, V.; Boucheny, P.; et al. Pea–Wheat Intercrops in Low-Input Conditions Combine High Economic Performances and Low Environmental Impacts. Eur. J. Agron. 2012, 40, 39–53. [Google Scholar] [CrossRef]
  6. Moudrý, J.; Bernas, J.; Moudrý, J.; Konvalina, P.; Ujj, A.; Manolov, I.; Stoeva, A.; Rembialkowska, E.; Stalenga, J.; Toncea, I.; et al. Agroecology Development in Eastern Europe—Cases in Czech Republic, Bulgaria, Hungary, Poland, Romania, and Slovakia. Sustainability 2018, 10, 1311. [Google Scholar] [CrossRef] [Green Version]
  7. Ghaley, B.B.; Hauggaard-Nielsen, H.; Høgh-Jensen, H.; Jensen, E.S. Intercropping of Wheat and Pea as Influenced by Nitrogen Fertilization. Nutr. Cycl. Agroecosystems 2005, 73, 201–212. [Google Scholar] [CrossRef]
  8. Mohler, C.L.; Stoner, K.A. Guidelines for Intercropping. In Crop Rotation on Organic Farms: A Planning Manual, NRAES 177; Mohler, C.L., Johnson, S.E., Eds.; NRAES: New York, NY, USA, 2009; pp. 95–101. [Google Scholar]
  9. Neugschwandtner, R.W.; Kaul, H.-P. Sowing Ratio and N Fertilization Affect Yield and Yield Components of Oat and Pea in Intercrops. Field Crops Res. 2014, 155, 159–163. [Google Scholar] [CrossRef]
  10. Neugschwandtner, R.W.; Kaul, H.-P. Concentrations and Uptake of Macronutrients by Oat and Pea in Intercrops in Response to N Fertilization and Sowing Ratio. Arch. Agron. Soil Sci. 2016, 62, 1236–1249. [Google Scholar] [CrossRef]
  11. Neugschwandtner, R.W.; Kaul, H.-P. Concentrations and Uptake of Micronutrients by Oat and Pea in Intercrops in Response to N Fertilization and Sowing Ratio: Konzentrationen Und Aufnahme von Mikronährstoffen Durch Hafer Und Erbse in Gemengen in Abhängigkeit Der N-Düngung Und Des Mischungsverhältnisses. Die Bodenkult. J. Land Manag. Food Environ. 2016, 67, 1–15. [Google Scholar] [CrossRef] [Green Version]
  12. Neugschwandtner, R.W.; Kaul, H.-P.; Moitzi, G.; Klimek-Kopyra, A.; Lošák, T.; Wagentristl, H. A Low Nitrogen Fertiliser Rate in Oat–Pea Intercrops Does Not Impair N2 Fixation. Acta Agric. Scand. Sect. B—Soil Plant Sci. 2021, 71, 182–190. [Google Scholar] [CrossRef]
  13. Dijkman, T.J.; Basset-Mens, C.; Antón, A.; Núñez, M. LCA of Food and Agriculture. In Life Cycle Assessment; Hauschild, M.Z., Rosenbaum, R.K., Olsen, S.I., Eds.; Springer: Cham, Switzerland, 2018; pp. 723–754. ISBN 978-3-319-56474-6. [Google Scholar]
  14. Roy, P.; Nei, D.; Orikasa, T.; Xu, Q.; Okadome, H.; Nakamura, N.; Shiina, T. A Review of Life Cycle Assessment (LCA) on Some Food Products. J. Food Eng. 2009, 90, 1–10. [Google Scholar] [CrossRef]
  15. Naudin, C.; van der Werf, H.M.G.; Jeuffroy, M.-H.; Corre-Hellou, G. Life Cycle Assessment Applied to Pea-Wheat Intercrops: A New Method for Handling the Impacts of Co-Products. J. Clean. Prod. 2014, 73, 80–87. [Google Scholar] [CrossRef]
  16. Wernet, G.; Bauer, C.; Steubing, B.; Reinhard, J.; Moreno-Ruiz, E.; Weidema, B. The Ecoinvent Database Version 3 (Part I): Overview and Methodology. Int. J. Life Cycle Assess. 2016, 21, 1218–1230. [Google Scholar] [CrossRef]
  17. Durlinger, B.; Koukouna, E.; Broekema, R.; Van Paassen, M.; Scholten, J. Agri-Footprint 4.0-Part 1: Methodology and Basic Principles; Agri-Footprint: Gouda, The Netherlands, 2017; 52p. [Google Scholar]
  18. Nemecek, T.; Bengoa, X.; Lansche, J.; Roesch, A.; Faist-Emmenegger, M.; Rossi, V.; Humbert, S. Methodological Guidelines for the Life Cycle Inventory of Agricultural Products. Version 3.5. December 2019. World Food LCA Database (WFLDB); Quantis and Agroscope: Lausanne and Zurich, Switzerland, 2019; 88p. [Google Scholar]
  19. ISO. ISO 14040—Environmental Management–Life Cycle Assessment–Principles and Framework; International Organization for Standardization: Geneva, Switzerland, 2006. [Google Scholar]
  20. ISO. ISO 14044—Environmental Management–Life Cycle Assessment–Requirements and Guidelines; International Organization for Standardization: Geneva, Switzerland, 2006. [Google Scholar]
  21. Nemecek, T.; Kägi, T. Life Cycle Inventories of Swiss and European Agricultural Production Systems. Final Report Ecoinvent V2.0 No. 15a. In Agroscope Reckenholz-Taenikon Research Station ART, 1st ed.; Swiss Centre for Life Cycle Inventories: Zürich, Switzerland, 2007; 360p. [Google Scholar]
  22. Hauschild, M.Z.; Olsen, S.I.; Rosenbaum, R.K. Life Cycle Assessment: Theory and Practice, 1st ed.; Springer: Cham, Switzerland, 2018; ISBN 978-3-319-56475-3. [Google Scholar]
  23. Hakl, J.; Brant, V.; Mášková, K.; Neckář, K.; Pivec, J. The forage utilization of winter pea-cereal mixture in agriculture low-input system. Acta Univ. Agric. Silvic. Mendel. Brun. 2014, 59, 47–52. [Google Scholar] [CrossRef] [Green Version]
  24. Kumar, K.; Goh, K.M. Biological Nitrogen Fixation, Accumulation of Soil Nitrogen and Nitrogen Balance for White Clover (Trifolium repens L.) and Field Pea (Pisum sativum L.) Grown for Seed. Field Crops Res. 2000, 68, 49–59. [Google Scholar] [CrossRef]
  25. Saget, S.; Costa, M.; Barilli, E.; de Vasconcelos, M.W.; Santos, C.S.; Styles, D.; Williams, M. Substituting Wheat with Chickpea Flour in Pasta Production Delivers More Nutrition at a Lower Environmental Cost. Sustain. Prod. Consum. 2020, 24, 26–38. [Google Scholar] [CrossRef]
  26. Monti, M.; Pellicanò, A.; Santonoceto, C.; Preiti, G.; Pristeri, A. Yield Components and Nitrogen Use in Cereal-Pea Intercrops in Mediterranean Environment. Field Crops Res. 2016, 196, 379–388. [Google Scholar] [CrossRef]
  27. Bernas, J.; Konvalina, P.; Burghila, D.V.; Teodorescu, R.I.; Bucur, D. The Energy and Environmental Potential of Waste from the Processing of Hulled Wheat Species. Agriculture 2020, 10, 592. [Google Scholar] [CrossRef]
  28. Bernas, J.; Bernasová, T.; Gerstberger, P.; Moudrý, J.; Konvalina, P.; Moudrý, J. Cup Plant, an Alternative to Conventional Silage from a LCA Perspective. Int. J. Life Cycle Assess. 2021, 26, 311–326. [Google Scholar] [CrossRef]
  29. Mosier, A.; Kroeze, C.; Nevison, C.; Oenema, O.; Seitzinger, S.; van Cleemput, O. Closing the Global N2O Budget: Nitrous Oxide Emissions through the Agricultural Nitrogen Cycle. Nutr. Cycl. Agroecosystems 1998, 52, 225–248. [Google Scholar] [CrossRef]
  30. Bos, J.F.F.P.; de Haan, J.; Sukkel, W.; Schils, R.L.M. Energy Use and Greenhouse Gas Emissions in Organic and Conventional Farming Systems in the Netherlands. NJAS Wagening. J. Life Sci. 2014, 68, 61–70. [Google Scholar] [CrossRef] [Green Version]
  31. Jelínková, Z.; Moudrý, J.; Bernas, J.; Kopecký, M.; Moudrý, J.; Konvalina, P. Environmental and Economic Aspects of Triticum aestivum L. and Avena sativa Growing. Open Life Sci. 2016, 11, 533–541. [Google Scholar] [CrossRef] [Green Version]
  32. Pauer, E.; Wohner, B.; Tacker, M. The Influence of Database Selection on Environmental Impact Results. Life Cycle Assessment of Packaging Using GaBi, Ecoinvent 3.6, and the Environmental Footprint Database. Sustainability 2020, 12, 9948. [Google Scholar] [CrossRef]
  33. Veselá, T.; Nedbal, V.; Brom, J. Detection of pesticide in a small agricultural basin after 15 years of application ban. Int. Multidiscip. Sci. Geoconf. SGEM 2020, 20, 75–82. [Google Scholar] [CrossRef]
  34. Margni, M.; Rossier, D.; Crettaz, P.; Jolliet, O. Life Cycle Impact Assessment of Pesticides on Human Health and Ecosystems. Agric. Ecosyst. Environ. 2002, 93, 379–392. [Google Scholar] [CrossRef]
  35. Bessou, C.; Basset-Mens, C.; Tran, T.; Benoist, A. LCA Applied to Perennial Cropping Systems: A Review Focused on the Farm Stage. Int. J. Life Cycle Assess. 2013, 18, 340–361. [Google Scholar] [CrossRef] [Green Version]
  36. Birkved, M.; Hauschild, M.Z. PestLCI—A Model for Estimating Field Emissions of Pesticides in Agricultural LCA. Ecol. Model. 2006, 198, 433–451. [Google Scholar] [CrossRef]
  37. Erstfeld, K.M. Environmental Fate of Synthetic Pyrethroids during Spray Drift and Field Runoff Treatments in Aquatic Microcosms. Chemosphere 1999, 39, 1737–1769. [Google Scholar] [CrossRef]
  38. Sudakin, D.L. Pyrethroid Insecticides: Advances and Challenges in Biomonitoring. Clin. Toxicol. 2006, 44, 31–37. [Google Scholar] [CrossRef] [PubMed]
  39. Bernas, J.; Konvalina, P.; Brom, J.; Moudrý, J.; Veselá, T.; Bucur, D.; Dirja, M.; Shim, S. Assessment and Protection of Water Resources in the Czech Republic; Zeleňáková, M., Fialová, J., Negm, A., Eds.; Springer: Cham, Switzerland, 2020; ISBN 978-3-030-18362-2. [Google Scholar]
  40. Eggleston, S.; Buendia, L.; Miwa, K.; Ngara, T.; Tanabe, K. IPCC Guidelines for National Greenhouse Gas Inventories, Volume 4: Agriculture, Forestryand Other Land Use. 2006. Available online: https://www.ipcc-nggip.iges.or.jp/public/2006gl/vol4.html (accessed on 15 October 2021).
  41. Gentil, C.; Basset-Mens, C.; Manteaux, S.; Mottes, C.; Maillard, E.; Biard, Y.; Fantke, P. Coupling Pesticide Emission and Toxicity Characterization Models for LCA: Application to Open-Field Tomato Production in Martinique. J. Clean. Prod. 2020, 277, 124099. [Google Scholar] [CrossRef]
Figure 1. Trends of the environmental impact per 1 kg of grain N yield ha−1 (in %).C = Control; N60 = variant with input of 60 kg N ha−1; N120 = variant with input of 120 kg N ha−1; Sowing ratios of oat:pea (%:%): 100:0, 75:25, 50:50, 25:75, and 0:100; SimaPro 9.1.1.1 software; ReCiPe 2016 Midpoint (H) V1.05/World (2010) H; Cut-off System Model approach; Characterization model.
Agronomy 11 02433 g001
Figure 2. Trends of the environmental impact per 1 kg of grain N yield per ha−1; C = Control; N60 = variant with input of 60 kg N ha−1; N120 = variant with input of 120 kg N ha−1; Sowing ratios of oat:pea (%:%): 100:0, 75:25, 50:50, 25:75, and 0:100; SimaPro 9.1.1.1 software; ReCiPe 2016 Midpoint (H) V1.05/World (2010) H; Cut-off System Model approach; Normalization model.
Agronomy 11 02433 g002
Figure 3. Trends of the environmental impact per land demand for generating the same grain N yield–(in %); C = Control; N60 = variant with input of 60 kg N ha−1; N120 = variant with input of 120 kg N ha−1; Sowing ratios of oat:pea (%:%): 100:0, 75:25, 50:50, 25:75, and 0:100; SimaPro 9.1.1.1 software; ReCiPe 2016 Midpoint (H) V1.05/World (2010) H; Cut-off System Model approach; Characterization model.
Agronomy 11 02433 g003
Figure 4. Trends of the environmental impact per land demand for generating the same grain N yield; C = Control; N60 = variant with input of 60 kg N ha−1; N120 = variant with input of 120 kg N ha−1; Sowing ratios of oat:pea (%:%): 100:0, 75:25, 50:50, 25:75, and 0:100; SimaPro 9.1.1.1 software; ReCiPe 2016 Midpoint (H) V1.05/World (2010) H; Cut-off System Model approach; Normalization model.
Agronomy 11 02433 g004
Figure 5. Trends of the environmental impact (the combination of the unit of production; grain N yield respectively, and the unit of area; land demand for generating the same N yield, respectively); C = Control; N60 = variant with input of 60 kg N ha−1; N120 = variant with input of 120 kg N ha−1; Sowing ratios of oat:pea (%:%): 100:0, 75:25, 50:50, 25:75, and 0:100; Based on Normalization model; ReCiPe 2016 Endpoint (H) V1.05/World (2010) H/Official; Endpoint category: Resources, Ecosystems, Human health.
Agronomy 11 02433 g005
Table 1. Inventory table: inputs and outputs of the life cycle.
UnitOat:Pea (100:0)Oat:Pea (75:25)Oat:Pea (50:50)Oat:Pea (25:75)Oat:Pea (0:100)
C/N60/N120C/N60/N120C/N60/N120C/N60/N120C/N60/N120
Outputs
Grain yieldkg ha−14281/5211/57524354/5284/43424582/4400/46474064/4707/45045165/5823/5721
Grain N yieldkg ha−181.6/111.5/135.493.0/119.6/110.9116.3/106.6/114.1112.8/126.4/133.4187.2/210.2/218.9
Residue N yieldkg ha−128.5/44.9/59.635.4/44.6/89.245.4/62.1/69.254.3/65.1/80.854.4/72.8/70.7
Land demand for generating the same grain N yield #ha2.68/1.96/1.622.36/1.83/1.971.88/2.05/1.921.94/1.73/1.641.17/1.04/1.00
Inputs from technosphere
Nitrogen (calcium ammonium nitrate, 27% N) *kg ha−10/60/1200/60/1200/60/1200/60/1200/60/120
Application of plant protection products by field sprayer *ha11111
Combine harvesting *ha11111
Fertilization by broadcaster *ha-/2/2-/2/2-/2/2-/2/2-/2/2
Insecticide at plant (pyrethroid-compound) *g ha−17575757575
Oat seed for sowing *kg ha−11209060300
Pea seed for sowing *kg ha−1052.5105157.5210
Tillage, harrowing, by spring tine harrow *ha11111
Tillage, cultivating, chiselling/by disk harrow *ha11111
Sowing *ha1111-
Transport, tractor, and trailer, agricultural *tkm21.4/26.1/28.821.8/26.4/21.722.9/22.0/23.220.3/23.5/22.525.8/29.1/28.6
Tillage, currying, by weeder *ha11111
Land use change (annual or perennial crop) *ha11111
Inputs from nature
Land occupation *ha11111
Water (as a medium for plant protection products)L ha−1300300300300300
Emissions to air
Dinitrogen monoxide (direct and indirect)kg ha−1-/2.813/4.235-/2.813/4.235-/2.813/4.235-/2.813/4.235-/2.813/4.235
Ammonia (volatilization)kg ha−1-/1.2/2.4-/1.2/2.4-/1.2/2.4-/1.2/2.4-/1.2/2.4
Emissions to water
Nitrate (leaching)kg ha−1-/0.135/0.271-/0.135/0.271-/0.135/0.271-/0.135/0.271-/0.135/0.271
# Basis is the treatment with the highest grain N yield (100:0 N120); * Input/s from Ecoinvent, Agri-footprint or WFLDB database; C = Control; N60 = fertilization with 60 kg N ha−1; N120 = fertilization with 120 kg N ha−1; Sowing ratios of oat:pea (%:%): 100:0, 75:25, 50:50, 25:75, and 0:100; Transport was included in the process with a flat rate 5 km × yield achieved (max 8 tons per load); tkm = tonne-kilometre; application of fertilizers by broadcaster was done in two splits; based on a two-year field study, as an average values.
Table 2. Environmental Impact per 1 kg of grain N Yield ha−1.
Impact Category Oat:Pea (100:0)Oat:Pea (75:25)Oat:Pea (50:50)Oat:Pea (25:75)Oat:Pea (0:100)
Climate change (kg CO2eq)C5.194.523.643.562.51
N6012.3811.8411.5710.246.97
N12012.1111.8312.9611.188.27
Terrestrial acidification (g SO2eq)C22.1618.830.6114.189.75
N6024.9623.710.9720.1913.66
N12020.0419.420.8918.1113.34
Freshwater eutrophication (g P eq)C0.790.720.640.630.46
N600.940.950.980.900.64
N1200.750.770.910.810.63
Marine eutrophication (g N eq)C3.663.803.553.943.08
N602.973.353.763.762.85
N1202.552.913.643.532.90
Human toxicity (kg 1.4-DB eq)C5.694.823.793.602.49
N606.536.256.075.383.67
N1205.265.105.594.823.59
Terrestrial ecotoxicity (kg 1.4-DB eq)C11.9111.349.8910.427.83
N6013.9414.3715.0114.1710.24
N12011.2011.7713.8212.7110.00
Freshwater ecotoxicity (dkg 1.4-DB eq)C10.8410.128.689.006.70
N6012.7012.3812.2911.087.70
N12010.2110.1311.329.947.52
Water depletion (L)C15.637.248.565.257.8
N6040.157.073.781.165.8
N12032.246.767.872.764.3
Fossil depletion (kg oil eq)C1.050.920.750.740.52
N601.451.401.381.230.84
N1201.171.151.271.100.83
C = Control; N60 = fertilization with 60 kg N ha−1; N120 = fertilization with 120 kg N ha−1; Sowing ratios of oat:pea (%:%): 100:0, 75:25, 50:50, 25:75, and 0:100; ReCiPe 2016 Midpoint (H) V1.05/World (2010) H; Characterization model; eq = equivalent; 1.4-DB = 1.4-dichlorobenzene.
Table 3. Environmental impact per land demand for generating the same grain N yield.
Impact Category Oat:Pea (100:0)Oat:Pea (75:25)Oat:Pea (50:50)Oat:Pea (25:75)Oat:Pea (0:100)
Climate change (t CO2eq)C1.531.371.111.160.71
N603.793.564.003.392.05
N1203.824.664.563.912.40
Terrestrial acidification (kg SO2eq)C6.545.704.514.602.76
N607.657.127.946.694.02
N1206.337.657.446.343.86
Freshwater eutrophication (g P eq)C231.69219.02186.57204.26131.24
N60286.75284.05335.47298.72189.39
N120237.46304.80314.44283.01182.05
Marine eutrophication (kg N eq)C1.081.151.081.280.87
N600.911.011.301.250.84
N1200.801.151.281.240.84
Human toxicity (t 1.4-DB eq)C1.681.461.151.170.70
N602.001.882.101.781.08
N1201.662.011.971.691.04
Terrestrial ecotoxicity (t 1.4-DB eq)C3.513.433.013.382.21
N604.274.325.194.693.01
N1203.544.644.874.452.90
Freshwater ecotoxicity (kg 1.4-DB eq)C31.9830.6426.4129.2018.93
N6038.9337.2142.5136.7222.65
N12032.2439.9139.8534.7821.77
Water depletion (m3)C4.6011.2814.7421.1416.34
N6012.2917.1225.4926.8519.36
N12010.1718.4223.8825.4518.62
Fossil depletion (kg oil eq)C309.54278.56226.81238.41147.33
N60444.83420.78476.54407.49248.58
N120368.09452.05446.55386.14238.97
C = Control; N60 = fertilization with 60 kg N ha−1; N120 = fertilization with 120 kg N ha−1; Sowing ratios of oat:pea (%:%): 100:0, 75:25, 50:50, 25:75, and 0:100; ReCiPe 2016 Midpoint (H) V1.05/World (2010) H; Characterization model; eq = equivalent; 1.4-DB = 1.4-dichlorobenzene.
Publisher’s Note: MDPI stays neutral with regard to jurisdictional claims in published maps and institutional affiliations.

