
Elevated Fe and Mn Concentrations in Groundwater in the Songnen Plain, Northeast China, and the Factors and Mechanisms Involved


Abstract
:
1. Introduction
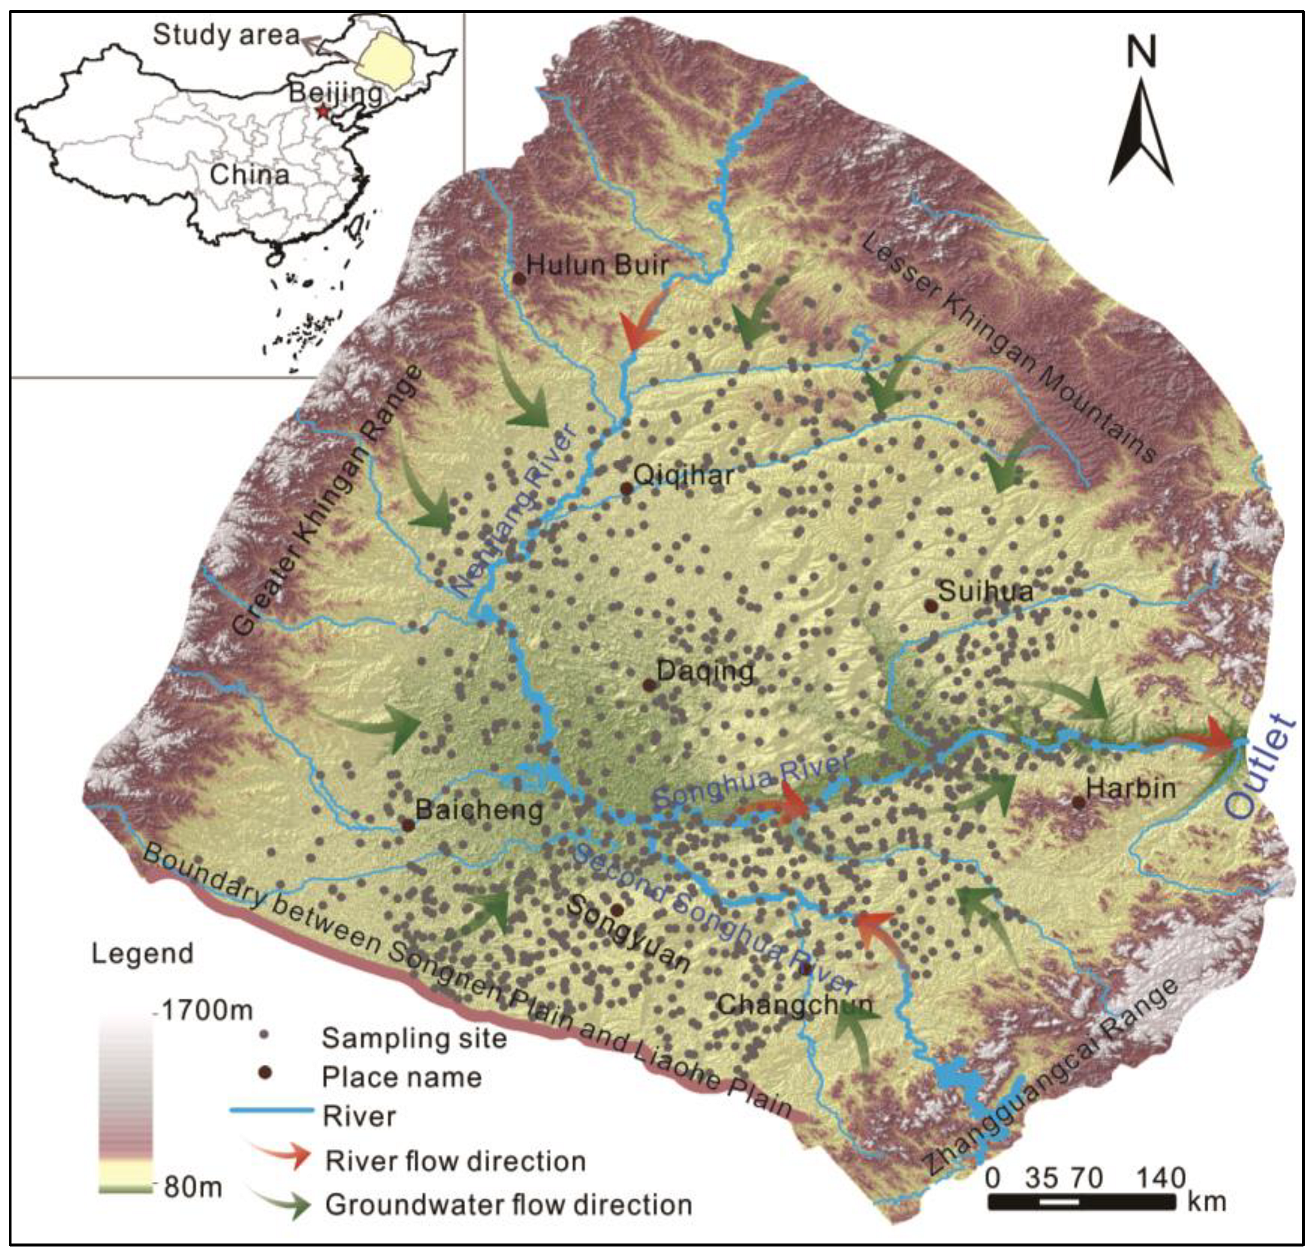
2. Study Area
3. Materials and Methods
3.1. Data Acquisition
3.2. Study Methods
4. Results and Discussion
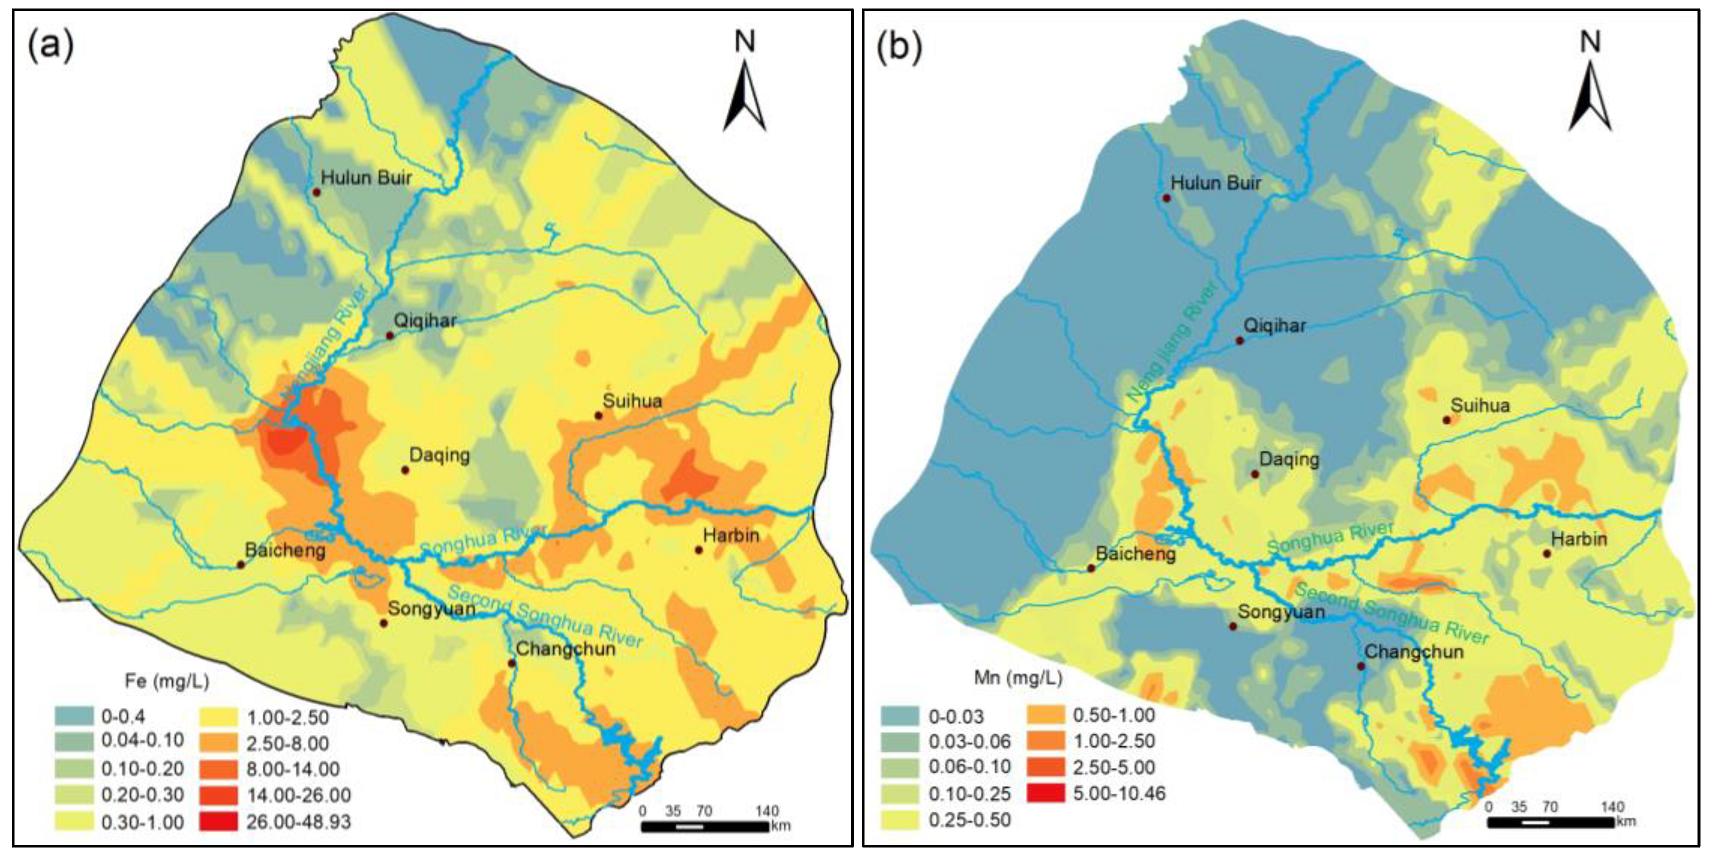
4.1. Distributions of Elevated Fe and Mn Concentrations
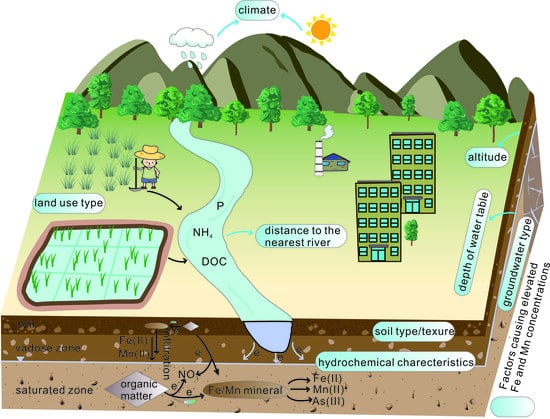
4.2. Factors Causing Elevated Fe and Mn Concentrations
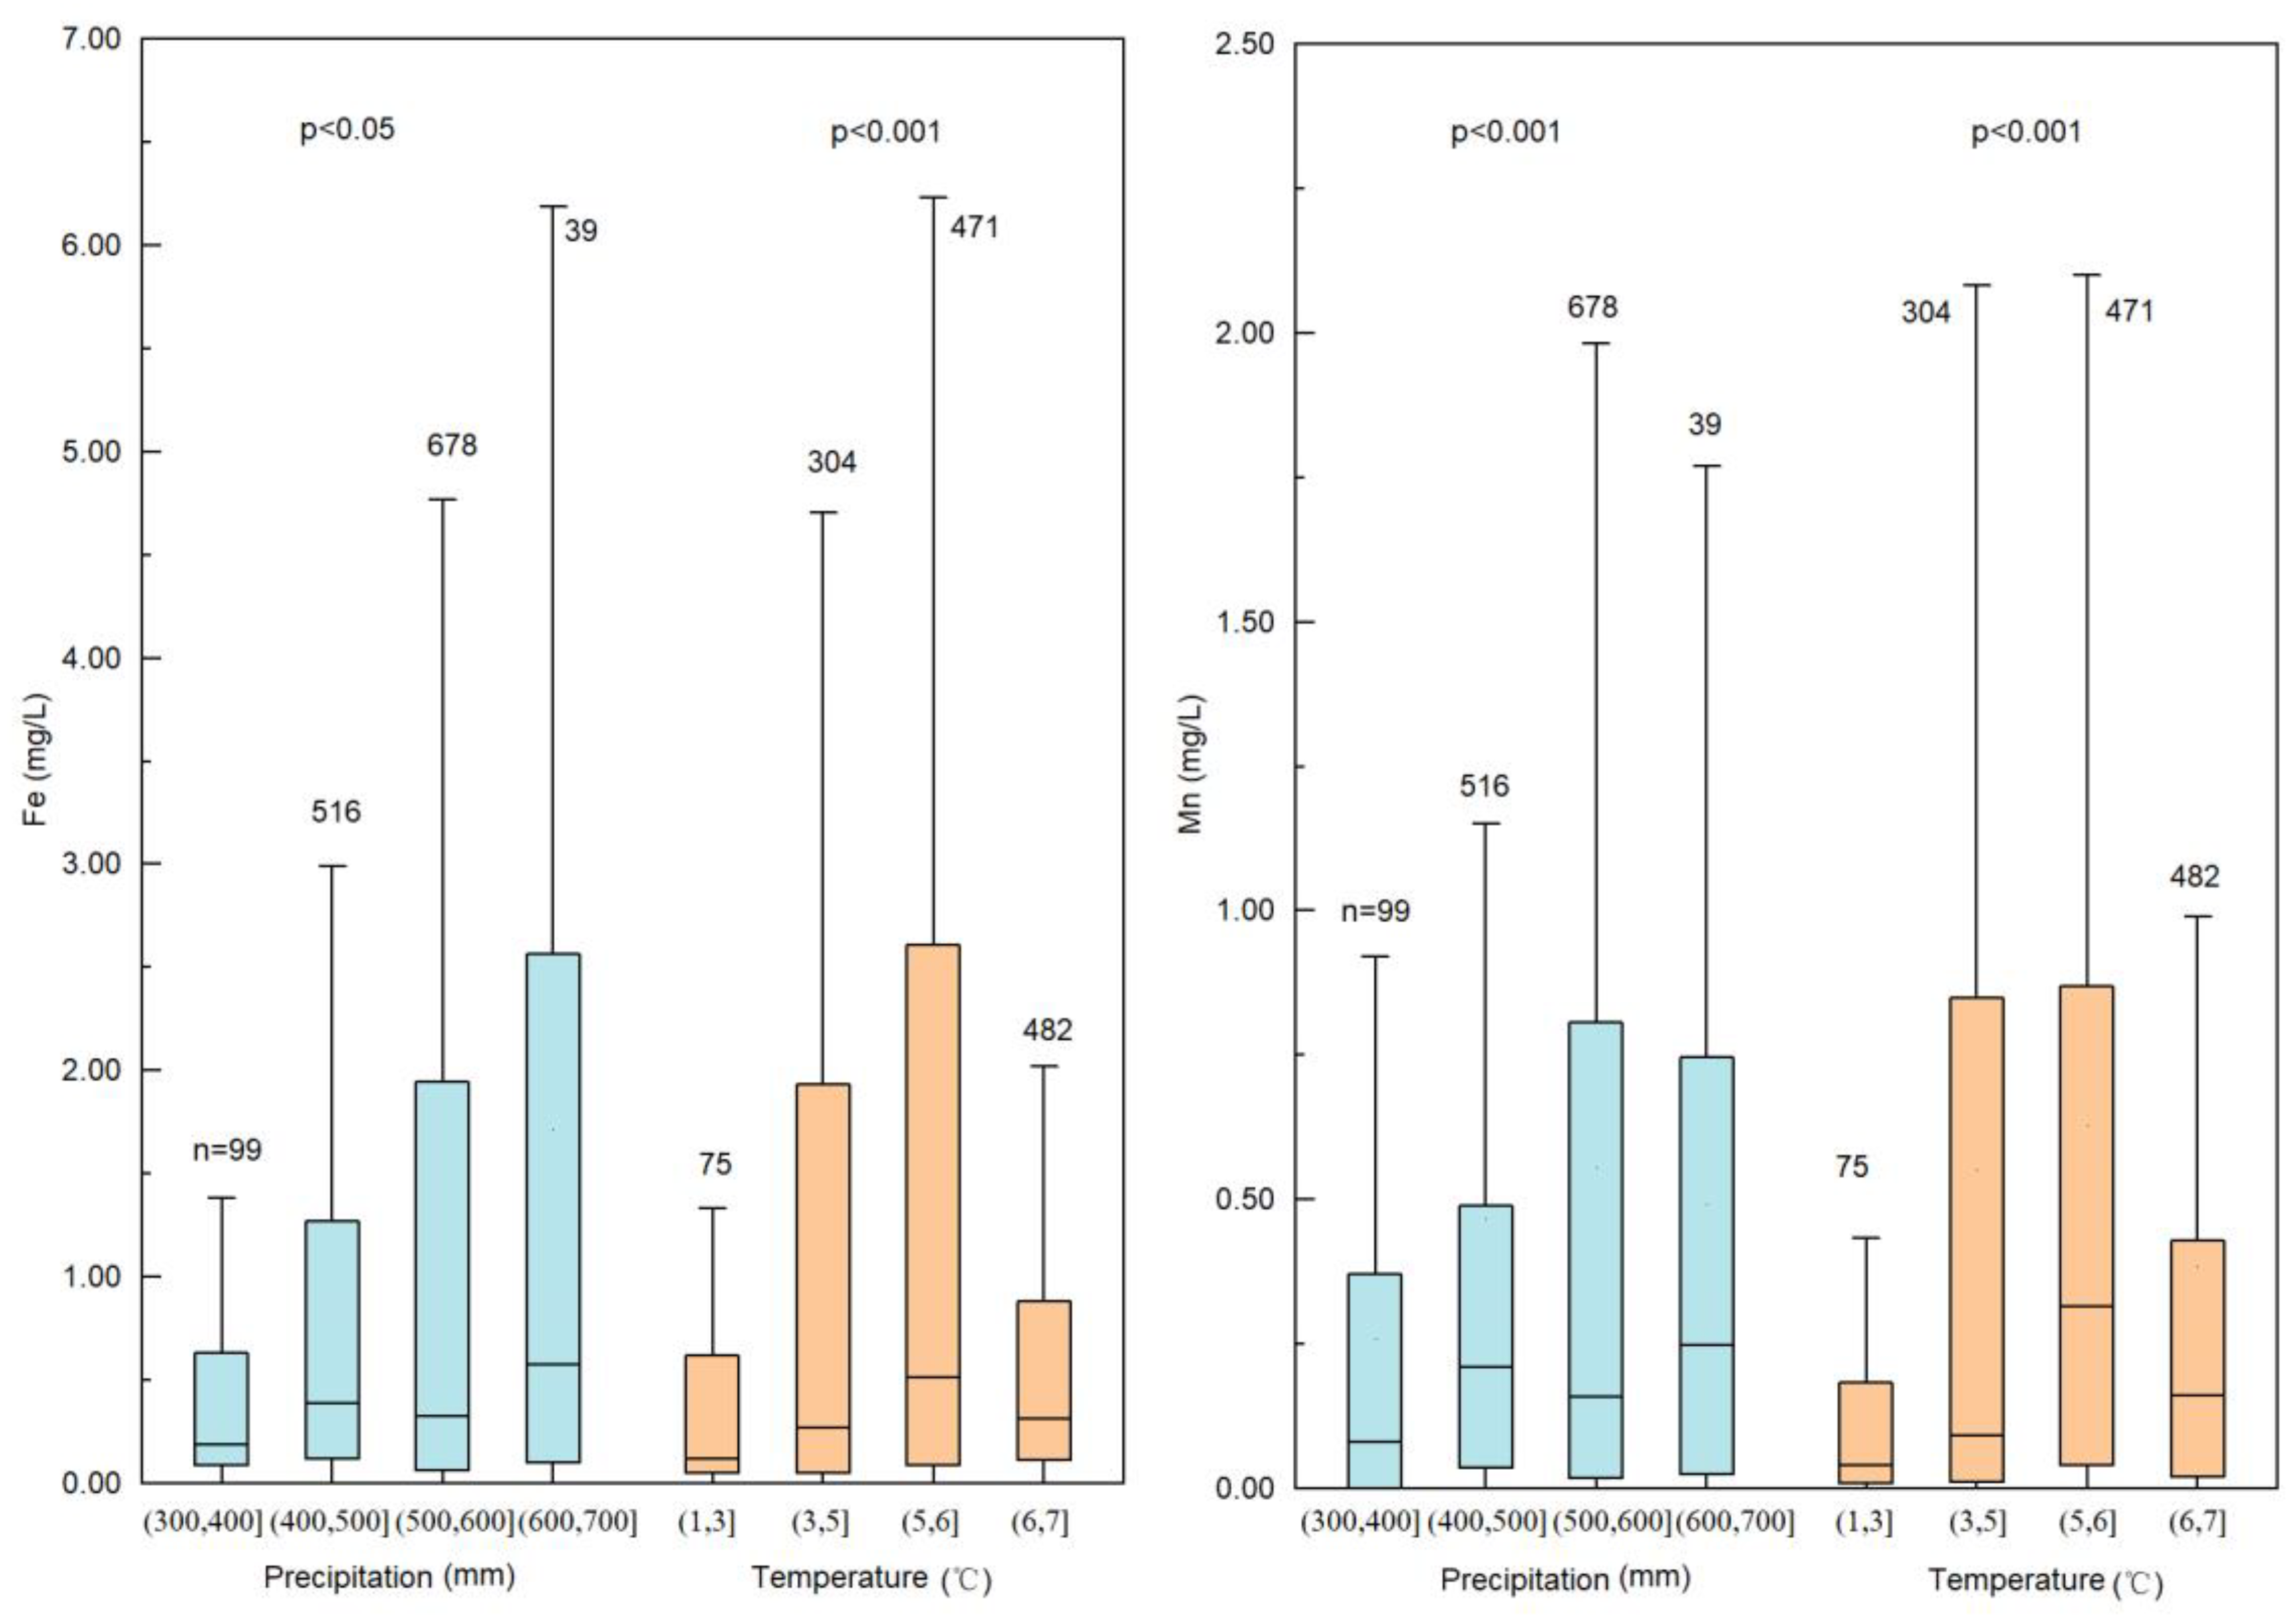
4.2.1. Effects of Climate
4.2.2. Effects of Surface Features
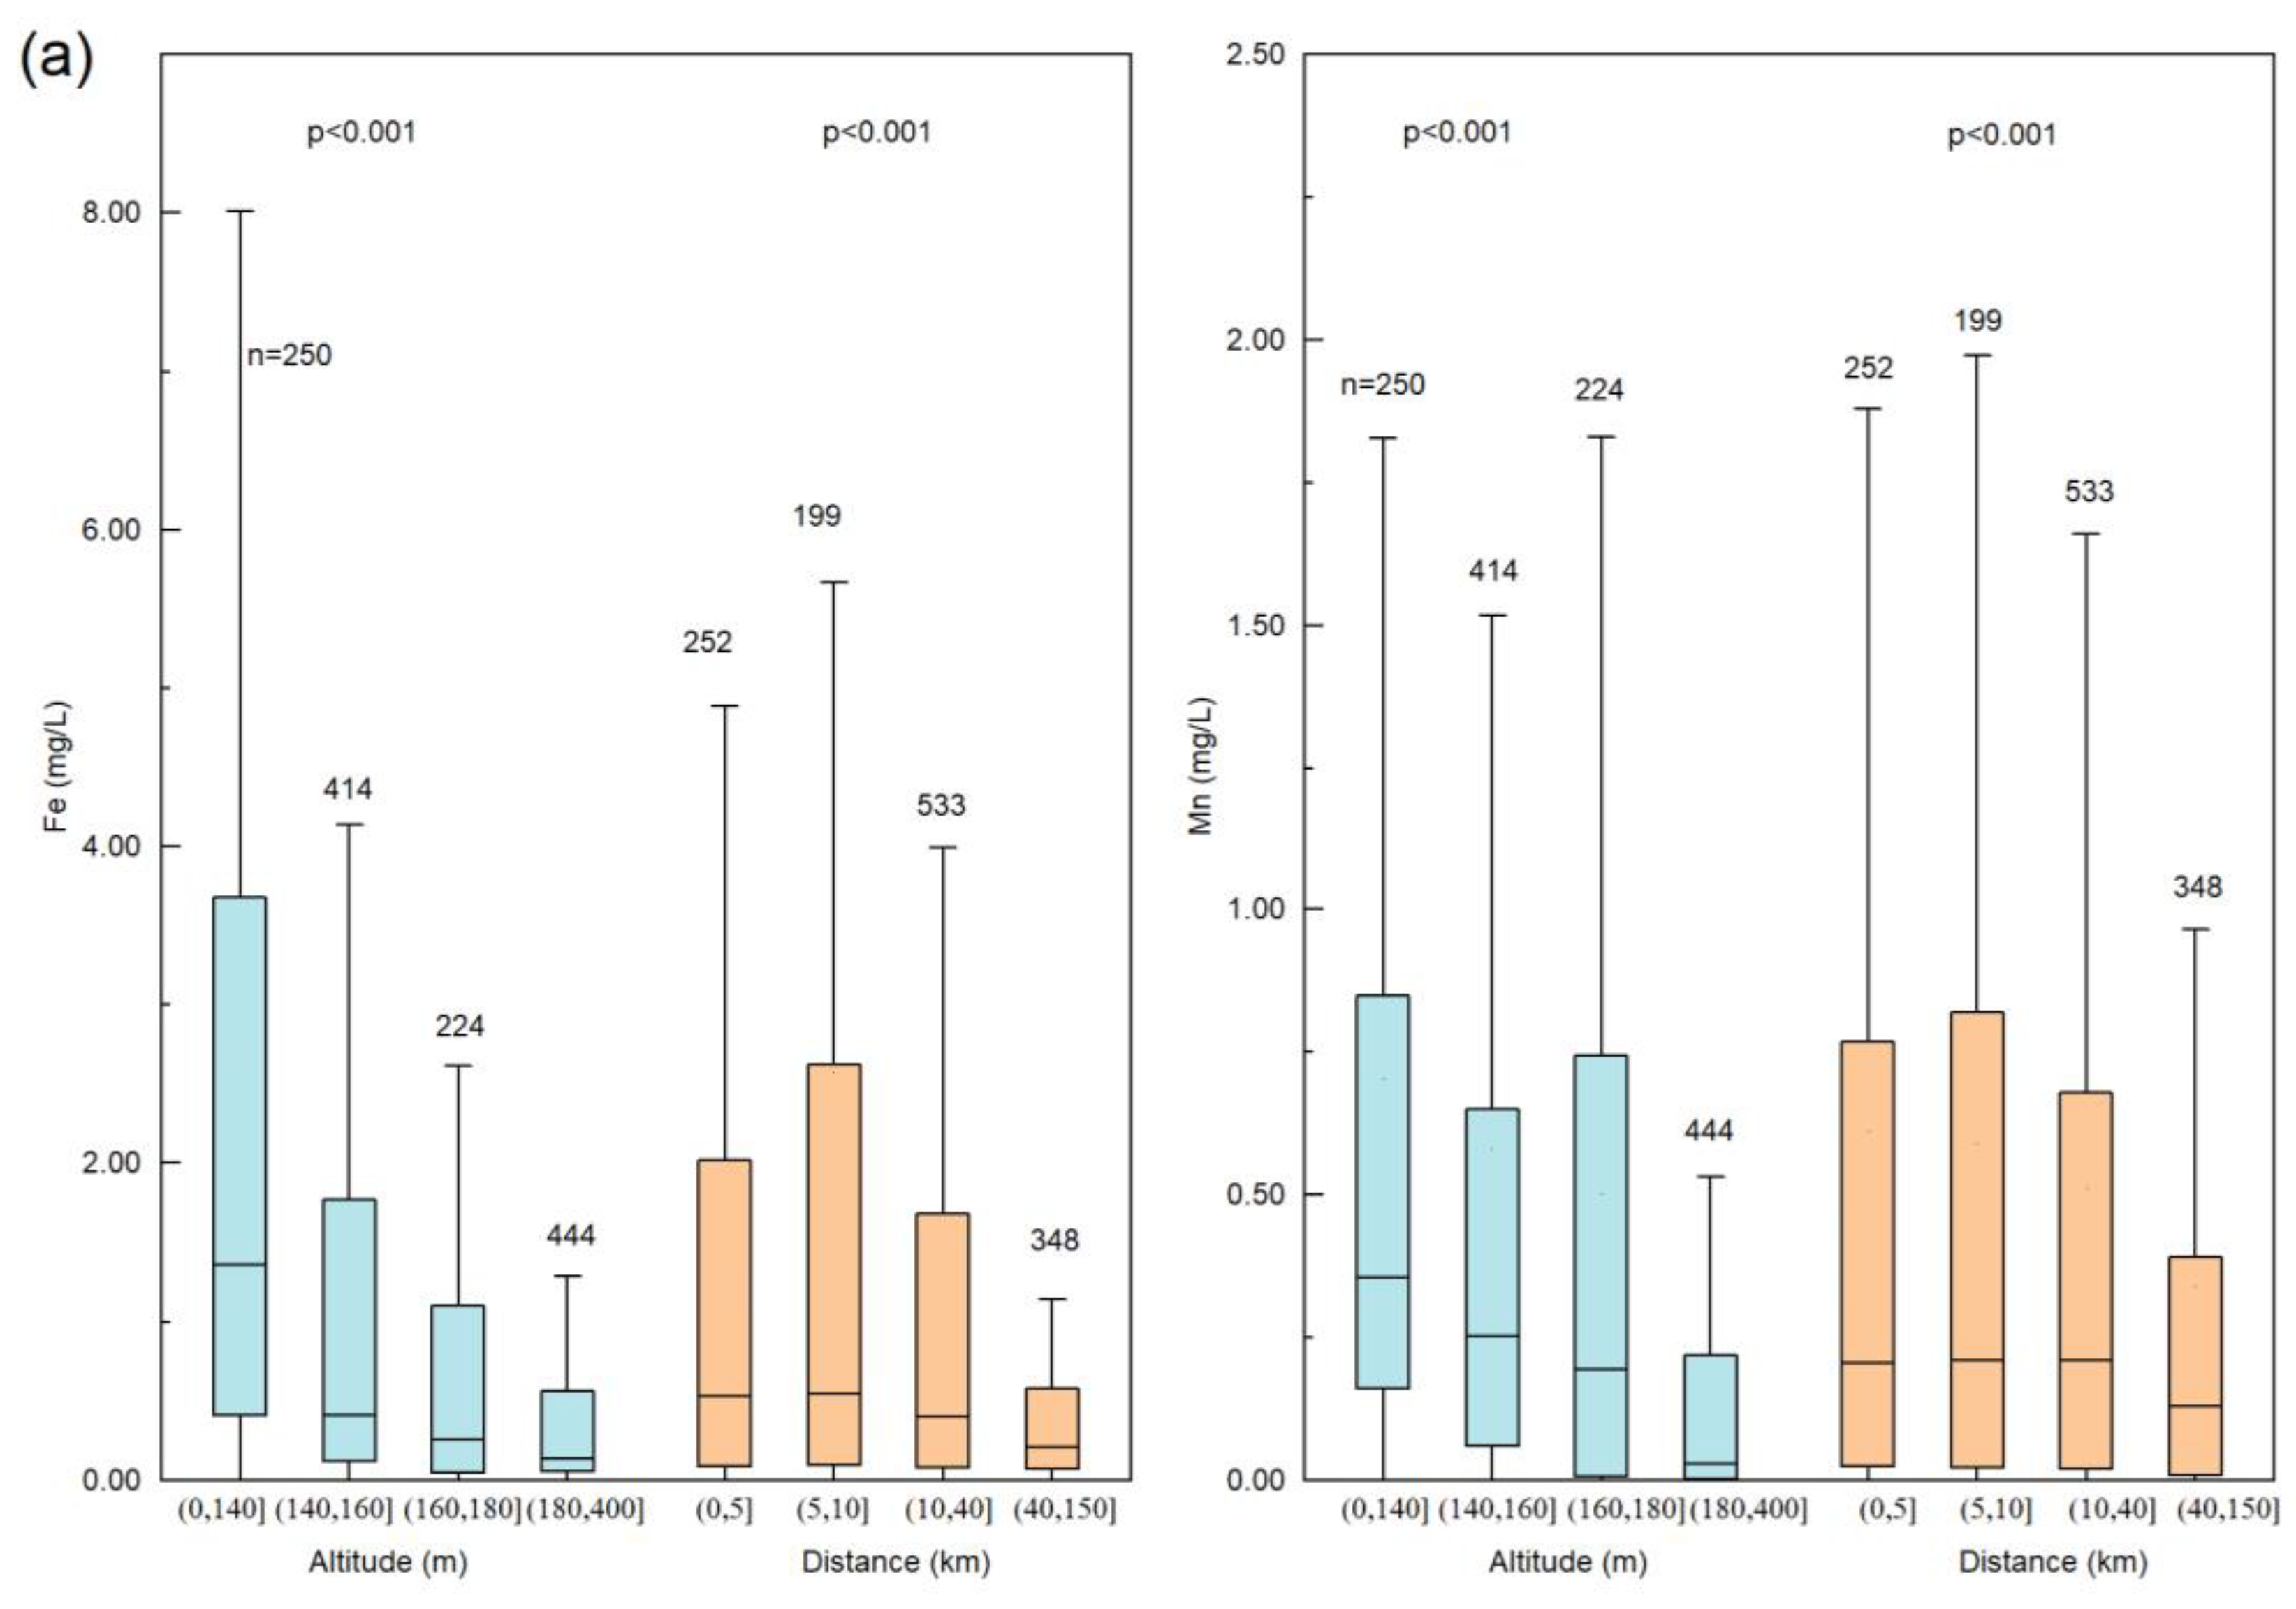
Altitude
Distance to the Nearest River
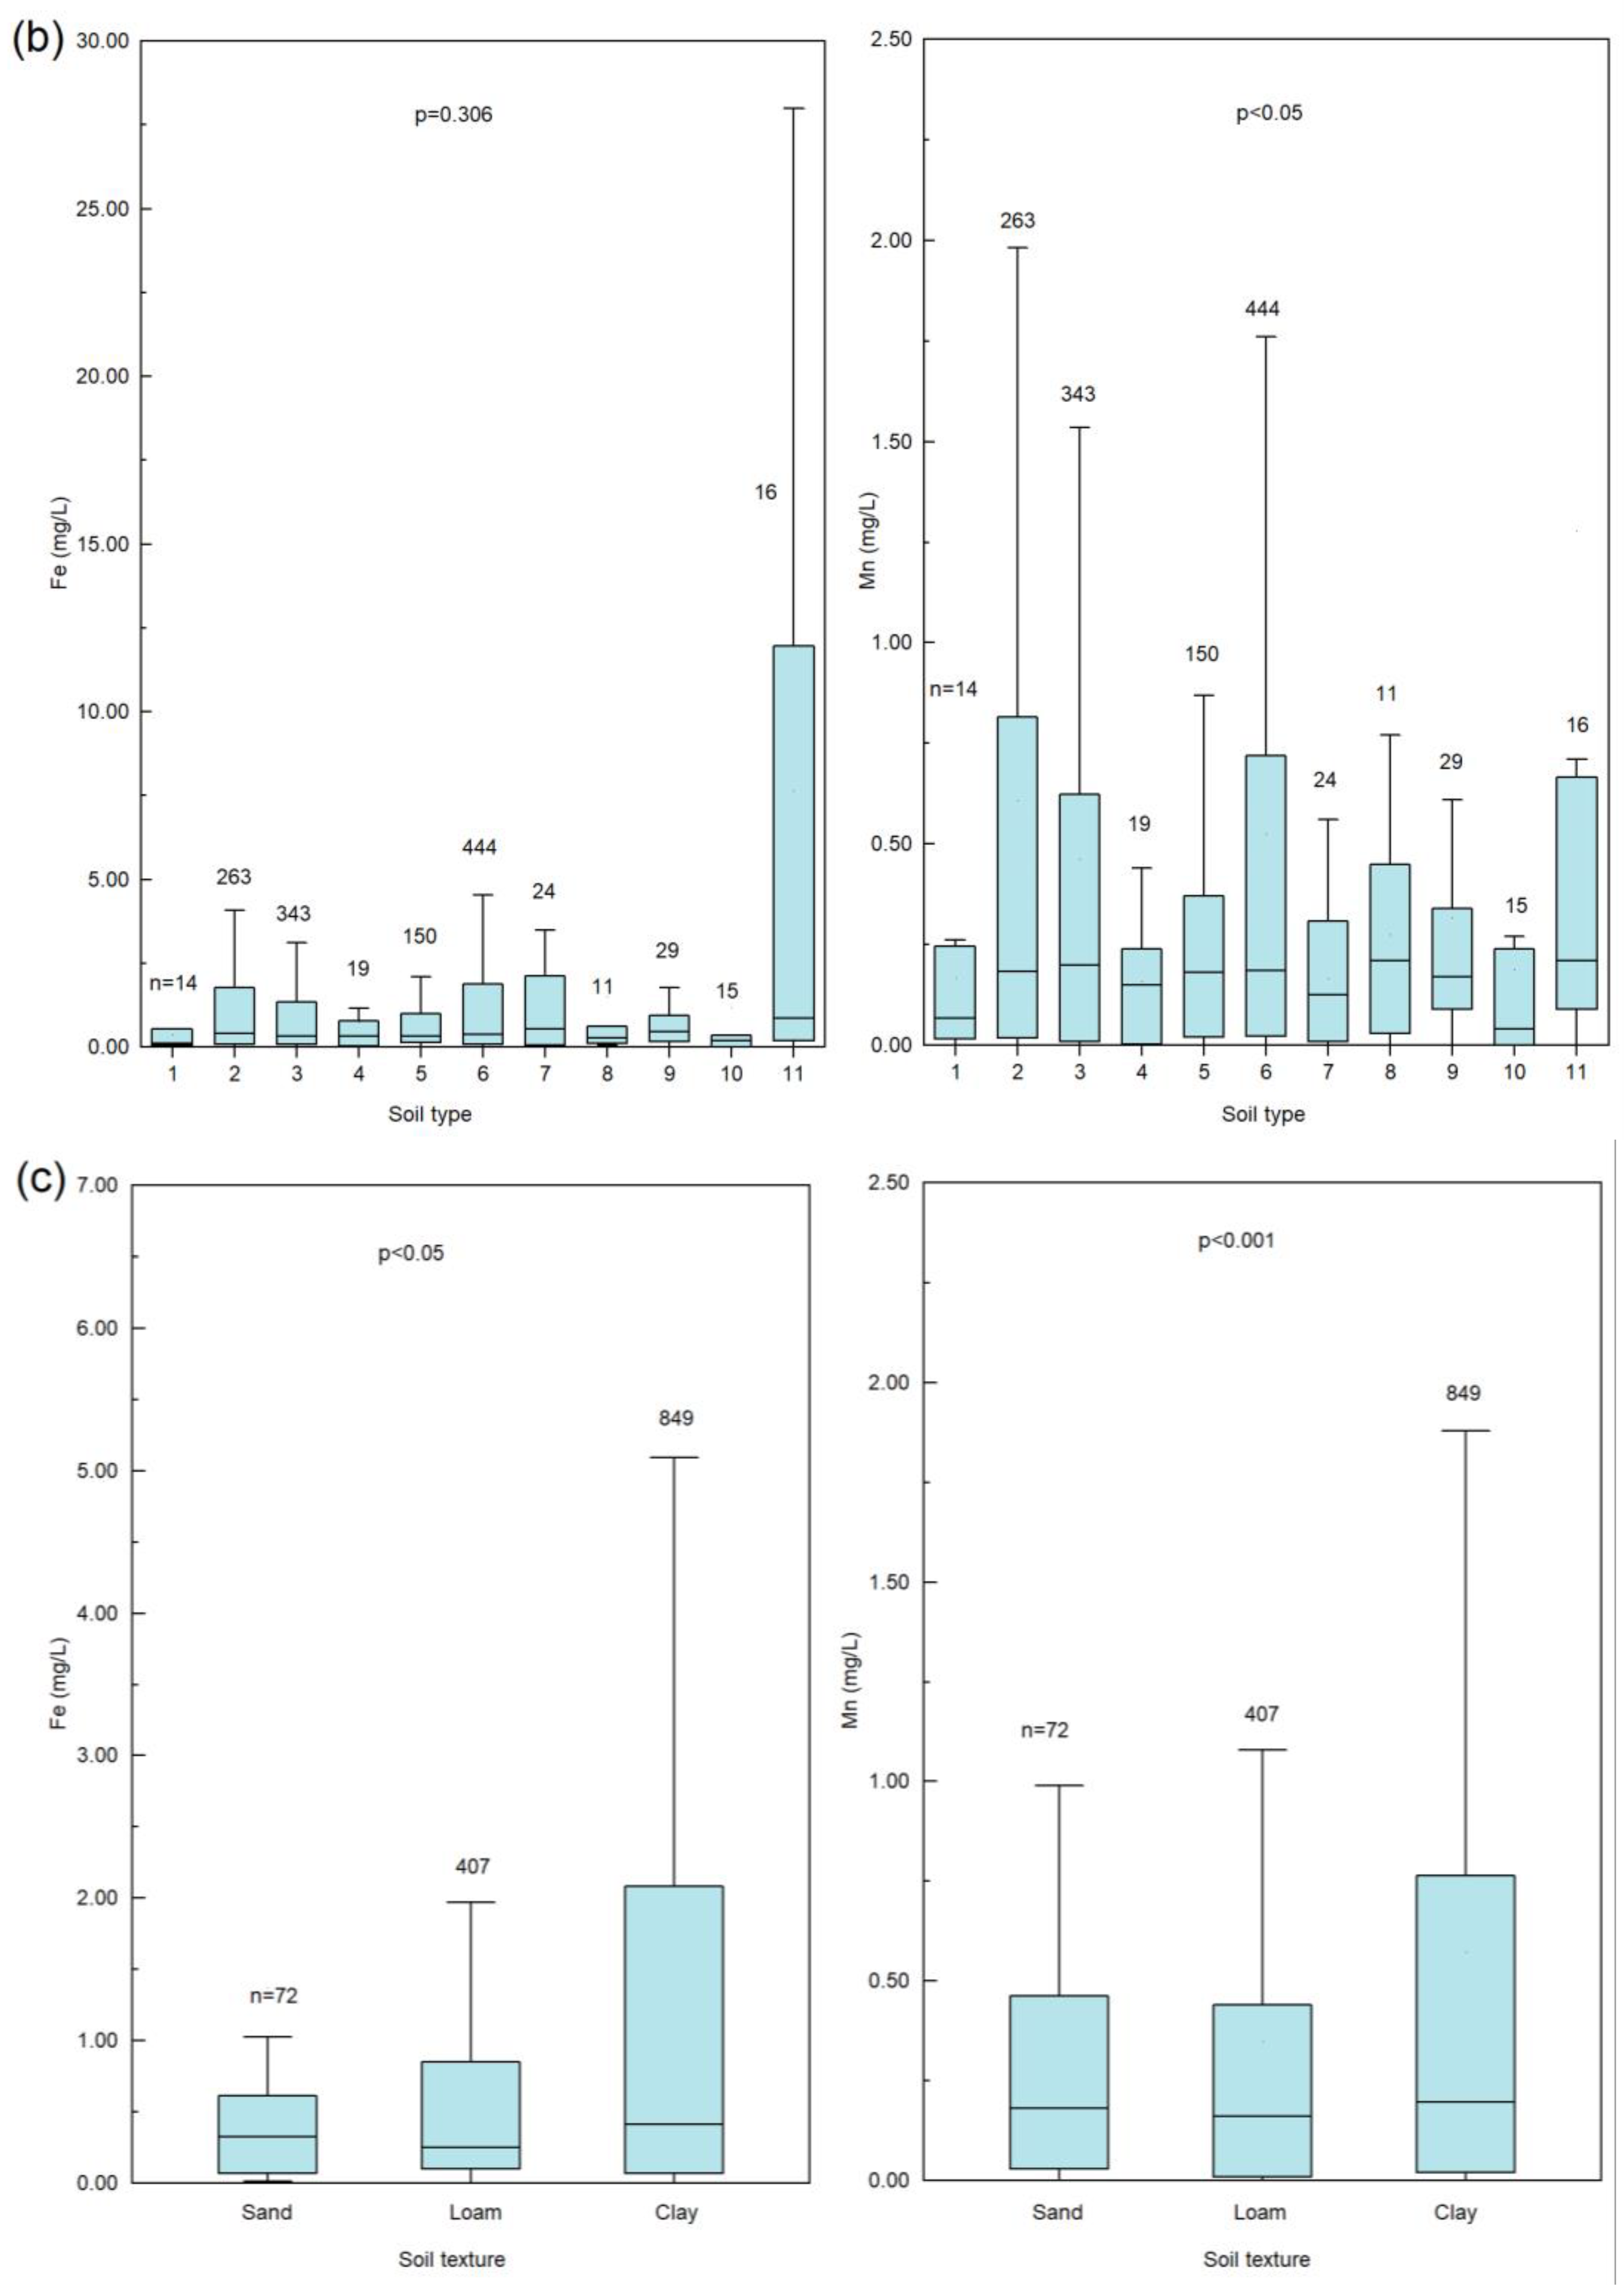
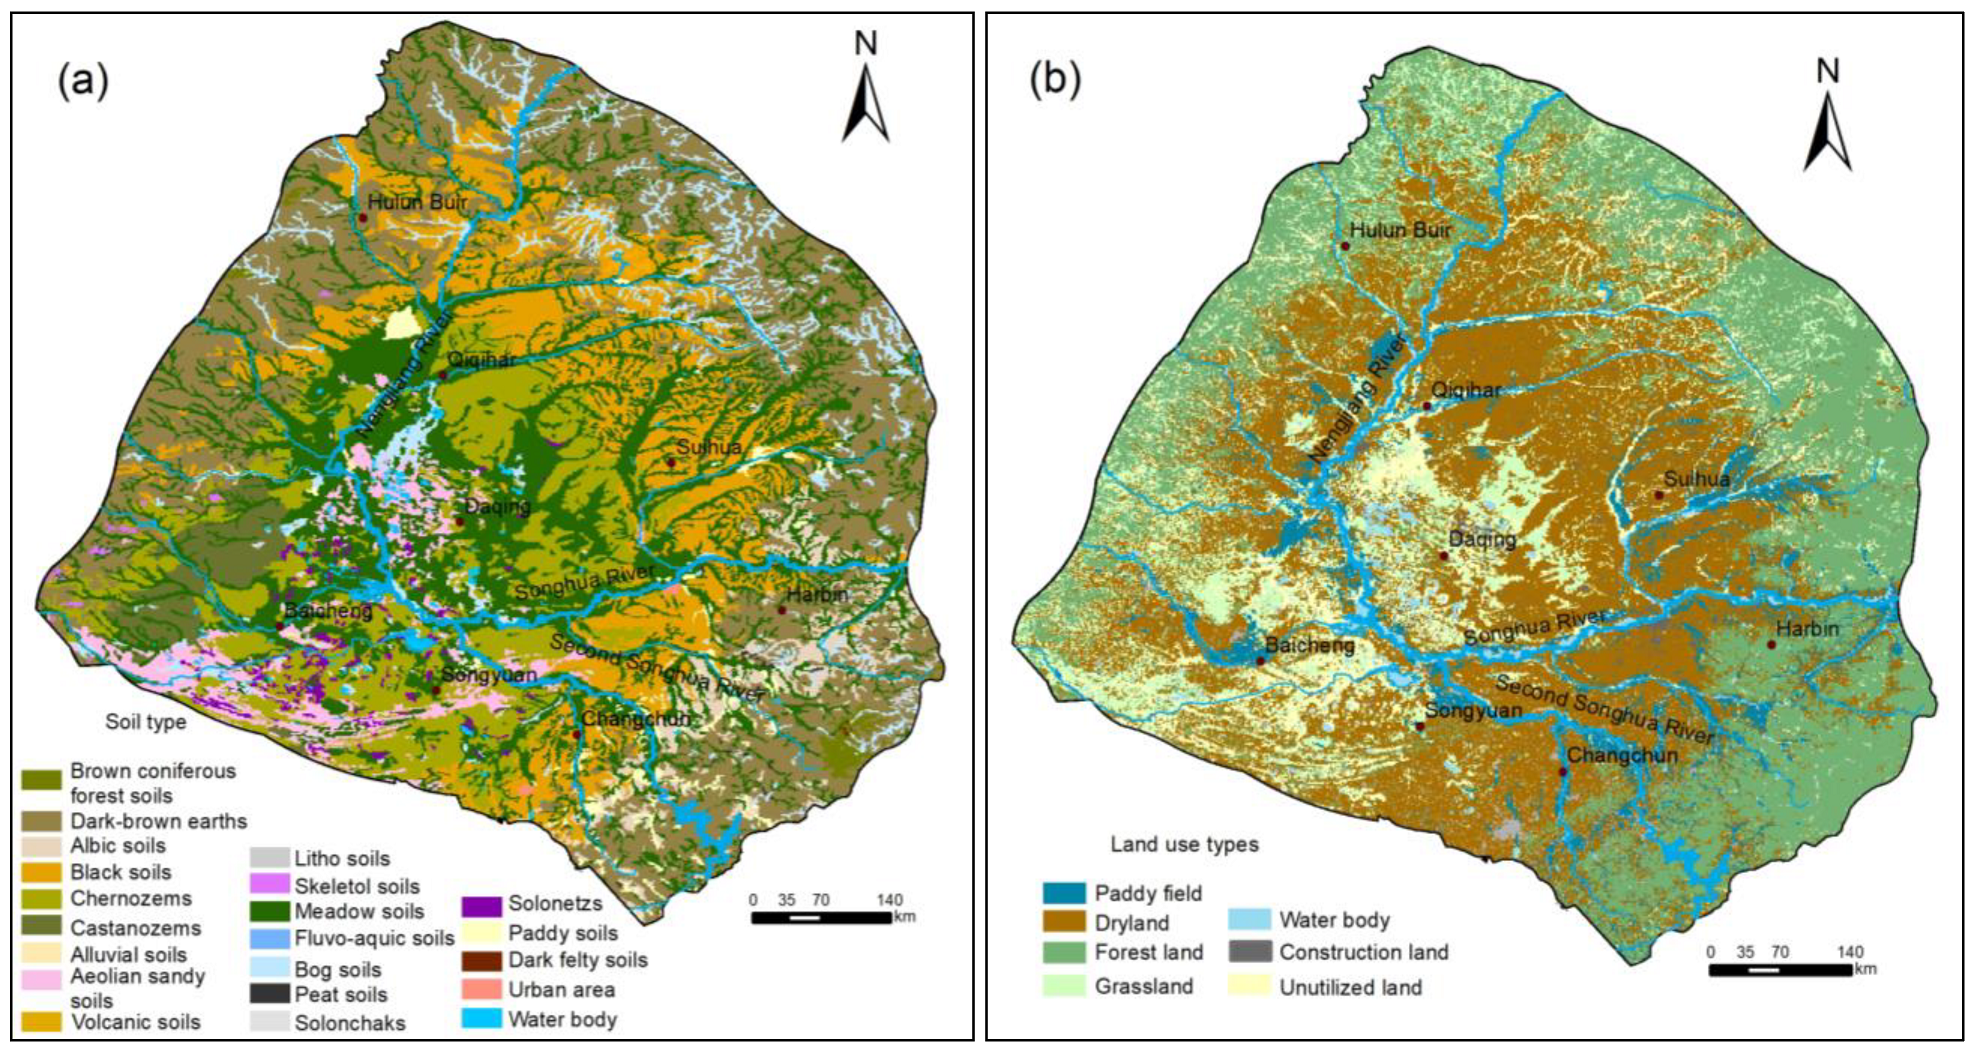
Soil Type
Soil Texture
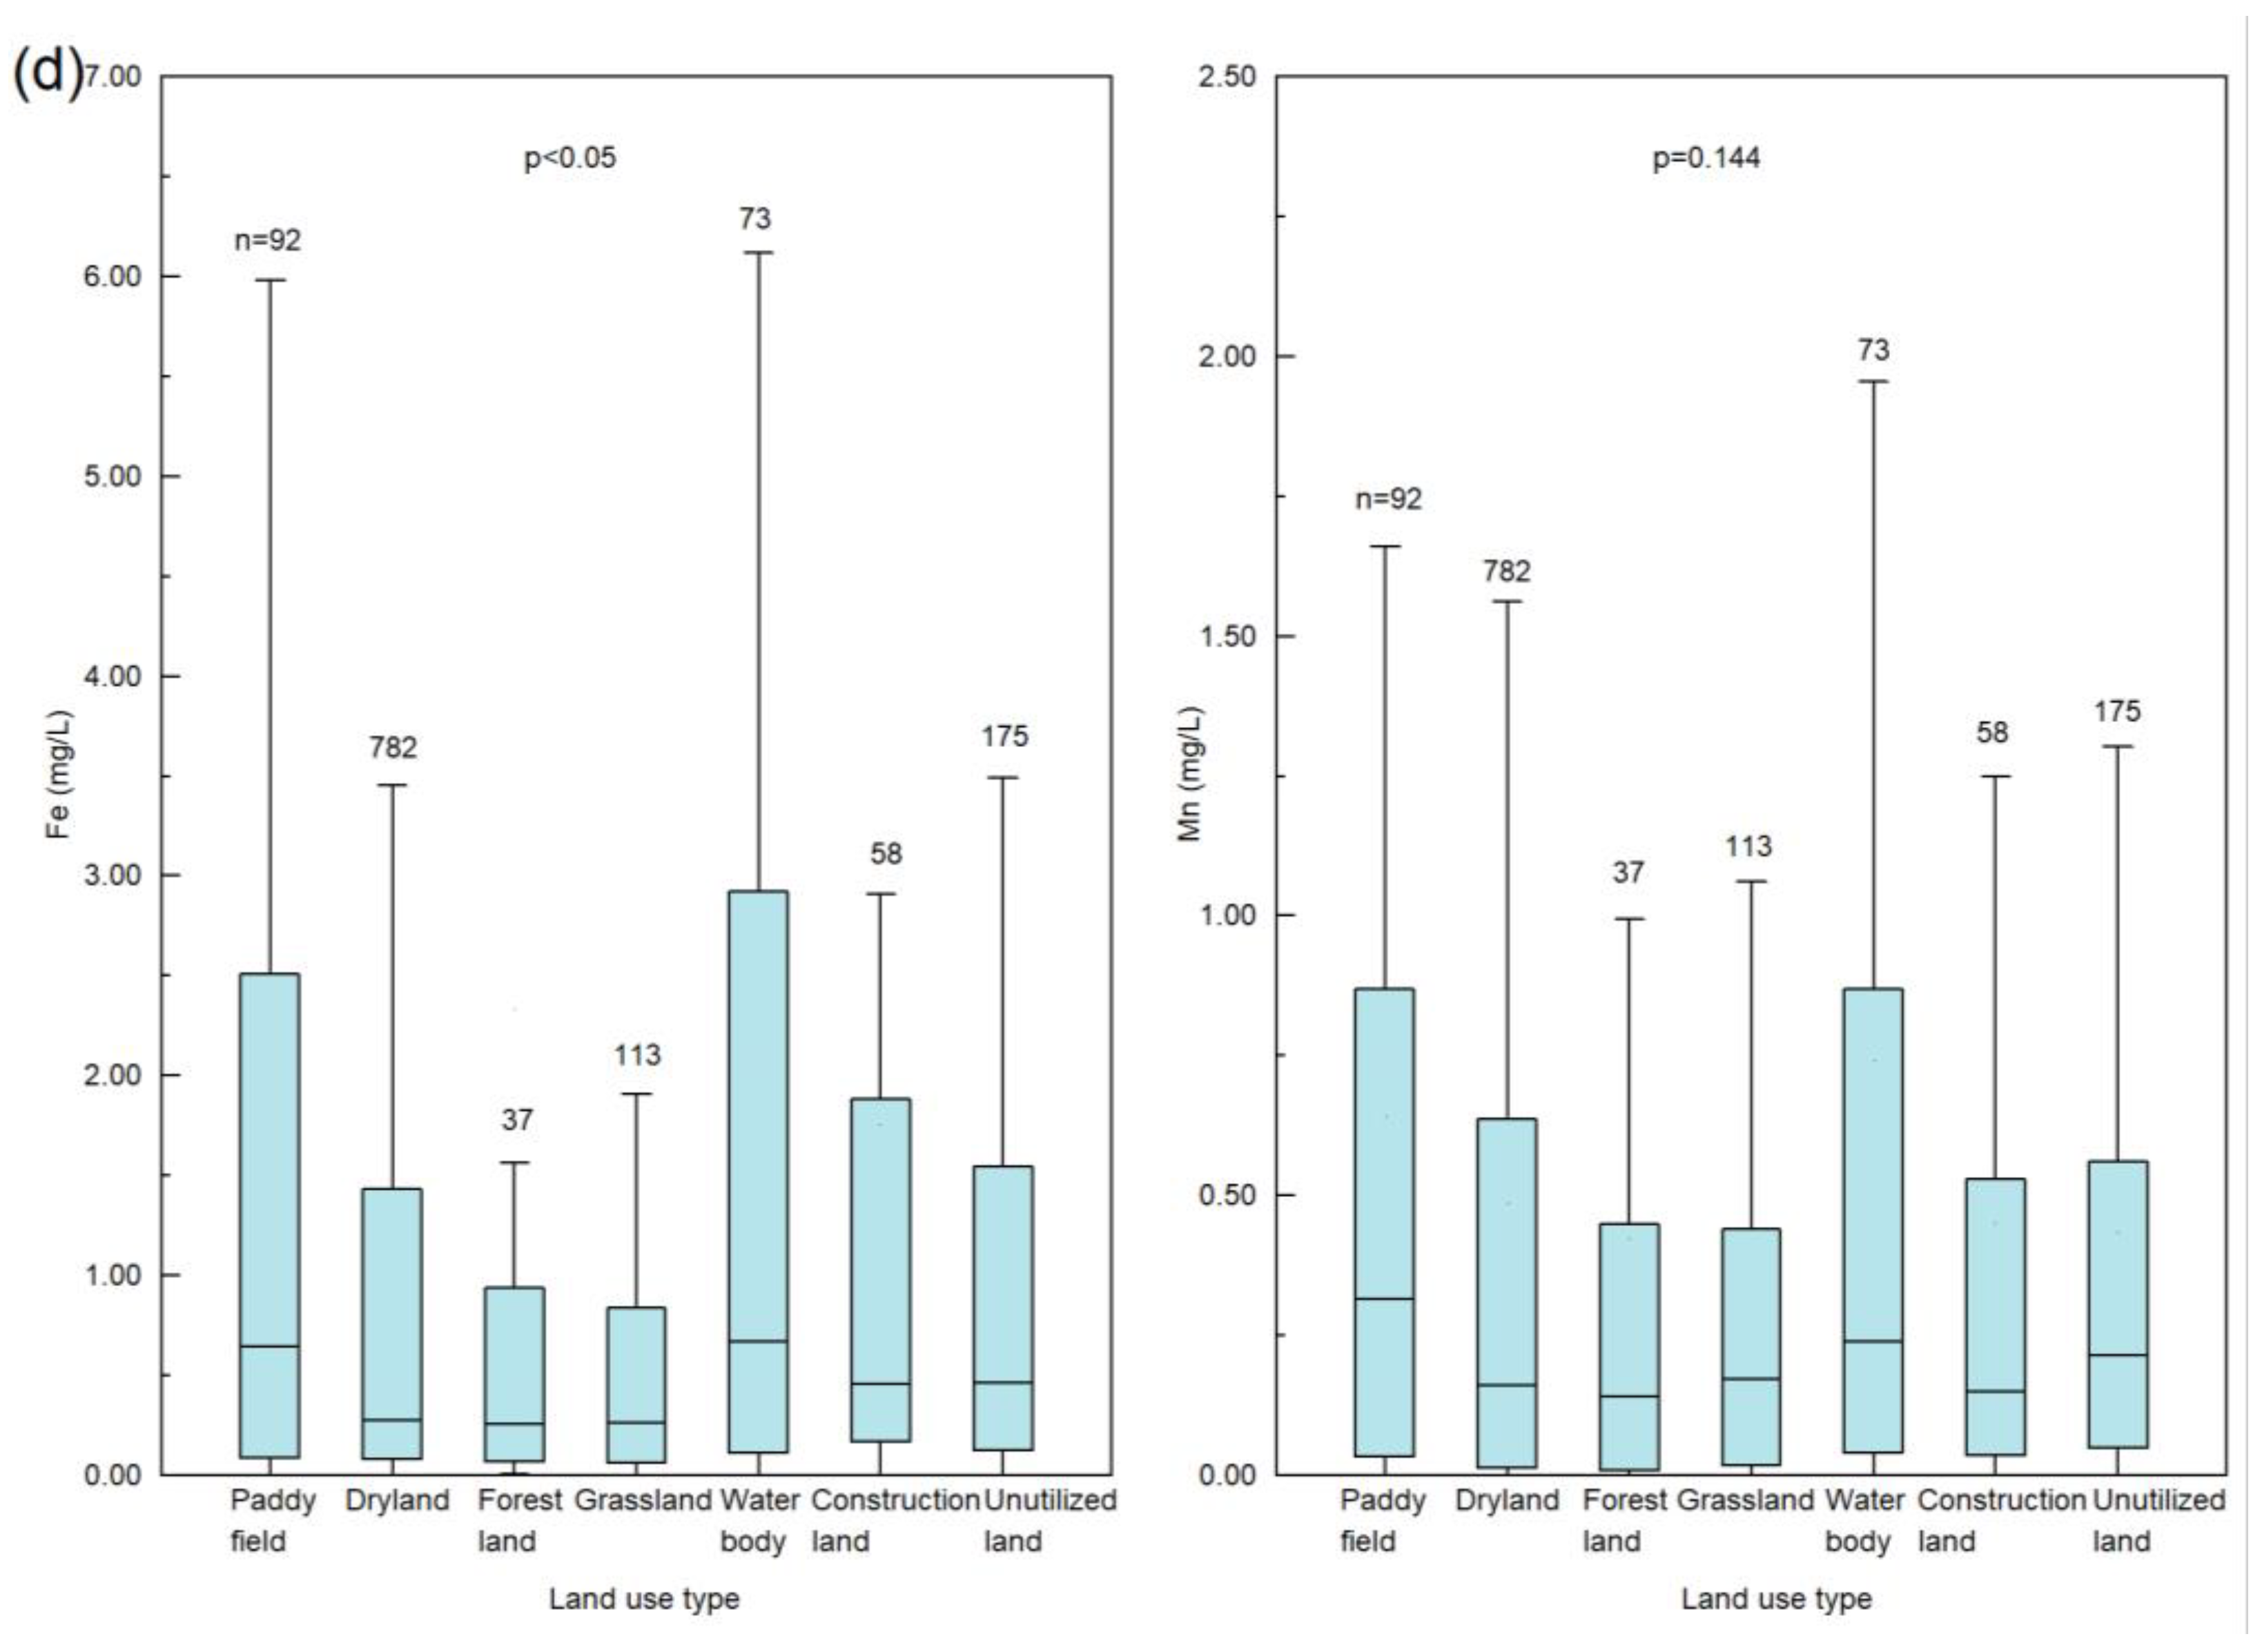
Land Use Type
4.2.3. Effects of Hydrochemical Characteristics
pH
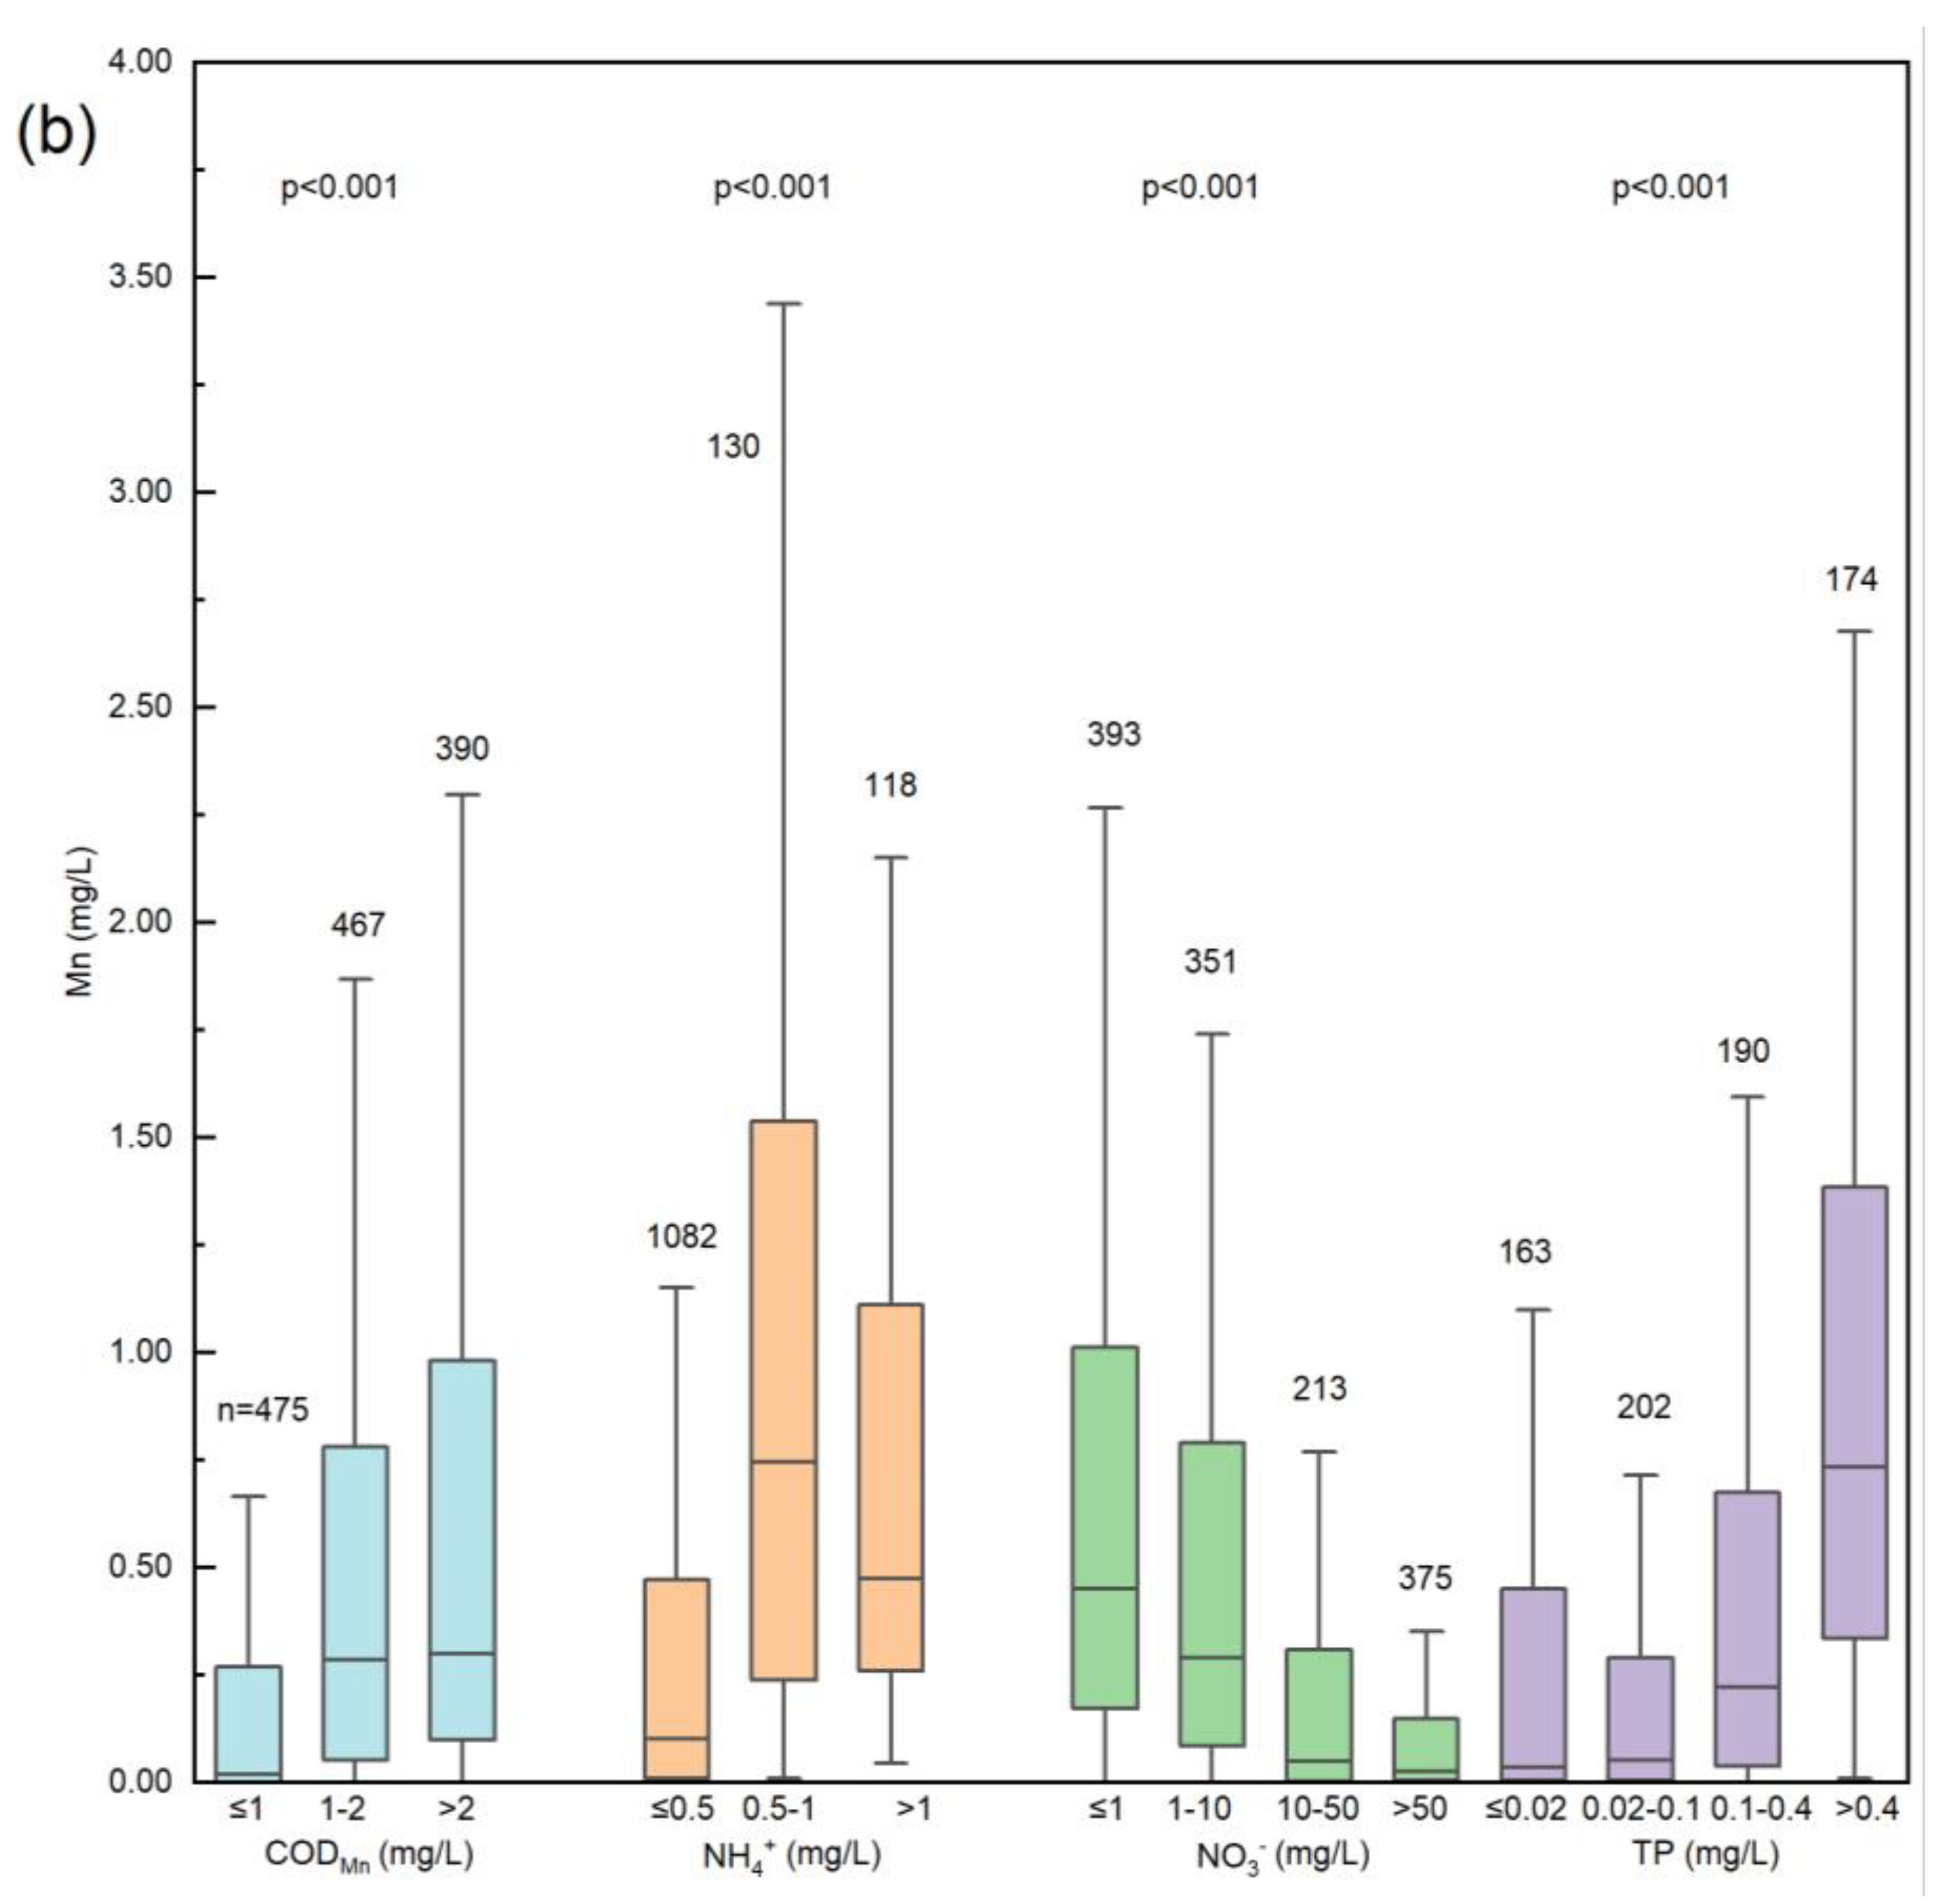
NH4+
CODMn
NO3−
TP
Positive Correlations between the Fe, Mn, and As Concentrations
4.3. Formation of Groundwater with Elevated Fe and Mn Concentrations
4.4. Implications for Environmental Management
5. Conclusions
Supplementary Materials
Author Contributions
Funding
Institutional Review Board Statement
Informed Consent Statement
Data Availability Statement
Acknowledgments
Conflicts of Interest
References
- Teng, Y.; Zuo, R.; Xiong, Y.; Wu, J.; Zhai, Y.; Su, J. Risk assessment framework for nitrate contamination in groundwater for regional management. Sci. Total Environ. 2019, 697, 134102. [Google Scholar] [CrossRef] [PubMed]
- Retike, I.; Kalvans, A.; Popovs, K.; Bikse, J.; Babre, A.; Delina, A. Geochemical classification of groundwater using multivariate statistical analysis in Latvia. Hydrol. Res. 2016, 47, 799–813. [Google Scholar] [CrossRef] [Green Version]
- Zhai, Y.; Han, Y.; Xia, X.; Li, X.; Lu, H.; Teng, Y.; Wang, J. Anthropogenic organic pollutants in groundwater increase releases of Fe and Mn from aquifer sediments: Impacts of pollution degree, mineral content, and pH. Water 2021, 13, 1920. [Google Scholar] [CrossRef]
- McMahon, P.B.; Belitz, K.; Reddy, J.E.; Johnson, T.D. Elevated manganese concentrations in United States groundwater, role of land surface-soil-aquifer connections. Environ. Sci. Technol. 2019, 53, 29–38. [Google Scholar] [CrossRef]
- Jia, Y.; Xi, B.; Jiang, Y.; Guo, H.; Yang, Y.; Lian, X.; Han, S. Distribution, formation and human-induced evolution of geogenic contaminated groundwater in China: A review. Sci. Total Environ. 2018, 643, 967–993. [Google Scholar] [CrossRef]
- Ma, Y.; Wang, Z.; Ma, T.; Chen, S. Spatial distribution characteristics and influencing factors of organic carbon in sediments of Tongshun River riparian zone. Chemosphere 2020, 252, 126322. [Google Scholar] [CrossRef]
- Sharma, G.K.; Jena, R.K.; Ray, P.; Yadav, K.K.; Moharana, P.C.; Cabral-Pinto, M.M.S.; Bordoloi, G. Evaluating the geochemistry of groundwater contamination with iron and manganese and probabilistic human health risk assessment in endemic areas of the world’s largest River Island, India. Environ. Toxicol. Pharmacol. 2021, 87, 103690. [Google Scholar] [CrossRef]
- Carretero, S.; Kruse, E. Iron and manganese content in groundwater on the northeastern coast of the Buenos Aires Province, Argentina. Environ. Earth Sci. 2014, 73, 1983–1995. [Google Scholar] [CrossRef]
- Degnan, J.R.; Lindsey, B.D.; Levitt, J.P.; Szabo, Z. The relation of geogenic contaminants to groundwater age, aquifer hydrologic position, water type, and redox conditions in Atlantic and Gulf Coastal Plain aquifers, eastern and south-central USA. Sci. Total Environ. 2020, 723, 137835. [Google Scholar] [CrossRef]
- Dippong, T.; Mihali, C.; Hoaghia, M.A.; Cical, E.; Cosma, A. Chemical modeling of groundwater quality in the aquifer of Seini town—Someș Plain, Northwestern Romania. Ecotoxicol. Environ. Saf. 2019, 168, 88–101. [Google Scholar] [CrossRef]
- Vega, M.A.; Kulkarni, H.V.; Johannesson, K.H.; Taylor, R.J.; Datta, S. Mobilization of c-occurring trace elements (CTEs) in arsenic contaminated aquifers in the Bengal basin. Appl. Geochem. 2020, 122, 104709. [Google Scholar] [CrossRef]
- Jia, Y.; Guo, H.; Jiang, Y.; Wu, Y.; Zhou, Y. Hydrogeochemical zonation and its implication for arsenic mobilization in deep groundwaters near alluvial fans in the Hetao Basin, Inner Mongolia. J. Hydrol. 2014, 518, 410–420. [Google Scholar] [CrossRef]
- Chen, H.; Tang, L.; Wang, Z.; Su, M.; Tian, D.; Zhang, L.; Li, Z. Evaluating the protection of bacteria from extreme Cd (II) stress by P-enriched biochar. Environ. Pollut. 2020, 263, 114483. [Google Scholar] [CrossRef]
- Zheng, N.; Yue, W.; Wu, J.; Hou, K.; Wu, L.; Guo, M.; Teng, Y. Responses of Soil Cadmium Desorption under Different Saline Environments and Its Controlling Factors. Agronomy 2021, 11, 2175. [Google Scholar] [CrossRef]
- USEPA. National Secondary Drinking Water Regulations. 2003. Available online: https://www.epa.gov/sdwa/secondary-drinking-water-standards-guidance-nuisance-chemicals (accessed on 26 March 2021).
- EU. Directive (EU) 2020/2184 of the European Parliament and of the Council of 16 December 2020 on the Quality of Water Intended for Human Consumption. 2020. Available online: https://www.legislation.gov.uk/eudr/2020/2184# (accessed on 26 March 2021).
- WHO. Guidelines for Drinking Water Quality. 2006. Available online: https://www.who.int/publications/i/item/9789241549950 (accessed on 26 March 2021).
- Ying, S.C.; Schaefer, M.V.; Cock-Esteb, A.; Li, J.; Fendorf, S. Depth stratification leads to distinct zones of manganese and arsenic contaminated groundwater. Environ. Sci. Technol. 2017, 51, 8926–8932. [Google Scholar] [CrossRef]
- SAC (Standardization Administration of the P.R.C.). Standard for Groundwater Quality (GB/T 14848-2017). 2017. Available online: http://c.gb688.cn/bzgk/gb/showGb?type=online&hcno=F745E3023BD5B10B9FB5314E0FFB5523 (accessed on 26 March 2021).
- Wang, Z.; Schenkeveld, W.D.; Kraemer, S.M.; Giammar, D.E. Synergistic effect of reductive and ligand-promoted dissolution of goethite. Environ. Sci. Technol. 2015, 49, 7236–7244. [Google Scholar] [CrossRef]
- Zhang, Z.; Xiao, C.; Yang, W.; Adeyeye, O.A.; Liang, X. Effects of the natural environment and human activities on iron and manganese content in groundwater: A case study of Changchun city, Northeast China. Environ. Sci. Pollut. Res. Int. 2021, 28, 41109–41119. [Google Scholar] [CrossRef]
- Chi, Z.; Xie, X.; Pi, K.; Wang, Y.; Li, J.; Qian, K. The influence of irrigation-induced water table fluctuation on iron redistribution and arsenic immobilization within the unsaturation zone. Sci. Total Environ. 2018, 637-638, 191–199. [Google Scholar] [CrossRef]
- Wang, J.; Zheng, N.; Liu, H.; Cao, X.; Teng, Y.; Zhai, Y. Distribution, Formation and Human Health Risk of Fluorine in Groundwater in Songnen Plain, NE China. Water 2021, 13, 3236. [Google Scholar] [CrossRef]
- Li, D.; Zhai, Y.; Lei, Y.; Li, J.; Teng, Y.; Lu, H.; Xia, X.; Yue, W.; Yang, J. Spatiotemporal evolution of groundwater nitrate nitrogen levels and potential human health risks in the Songnen Plain, Northeast China. Ecotoxicol. Environ. Saf. 2021, 208, 111524. [Google Scholar] [CrossRef]
- Wang, B.; Teng, Y.; Wang, H.; Zuo, R.; Zhai, Y.; Yue, W.; Yang, J. Entropy weight method coupled with an improved DRASTIC model to evaluate the special vulnerability of groundwater in Songnen Plain, Northeastern China. Hydrol. Res. 2020, 51, 1184–1200. [Google Scholar] [CrossRef]
- Zhai, Y.; Zheng, F.; Zhao, X.; Xia, X.; Teng, Y. Identification of hydrochemical genesis and screening of typical groundwater pollutants impacting human health: A case study in Northeast China. Environ. Pollut. 2019, 252, 1202–1215. [Google Scholar] [CrossRef]
- Adeyeye, O.; Xiao, C.; Zhang, Z.; Liang, X. State, source and triggering mechanism of iron and manganese pollution in groundwater of Changchun, Northeastern China. Environ. Monit. Assess. 2020, 192, 619. [Google Scholar] [CrossRef]
- Huang, Y.; Zuo, R.; Li, J.; Wu, J.; Zhai, Y.; Teng, Y. The spatial and temporal variability of groundwater vulnerability and human health risk in the Limin District, Harbin, China. Water 2018, 10, 686. [Google Scholar] [CrossRef] [Green Version]
- Lin, X.; Chen, M.; Wang, Z.; Liao, Z.; Zhang, B.; Sun, C. 2000. Study on Groundwater Resources and Sustainable Development in Songnen Basin; Seismological Press: Beijing, China, 2000. (In Chinese) [Google Scholar]
- Guo, H.; Zhang, D.; Wen, D.; Wu, Y.; Ni, P.; Jiang, Y.; Guo, Q.; Li, F.; Zheng, H.; Zhou, Y. Arsenic mobilization in aquifers of the southwest Songnen basin, P.R. China: Evidences from chemical and isotopic characteristics. Sci. Total Environ. 2014, 490, 590–602. [Google Scholar] [CrossRef]
- Helsel, D.R.; Hirsch, R.M. Statistical Methods in Water Resources; USGS Publications: Reston, VA, USA, 2002. [Google Scholar] [CrossRef]
- Haaf, E.; Giese, M.; Heudorfer, B.; Stahl, K.; Barthel, R. Physiographic and Climatic Controls on Regional Groundwater Dynamics. Water Resour. Res. 2020, 56, e2019WR026545. [Google Scholar] [CrossRef]
- Cong, L. Research on the Groundwater Dynamic Characteristics and Evaluation of Overmining Area in Songnen Plain (Heilongjiang Province); Jilin University: Changchun, China, 2017; (In Chinese with English abstract). [Google Scholar]
- Duan, Y.; Gan, Y.; Wang, Y.; Deng, Y.; Guo, X.; Dong, C. Temporal variation of groundwater level and arsenic concentration at Jianghan Plain, central China. J. Geochem. Explor. 2015, 149, 106–119. [Google Scholar] [CrossRef]
- Benz, S.A.; Bayer, P.; Blum, P. Global patterns of shallow groundwater temperatures. Environ. Res. Lett. 2017, 12, 034005. [Google Scholar] [CrossRef]
- Jesußek, A.; Grandel, S.; Dahmke, A. Impacts of subsurface heat storage on aquifer hydrogeochemistry. Environ. Earth Sci. 2012, 69, 1999–2012. [Google Scholar] [CrossRef]
- Lipczynska-Kochany, E. Humic substances, their microbial interactions and effects on biological transformations of organic pollutants in water and soil: A review. Chemosphere 2018, 202, 420–437. [Google Scholar] [CrossRef] [PubMed]
- Riedel, T. Temperature-associated changes in groundwater quality. J. Hydrol. 2019, 572, 206–212. [Google Scholar] [CrossRef]
- Wang, J.; Sickinger, M.; Ciobota, V.; Herrmann, M.; Rasch, H.; Rosch, P.; Popp, J.; Kusel, K. Revealing the microbial community structure of clogging materials in dewatering wells differing in physico-chemical parameters in an open-cast mining area. Water Res. 2014, 63, 222–233. [Google Scholar] [CrossRef]
- Li, C.; Wang, S.; Du, X.; Cheng, X.; Fu, M.; Hou, N.; Li, D. Immobilization of iron- and manganese-oxidizing bacteria with a biofilm-forming bacterium for the effective removal of iron and manganese from groundwater. Bioresour. Technol. 2016, 220, 76–84. [Google Scholar] [CrossRef]
- Lv, X. Fe and Mn distribution of groundwater in the Tacheng Basin, Xinjiang and its impact of human activities. Geol. China 2020, 47, 1765–1775, (In Chinese with English abstract). [Google Scholar]
- Postma, D.; Larsen, F.; Minh Hue, N.T.; Duc, M.T.; Viet, P.H.; Nhan, P.Q.; Jessen, S. Arsenic in groundwater of the Red River floodplain, Vietnam: Controlling geochemical processes and reactive transport modeling. Geochim. Cosmochim. Acta 2007, 71, 5054–5071. [Google Scholar] [CrossRef]
- Zhang, W.; Wu, S.; Qin, Y.; Li, S.; Lei, L.; Sun, S.; Yang, Y. Deposition and mobilization of viruses in unsaturated porous media: Roles of different interfaces and straining. Environ. Pollut. 2021, 270, 116072. [Google Scholar] [CrossRef]
- Koit, O.; Barberá, J.A.; Marandi, A.; Terasmaa, J.; Kiivit, I.-K.; Martma, T. Spatiotemporal assessment of humic substance-rich stream and shallow karst aquifer interactions in a boreal catchment of northern Estonia. J. Hydrol. 2020, 580. [Google Scholar] [CrossRef]
- MEE (Ministry of Ecology and Environment of the People’s Republic of China). National Surface Water Quality Report. 2015. Available online: https://www.mee.gov.cn/hjzl/shj/dbsszyb/index_4.shtml (accessed on 1 September 2021).
- Zhu, Y.; Zhai, Y.; Teng, Y.; Wang, G.; Du, Q.; Wang, J.; Yang, G. Water supply safety of riverbank filtration wells under the impact of surface water-groundwater interaction: Evidence from long-term field pumping tests. Sci. Total Environ. 2020, 711, 135141. [Google Scholar] [CrossRef]
- Zhang, Z.; Xiao, C.; Adeyeye, O.; Yang, W.; Liang, X. Source and Mobilization Mechanism of Iron, Manganese and Arsenic in Groundwater of Shuangliao City, Northeast China. Water 2020, 12, 534. [Google Scholar] [CrossRef] [Green Version]
- Jordanova, N.; Jordanova, D.; Petrov, P. Magnetic imprints of pedogenesis in Planosols and Stagnic Alisol from Bulgaria. Geoderma 2011, 160, 477–489. [Google Scholar] [CrossRef]
- SAC (Standardization Administration of the P.R.C.). Classification and Codes for Chinese Soil (GB/T 17296-2009). 2009. Available online: http://c.gb688.cn/bzgk/gb/showGb?type=online&hcno=D59C90AB5DA4F335F0D2BBFE79893627 (accessed on 2 July 2021).
- Lin, D.; Wang, Q.; Bai, Z.; Xie, Y. Soil Science; China Forestry Press: Beijing, China, 2002. (In Chinese) [Google Scholar]
- Ma, D.; Wu, J.; Yang, P.; Zhu, M. Coupled manganese redox cycling and organic carbon degradation on mineral surfaces. Environ. Sci. Technol. 2020, 54, 8801–8810. [Google Scholar] [CrossRef]
- Abollino, O.; Aceto, M.; Malandrino, M.; Sarzanini, C.; Mentasti, E. Adsorption of heavy metals on Na-montmorillonite. Effect of pH and organic substances. Water Res. 2003, 37, 1619–1627. [Google Scholar] [CrossRef]
- Garg, S.; Jiang, C.; Miller, C.J.; Rose, A.L.; Waite, T.D. Iron redox transformations in continuously photolyzed acidic solutions containing natural organic matter: Kinetic and mechanistic insights. Environ. Sci. Technol. 2013, 47, 9190–9197. [Google Scholar] [CrossRef]
- Raju, N.J. Arsenic in the geo-environment: A review of sources, geochemical processes, toxicity and removal technologies. Environ. Res. 2021, 203, 111782. [Google Scholar] [CrossRef]
- Honty, M.; Frederickx, L.; Banerjee, D.; Hoving, A. Fe distribution, redox state and electrochemical activity in Boom Clay. Appl. Geochem. 2021, 125, 104857. [Google Scholar] [CrossRef]
- Hem, J. Study and Interpretation of the Chemical Characteristics of Natural Water, 3rd ed.; US Geological Survey: Reston, VA, USA, 1989. [Google Scholar]
- Du, Y.; Deng, Y.; Ma, T.; Xu, Y.; Tao, Y.; Huang, Y.; Liu, R.; Wang, Y. Enrichment of geogenic ammonium in Quaternary alluvial-lacustrine aquifer systems: Evidence from carbon isotopes and DOM characteristics. Environ. Sci. Technol. 2020, 54, 6104–6114. [Google Scholar] [CrossRef]
- Zhai, Y.; Ma, T.; Zhou, J.; Li, X.; Liu, D.; Wang, Z.; Qin, Y.; Du, Q. Impacts of leachate of landfill on the groundwater hydrochemistry and size distributions and heavy metal components of colloids: A case study in NE China. Environ. Sci. Pollut. Res. Int. 2019, 26, 5713–5723. [Google Scholar] [CrossRef]
- Neidhardt, H.; Berner, Z.A.; Freikowski, D.; Biswas, A.; Majumder, S.; Winter, J.; Gallert, C.; Chatterjee, D.; Norra, S. Organic carbon induced mobilization of iron and manganese in a West Bengal aquifer and the muted response of groundwater arsenic concentrations. Chem. Geol. 2014, 367, 51–62. [Google Scholar] [CrossRef]
- Liao, X.; Zhang, C.; Liu, Y.; Luo, Y.; Wu, S.; Yuan, S.; Zhu, Z. Abiotic degradation of methyl parathion by manganese dioxide: Kinetics and transformation pathway. Chemosphere 2016, 150, 90–96. [Google Scholar] [CrossRef]
- Wang, Y.; Pi, K.; Fendorf, S.; Deng, Y.; Xie, X. Sedimentogenesis and hydrobiogeochemistry of high arsenic Late Pleistocene-Holocene aquifer systems. Earth-Sci. Rev. 2019, 189, 79–98. [Google Scholar] [CrossRef]
- Farmaha, B.S.; Pritpal, S.; Bijay, S. Spatial and Temporal Assessment of Nitrate-N under Rice-Wheat System in Riparian Wetlands of Punjab, North-Western India. Agronomy 2021, 11, 1284. [Google Scholar] [CrossRef]
- MEE (Ministry of Ecology and Environment of the People’s Republic of China). Environmental Quality Standards for Surface Water (GB 3838-2002). 2002. Available online: http://mee.gov.cn/ywgz/fgbz/bz/bzwb/shjbh/shjzlbz/200206/t20020601_66497.shtml (accessed on 4 May 2021).
- Johan, P.D.; Ahmed, O.H.; Omar, L.; Hasbullah, N.A. Phosphorus Transformation in Soils Following Co-Application of Charcoal and Wood Ash. Agronomy 2021, 11, 2010. [Google Scholar] [CrossRef]
- Sun, G.; Chen, Y.; Bi, X.; Yang, W.; Chen, X.; Zhang, B.; Cui, Y. Geochemical assessment of agricultural soil: A case study in Songnen-Plain (Northeastern China). Catena 2013, 111, 56–63. [Google Scholar] [CrossRef]
- Liu, R.; Bao, K.; Yao, S.; Yang, F.; Wang, X. Ecological risk assessment and distribution of potentially harmful trace elements in lake sediments of Songnen Plain, NE China. Ecotoxicol. Environ. Saf. 2018, 163, 117–124. [Google Scholar] [CrossRef] [PubMed]
- Liu, J. Study on distribution of soil aggregates and their carbon, nitrogen and phosphorus stoichiometric characteristics of different land use types in Songnen Plain. J. Northeast. Agric. Univ. 2020, 51, 33–40. [Google Scholar]
- McArthur, J.M.; Banerjee, D.M.; Hudson-Edwards, K.A.; Mishra, R.; Purohit, R.; Ravenscroft, P.; Cronin, A.; Howarth, R.J.; Chatterjee, A.; Talukder, T.; et al. Natural organic matter in sedimentary basins and its relation to arsenic in anoxic ground water: The example of West Bengal and its worldwide implications. Appl. Geochem. 2004, 19, 1255–1293. [Google Scholar] [CrossRef]


| Influencing Factors | Groups (n = Number of Samples) | p-Values | |||||
|---|---|---|---|---|---|---|---|
| Fe | Mn | ||||||
| Climate | Precipitation(mm) | (300,400] (n = 99) | (300,500] (n = 516) | (500,600] (n = 678) | (600,700] (n = 39) | p < 0.05 | p < 0.001 |
| Temperature (°C) | (1,3] (n = 75) | (3,5] (n = 304) | (5,6] (n = 471) | (6,7] (n = 482) | p < 0.001 | p < 0.001 | |
| Surface features | Altitude (m) | (0,140] (n = 250) | (140,160] (n = 414) | (160,180] (n = 224) | (180,400] (n = 444) | p < 0.001 | p < 0.001 |
| Distance to the nearest river (km) | (0,5] (n = 252) | (5,10] (n = 199) | (10,40] (n = 533) | (40,150] (n = 348) | p < 0.001 | p < 0.001 | |
| Soil type | Dark-brown earths (n = 14) | Black soils (n = 263) | Chernozems (n = 343) | Castanozems (n = 19) | p = 0.306 | p < 0.05 | |
| Aeolian sandy soils (n = 150) | Meadow soils (n = 444) | Bog soils (n = 24) | Solonchaks (n = 11) | ||||
| Solonetzs (n = 29) | Paddy soils (n = 15) | Water body (n = 16) | / | ||||
| Soil texture | Sand (n = 72) | Loam (n = 407) | Clay (n = 849) | / | p < 0.05 | p < 0.001 | |
| Land use type | Paddy field (n = 92) | Dryland (n = 782) | Forest land (n = 37) | Grassland (n = 113) | p < 0.05 | p = 0.144 | |
| Water body (n = 73) | Construction land (n = 58) | Unutilized land (n = 175) | / | ||||
| Hydrochemical characteristics | CODMn (mg/L) | ≤1 (n = 475) | 1–2 (n = 467) | >2 (n = 390) | / | p < 0.001 | p < 0.001 |
| NH4+ (mg/L) | ≤0.5 (n = 1082) | 0.5–1 (n = 130) | >1 (n = 118) | / | p < 0.001 | p < 0.001 | |
| NO3− (mg/L) | ≤1 (n = 393) | 1–10 (n = 351) | 10–50 (n = 213) | >50 (n = 375) | p < 0.001 | p < 0.001 | |
| TP (mg/L) | ≤0.02 (n = 163) | 0.02–0.1 (n = 202) | 0.1–0.4 (n = 190) | >0.4 (n = 174) | p < 0.001 | p < 0.001 | |
| Variables | Mn | As | NH4+ | NO3− | CODMn | TP | |
|---|---|---|---|---|---|---|---|
| Fe | Correlation coefficient (r) | 0.600 ** | 0.423 ** | 0.545 ** | −0.450 ** | 0.357 ** | 0.546 ** |
| n | 1332 | 1332 | 1332 | 1332 | 1332 | 729 | |
| Mn | Correlation coefficient (r) | 1.000 ** | 0.481 ** | 0.515 ** | −0.426 ** | 0.388 ** | 0.424 ** |
| n | 1332 | 1332 | 1332 | 1332 | 1332 | 729 | |
Publisher’s Note: MDPI stays neutral with regard to jurisdictional claims in published maps and institutional affiliations. |
© 2021 by the authors. Licensee MDPI, Basel, Switzerland. This article is an open access article distributed under the terms and conditions of the Creative Commons Attribution (CC BY) license (https://creativecommons.org/licenses/by/4.0/).
Share and Cite
Zhai, Y.; Cao, X.; Xia, X.; Wang, B.; Teng, Y.; Li, X. Elevated Fe and Mn Concentrations in Groundwater in the Songnen Plain, Northeast China, and the Factors and Mechanisms Involved. Agronomy 2021, 11, 2392. https://doi.org/10.3390/agronomy11122392
Zhai Y, Cao X, Xia X, Wang B, Teng Y, Li X. Elevated Fe and Mn Concentrations in Groundwater in the Songnen Plain, Northeast China, and the Factors and Mechanisms Involved. Agronomy. 2021; 11(12):2392. https://doi.org/10.3390/agronomy11122392
Chicago/Turabian StyleZhai, Yuanzheng, Xinyi Cao, Xuelian Xia, Bin Wang, Yanguo Teng, and Xiao Li. 2021. "Elevated Fe and Mn Concentrations in Groundwater in the Songnen Plain, Northeast China, and the Factors and Mechanisms Involved" Agronomy 11, no. 12: 2392. https://doi.org/10.3390/agronomy11122392