Article

Negative Pressure Irrigation System Reduces Soil Nitrogen Loss for Lettuce during Greenhouse Production

Institute of Agricultural Resources and Regional Planning, Chinese Academy of Agricultural Sciences, Beijing 100081, China
*
Author to whom correspondence should be addressed.
Agronomy 2021, 11(12), 2380; https://doi.org/10.3390/agronomy11122380
Submission received: 17 October 2021 / Revised: 19 November 2021 / Accepted: 19 November 2021 / Published: 24 November 2021

Abstract

:
Negative pressure irrigation (NPI) to grow crops reduces the application of fertilizer and water while also promoting yield and quality. However, plantation vegetables usually require a large input of nitrogen (N) fertilizer in a greenhouse setting, which will lower the soil quality and accelerate the emission of greenhouse gases. Therefore, the purpose of this research was to explore planting lettuce under an NPI system that retrenches N fertilizer application and mitigates N2O emissions compared with conventional irrigation (CI). This research proved that under NPI conditions, nitrate and ammonium fluctuated slightly in the soil, stabilizing in the range of 18–28 mg kg−1, while that of CI was 20–55 mg kg−1. The NPI alleviated N2O emissions, and NPI-N150 and NPI-N105 decreased them by 18% and 32%, respectively, compared with those for CI-N150. The main explanation was that the NPI inhibited the formation of NO3-N, reduced the copies number of AOA and AOB as well as the abundance of Nitrospira in the soil, and weakened the soil nitrate reductase and urease activities. The results of this research provide a reliable scientific method for reducing the use of water and N fertilizer while cultivating lettuce, as well as for reducing N2O emissions from agricultural facilities.

1. Introduction

Negative pressure irrigation (NPI) is a new type of subsurface irrigation method that assists crop roots in the uptake and utilization of water and fertilizers [1,2,3]. NPI is based on crop water consumption characteristics and soil tension. It can continuously and stably supply water and nutrition to the rhizosphere to avoid the loss of soil moisture and nutrients [1,4,5]. Since the NPI system supplies nitrogen (N) fertilizer and water in the rhizosphere, it improves the N utilization efficiency (NUE) of crops [3]. Its energy-saving technology has led to it being used in greenhouse and field trials [3,6,7]. In previous research on NPI, the yield of cucumbers, spinach, tomato, cabbage, and other crops was increased by 17~51%, while water consumption was reduced by 14~53% compared with traditional irrigation [7,8,9]. However, although plantation vegetables require less water and fertilizer under an NPI system, the application of N fertilizer is also related to a series of greenhouse gas (GHG) emissions [10,11,12]. N2O is an important greenhouse gas, and nearly 70% of its emissions are derived from the production and utilization of N fertilizer in agriculture [13,14,15]. Whether NPI could alleviate N2O emissions has not yet been reported.
Greenhouse vegetable production is usually associated with excessive application of N fertilizer, which causes soil consolidation and N leaching into the water, which pollutes rivers and the groundwater [11,14,16,17] and leads to high levels of greenhouse gas emissions [18,19]. Nearly 70% of the N will be lost and returned to the atmosphere or leached due to the catalysis of soil-nitrifying microbes during nitrification and denitrification processes [13,20,21,22]. The soil nitrification is dominantly driven by ammonia-oxidizing bacteria (AOB) and ammonia-oxidizing archaea (AOA) [23,24,25]. The subsequent product NO3-N is a high-mobility N source in the soil, affecting eutrophication and groundwater pollution, and it also causes N2O-driven climate change through denitrification [18,26,27]. Therefore, reducing the application of N fertilizer and slowing down N-driven nitrification and denitrification are changes capable of significantly alleviating the emission of N2O.
Although China’s vegetable production accounts for half of the world’s production, it accounts for only 7.8% of the global use of crop chemical fertilizers and 6.6% of the greenhouse gas emissions [21]. Alleviation of the environmental pollution and GHG emissions caused by N application could be achieved by using traditional ways of growing vegetables to reduce the loss of N fertilizer in greenhouses, but alternatively, a feasible irrigation strategy using NPI is capable of reducing the use of N fertilizer [3,6,28,29]. Relatedly, the current drip irrigation (DI) technology principally introduces water and fertilizer into the topsoil, which is likely to result in transpiration leading to a decrease in water and nutrition use efficiency [30,31,32]. Although using synthetic nitrification inhibitors (SNIs) can effectively suppress the loss of N and reduce greenhouse gas emissions, they have many drawbacks, including cost, environmental pollution, and entry into the food system [13,18]. Consequently, it is necessary to formulate strategies to mitigate N loss processes, such as the NPI system. It seems to be an excellent solution, with restraints on nitrification and the leaching of N to ensure nitrogen utilization efficiency and environmental health and safety.
Our previous studies demonstrated that the NPI system improved the yield and quality of a variety of vegetable crops compared with CI and DI while maintaining a relatively stable water and fertilizer supply and microbial diversity in the rhizosphere in greenhouse and field trials [2,6,7,8]. Currently, few studies have evaluated whether NPI is able to reduce N loss and mitigate GHG emissions, especially N2O emissions, and there is no theoretical support. Therefore, this research aimed to employ irrigation regimes (CI and NPI) with a gradient of N availability to determine whether the growth and quality of lettuce are significantly different, to determine whether NPI can reduce the formation of NO3-N and the abundance of nitrifying activity in the soil, and to develop an understanding of the mechanism that is suppressing N2O emissions.

2. Materials and Methods
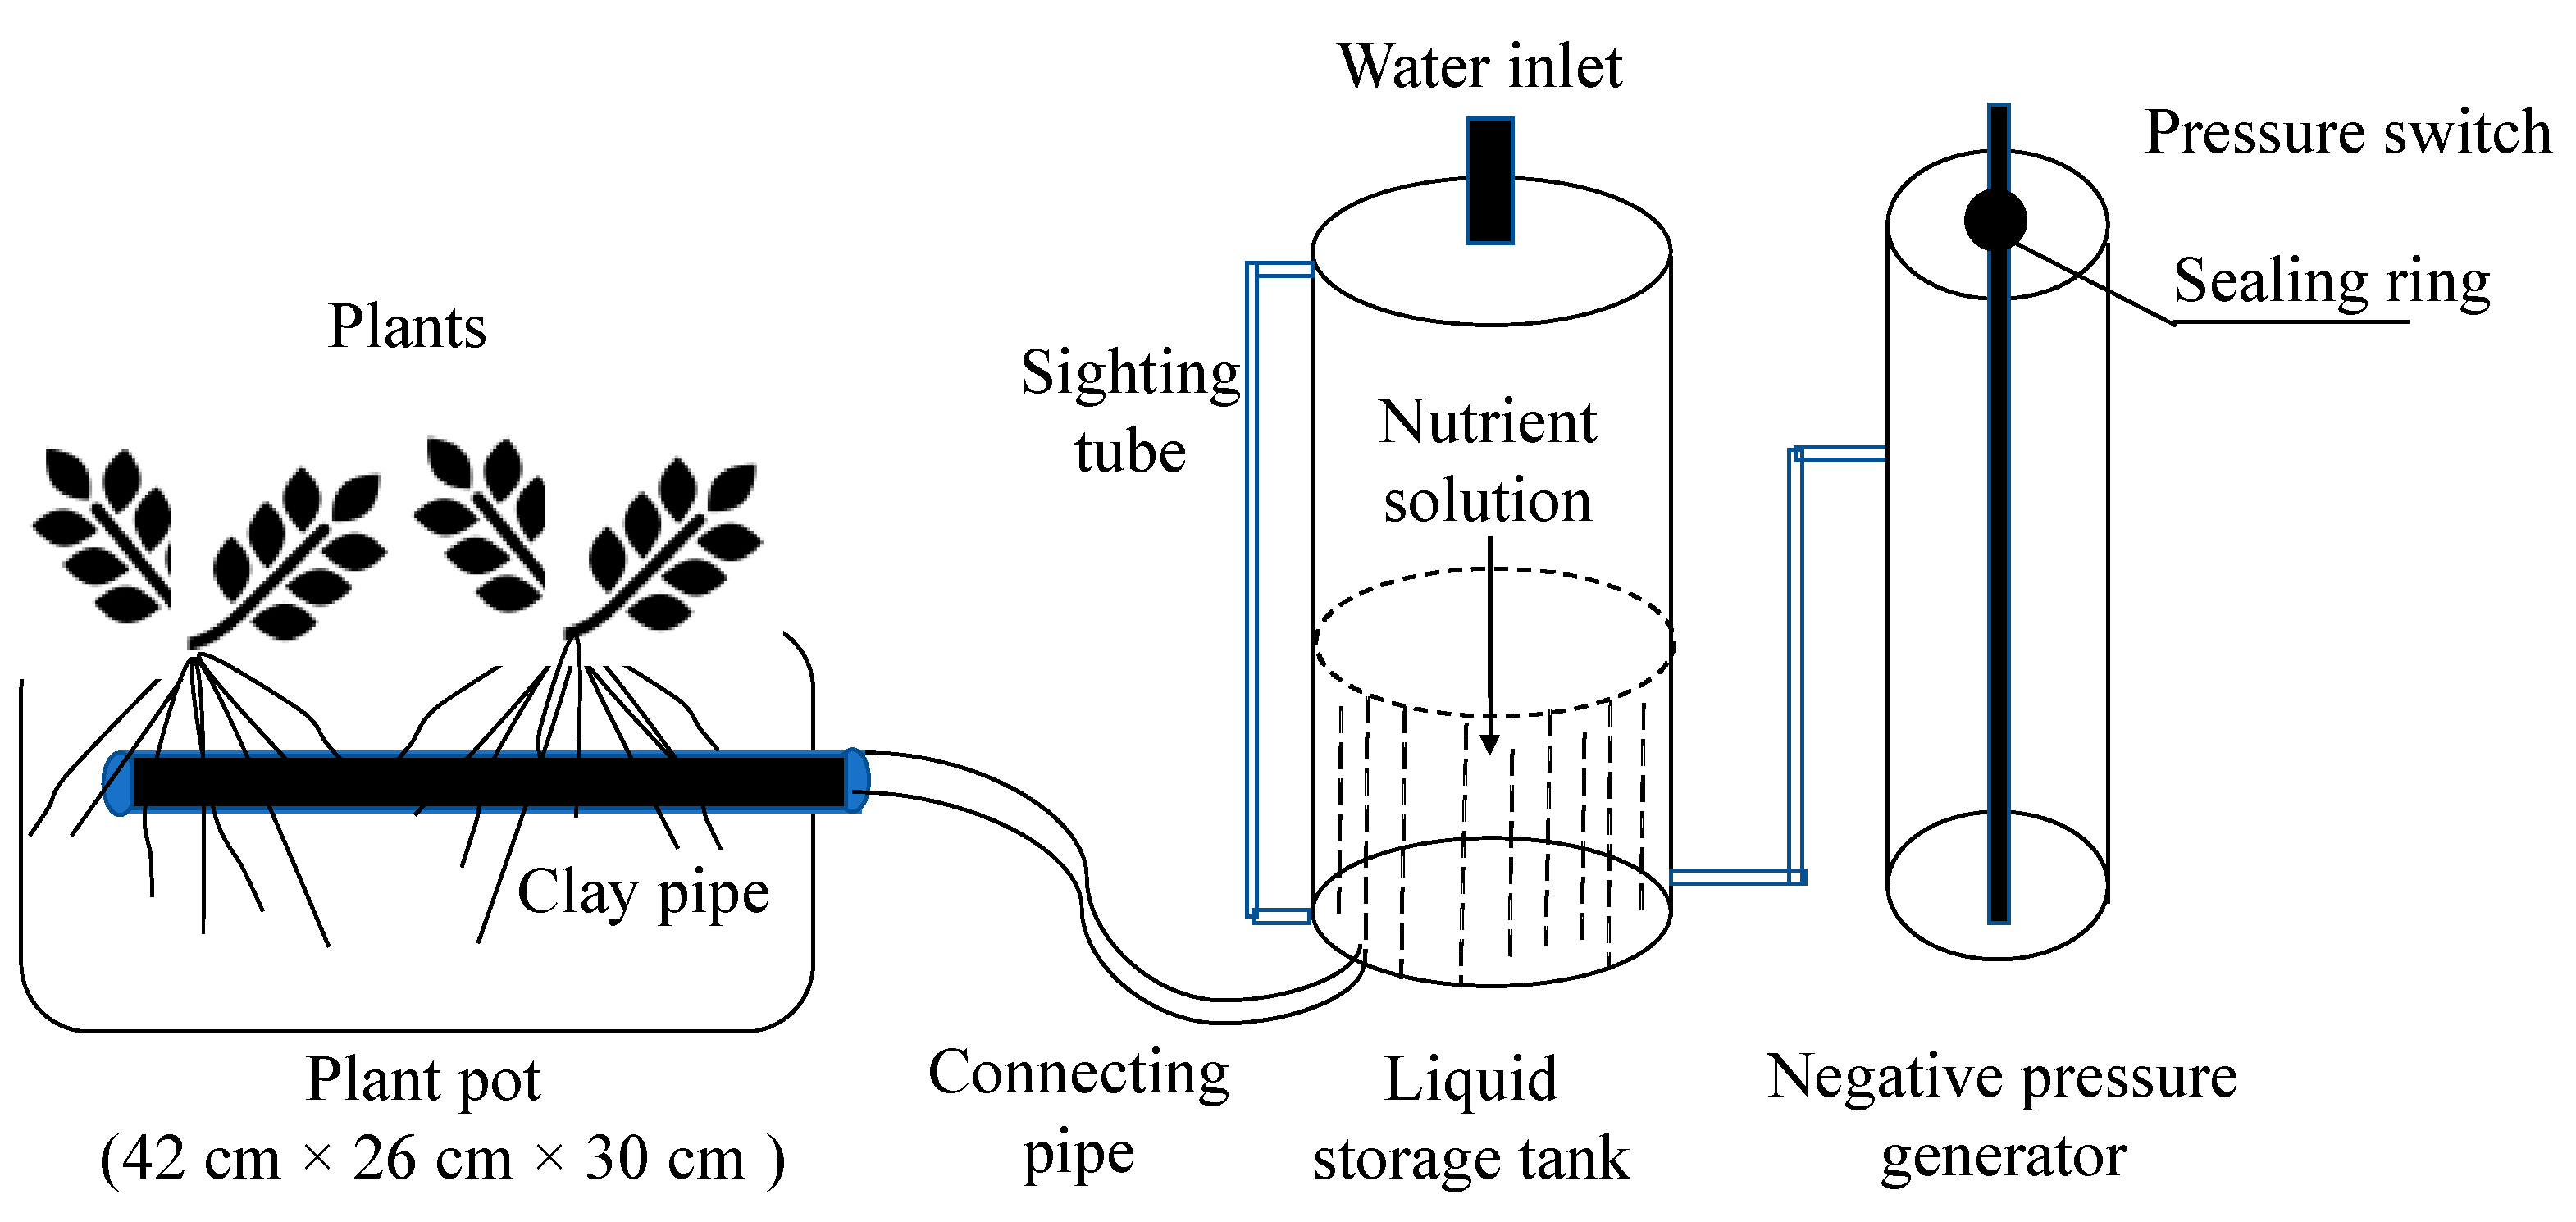
2.1. Materials

The NPI system was designed by the Chinese Academy of Agricultural Sciences (USA patent, 4235561A, and China patent, ZL201610329413.3) (Figure 1). It provides a constant water and nutrition supply to the rhizosphere zone for plant growth [2,3,4,5]. The CI treatment simply directly sprinkles water and fertilizer into the topsoil.
The greenhouse experiment was conducted at the Chinese Academy of Agricultural Sciences (116.3 E, 39.9 N). The tested soil was sandy loam with the following soil physical and chemical characteristics: bulk density, 1.36 g cm−3; pH 6.08; organic matter, 1.62%; total N, 1.52 g kg−1; available N, 18.57 mg kg−1; Olsen P, 16.26 mg kg−1; and available potassium, 82.37 mg kg−1. The greenhouse conditions were a day/night temperature regime of 30/25 °C, humidity maintained at 70%, the photosynthetic photon following the natural sunlight, and photoperiod in the season. The lettuce was supplied by the Chinese Academy of Agricultural Sciences.

2.2. Experimental Design

2.2.1. Experiment 1

The trial pots (40 cm × 25 cm × 25 cm) were filled with 30 kg of sandy loam. There was a total of 8 treatments, including the irrigation and N treatments, where the irrigation system was CI or NPI, and N consisted of 4 fertilizer concentrations: the different urea-N rates of 150, 120, 105, and 90 N kg ha−1, respectively. Four lettuce plants in each pot and the treatments were randomly arranged and repeated 3 times, and the standard concentration of a Hoagland solution formula for plant with a slight modification was supplied [2]. The fertilizer and water were mixed and supplied to the crop for absorption. According to the previous results of NPI experiments, the negative pressure value was set to −5 kPa, and the clay pipe for supplying water was buried 15 cm depth in the pot [2,5]. The water consumption of the NPI was the difference between the amount of water added to and released from the water storage tank (around 10 L). The water consumption of CI was approximately 13 L, and fertilization was carried out 0, 15, and 30 days after sowing. The CI treatment directly sprinkled water into the topsoil, and irrigation was performed 6 times (first 3 L, others time 2 L, for a total of 13 L water). When the NPI system is running, the irrigation emitter supplies water to the plant, and the amount of liquid at the surface of the storage tank will decline. The amount of water consumption can be obtained by recording the amount of water in the storage tank [2,5]. Harvest was conducted 42 days after sowing lettuce in a greenhouse in April 2017.

2.2.2. Experiment 2

Based to the results of Experiment 1, further research in Experiment 2 was performed with same equipment. This included the irrigation and N treatments, where the irrigation system was CI or NPI, and N consisted of 2 fertilizer concentrations for CI: a traditional urea-N rate of 150 N kg ha−1 (CI-N150) or CI-N150 with dicyandiamide (DCD, Sigma, MO, USA) at 10% of the applied N (CI-N150 + DCD). For NPI, the N was NPI-N150 (150 N kg ha−1) or NPI-N105 (105 N kg ha−1), based on the yield results of Experiment 1. According to the soil weight of 2.25 million kg per ha, the dosage of nitrogen fertilizer is 150 kg/ha. In this study, 2 g of N was requested for 30 kg of soil by calculating, and the urea-N contained an N amount of 46%, with 150 kg of N dosage for 4.35 g/pot. A total of 105 kg N/ha was requested for 3.05 g/pot. Harvest was conducted 42 days after sowing lettuce in a greenhouse in June 2017. In addition, 10 g soil samples were collected at 0, 4, 8, and 12 days after the third fertilization (30 days after sowing) and core soil sampled (0–25 cm) for determination of their nitrate and ammonium contents, respectively, to minimize damage to plant roots. The agronomic management and pest control of vegetables followed local greenhouse practices [2].

2.3. Analyses

The yield and quality of the plants, as well as their N contents, were measured after harvest. The fresh weight of the lettuce in each pot was measured as the yield, the nitrate content was determined by salicylic acid colorimetry, the soluble sugar by anthrone colorimetry, and vitamin C (VC) by 2,6-chlorophenol spectrophotometry [2]. In addition, the plants were dried at 75 °C until completely dry and then crushed to test their concentrations of N (Kjeldahl 2300; FOSS, Hoganas, Sweden). The N content of the plants (mg pot−1) = biomass (g) × N concentration (mg g−1) [2].
Water use efficiency (WUE, g kg−1) = yield/water consumption × 100%, where yield was the fresh weight (g pot−1), and the water consumption of NPI and CI was approximately 10 L and 13 L, respectively. Partial factor productivity (PFP) of the applied N = yield/applied N amount (kg kg−1).
The soil samples were used to determine the NO3-N and NH4+-N contents with a FIAstar 5000 continuous flow injection analyzer (FOSS, Swiss). The soil apparent nitrification rate (ANR) = NO3-N/(NH4+-N + NO3-N) × 100%, and the data for nitrate and ammonium were derived from the soil measured at harvest. Soil urease and nitrate reductase activity were determined by colorimetric technique methods [33]. Soil DNA was extracted from the rhizosphere soil using a DNA Spin Kit for soil (OMEGA, GA, USA) according to the manufacturer’s instructions. Quantitative PCR (qPCR) was conducted to assess the abundance of the amoA genes of both ammonia-oxidizing bacteria (AOB) and ammonia-oxidizing archaea (AOA). amoA-AOA, GenF: ATAGAGCCTCAAGTAGGAAAGTTCTA, GenR: CCAAGCGGCCATCCAGCTGTATGTCC. amoA-AOB, Fomd: CTGGGGTTCTACTGGTGGTC, GenR: GCAGTGATCATCCAGTTGCG [34].
In Experiment 2, the rhizosphere soil attached to the plant roots was collected to determine the composition of the bacterial communities. High-throughput sequencing was conducted by Beijing Allwegene Technology Co. Ltd. The QIIME (v1.8.0) software was applied to quantify the abundance of Nitrospira at the genus level.
The N2O emissions experiment used 100 mL glass bottles containing 10 g rhizosphere soil (the oven dry equivalent) and 200 mg N kg−1 (NH4)2SO4. The microcosms were incubated in 70% water-filled pore space in the dark at 20 °C with 80% RH for 18 days. After 24 h of incubation, a 20 mL gas sample was taken from the headspace with a syringe at different sampling intervals on days 1, 3, 5, 7, 9, 11, 13, 15, and 18 and injected into a 10 mL prevacuum vial. All bottles were ventilated thoroughly for 2 min by an aeration pump after sampling. N2O was measured with a gas chromatograph fitted with an electron capture detector (HP7820A, Agilent, CA, USA). The cumulative N2O emissions were summed at the different sampling days. The N2O incubation method followed Hink (2018) [35].

2.4. Statistical Analysis

All data from the experiments were statistically analyzed by ANOVA using Excel 2010 and SAS 9.1 software (SAS Inc., Cary, NC, USA).

3. Results

3.1. Performance of the Lettuce in Experiment 1

NPI improved the performance of lettuce (Table 1). Compared with CI, NPI increased the yield and total N content by an average of 25% and 38%, respectively. Meanwhile, NPI reduced plant nitrate content by an average of 20%. NPI increased WUE and PFP by an average of 49% and 26%, respectively. In addition, there was not significant difference between the yields of N150 and N105 treatments under NPI, but N105 treatment reduced the nitrate content by 14% and also increased PFP by 37% compared to N150 treatment.

3.2. Yield and Quality of Lettuce in Experiment 2

NPI can promote the yield and quality of lettuce in greenhouse production (Table 2). N150 under the NPI treatment significantly increased the yield of lettuce by 18% and 10% compared to the same N levels and DCD addition under CI, respectively. Although the NPI-N105 treatment reduced the N application by 30%, the lettuce yield was still 10% higher than that of CI-N150, but there was no noteworthy difference between it and the CI-N150 + DCD treatment. The N content of the plants also had a similar trend: NPI-N150 had the highest N content, and CI-150 had the lowest N content.
Compared with the CI treatment, the NPI treatment increased the soluble sugar and VC contents and decreased the nitrate content of the lettuce (Table 2). For example, the soluble sugar content of NPI-N150 was significantly increased by 5.4% and 9.2% compared with the two CI treatments, respectively. NPI-N105 had the lowest nitrate content at 352 mg kg−1, which was 29% lower than that of the CI-N150 treatment.

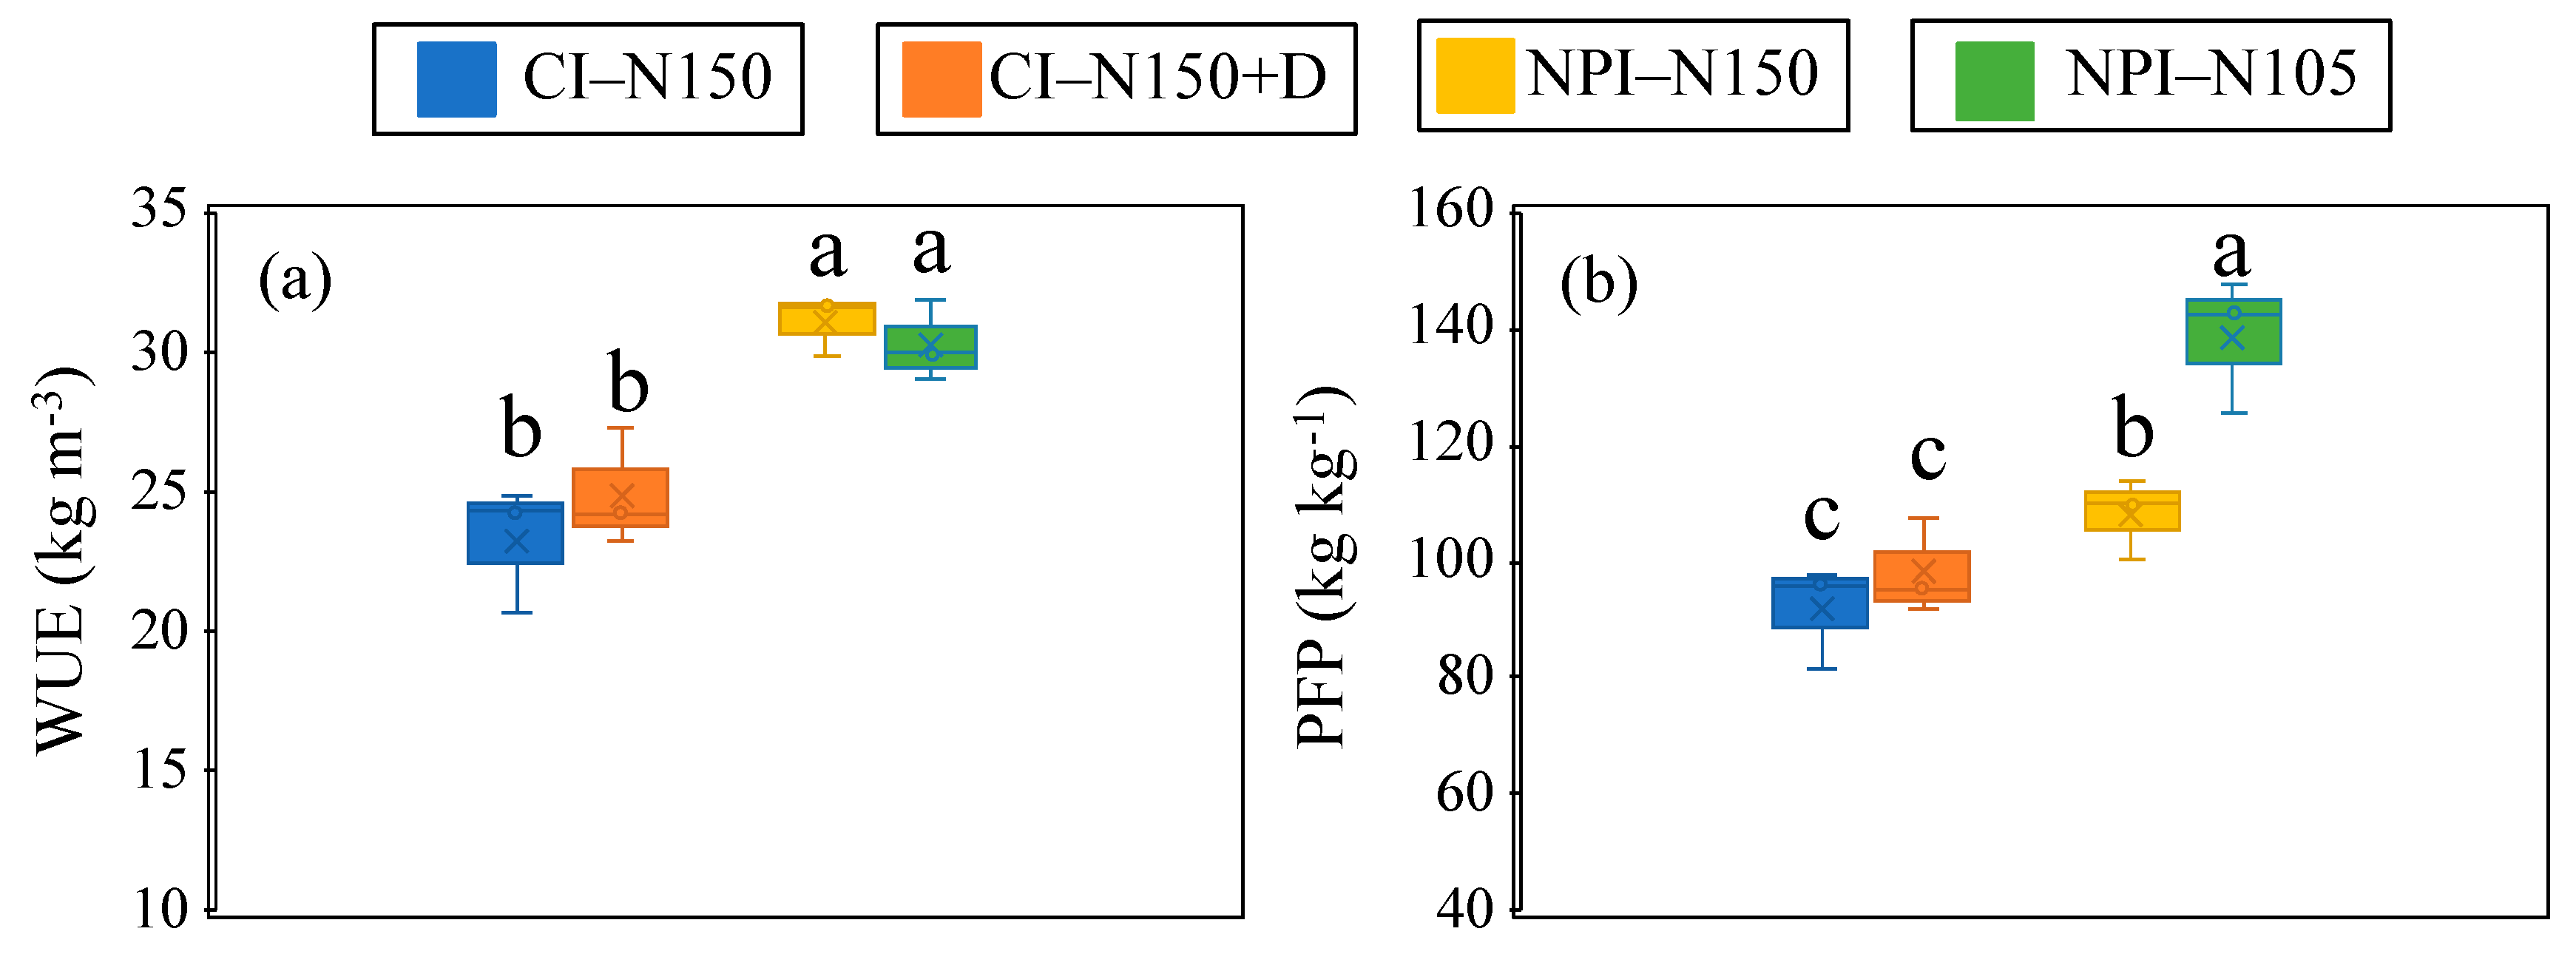
3.3. Water Use Efficiency and Partial Factor Productivity of Applied N
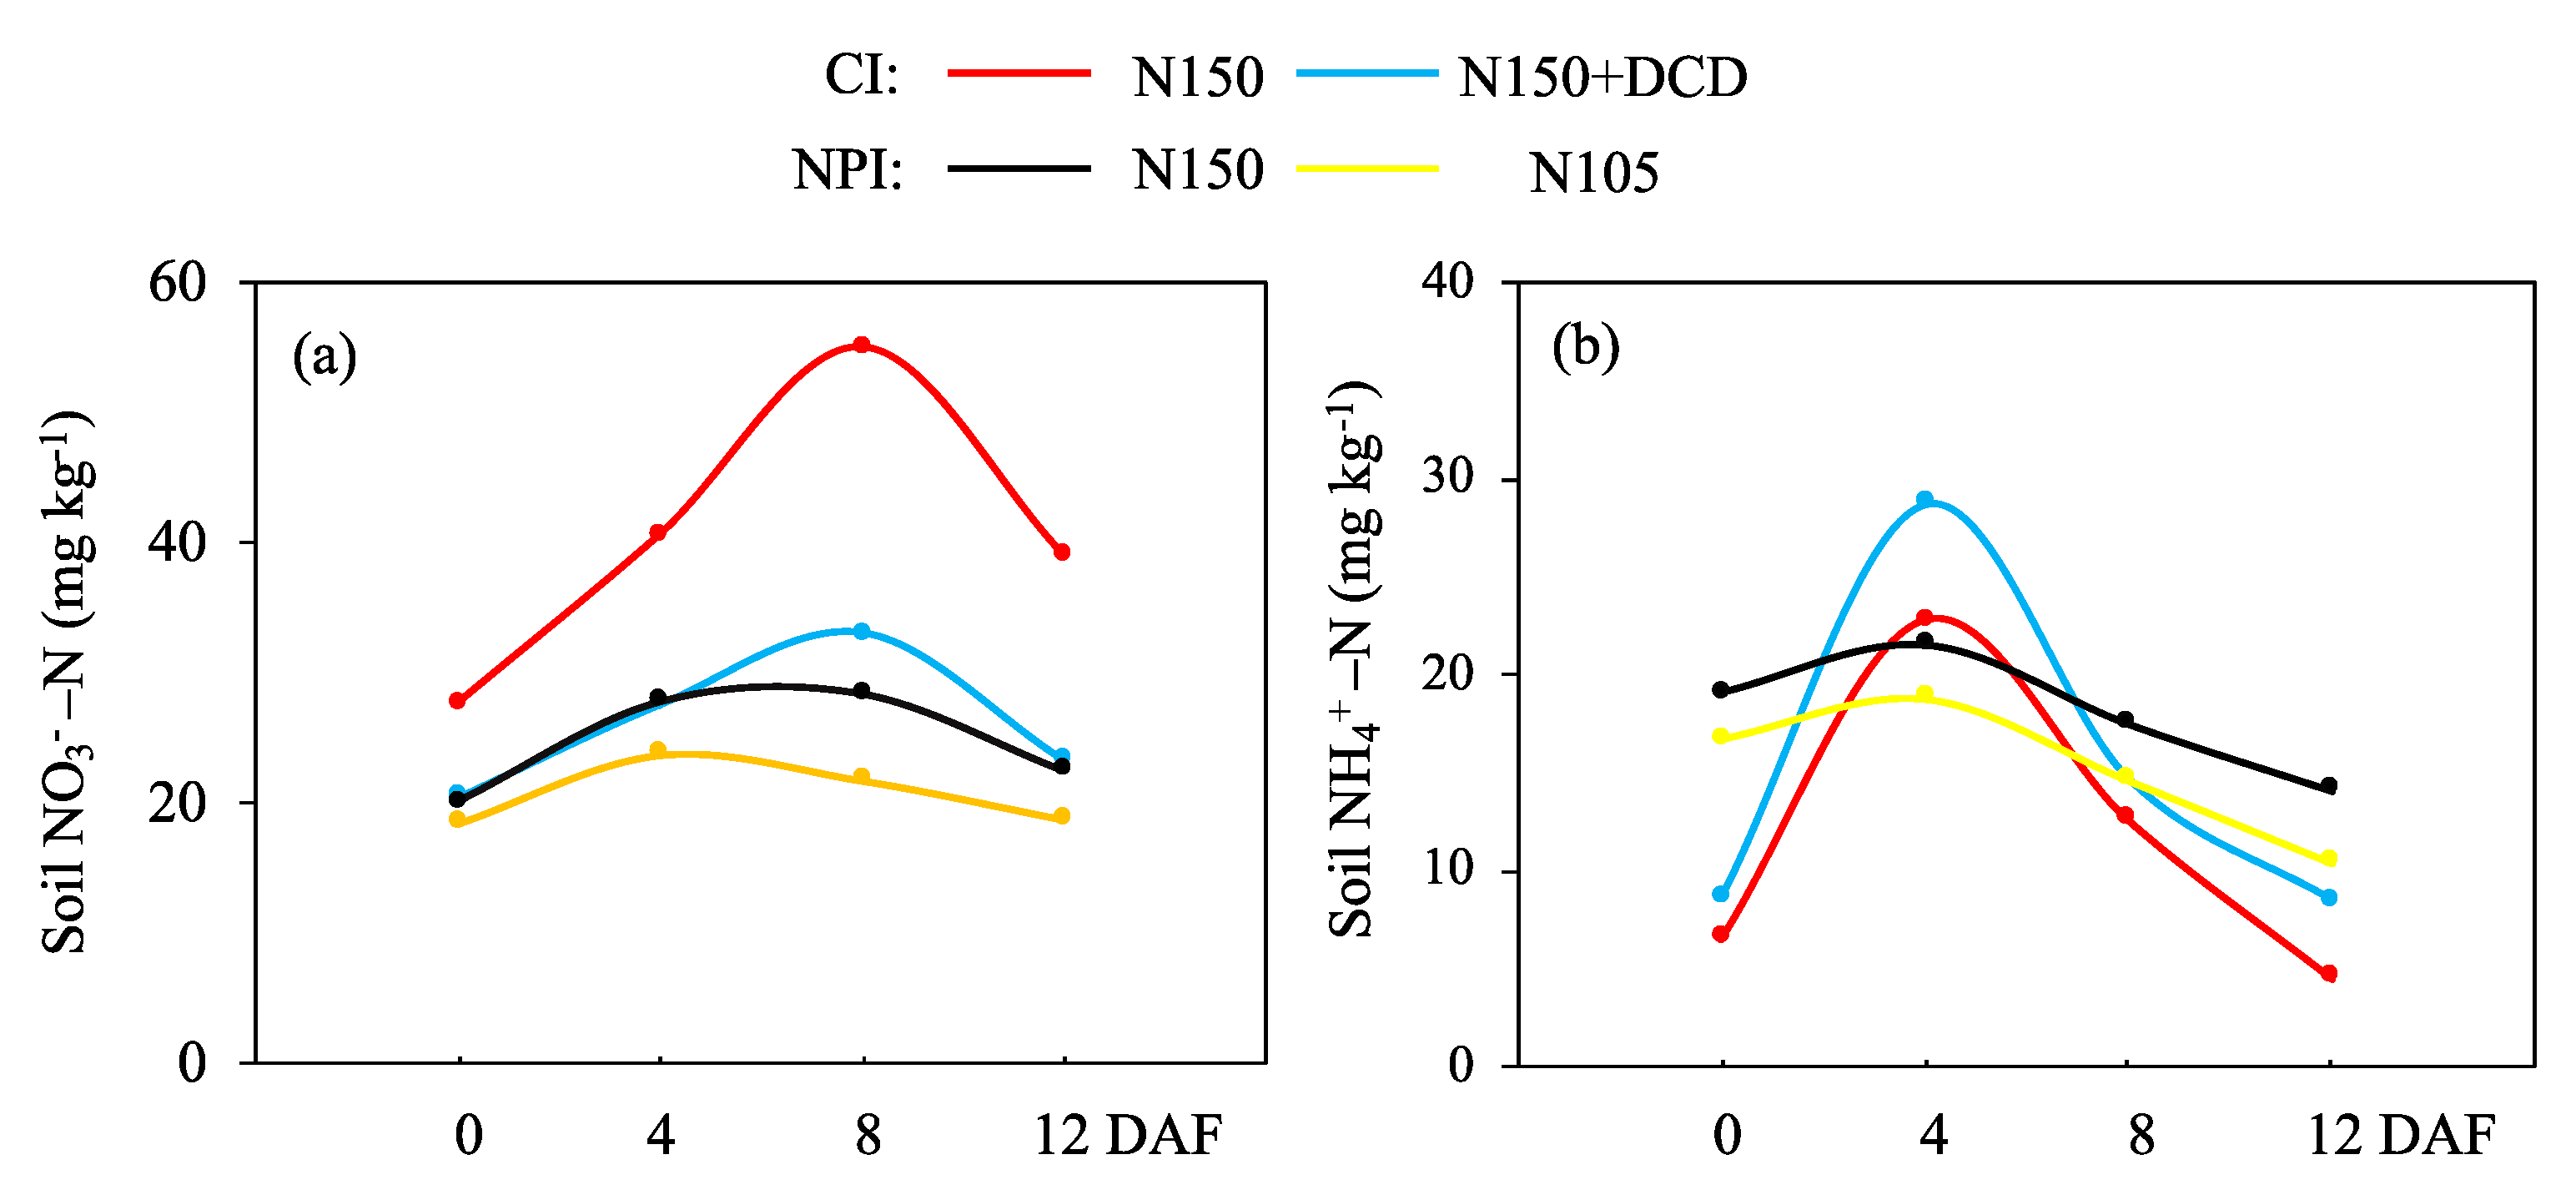
According to the results shown in Figure 2, the WUE and PFP of the NPI treatments were remarkably higher than those of CI, but there was no significant difference in WUE at the two N levels under NPI, and the DCD addition did not notably improve WUE in the CI treatment. Compared with CI-N150, NPI-N150′s WUE and PFP were conspicuously promoted by 33% and 17%, respectively. These results show that NPI could reduce water and nutrient applications.

3.4. Dynamic Change of Soil NO3-N and NH4+-N Content

The contents of soil NO3-N and NH4+-N were influenced by irrigation patterns and N treatments, which fluctuated slightly under the NPI treatment, resulting in inhibition of the formation of NO3-N (Figure 3a). CI-N150 maintained the highest soil NO3-N level, with the highest peak appearing on the 8th day after N fertilizer application, and the content reached 55 mg kg−1. For the NH4+-N in the soil, the NPI maintained minor fluctuations, implying that it can continuously and stably supply N fertilizer to crops and reduce the loss of nitrate (Figure 3b). After applying N fertilizer, the CI treatment reached its peak on the 4th day and then dropped rapidly. On the 12th day after N application, the NH4+-N of the NPI improved by an average of 88% compared with CI (Figure 3b).

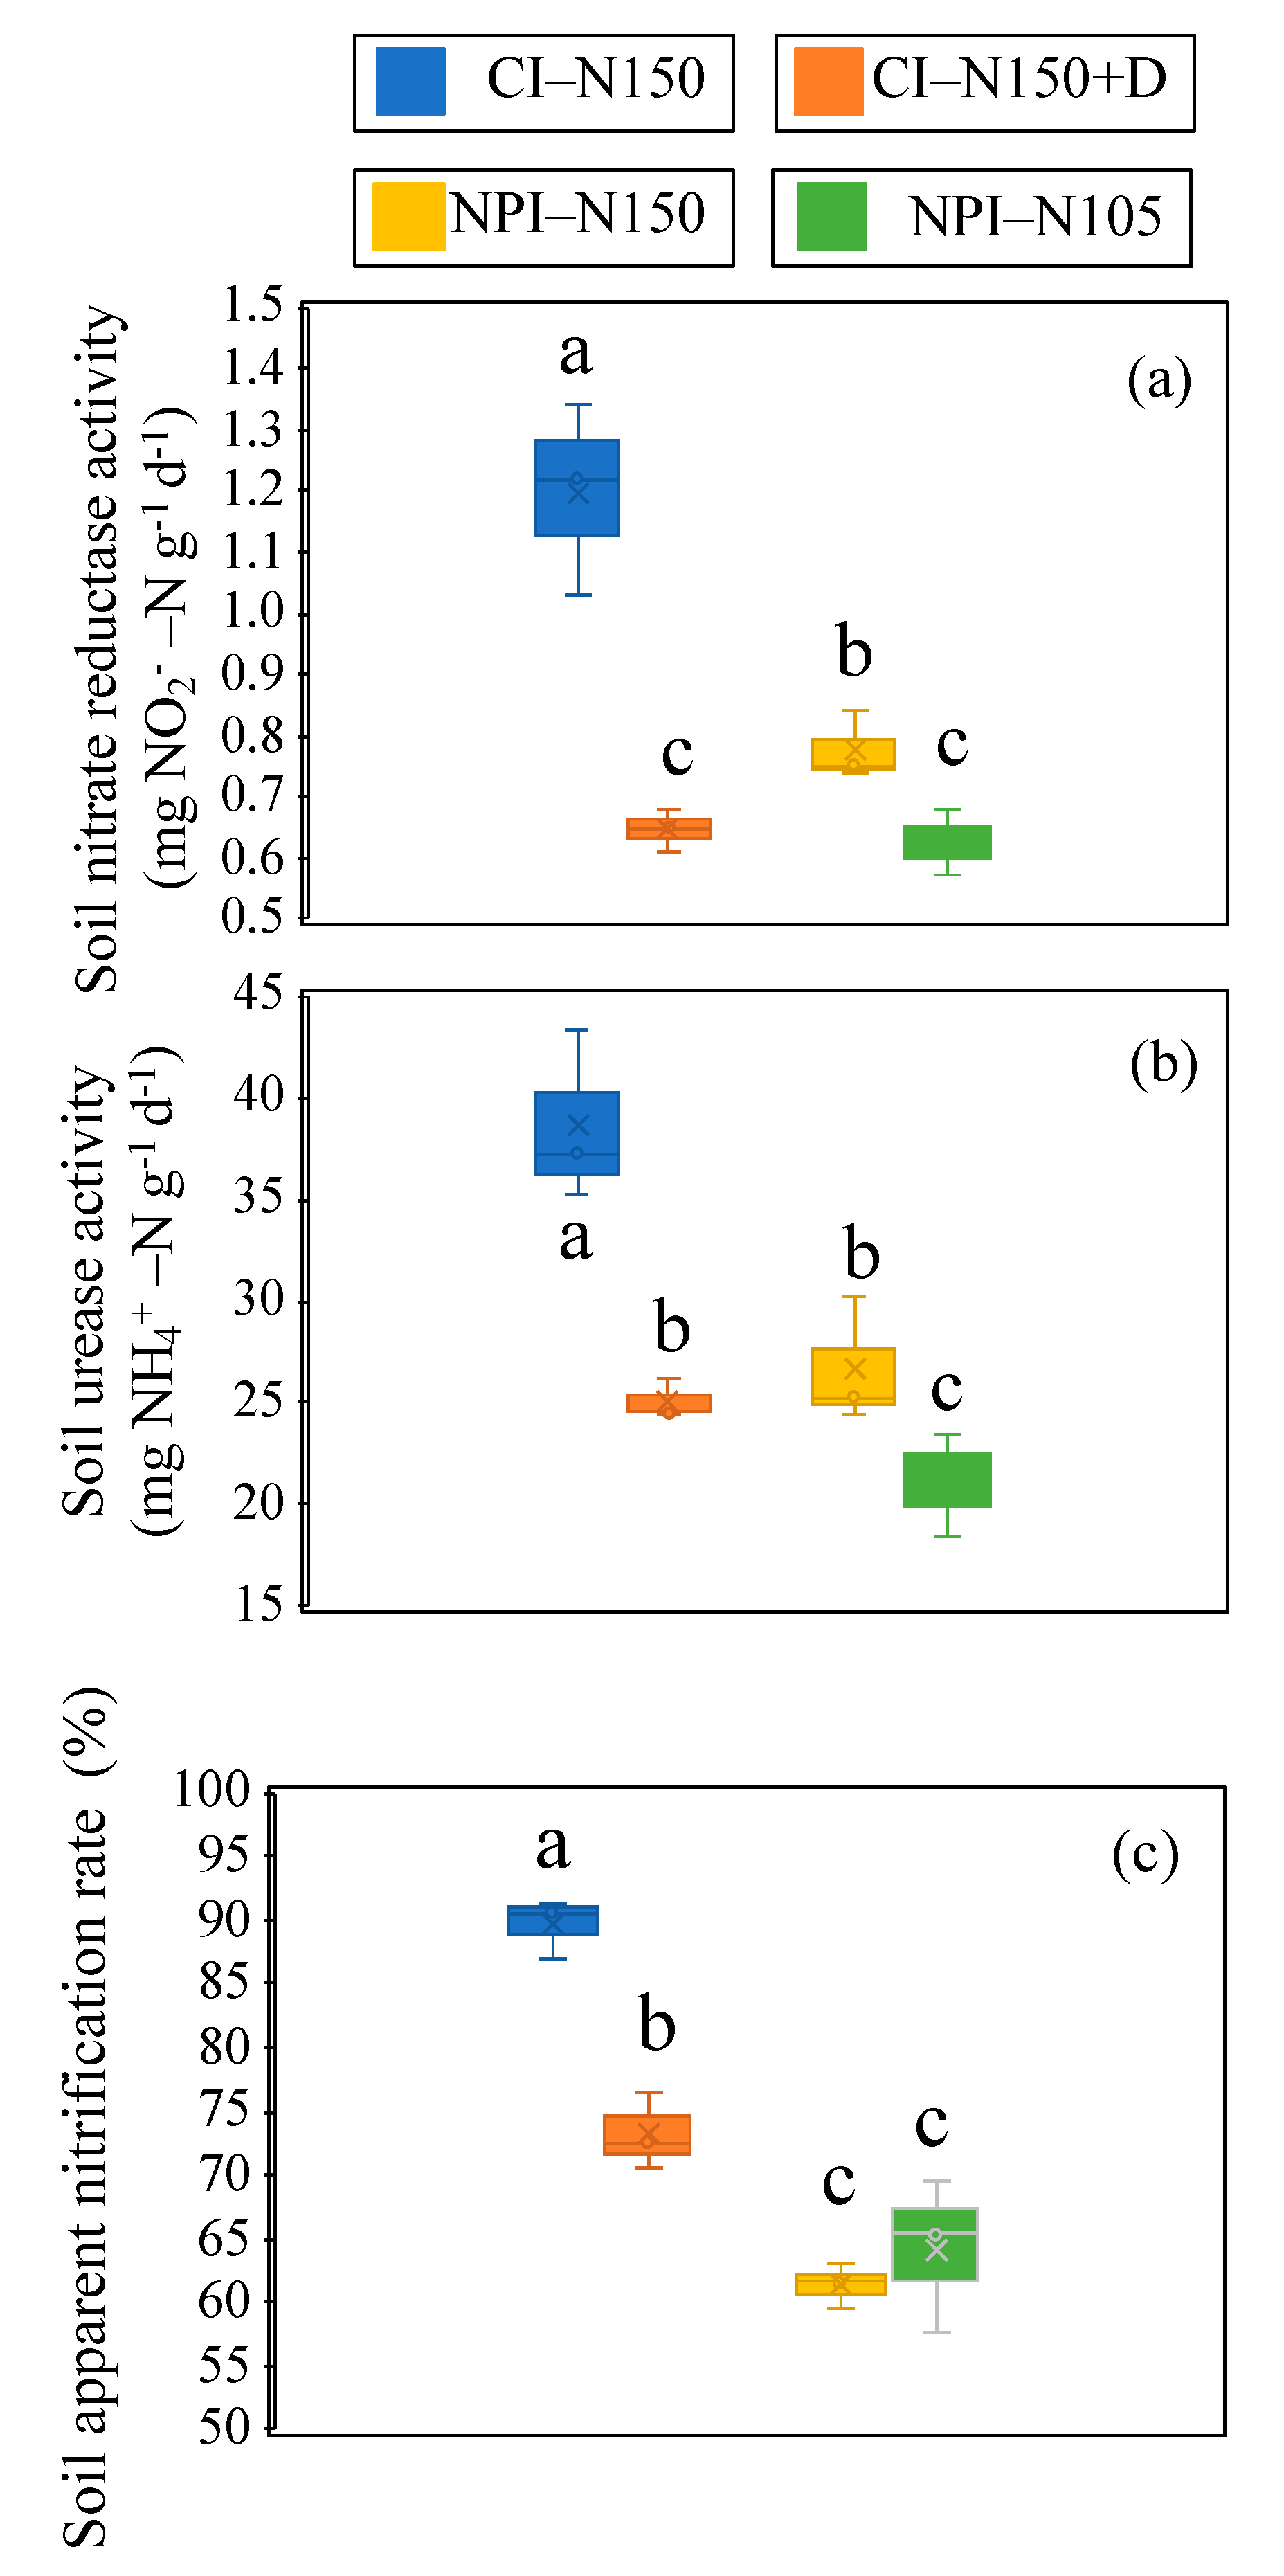
3.5. Soil Apparent Nitrification Rate, Nitrate Reductase and Urease Activities

As shown in Figure 4, the NPI system and DCD addition prominently reduced the activity of soil nitrate reductase (SNR) and urease (SUA). Soil SNR, compared with CI-N150 and NPI-N150 with DCD, decreased by 35% and 46%, respectively. In addition, by reducing the N application under NPI-N105, the soil SNR was also reduced by 19% compared with that under NPI-N150 (Figure 4a). There was a similar trend for SUA; CI-N150 reached the highest activity, while NPI-N105 had the lowest activity. NPI significantly reduced the soil apparent nitrification rate (ANR), but there was no difference between the two N treatments of NPI (Figure 4c). For example, compared with CI-N150 treatment, the NPI-N150 conspicuously decreased by 32%, and the addition of DCD reduced it by 18% for CI.

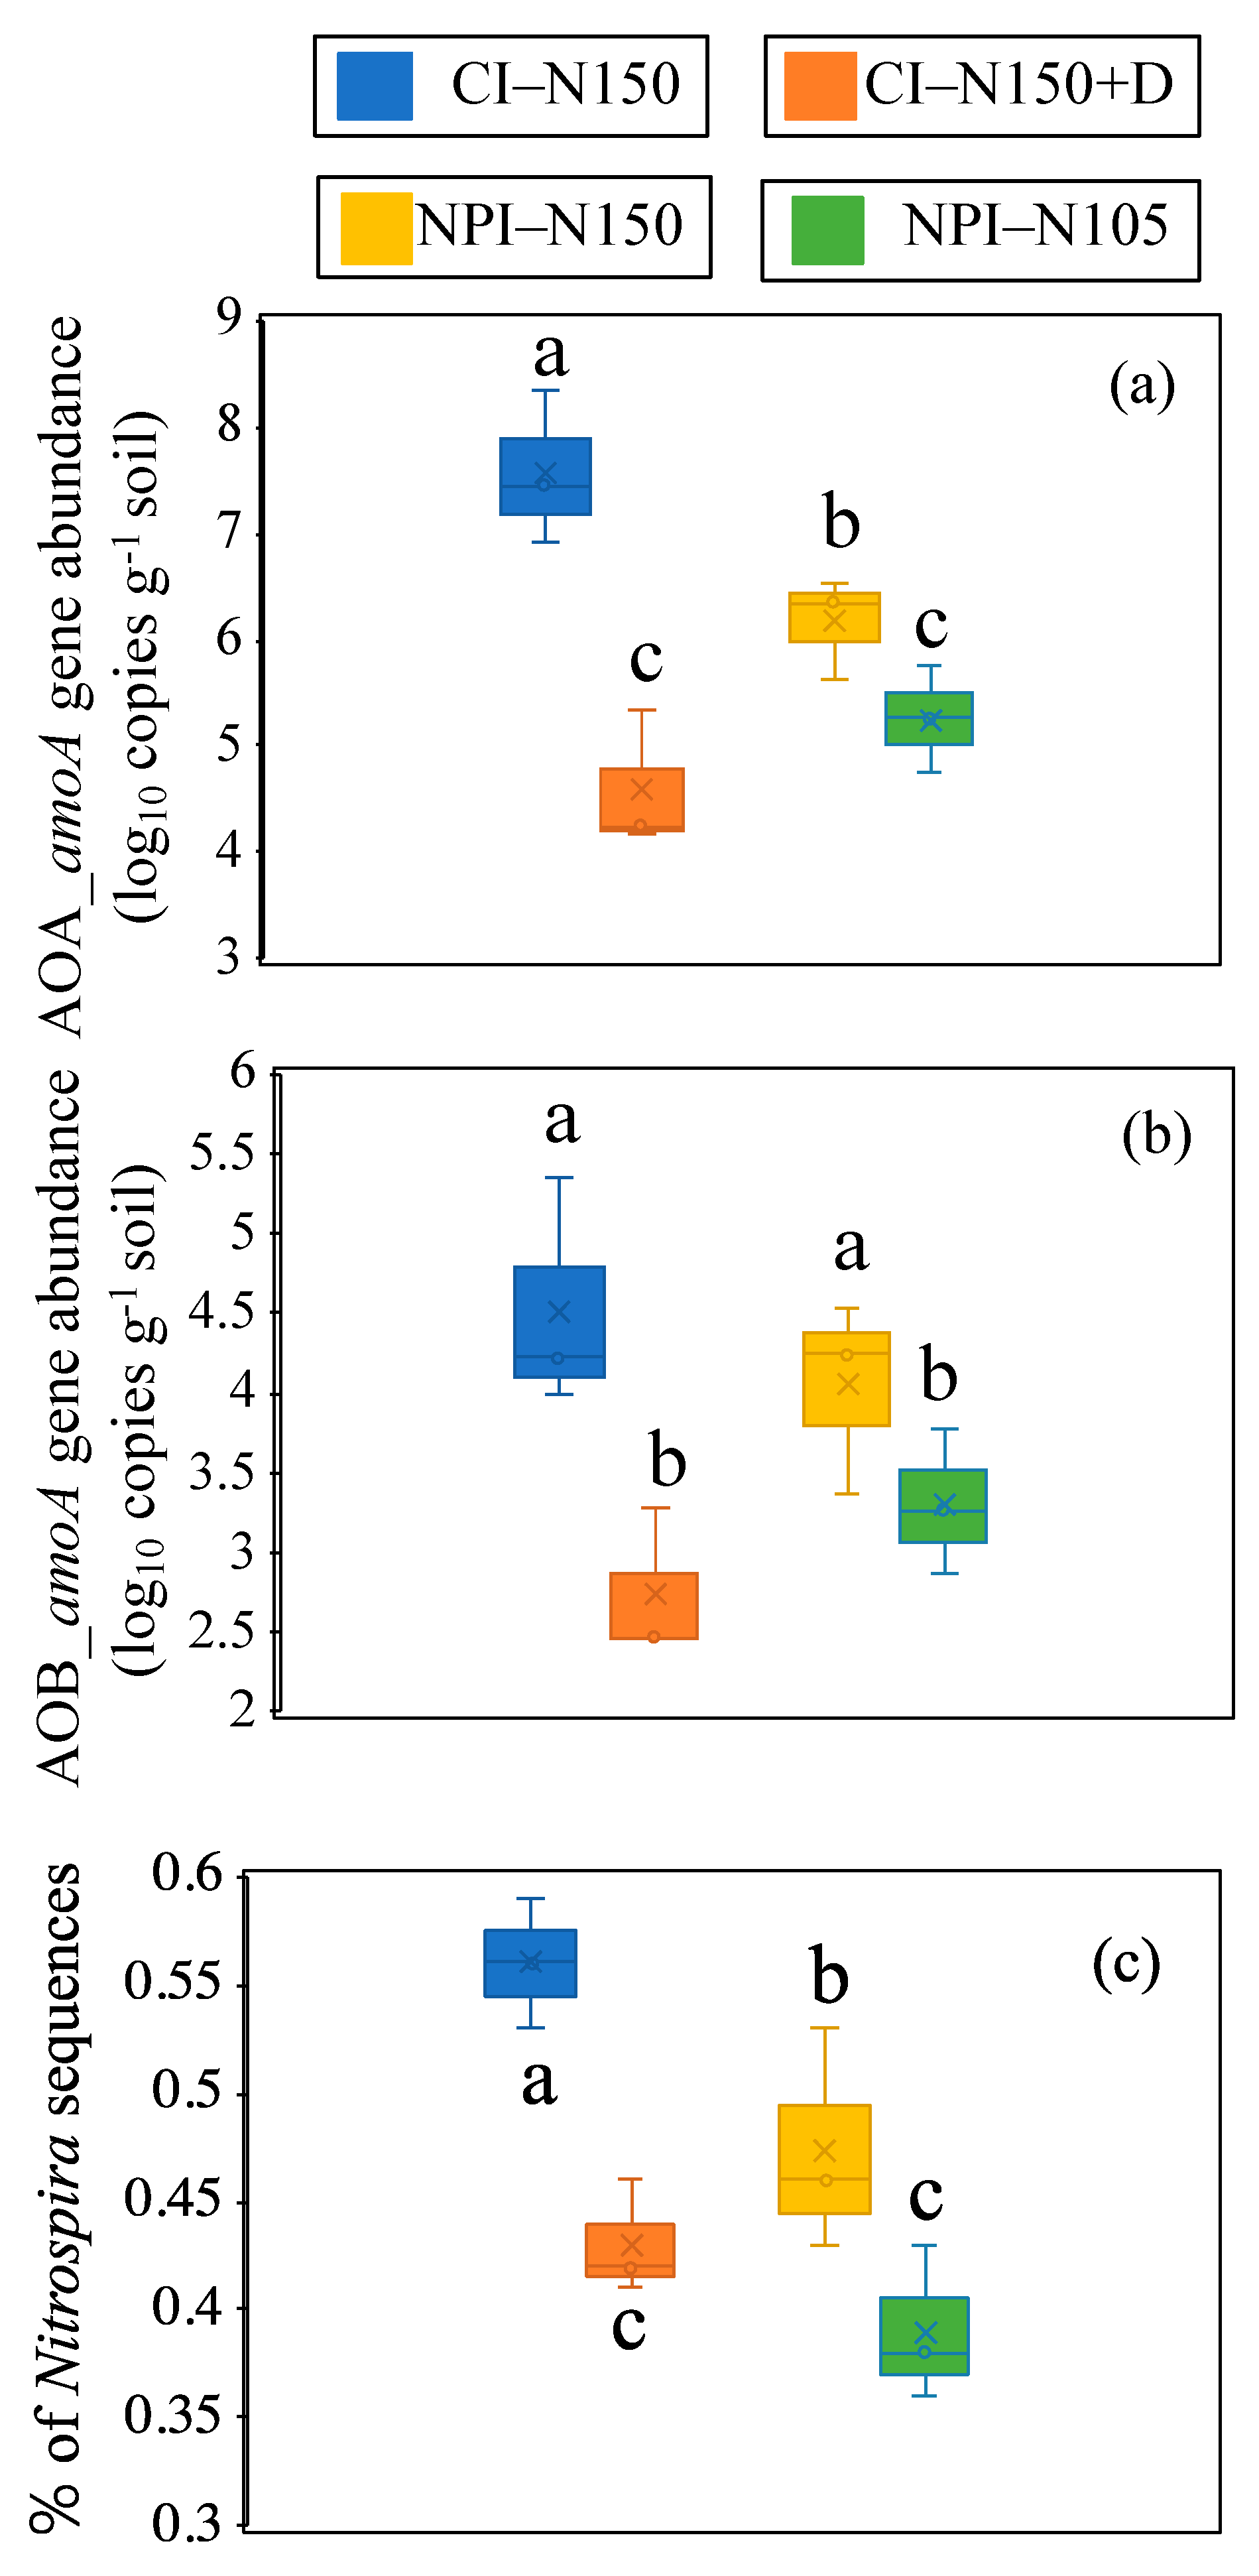
3.6. AOA and AOB Gene, Nitrospira Abundance

The results show that the NPI and DCD addition treatments noticeably decreased the AOA and AOB gene copies as well as abundance of Nitrospira at genus level in the rhizosphere soil of lettuce (Figure 5). For example, for AOA gene abundance, N150 showed the highest copy number in the CI treatment, followed by NPI-N150, while the values were the lowest with DCD addition. The DCD treatment was significantly reduced by 23% compared with CI under the same N150 condition (Figure 5a). The abundance of AOB had a similar trend; the highest abundance was in the CI-N150 treatment, and the lowest was in the DCD treatment (Figure 5b). The abundance of Nitrospira was 16% lower under NPI-N150 than CI-N150.

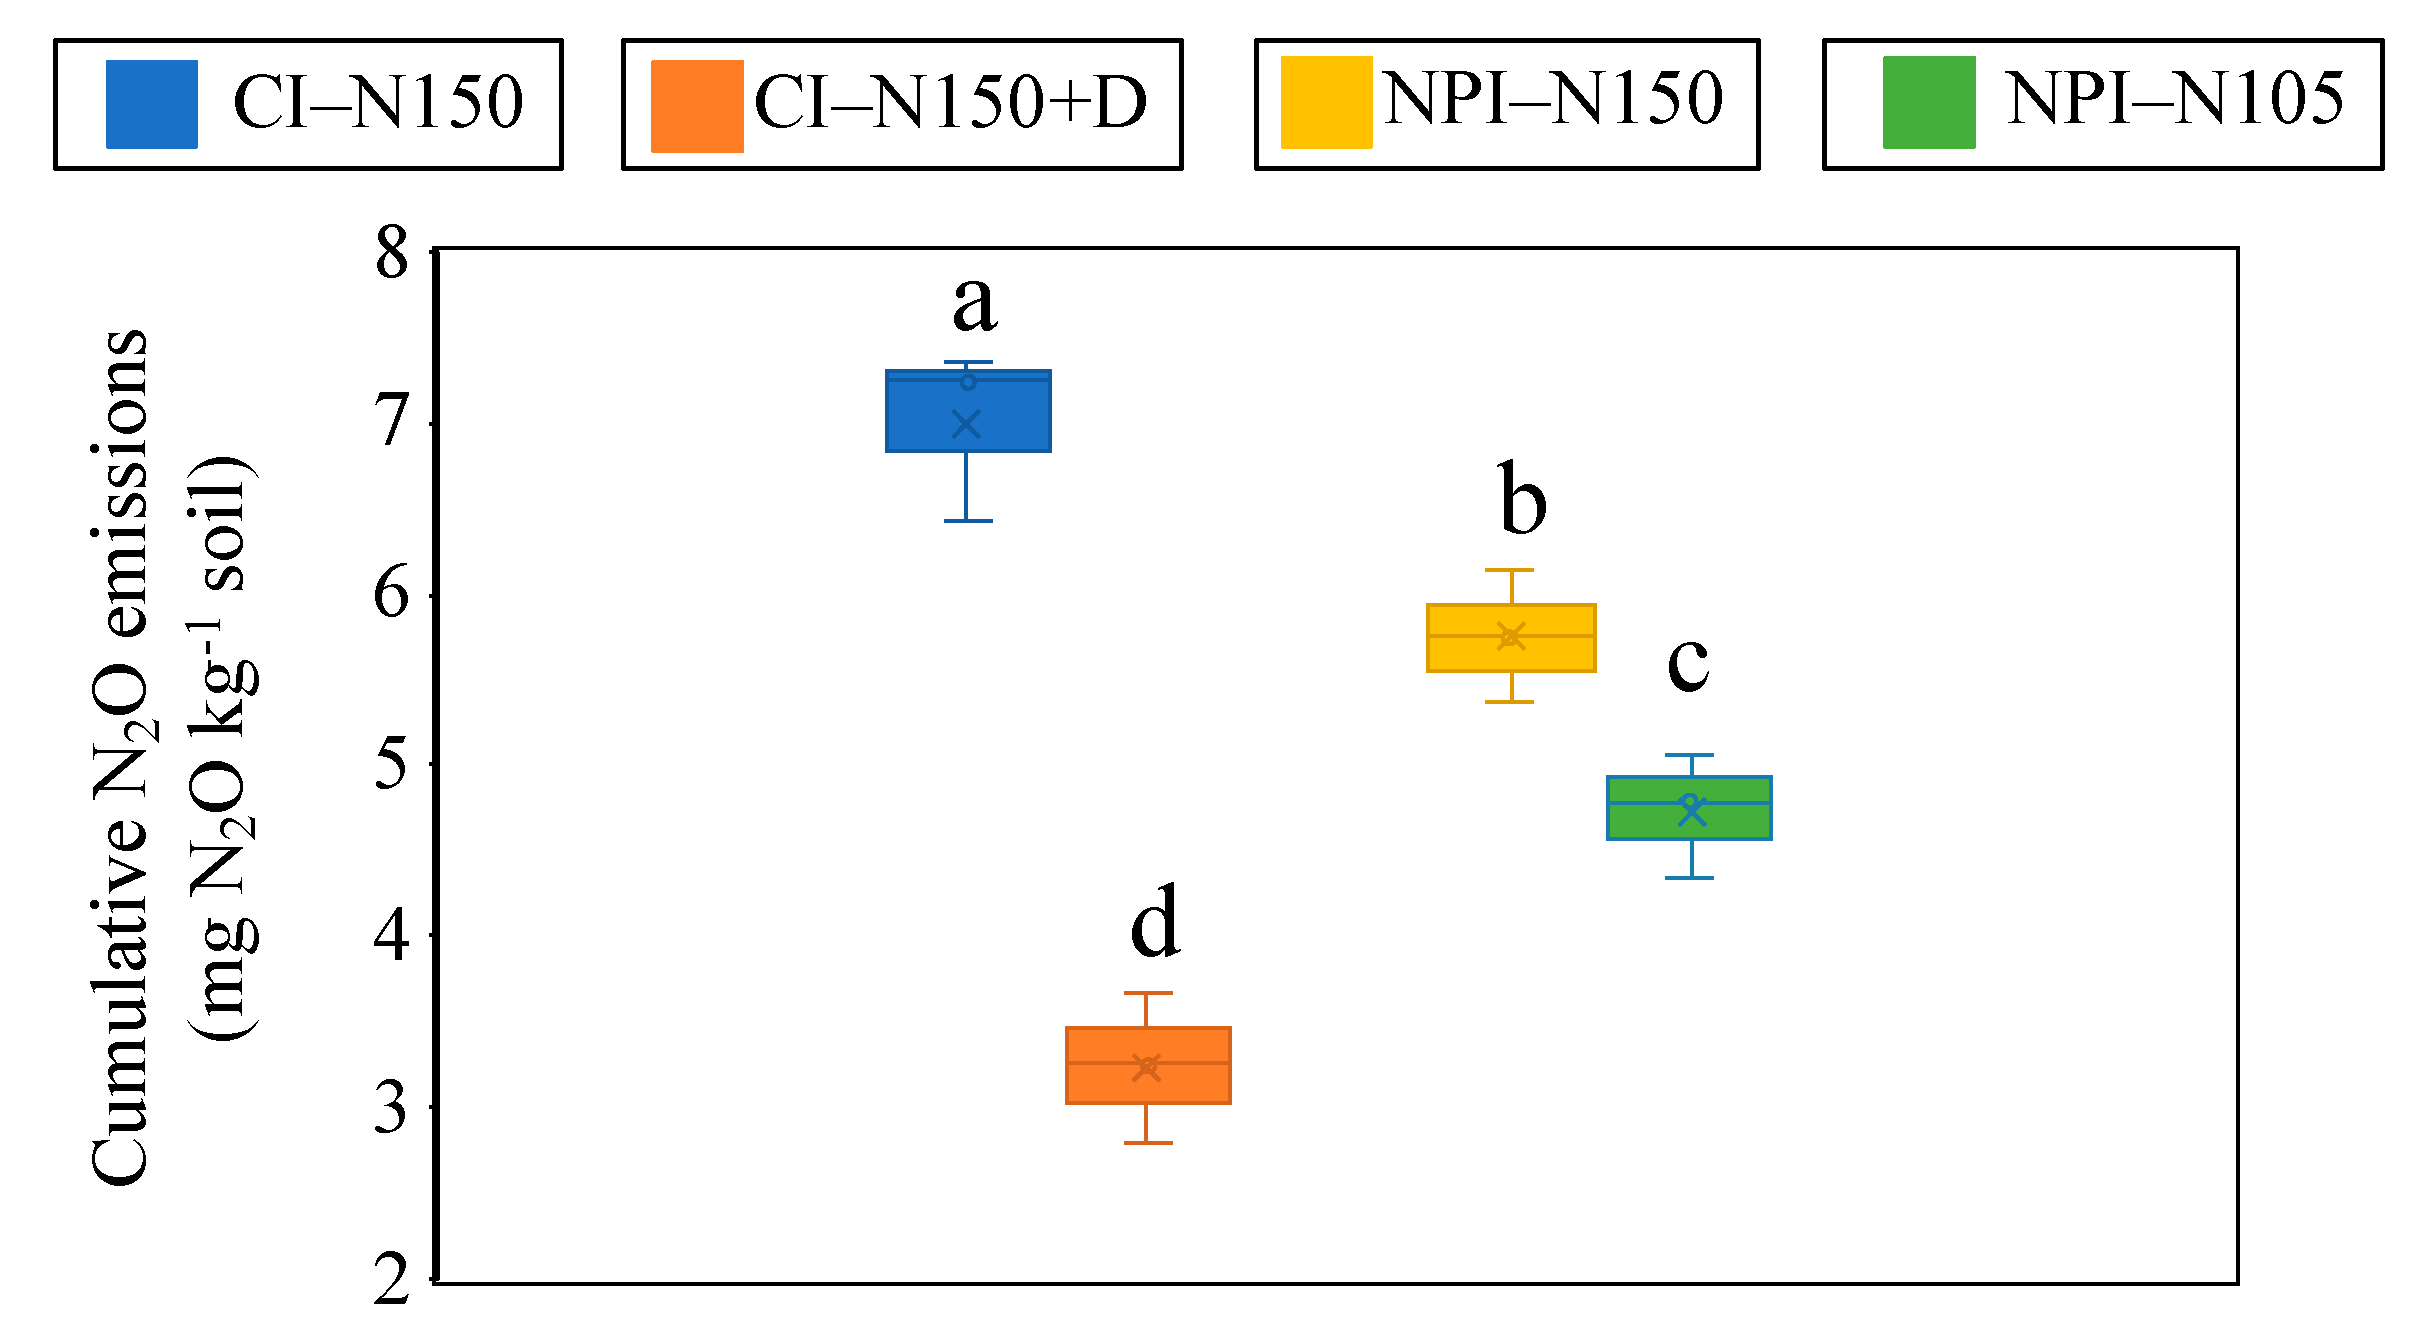
3.7. Cumulative N2O Emissions

The soil incubation experiment showed that the DCD addition had the most prominent inhibitory effect on N2O emissions (Figure 6). Under the CI-150 treatment, the addition of DCD reduced the emissions by 54%, and NPI-N150 notably decreased the emissions by 18%. Moreover, by reducing the amount of N applied in the NPI system, the emission of N2O was also reduced by 32% compared with CI-N150.

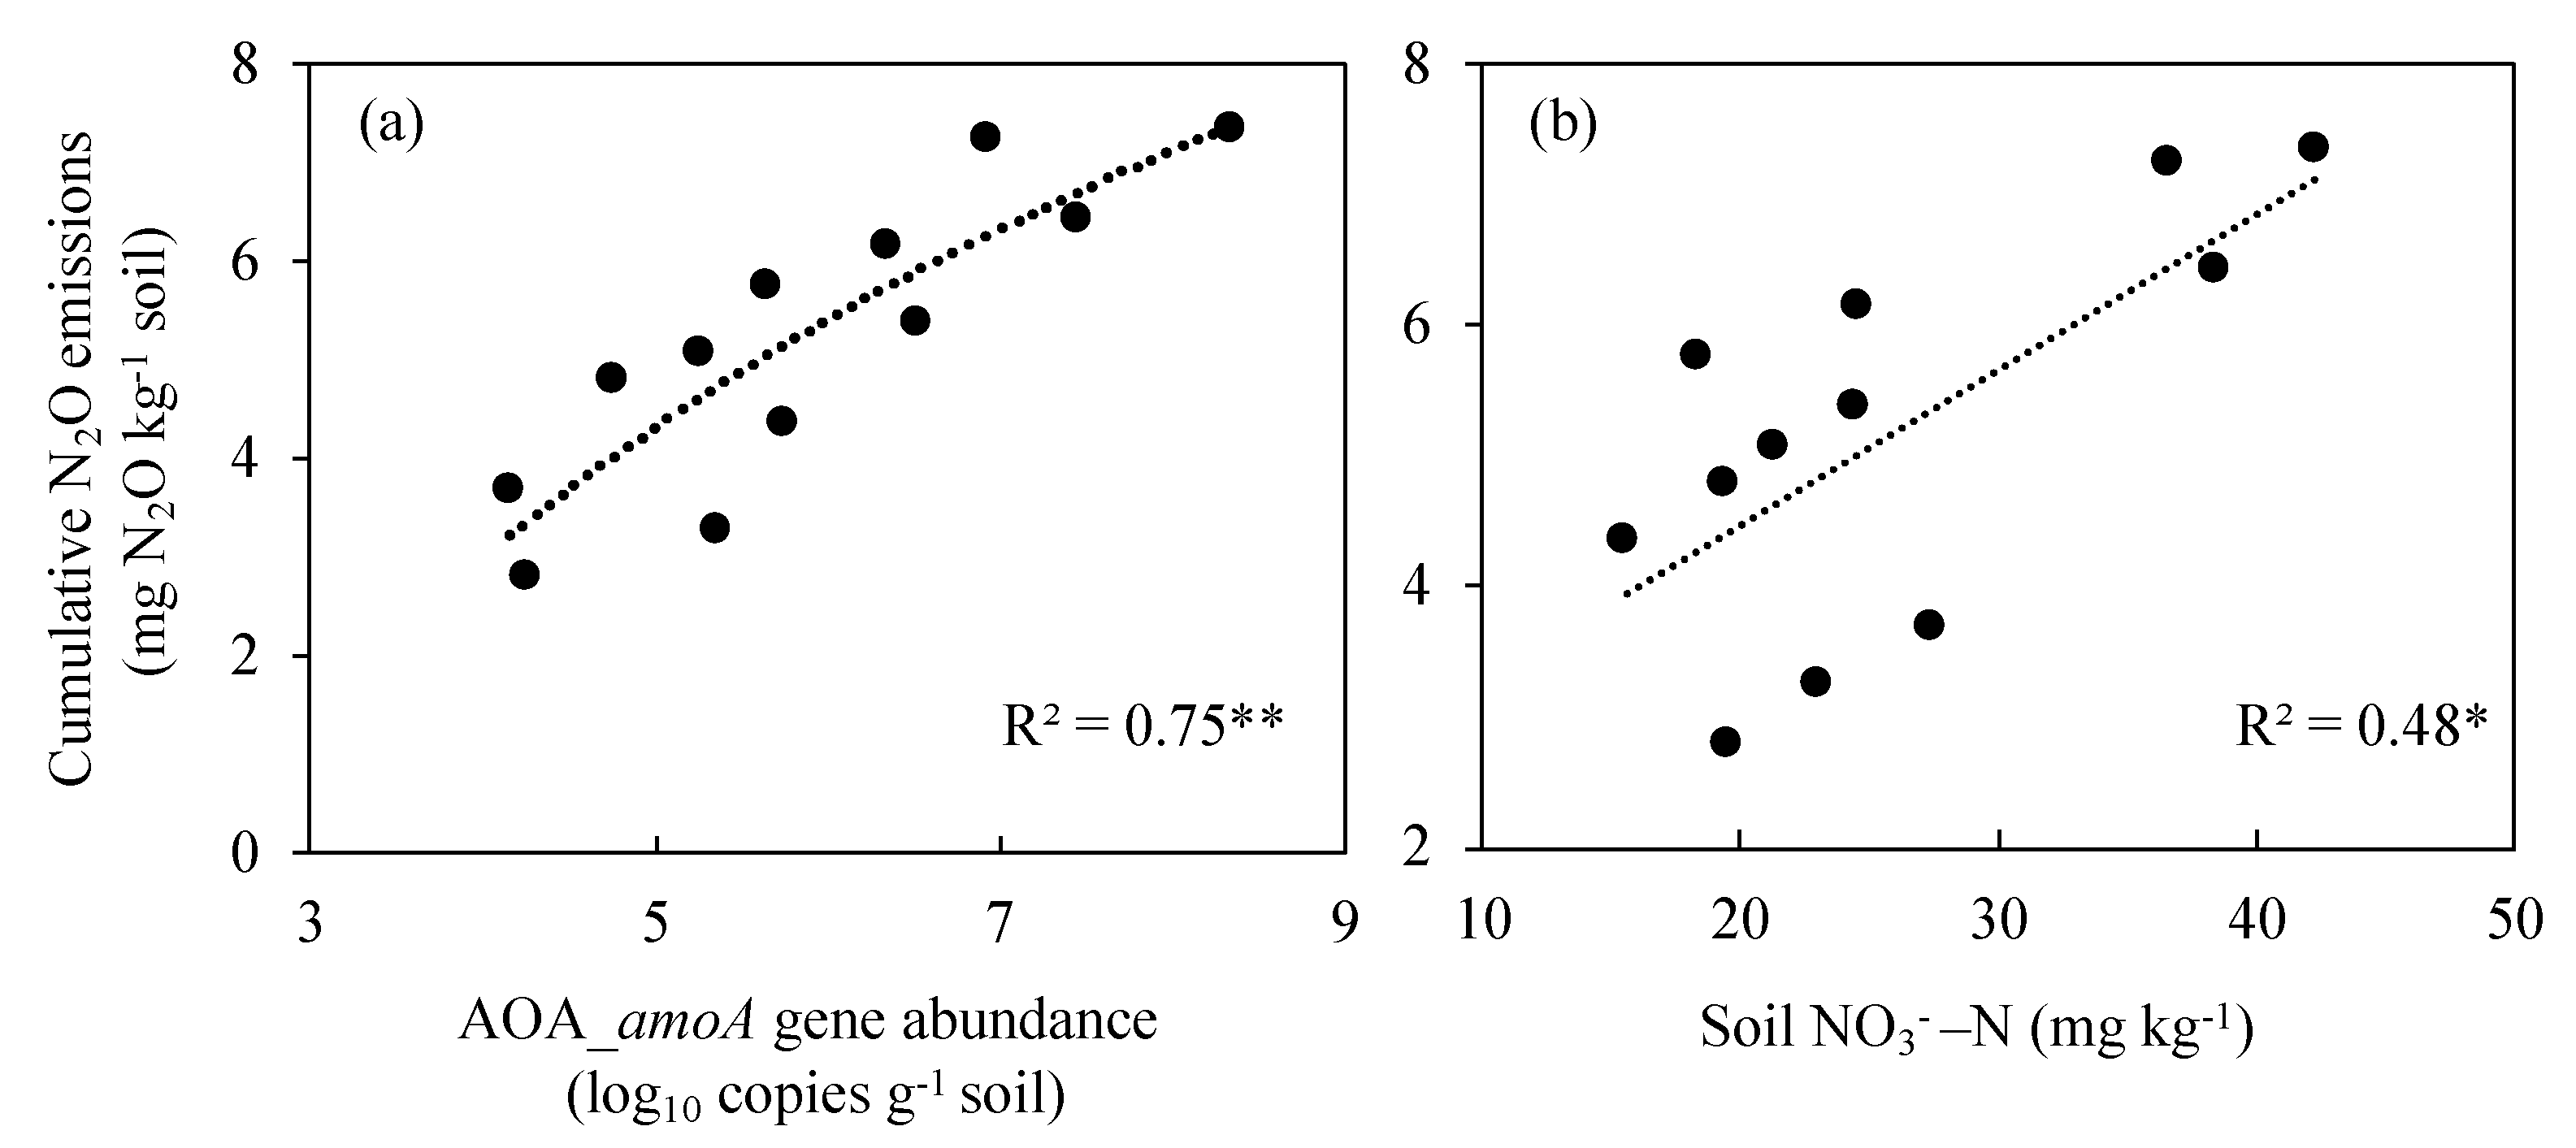
3.8. Relationship between N2O Emissions and AOA and Soil NO3-N

Figure 7 shows that the cumulative N2O emissions were directly positively correlated with AOA abundance (R2 = 0.75, p < 0.01) and soil NO3-N in the soil (R2 = 0.48, p < 0.05). This implies that the most direct way to mitigate the emission of N2O is to reduce the content of nitrate in the soil, and this suggests that the use of NPI can limit the content of AOA and nitrate in soil. Moreover, the main contribution of NPI has been supplying nitrogen fertilizer from subsurface irrigation, and the root system can directly uptake N, reduce the nitrate formation and the copies of nitrifying bacteria, and ultimately alleviate N2O emissions.

4. Discussion

4.1. NPI Improved the Performance of Lettuce

NPI has the ability to improve water and nutrient efficiency and has been used in greenhouse and field trials [1,2,3,4,5,6,36]. This study certified that the yield and quality of lettuce can be significantly advanced (Table 1 and Table 2), as well as WUE and PFP, under NPI treatments (Figure 2). The NPI-N105 treatment also reduced the N fertilizer dosage by 30%, which could achieve enhanced results compared with CI-N150 (Table 2). This is primarily because the NPI is able to transport water and nutrients directly to the rhizosphere to accurately and constantly supply water according to the needs of crops [1,2,3,4,5,6], thereby reducing deep seepage and the evaporation of soil surface water [6,30,37]. Moreover, appropriate amounts of water and nutrients are beneficial to increase stomatal conductance and the chlorophyll content, reduce osmoregulation in the pericarp, promote VC content, and increase the concentration of sugar entering the phloem [38,39,40], thus promoting photosynthesis and dry matter accumulation in plants [2,39,40]. This is reflected by the fact that NPI increases the dry matter accumulation, soluble sugar, and VC content of crops (Table 2). In addition, relying on the NPI system and reducing N application could reduce the nitrate content in shoots; simultaneously, by increasing the uptake of potassium with N, the NPI system promoted the metabolism of nitrate and resulted in increased contents of soluble sugar and VC in plants [2,40]. Although DCD addition was able to effectively increase the yield of lettuce under CI, its application still caused potential pollution to the environment and vegetables [13,18]. Taken together, these results further confirm that the NPI system not only promoted water and nutrient use efficiency but also reduced the potential pollution of the environment by fertilizers.

4.2. Reduction of the Formation of NO3-N with NPI

Nitrogen is one of the macroelements required for plant growth and development, but rapid nitrification after N is applied to the soil has a strong negative effect on agricultural ecosystems [20,41,42,43]. For example, the high-mobility form of NO3-N is prone to leaching and runoff pollution, resulting in severe N inefficiency and environmental toxicity [41,44,45,46]. Hence, suppression of the formation of highly motile NO3-N is the key to reducing N pollution. The N fertilizer is provided by NPI directly to the rhizosphere zone, which explains its inhibition of NO3-N formation manifested by the relatively low content of NO3-N, while the highest content was observed under CI (Figure 3a). This suggests NPI reduces the probability of N conversion to nitrate, as well as reducing leaching and GHG. Moreover, it is capable of retaining a high and stable NH4+-N content for a long period (Figure 3b) and is associated with lower levels of nitrifying populations (Figure 5), which means that NPI can provide more available N sources for the beneficiary crop and prevent N from coming into contact with nitrifying bacteria. This view is supported by Subbarao and Searchinger [41], who claimed that more ammonium in solution would mitigate N pollution and boost the crop yield. This result is consistent with previous experiments, which found that a continuous and stable water supply can ensure a stable distribution uniformity of soil N when a subsurface irrigation system is employed [2,3]. Consequently, the nitrate reductase activity and soil urease activity were reduced (Figure 4). This result means there was a reduction in the formation of nitrate in the rhizosphere zone under NPI conditions, as well as reduced activity of soil-nitrifying bacteria and enzymes, thus increasing the utilization efficiency of N.

4.3. Mitigation of Nitrifying Activity and N2O Emissions

Nitrogen fertilizers prominently contribute to the emission of the greenhouse gas N2O from agricultural soils, which is catalyzed by ammonia oxidants in oxygenated soils [47,48,49], and the main source of N2O is nitrate in soil [47,50]. NPI produced low levels of nitrate (Figure 3a), which had the potential to reduce N2O emissions and showed prominently positive correlations (Figure 7b). The current study also found that N application led to higher AOA and AOB abundances in the soil, resulting in N2O emissions (Figure 6), especially for CI-N150 (which had the highest levels of emissions), but the NPI system could alleviate N2O emissions. This result is supported by high N application being an important driving force for nitrification [20,25], which increases the abundance of AOA; simultaneously, lower NO3 and NH4+ concentrations are favored by AOA over AOB [23,35,51]. Moreover, AOA plays a dominant role in regulating the fate of N, and in many habitats it exceeds AOB, particularly in acidic soils [23,25,47]. This validates our finding that a higher abundance of AOA than AOB may reflect that AOA mainly mediates ammonia oxidation and that NPI significantly inhibits both AOA and AOB (Figure 5). Similarly, the greater soil NO3 content under CI reflects higher copy numbers of AOA and AOB and promotes N2O fluxes. Therefore, the irrigation situation was the main variable that mediated most of the N transformation in the soil, affecting the abundance of nitrifying bacteria and the production of N2O [27,52]. Although DCD addition can effectively inhibit the copies of nitrifying bacteria and has the lowest N2O emissions (Figure 6), the measurement results prove that the NPI system has this function without any food or environmental safety issues [13,18]. Therefore, NPI performs well at altering the nitrifying activity in the rhizosphere through its irrigation function; when applied with N fertilizer, the nitrification and emission of N2O will be reduced.

5. Conclusions

Overall, the NPI system significantly increased the yield and quality of lettuce, improved the WUE and PFP, and reduced the formation of nitrate over different sampling days compared with CI. Furthermore, the ANR, SNR, and SUA in the rhizosphere soil decreased, and the abundance of AOA, AOB, and Nitrospira at genus level was reduced. Additionally, NPI mitigated N2O emissions. Therefore, NPI is a feasible strategy to promote lettuce performance and mitigate N2O emissions. Our study provides a scientific theoretical basis for supporting the sustainable development of agriculture.

6. Patents

This section is not mandatory but may be added if there are patents resulting from the work reported in this manuscript.

Author Contributions

X.G., S.Z. and H.L. designed the experiments. X.G. and Y.S. conducted the experiments. X.G. and S.Z. wrote the manuscript. All authors have contributed to the writing of the manuscript. All authors have read and agreed to the published version of the manuscript.

Funding

This research was financially supported by the National Key Research and Development Program of China (2018YFE0112300) and (2013AA102901).

Data Availability Statement

The data sets generated and/or analyzed during the current study are available from the corresponding author on reasonable request.

Conflicts of Interest

The authors declare no conflict of interest.

References

  1. Long, H.; Zhang, H.; Yue, X.; Zhang, R. Design and experiment of heavy-type negative pressure value used for negative pressure irrigation. Trans. Chin. Soc. Agric. Eng. 2018, 34, 85–92. [Google Scholar]
  2. Zhao, X.; Gao, X.; Zhang, S.; Long, H. Improving the growth of rapeseed (Brassica chinensis L.) and the composition of rhizosphere bacterial communities through negative pressure irrigation. Water Air Soil Poll. 2019, 239, 9. [Google Scholar] [CrossRef]
  3. Li, S.; Tan, D.; Wu, X.; Degre, A.; Long, H.; Zhang, S.; Lu, J.; Gao, L.; Zheng, F.; Liu, X.; et al. Negative pressure irrigation increases vegetable water productivity and nitrogen use efficiency by improving soil water and NO3-N distributions. Agric. Water Manage. 2021, 251, 106853. [Google Scholar] [CrossRef]
  4. Wang, J.; Huang, Y.; Long, H. Water and salt movement in different soil textures under various negative irrigation pressures. J. Integr. Agric. 2016, 15, 1874–1882. [Google Scholar] [CrossRef] [Green Version]
  5. Gao, X.; Zhang, S.; Zhao, X.; Long, H. Evaluation of potassium application on tomato performance and rhizosphere bacterial communities under negative pressure irrigation of greenhouse-grown. J. Plant Nutr. 2020, 43, 317–326. [Google Scholar] [CrossRef]
  6. Long, H.; Wu, X.; Zhang, S.; Wang, J.; Drohan, P.J.; Zhang, R. Connotation and research progress of crop initiate water drawing technology. Trans. Chin. Soc. Agric. Eng. 2020, 36, 139–152. [Google Scholar]
  7. Gao, X.; Zhang, S.; Zhao, X.; Long, H. Stable water and fertilizer supply by negative pressure irrigation improve tomato production and soil bacterial communities. SN App. Sci. 2019, 1, 178. [Google Scholar] [CrossRef]
  8. Li, D.; Long, H.Y.; Zhang, S.X.; Wu, X.P.; Shao, H.Y.; Wang, P. Effect of continuous negative pressure water supply on the growth, development and physiological mechanism of Capsicum annuum L. J. Integr. Agric. 2017, 16, 1978–1989. [Google Scholar] [CrossRef]
  9. Wang, J.; Long, H.; Huang, Y.; Wang, X.; Cai, B.; Liu, W. Effects of different irrigation management parameters on cumulative water supply under negative pressure irrigation. Agric. Water Manage. 2019, 224, 105743. [Google Scholar] [CrossRef]
  10. Davison, E.A. The contribution of manure and fertilizer nitrogen to atmospheric nitrous oxide since 1860. Nat. Geosci. 2009, 2, 659–662. [Google Scholar] [CrossRef]
  11. Ding, J.; Fang, F.; Lin, W.; Qiang, X.; Xu, C.; Mao, L.; Li, Q.; Zhang, X.; Li, Y. N2O emissions and source partitioning using stable isotopes under furrow and drip irrigation in vegetable field of North China. Sci. Total Environ. 2019, 665, 709–717. [Google Scholar] [CrossRef]
  12. Subbarao, G.V.; Searchinger, T.D. Opinion: A “more ammonium solution” to mitigate nitrogen pollution and boost crop yields. Proc. Natl. Acad. Sci. USA 2021, 118, e2107576118. [Google Scholar] [CrossRef] [PubMed]
  13. Subbarao, G.V.; Arango, J.; Masahiro, K.; Hooper, A.M.; Yoshibashi, T.; Ando, Y.; Nakahara, K.; Deshpande, S.; Ortiz-Monasterio, I.; Ishitani, M.; et al. Genetic mitigation strategies to tackle agricultural GHG emissions: The case for biological nitrification inhibition technology. Plant Sci. 2017, 262, 165–168. [Google Scholar] [CrossRef]
  14. Qasim, W.; Xia, L.; Lin, S.; Wan, L.; Zhao, Y.; Butterbach-Bahl, K. Global greenhouse vegetable production systems are hotspots of soil N2O emissions and nitrogen leaching: A meta-analysis. Environ. Pollut. 2021, 272, 116371. [Google Scholar] [CrossRef] [PubMed]
  15. Tan, B.; Li, Y.; Liu, T.; Tan, X.; He, Y.; You, X.; Leong, K.; Liu, C.; Li, L. Response of plant rhizosphere microenvironment to water management in soil-and substrate-based controlled environment agriculture (ECA) systems: A review. Front. Plant Sci. 2021, 12, 691651. [Google Scholar] [CrossRef] [PubMed]
  16. Farneselli, M.; Benincasa, P.; Tosti, G.; Simonne, E.; Guiducci, M.; Tei, F. High fertigation frequency improves uptake and crop performance in processing tomato grown with high nitrogen and water supply. Agric. Water Manage. 2015, 154, 52–58. [Google Scholar] [CrossRef]
  17. Bai, X.; Gao, J.; Wang, S.; Cai, H.; Chen, Z.; Zhou, J. Excessive nutrient balance surpluses in newly built solar greenhouses over five years leads to high nutrient accumulations in soil. Agric. Ecosyst. Environ. 2020, 288, 106717. [Google Scholar] [CrossRef]
  18. Coskun, D.; Britto, D.T.; Shi, W.; Kronzucker, H.J. Nitrogen transformations in modern agriculture and role of biological nitrification inhibition. Nat. Plants 2017, 3, 17074. [Google Scholar] [CrossRef]
  19. Thompson, R.L.; Lassaletta, L.; Patra, P.K.; Wilson, C.; Wells, K.C.; Gressent, A.; Koffi, E.N.; Chipperfield, M.P.; Winiwarter, W.; Davidson, E.A.; et al. Acceleration of global N2O emissions seen from two decades of atmospheric inversion. Nat. Clim. Change 2019, 9, 993–998. [Google Scholar] [CrossRef]
  20. Subbarao, G.V.; Yoshihashi, T.; Worthington, M.; Nakahara, K.; Ando, Y.; Sahrawat, K.L.; Rao, I.M.; Lata, J.C.; Kishii, M.; Braun, H.J. Suppression of soil nitrification by plants. Plant Sci. 2015, 233, 155–164. [Google Scholar] [CrossRef] [Green Version]
  21. Wang, X.; Dou, Z.; Shi, X.; Zou, C.; Liu, D.; Wang, Z.; Guan, X.; Sun, Y.; Wu, G.; Zhang, B.; et al. Innovative management programme reduces environmental impacts in Chinese vegetable production. Nat. Food 2021, 2, 47–53. [Google Scholar] [CrossRef]
  22. Zhang, M.; Zeng, H.; Afzal, M.R.; Gao, X.; Li, Y.; Subbarao, G.V.; Zhu, Y. BNI-release mechanisms in plant root system—Current status of understanding. Biol. Fert. Soils 2021. [Google Scholar] [CrossRef]
  23. Prosser, J.I.; Nicaol, G.W. Archaeal and bacterial ammonia-oxidisers in soil: The quest for niche specialization and differentiation. Trends Microbiol. 2012, 20, 523–531. [Google Scholar] [CrossRef] [PubMed] [Green Version]
  24. Beeckman, F.; Motte, H.; Beeckman, T. Nitrification in agricultural soils impact, actors and mitigation. Curr. Opin. Biotech. 2018, 50, 166–173. [Google Scholar] [CrossRef]
  25. Sarr, P.S.; Ando, Y.; Nakamura, S.; Deshpande, S.; Subbarao, G.V. Sorgoleone release from sorghum roots shapes the composition of nitrifying populations, total bacteria, and archaea and determines the level of nitrification. Biol. Fert. Soils 2020, 56, 145–166. [Google Scholar] [CrossRef] [Green Version]
  26. Afzal, M.R.; Zhang, M.; Jin, H.; Wang, G.; Zhang, M.; Ding, M.; Raza, S.; Hu, J.; Zeng, H.; Gao, X.; et al. Post-translation regulation of plasma membrane H+-ATPase is involved in the release of biological nitrification inhibitors from sorghum roots. Plant Soil 2020, 450, 357–372. [Google Scholar] [CrossRef]
  27. Min, J.; Sun, H.; Kronzucker, H.; Wang, Y.; Shi, W. Comprehensive assessment of the effects of nitrification inhibitor application on reactive nitrogen loss in intensive vegetable production systems. Agric. Ecosyst. Environ. 2021, 307, 107227. [Google Scholar] [CrossRef]
  28. Abalos, D.; Sanchez-Martin, L.; Garcia-Torres, L.; von Groenigen, J.W.; Vallejo, A. Management of irrigation frequency and nitrogen fertilization to mitigate GHG and NO emissions from drip-fertigated crops. Sci. Total Environ. 2014, 490, 880–888. [Google Scholar] [CrossRef] [Green Version]
  29. Liang, H.; Lv, H.; Batchelor, W.; Lian, X.; Wang, Z.; Lin, S.; Hu, K. Simulating nitrate and DON leaching to optimize water and N management practices for greenhouse vegetable production systems. Agric. Water Manage. 2020, 241, 106377. [Google Scholar] [CrossRef]
  30. Li, Y.K.; Wang, L.C.; Xue, X.Z.; Guo, W.Z.; Xu, F.; Li, Y.L.; Sun, W.T.; Chen, F. Comparison of drip fertigation and negative pressure fertigation on soil water dynamics and water use efficiency of greenhouse tomato grown in the North China Plain. Agric. Water Manage. 2017, 184, 1–8. [Google Scholar] [CrossRef]
  31. Lv, H.; Lin, S.; Wang, Y.; Lian, X.; Zhao, Y.; Li, Y.; Du, J.; Wang, Z.; Wang, J.; Butterbach-Bahl, K. Drip fertigation significantly reduces nitrogen leaching in solar greenhouse vegetable productions system. Environ. Pollut. 2019, 245, 694–701. [Google Scholar] [CrossRef]
  32. Yao, Z.; Yan, G.; Wang, R.; Zheng, X.; Liu, C.; Butterbach-bahl, K. Drip irrigation or reduced N-fertilizer rate can mitigate the high annual N2O + NO fluxes from a Chinese intensive vegetable systems. Atmos. Environ. 2019, 212, 183–193. [Google Scholar] [CrossRef]
  33. Singh, D.K.; Kumar, S. Nitrate reductase, arginine deaminase, urease and dehydrogenase activities in natural soil (ridges with forest) and in cotton soil after acetamiprid treatments. Chemosphere 2008, 71, 412–418. [Google Scholar] [CrossRef] [PubMed]
  34. Meinhardt, K.A.; Bertagnolli, A.; Pannu, M.W.; Stand, S.E.; Brown, S.L.; Stahl, D.A. Evaluation of revised polymerase chain reaction primers for more inclusive quantification of ammonia-oxidizing archaea and bacteria. Environ. Microbiol. Rep. 2015, 7, 354–363. [Google Scholar] [CrossRef] [PubMed]
  35. Hink, L.; Nicol, G.W.; Prosser, J. Archaea produce lower yield of N2O than bacteria during aerobic ammonia oxidation in soil. Environ. Microbiol. 2017, 19, 4829–4837. [Google Scholar] [CrossRef] [PubMed] [Green Version]
  36. Yang, P.; Drohan, P.; Long, H.; Bian, Y.; Bryant, R. Negative pressure irrigation on water use efficiency, yield and quality of B. chinensis L. J. Sci. Food Agric. 2021. [Google Scholar] [CrossRef] [PubMed]
  37. Fan, Z.; Lin, S.; Zhang, X.; Jiang, Z.; Yang, K.; Jian, D.; Chen, Y.; Li, J.; Chen, Q.; Wang, J. Conventional flooding irrigation causes an overuse of nitrogen fertilizer and low nitrogen use efficiency in intensively used solar greenhouse vegetable production. Agric. Water Manage. 2014, 144, 11–19. [Google Scholar] [CrossRef]
  38. Abel, A.; Mattes, R. Simulation of the dry matter production and seed yield of common beans under varying soil water and salinity conditions. Agric. Water Manage. 2001, 47, 55–68. [Google Scholar] [CrossRef]
  39. Patane, C.; Tringali, S.; Sortino, O. Effects of soil water on yield and quality of processing tomato under a Mediterranean climate conditions. Agric. Water Manage. 2010, 97, 131–138. [Google Scholar] [CrossRef]
  40. Wang, C.; Gu, F.; Chen, J.; Yang, H.; Jiang, J.; Du, T.; Zhang, J. Assessing the response of yield and comprehensive fruit quality of tomato grown in greenhouse to deficit irrigation and nitrogen application strategies. Agric. Water Manage. 2015, 161, 9–19. [Google Scholar] [CrossRef]
  41. Subbarao, G.V.; Kishii, M.; Bozal-Leorri, A.; Ortiz-Monasterio, I.; Gao, X.; Ibba, M.I.; Karwat, H.; Gonzalez-Moro, M.B.; Gonzalez-Murua, C.; Yoshihashi, T.; et al. Enlisting wild grass genes to combat nitrification in wheat farming: A nature-based solution. Proc. Natl. Acad. Sci. USA 2021, 118, e2106595118. [Google Scholar] [CrossRef]
  42. Fu, Q.; Abadie, M.; Blaud, A.; Carswell, A.; Misselbrook, T.; Clark, I.; Hirsch, P. Effects of urease and nitrification inhibitors on soil N, nitrifier abundance and activity in a sandy loam soil. Biol. Fert. Soils 2020, 25, 185–194. [Google Scholar] [CrossRef] [Green Version]
  43. Guo, Y.; Chen, Y.; Searchinger, T.; Zhou, M.; Pan, D.; Yang, J.; Wu, L.; Cui, Z.; Zhang, W.; Zhang, F.; et al. Air quality, nitrogen use efficiency and food security in China are improved by cost-effective agricultural nitrogen management. Nat. Food 2020, 1, 648–658. [Google Scholar] [CrossRef]
  44. Ganeteg, U. Uptake of organic nitrogen by plants. New Phytol. 2009, 182, 31–48. [Google Scholar] [CrossRef]
  45. Murphy, D.V.; Macdonald, A.J.; Stockdale, E.A.; Goulding, K.W.T.; Fortune, S.; Gaunt, J.L.; Poulton, P.R.; Wakefield, J.A. Soluble organic nitrogen in agricultural soils. Biol. Fert. Soils 2020, 30, 374–387. [Google Scholar] [CrossRef]
  46. Sun, Y.; Hu, K.; Zhang, K.; Jiang, L.; Xu, Y. Simulation of nitrogen fate for greenhouse cucumber grown under different water and fertilizer management using the EU-Rotate N model. Agric. Water Manage. 2012, 112, 21–32. [Google Scholar] [CrossRef]
  47. Hink, L.; Gubry-Rangin, C.; Nicol, G.W.; Prosser, J. The consequences of niche and physiological differentiation of archaeal and bacterial ammonia oxidisers for nitrous oxide emissions. ISME J. 2018, 12, 1084–1093. [Google Scholar] [CrossRef] [PubMed]
  48. Tosi, M.; Brown, S.; Machado, P.; Wagner-Riddle, C.; Dunfield, K. Short-term response of soil N-cycling genes and transcripts to fertilization with nitrification and urease inhibitors, and relationship with field-scale N2O emissions. Soil Biol. Biochem. 2020, 142, 107703. [Google Scholar] [CrossRef]
  49. Zhao, Y.; Lv, H.; Qasim, W.; Wan, L.; Wang, Y.; Lian, X.; Liu, Y.; Hu, J.; Wang, Z.; Li, G.; et al. Drip fertigation with straw incorporation significantly reduces N2O emission and N leaching while maintaining high vegetable yields in solar greenhouse production. Environ. Pollut. 2021, 273, 116521. [Google Scholar] [CrossRef]
  50. Stevens, R.J.; Laughlin, R.J. Measurement of nitrous oxide and dinitrogen emissions from agricultural soils. Nut. Cycl. Agroecosystems 1998, 52, 131–139. [Google Scholar] [CrossRef]
  51. Wang, X.; Bai, J.; Xie, T.; Wang, W.; Zhang, G.; Yin, S.; Wang, D. Effects of biological nitrification inhibitors on nitrogen use efficiency and greenhouse gas emissions in agricultural soils: A review. Ecotoxicol. Environ. Saf. 2021, 220, 112338. [Google Scholar] [CrossRef] [PubMed]
  52. Prosser, J.I.; Hink, L.; Rangin, C.G.; Nicol, G.W. Nitrous oxide production by ammonia oxidizers: Physiological diversity, niche differentiation and potential mitigation strategies. Glob. Change Biol. 2020, 26, 103–118. [Google Scholar] [CrossRef] [PubMed]
Figure 1. Schematic of lettuce growth using a negative pressure irrigation system.
Agronomy 11 02380 g001
Figure 2. WUE and PFP under different irrigation and N treatments. (a) Water use efficiency (WUE); (b) Partial factor productivity (PFP) of the applied N. CI is conventional irrigation, and NPI is negative pressure irrigation. N150: 150 kg N ha−1, N105: 105 kg N ha−1; D is DCD addition. All of the data are the means of three replicates ± SE, and different letters indicate significant differences between the treatments (p < 0.05) by Duncan’s tests.
Agronomy 11 02380 g002
Figure 3. Dynamic changes in soil NO3–N and NH4+–N contents under different irrigation and N treatments. (a) Soil NO3–N; (b) Soil NH4+–N. CI is conventional irrigation, and NPI is negative pressure irrigation. N150: 150 kg N ha−1, N105: 105 kg N ha−1; DCD is DCD addition. All of the data are the means of three replicates. DAF is the day after fertilization.
Agronomy 11 02380 g003
Figure 4. Soil nitrate reductase and urease activities, soil apparent nitrification rate under different irrigation and N treatments. (a) Soil nitrate reductase activity; (b) Soil urease activity; (c) Soil apparent nitrification rate. CI is conventional irrigation, and NPI is negative pressure irrigation. N150: 150 kg N ha−1, N105: 105 kg N ha−1; D is DCD addition. All of the data are the means of three replicates ± SE, and different letters indicate significant differences between the treatments (p < 0.05) by Duncan’s tests.
Agronomy 11 02380 g004
Figure 5. Abundance of AOA and AOB amoA genes, Nitrospira under different irrigation and N treatments. (a) AOA_amoA gene abundance; (b) AOB_amoA gene abundance; (c) % of Nitrospira sequences. CI is conventional irrigation, and NPI is negative pressure irrigation. N150: 150 kg N ha−1, N105: 105 kg N ha−1; D is DCD addition. All of the data are the mean of three replicates ± SE, and different letters indicate significant differences between the treatments (p < 0.05) by Duncan’s tests.
Agronomy 11 02380 g005
Figure 6. Cumulative N2O emissions under different irrigation and N treatments. CI is conventional irrigation, and NPI is negative pressure irrigation. N150: 150 kg N ha−1, N105: 105 kg N ha−1, D is DCD addition. All of the data are the means of three replicates ± SE, and different letters indicate significant differences between the treatments (p < 0.05) by Duncan’s tests.
Agronomy 11 02380 g006
Figure 7. Correlation analysis of cumulative N2O emissions with AOA and soil NO3–N: (a) between cumulative N2O emissions and AOA, n = 12; (b) between cumulative N2O emissions and soil NO3-N, n = 12. For correlation analysis, R2 values with asterisks * and ** denote r2 < 0.05 and r2 < 0.01, respectively.
Agronomy 11 02380 g007
Table 1. Performance of lettuce under different irrigation and N treatments in Experiment 1.
IrrigationNYieldTotal N ContentNitrateWUEPFP
Treatmentsg pot−1g pot−1mg kg−1kg m−3Kg Kg−1
CIN150361 ± 16 b17.7 ± 0.9 b508 ± 12 a22.6 ± 1.0 b89 ± 4 d
N120338 ± 20 bc14.5 ± 0.3 d485 ± 30 a21.1 ± 1.3 b104 ± 6 c
N105288 ± 20 de12.0 ± 0.8 e417 ± 24 b18.3 ± 1.2 c101 ± 7 c
N90263 ± 19 e10.3 ± 0.4 f391 ± 25 b16.4 ± 1.2 c108 ± 8 c
NPIN150421 ± 12 a20.5 ± 0.8 a403 ± 17 b29.9 ± 1.2 a104 ± 3 c
N120410 ± 18 a19.6 ± 0.7 a381 ± 15 b30.3 ± 1.8 a126 ± 6 b
N105403 ± 14 a18.9 ± 0.9 ab346 ± 14 c29.6 ± 0.6 a142 ± 5 a
N90327 ± 25 bcd16.4 ± 0.4 c319 ± 17 c26.9 ± 2.3 a135 ± 10 ab
CI is conventional irrigation, and NPI is negative pressure irrigation. N150~N90: 150 kg N ha−1, ~N90: 90 kg N ha−1, respectively. All of the data are the means of three replicates ± SE, and the different letters after numbers in the same column for the same trait indicate a significant difference at 0.05 (p < 0.05) by Duncan’s tests.
Table 2. Yield and quality of lettuce under different irrigation and N treatments in experiment 2.
IrrigationNYieldPlant NNitrateSoluble SugarVC
Treatmentsg pot−1g pot−1mg kg−1mg g−1mg kg−1
CIN150373 ± 21 c18.8 ± 1.1 c493 ± 21 a25.8 ± 1.2 b217 ± 9 b
N150 + D399 ± 20 bc20.6 ± 1.1 b387 ± 14 b24.9 ± 0.9 b214 ± 6 b
NPIN150439 ± 16 a23.4 ± 1.1 a394 ± 36 b27.2 ± 1.0 a233 ± 5 a
N105412 ± 15 ab21.3 ± 1.0 b352 ± 20 c27.9 ± 0.3 a238 ± 8 a
CI is conventional irrigation, and NPI is negative pressure irrigation. N150: 150 kg N ha−1, N105: 105 kg N ha−1; D is DCD addition. All of the data are the means of three replicates ± SE, and the different letters after numbers in the same column for the same trait indicate a significant difference at 0.05 (p < 0.05) by Duncan’s tests.
Publisher’s Note: MDPI stays neutral with regard to jurisdictional claims in published maps and institutional affiliations.

