Article

In Silico Characterization and Expression Profiles of Heat Shock Transcription Factors (HSFs) in Maize (Zea mays L.)

1
Plant Biochemistry and Molecular Biology Laboratory, Department of Plant Sciences, Quaid-i-Azam University, Islamabad 45320, Pakistan
2
University Institute of Biochemistry and Biotechnology, PMAS, Arid Agriculture University, Rawalpindi 46300, Pakistan
3
Fujian Provincial Key Laboratory of Crop Molecular and Cell Biology, Oil Crops Research Institute, Center of Legume Crop Genetics and Systems Biology/College of Agriculture, Fujian Agriculture and Forestry University (FAFU), Fuzhou 350002, China
4
State Key Laboratory of Rice Biology, China National Rice Research Institute, Chinese Academy of Agricultural Science (CAAS), Hangzhou 311400, China
5
College of Agriculture, Fujian Agriculture and Forestry University, Fuzhou 350002, China
6
Department of Agronomy, University of Agriculture, Faisalabad 38040, Pakistan
7
Department of Agricultural Botany, Faculty of Agriculture, Ain Shams University, Hadayek Shubra, Cairo 11241, Egypt
*
Authors to whom correspondence should be addressed.
Agronomy 2021, 11(11), 2335; https://doi.org/10.3390/agronomy11112335
Submission received: 6 October 2021 / Revised: 4 November 2021 / Accepted: 16 November 2021 / Published: 18 November 2021

Abstract

:
Heat shock transcription factors (HSFs) regulate many environmental stress responses and biological processes in plants. Maize (Zea mays L.) is a major cash crop that is grown worldwide. However, the growth and yield of maize are affected by several adverse environmental stresses. Therefore, investigating the factors that regulate maize growth and development and resistance to abiotic stress is an essential task for developing stress-resilient maize varieties. Thus, a comprehensive genome-wide identification analysis was performed to identify HSFs genes in the maize genome. The current study identified 25 ZmHSFs, randomly distributed throughout the maize genome. Phylogenetic analysis revealed that ZmHSFs are divided into three classes and 13 sub-classes. Gene structure and protein motif analysis supported the results obtained through the phylogenetic analysis. Segmental duplication is shown to be responsible for the expansion of ZmHSFs. Most of the ZmHSFs are localized inside the nucleus, and the ZmHSFs which belong to the same group show similar physio-chemical properties. Previously reported and publicly available RNA-seq analysis revealed a major role of class A HSFs including ZmHSFA-1a and ZmHSFA-2a in all the maize growth stages, i.e., seed, vegetative, and reproductive development. Under abiotic stress conditions (heat, drought, cold, UV, and salinity), members of class A and B ZmHSFs are induced. Gene ontology and protein–protein interaction analysis indicated a major role of ZmHSFs in resistance to environmental stress and regulation of primary metabolism. To summarize, this study provides novel insights for functional studies on the ZmHSFs in maize breeding programs.

Graphical Abstract

1. Introduction

In recent years, there has been an increasing trend to focus on the responses of plants to abiotic stresses due to global climate change [1]. Particularly, research has been focused on plant heat stress (HS) tolerance mechanisms, as higher temperatures have a negative effect on plant growth and production [2,3]. Although plants are susceptible to HS throughout their lifespan, reproductive tissues are specifically characterized by vulnerability to HS [4,5]. Heatwaves are expected to become more frequent in the future, and atmospheric temperature is on course to rise ~4 °C by the end of this century [6,7]. HS negatively affects plant morphology, physiology, and growth in diverse ways [5,8]. HS alters plasma membrane fluidity, creates proteotoxic stress, causes the overproduction of reactive oxygen species (ROS), and dismantles cellular organization by inducing the collapse of the cytoskeleton apparatus [3,8,9,10]. Nonetheless, plants possess an efficient system that allows them to perceive the environmental stimulus, activate the signaling pathways, and alter their gene expression to ensure survival [9,11,12]. A major step in this process is the activation of stress-inducible genes, the expression of which is controlled by transcription factors (TFs). TFs represent a group of regulatory proteins that control the expression pattern of genes under various developmental and stressful conditions [13,14]. Several TFs families including heat shock transcription factors (HSFs), WRKY (named due to conserved WRKYGQK motif), v-myb avian myeloblastosis viral oncogene homolog (MYB), Petunia NAM, Arabidopsis ATAF1/2 and CUC2 (NAC), and dehydration responsive-element binding transcriptional activator (DREB), etc., have been shown to positively regulate HS-responsive gene expression and improve plant HS tolerance [14,15]. Among them, the most comprehensively analyzed family is HSFs, the members of which are considered the master regulators of plant HS-response (HSR) and are also involved in regulating plant responses to other abiotic and biotic stress conditions [12,16]. Since the first HSF gene was identified in yeast [17], the HSF gene family has been characterized in several plant species [18,19]. The pioneering study by Nover et al. [20] allowed the identification of the HSF gene family in various plant species, including essential crop plants [19]. The Heatster database (http://www.cibiv.at/services/hsf, accessed on 1 August 2021) currently holds 848 HSF sequences from 33 different plant species.
Generally, HSFs are divided into three classes, i.e., A, B, and C, based on phylogenetic analysis and structural properties [21]. All the HSFs contain two highly conserved domains, the DNA-binding domain (DBD), which binds with “heat-shock elements” (5′-nGAAnnTTCn-3′) present in regulatory sequences of target genes, through helix-turn-helix (HTH) motif, and oligomerization domain (OD), which has a bipartile heptad repeat pattern of the hydrophobic-associated region (HR-A/B) and is responsible for the trimerization of HSFs [20,22]. Based on the linker length between the HR-A/B region, HSFs are classified into different classes. The linker length comprises 21 amino acid residues in the case of class A and 7 for class C HSFs. On the other hand, HSFs of class B, lack any insertion. The classification of HSFs is also supported by the length of the linker between DBD and OD, 9–39 amino acids for class A, 50–78 for class B, and 14–49 for class C [20,21,22]. The HSFs of class A are transcriptional activators, and class B are repressors [20,21]. However, in tomato, the HSFB1 possesses both co-activator and repressor functions [23,24]. The class C HSFs are activators like class A [25]. However, they lack activator peptide motif (AHA), and thus cannot initiate transcription on their own [19,20]. The AHA motif is present towards the C-terminal of HSFs and is specific to class A HSFs [26]. In addition to these domains, HSFs also possess nuclear localization signals (NLS), and some contain nuclear export signals (NES) [27]. The NLS and NES are responsible for the nuclear import and export of HSFs, an essential step in cellular functioning [27].
The function of HSFs as the master regulators of plant HSR has been demonstrated mainly in Arabidopsis and tomatoes [28,29]. In tomato, the overexpression of HSFA1a, improved plant thermotolerance, while co-suppression mutants were susceptible to HS [28]. The mutant plants and their fruits were characterized by extreme sensitivity to HS. HSFA1a, HSFA2, and HSFB1 control the fundamental HSF network in tomato [30]. The role of the master regulator is shared by HSFA1a, HSFA1b, and HSFA1d in Arabidopsis [29]. In hsfa1a/b/d triple mutants, the expression of TFs and chaperons was severely hampered under HS, while the expression of several genes was downregulated even under normal growth conditions [29]. HSFA2 is responsible for the extension of acquired thermotolerance (AT) in Arabidopsis [31]. In hsfa2 mutants, the duration of AT was compromised, and the expression of HS-inducible genes was downregulated. Lämke et al. [32] reported that HSFA2 promotes the sustained activation of several HS-memory genes through methylation of the target genomic region [32]. The transcripts of HSFA2 are undetectable under normal conditions. However, after HS, the HSFA2 becomes the most strongly induced HSF in plants [18,33]. Yoshida et al. reported that the overexpression of HSFA3 improves plant thermotolerance, while the T-DNA mutants showed reduced thermotolerance [34]. Lin et al. reported that HSFA2, HSFA4a, and HSFA7a are essential for HSR and cytoplasmic protein response. HSFs have also been characterized in several crop plants [35]. It was reported that OsHSFA4a and its homolog in wheat TaHSFA4a, confers cadmium tolerance to plants [36]. The expression of TaHSFA2-10 is induced in response to HS, oxidative stress, salicylic acid, and its overexpression improves plant thermotolerance [37]. In addition, HSFs are also involved in the regulation of growth and development in Arabidopsis thaliana [16]. For example, HSFA9 is expressed specifically during embryogenesis and maturation in Arabidopsis seeds [38]. Albihlal et al. [39] reported that in Arabidopsis, at least 85 development-associated genes are controlled by HSFA1b [39]. The authors proposed that the HSFA1b allows plants to adjust growth and development under continuously varying environments by transducing external stimuli to stress-associated and development-related genes.
The HSF gene family has been characterized in several plant species, including Arabidopsis thaliana [20], Oryza sativa [40], Zea mays [41], Glycine max [42], Populus trichocarpa [43], Solanum lycopersicum [44], Brachypodium distachyon [45], and Triticum aestivum [46]. However, the role of HSFs in plant growth and development and in responses to stresses other than HS, is not very well understood in maize. Computational biology approaches provide a convenient and reliable platform upon which further wet-lab studies could be carried out. Here, we perform an extensive in silico analysis of maize HSFs to gain better insights into the genomic distribution, phylogeny, gene duplication history, gene structure and protein motif, physio-chemical properties, gene annotation, protein networks, and expression profiling of maize HSFs in growth and development and tolerance to multiple abiotic stresses.

2. Materials and Methods

2.1. Sequence Retrieval

The protein sequences of Zea mays HSFs were extracted from PLAZA 4.5 (https://bioinformatics.psb.ugent.be/plaza/versions/plaza_v4_5_monocots/, accessed on 1 August 2021) and Ensembl Plants (https://plants.ensembl.org/index.html, accessed on 1 August 2021) databases. For this, the BLASTP search was performed using the Arabidopsis (AT4G17750, AT2G26150, AT5G03720, AT4G36990, and AT3G24520) and Zea mays (GRMZM2G115456, GRMZM2G002131, GRMZM2G086880) HSFs against maize genome Zm-B73-REFERENCE-NAM-5.0, as a query to obtain a putative list of HSFs in the maize genome using default parameters (e-value ≤ 10−5 and identity % = 80%). These sequences were checked for the presence of DNA binding domain (DBD) and oligomerization domain (OD) through EMBL-EBI employing the hidden Markov model (HMM) (https://www.ebi.ac.uk/Tools/hmmer/search/phmmer, accessed on 1 August 2021) and SMART (http://smart.embl-heidelberg.de/, accessed on 1 August 2021) tools [47]. The coiled-coil structure, which is a property of OD was predicted using MARCOIL [48]. After carefully analyzing the sequence, the proteins that lacked DBD and/or OD (HR-A/B region) were removed. In addition, the redundant proteins that were the product of a single gene were also discarded from further analysis. Finally, a total of 25 maize HSFs genes were selected for further analysis.

2.2. Sequence Analysis

The coding sequence (CDS) and genomic DNA sequences were obtained from the maize genome database (MaizeGDB) (https://www.maizegdb.org/, accessed on 1 August 2021). The fundamental data such as gene chromosomal location, position, strand position, the total number of transcripts, and intron and exon number was also retrieved from MaizeGDB. The physio-chemical properties of HSFs were predicted using the Expasy website (https://www.expasy.org/, accessed on 1 August 2021). Subcellular localization was predicted using two online tools, i.e., WoLFPSORT [49] and CELLO server.2.5 [50]. The conserved protein domains (through protein sequences) were identified using the MEME suite (https://meme-suite.org/meme/tools/meme, accessed on 1 August 2021) [51]. Twenty conserved motifs were identified using default parameters. Using CDS, the intron–exon structure of maize HSF genes was analyzed through GSDS 2.0 (http://gsds.gao-lab.org/, accessed on 1 August 2021) [52].

2.3. Sequence Alignment and Phylogenetic Analysis

The protein sequences of Arabidopsis thaliana, Oryza sativa, Brachypodium distachyon, and Sorghum bicolor were aligned with Zea mays HSFs through Clustal W [53]. Phylogenetic analysis was performed with the neighbor-joining method implemented in MEGA7.0 and tests were carried out with 1000 bootstrap replicates [54].

2.4. Gene Duplication and Evolutionary Analysis

Gene duplication events were investigated by following two parameters: (1) the length of an alignable sequence covers > 80% of the longer gene; and (2) the similarity of the aligned regions > 70% [55,56]. To analyze the molecular evolutionary rates of duplicated gene pairs, the non-synonymous substitution (Ka) and synonymous substitution (Ks) ratio were calculated using Ka/Ks calculation tool (http://services.cbu.uib.no/tools/kaks, accessed on 1 August 2021). In principle, the value of Ka/Ks < 1 signifies the purifying selection (negative selection), Ka/Ks > 1 signifies positive selection, and Ka/Ks = 1 means neutral selection [57]. Based on a rate of 6.1 × 10⁻⁹ substitutions per site per year, the divergence time (T) was calculated as T = Ks/(2 × 6.1 × 10−9) × 10−6 million years ago (Mya) for HSF genes [57]. The duplicated HSF genes were connected using Tbtools [58].

2.5. Chromosomal Distribution

Based on their initial positions on the maize genome, the HSF genes were named, and a chromosomal graph was constructed using Tbtools.

2.6. Expression Profiling of HSF Genes

The RNA-seq data utilized in the current study was retrieved from the maize MaizeGDB database (https://qteller.maizegdb.org/genes_by_name_B73v4.php, accessed on 1 August 2021). Previously, a comprehensive maize gene expression analysis was performed by Stelpflug et al. [59], used in the current study. We analyzed HSF profiles in 3 different growth stages (seed, vegetative, and reproductive) and across 20 different tissues (embryo, endosperm, whole seed, primary root, tap root, whole root, stem and shoot apical meristem, immature leaves, tip of stage 2 leaf, mature leaf tissue, pooled leaves, topmost leaves, vegetative meristem and surrounding tissues, immature tassel, meiotic tassel, anthers, mature pollen, mature female spikelet, pre-pollination cob, immature cob, and silks) (Table S4). Furthermore, the expression patterns were investigated at different timescales in a particular developmental stage to get an overview of the spatiotemporal expression of HSFs. In addition, the expression of ZmHSFs was also analyzed under abiotic (heat, drought, salinity, cold, UV) stress conditions. For the construction of the heatmap, FPKM values were used, which are already available on MaizeGDB. The heatmap was constructed using Tbtools.

2.7. Protein 3D Structure, Network Interaction, and Gene Ontology Analysis

The three-dimensional (3D) structure of maize HSFs was predicted through AlphaFold (https://www.alphafold.ebi.ac.uk/, accessed on 1 August 2021) [60]. For this, the protein IDs were entered into the search bar and the structures were obtained. The protein interaction network analysis was performed using the STRING database (https://string-db.org/, accessed on 1 August 2021) using default parameters, i.e., sequences showing more than 40% identity in the database were included for interaction networking [61]. The network interaction file was downloaded and visualized using Cytoscape V. 3.8.2 (https://cytoscape.org/, accessed on 1 August 2021) [62]. Gene ontology annotation analysis was performed by uploading the gene IDs of ZmHSFs to the GENE ONTOLOGY RESOURCE (http://geneontology.org/, accessed on 1 August 2021) [63].

3. Results

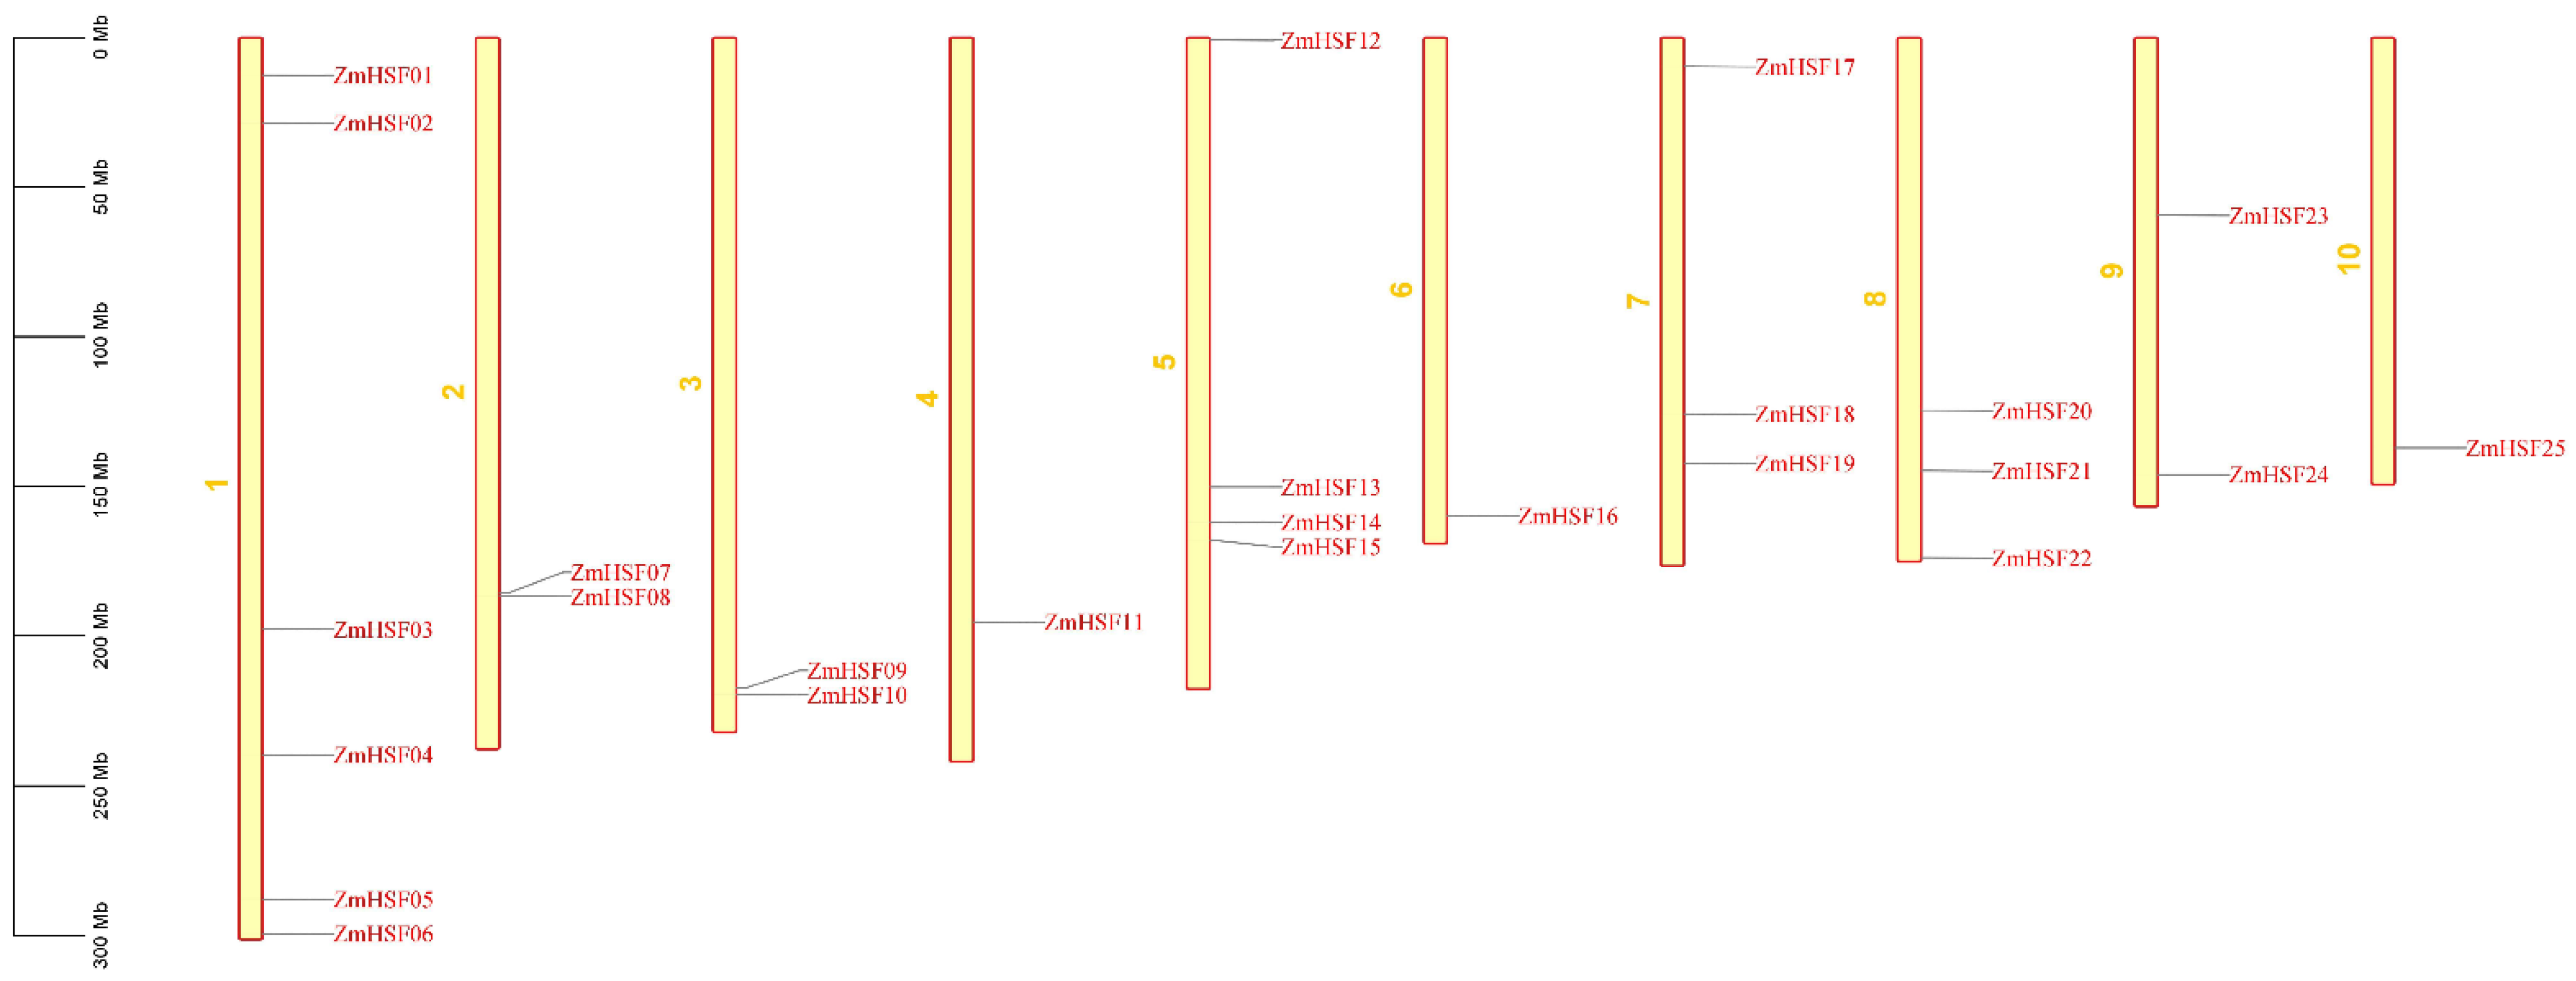
3.1. Identification and Chromosomal Distribution of Maize HSFs

With the availability of the genomic sequences of the number of plant species, including maize, it is now possible to obtain the protein sequences of all the HSF members. In the present study, a total of 25 HSFs were identified from the maize genome (Figure 1; Table 1). All the HSF proteins were surveyed for the presence of DBD and OD through EMBL-EBI, employing HMM. Furthermore, SMART was used to search the HSF-DBD to check the accuracy of the results. After discarding redundant sequences, 25 ZmHSFs were selected for analysis. These HSFs were named based on their chromosomal locations (ZmHSF-01 to ZmHSF-25) (Table S1). The characteristics of maize HSF genes are presented in Table 1. All the HSFs were mapped on the chromosomes of maize (Figure 1). The maize genome was shown to possess HSF genes on all of its chromosomes, though the number of HSFs between different chromosomes varied considerably. Chromosome 1 had a maximum of 6 HSFs genes, whereas a single HSF gene copy was localized on each of chromosomes 4, 6, and 10. On the other hand, chromosomes 2, 3, 7, and 9 harbor two gene copies each, while three gene copies were recognized on each of chromosomes 5 and 8. Except for ZmHSF01, ZmHSF02, ZmHSF12, ZmHSF16, and ZmHSF23, all the other HSF genes were present on the lower arm of the chromosomes.

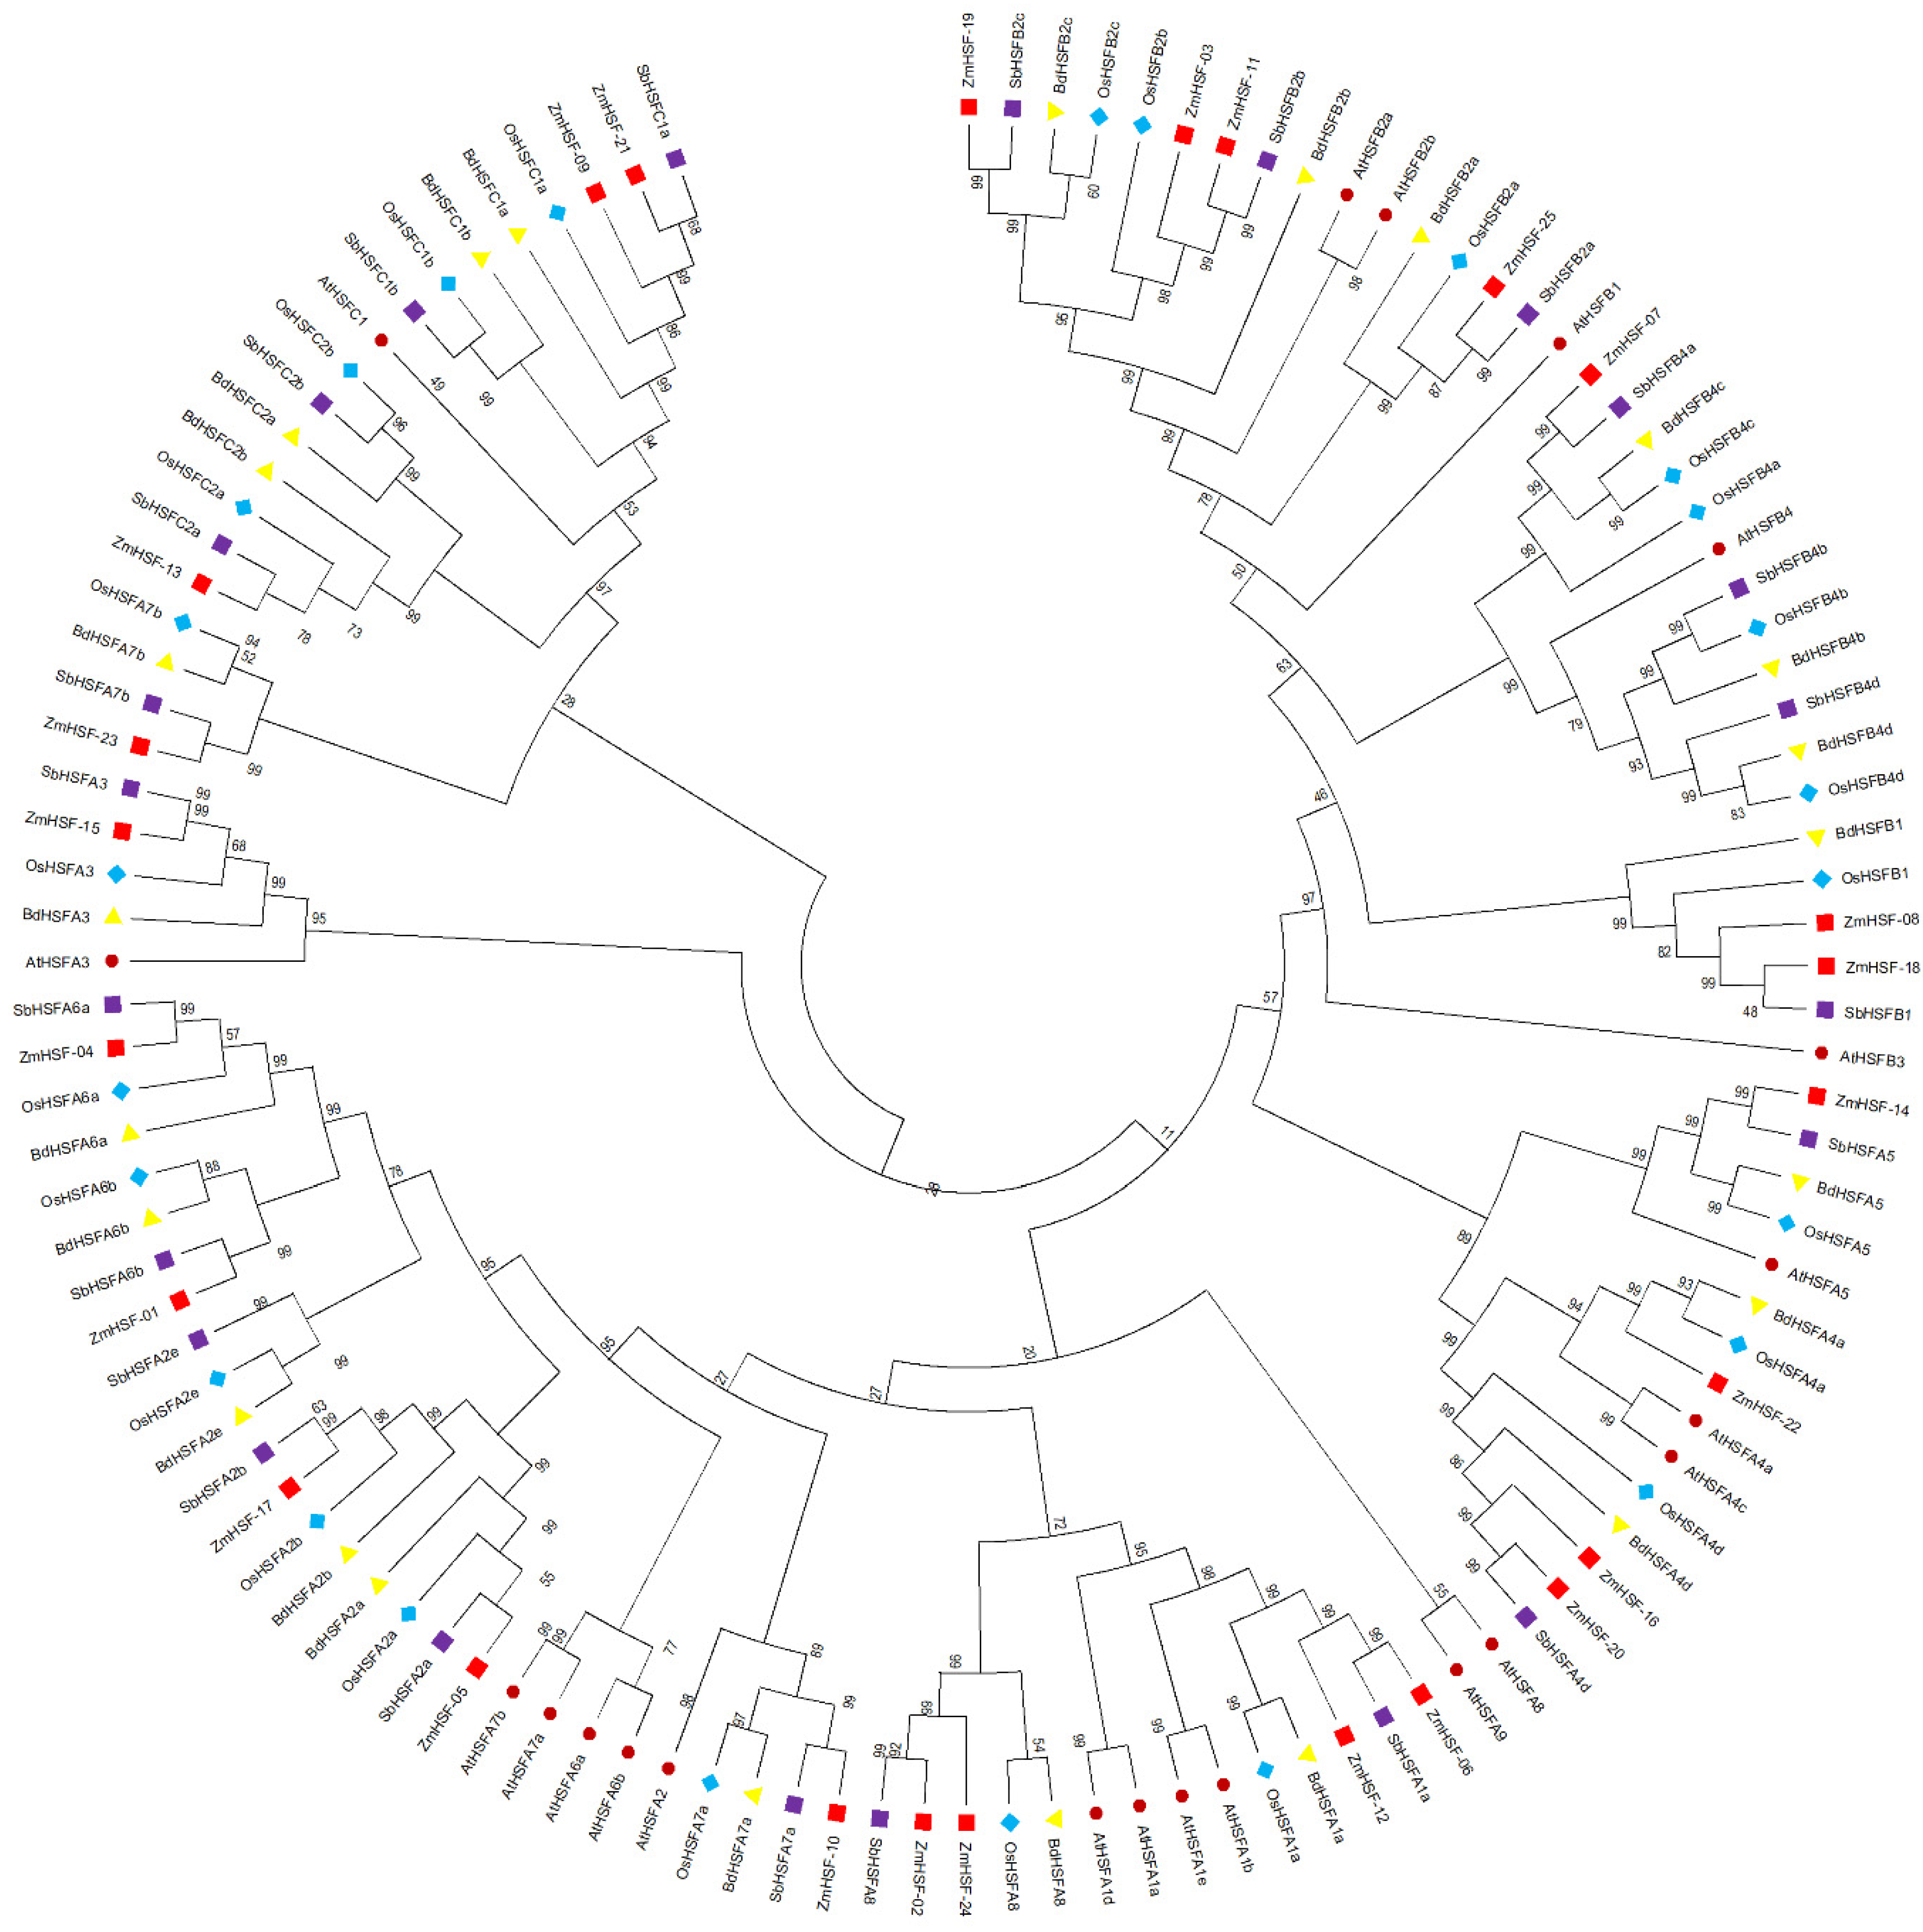
3.2. Phylogenetic Analysis and Classification of Maize HSFs

In present study, the evolutionary relationship among AtHSFs, OsHSFs, SbHSFs, BdHSFs, and ZmHSFs was explored. A total of 118 HSFs were divided into three classes and 15 sub-classes based on the phylogenetic tree (Figure 2; Table S2). Variation in HSF gene number was observed among different plant species and between sub-groups (Table 2). For example, Arabidopsis thaliana contains 21 HSFs (15 HSFAs, 5 HSFBs, and 1 HSFC), the Oryza sativa possess 25 HSFs (13 HSFAs, 8 HSFBs, and 4 HSFCs), Zea mays harbors 25 HSFs in its genome (15 HSFAs, 7 HSFBs, and 3 HSFCs), Brachypodium distachyon 24 HSFs (14 HSFAs, 7 HSFBs, and 4 HSFCs), while Sorghum bicolor contains 23 HSFs (12 HSFAs, 7 HSFBs, and 4 HSFCs) (Table 2). Results indicated that maize HSFs were close to sorghum HSFs. Similarly, HSFs of rice were closer to Brachypodium HSFs, which is in line with the botanical classification among monocots. In contrast to Arabidopsis, sub-class A1 contains fewer HSFs in monocots (Table 2). On the other hand, sub-class A2 appears to have expanded in monocots. There was no ortholog of Arabidopsis HSFA9, HSFB3 in monocots that might reflect the loss of these sub-groups in family Poaceae (Figure 2, Table 2). Contrarily, this could also signify the gain of these sub-groups in dicots. A higher number of class C HSFs was observed in monocots.

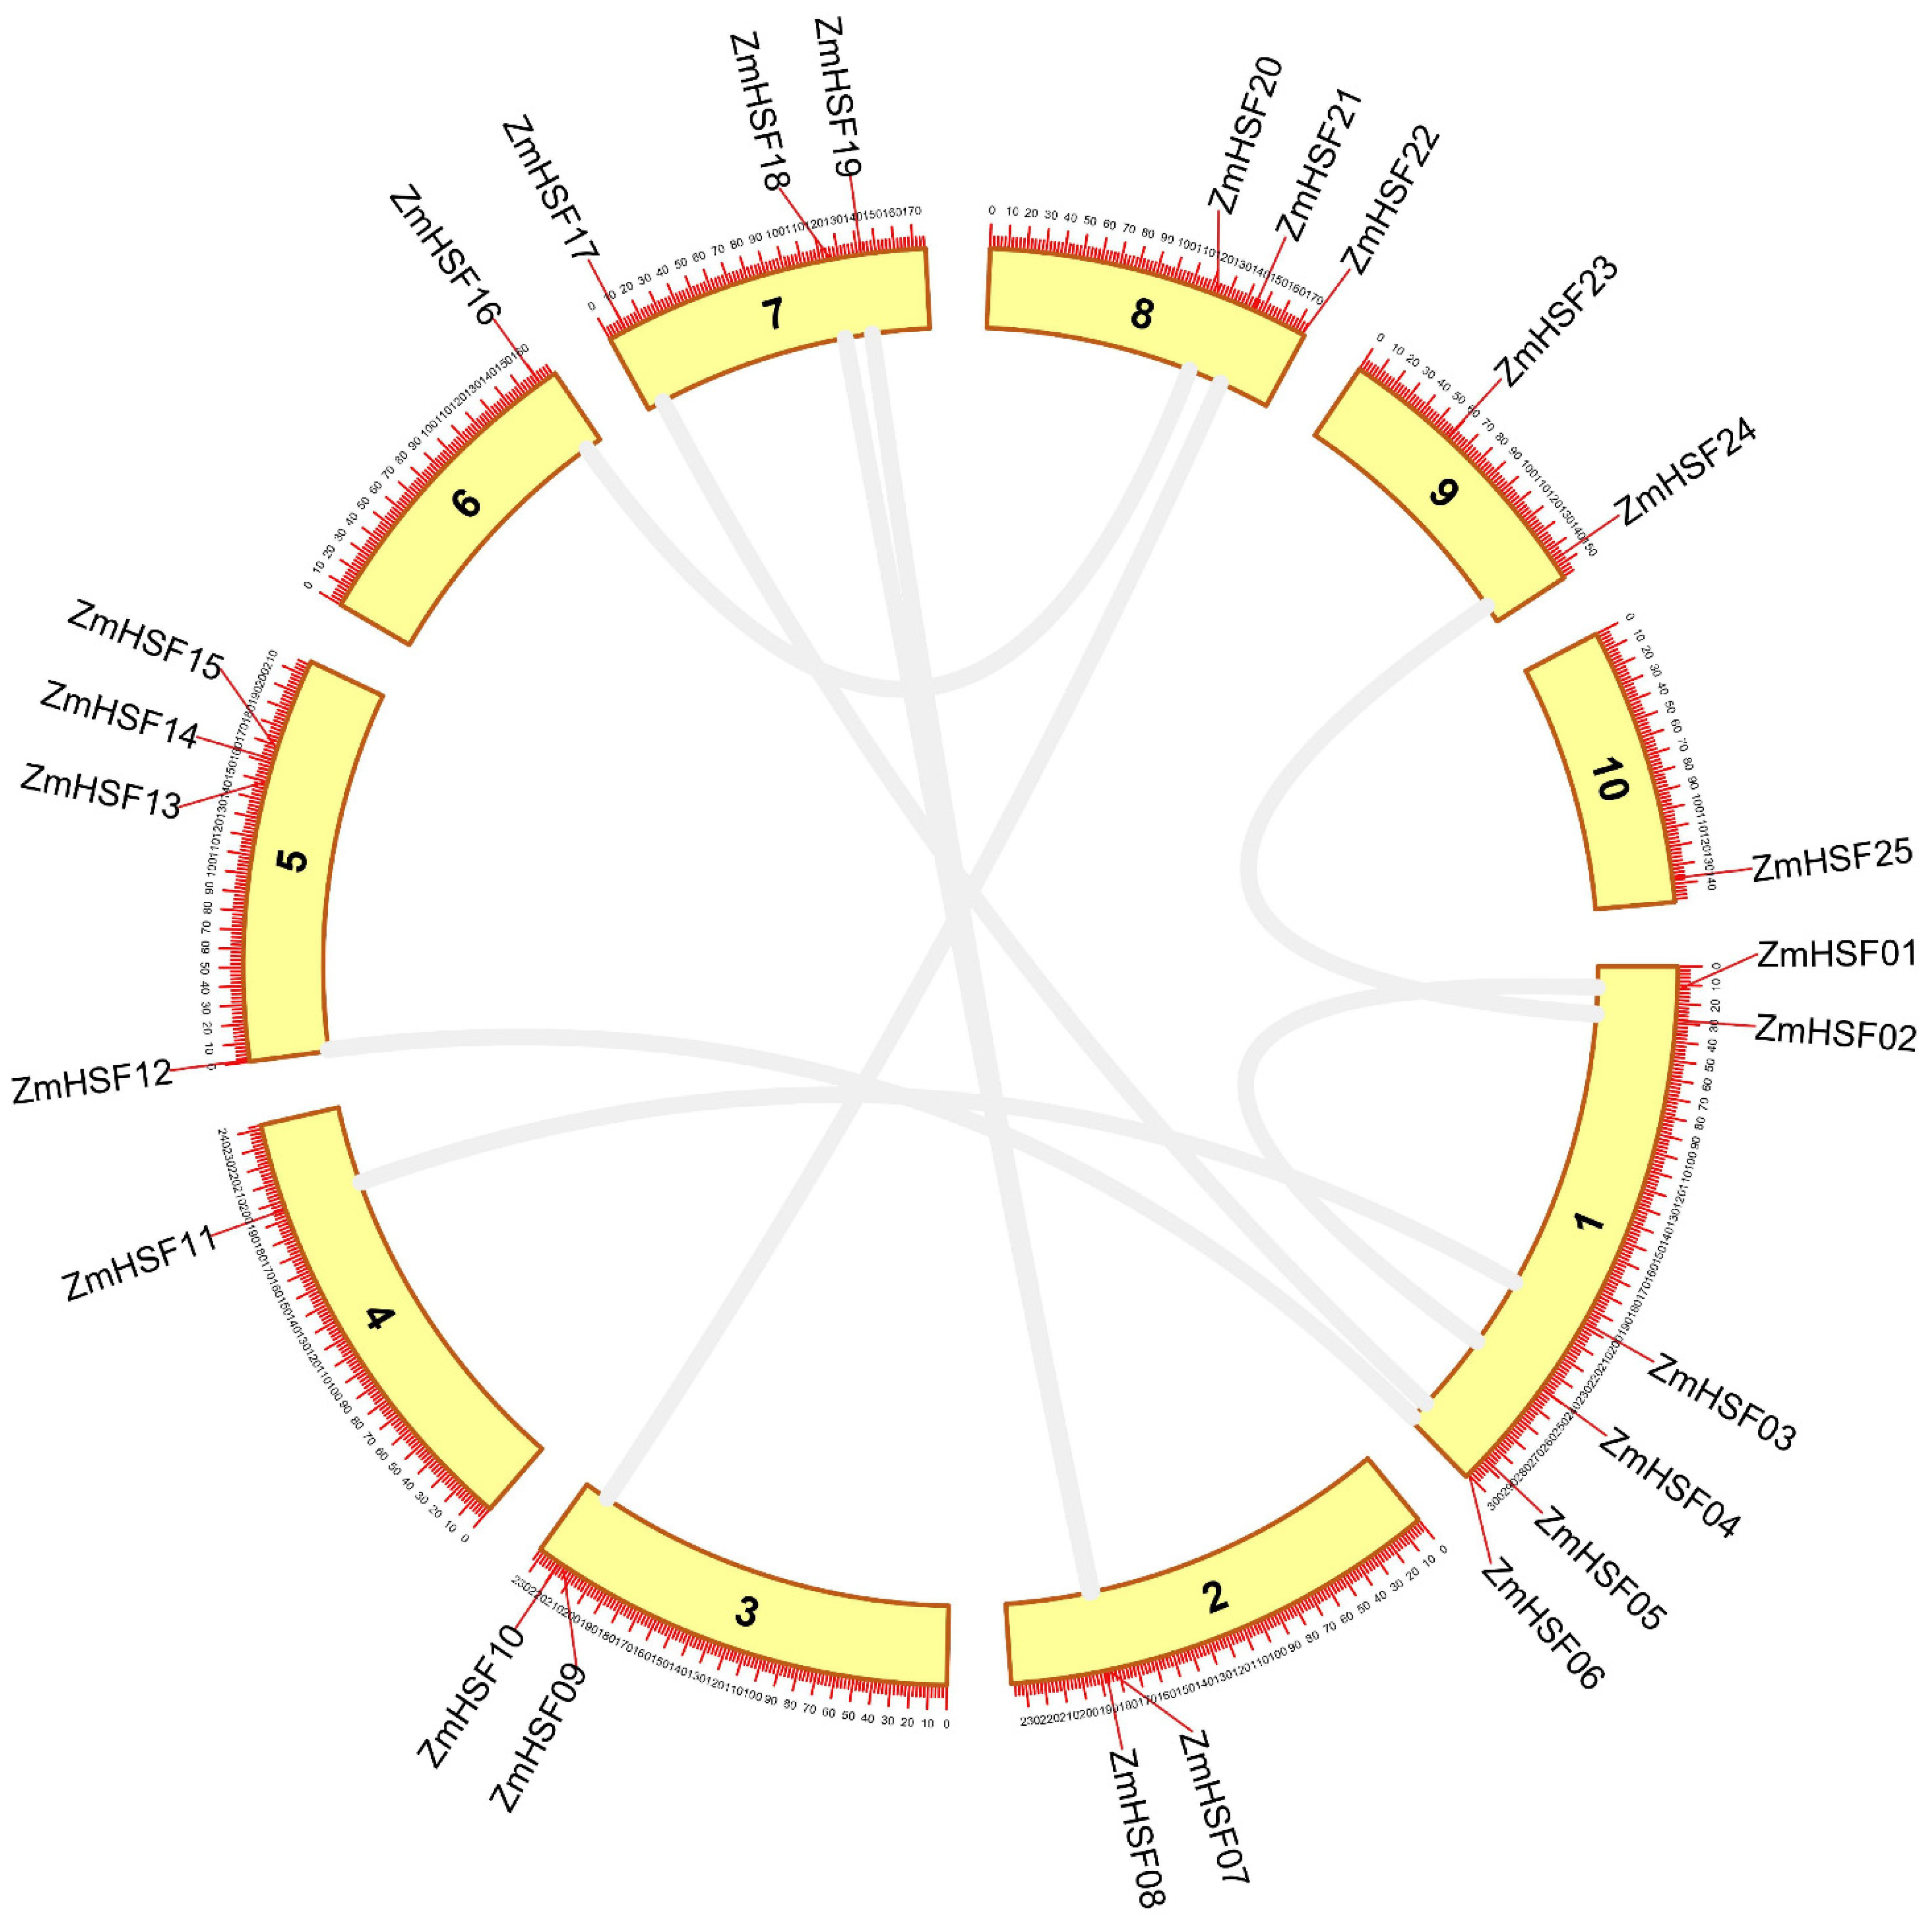
3.3. Gene Duplication Analysis and Evolutionary Rate Calculation

In the present study, a total of 18 (18/25; 72%) maize HSF genes were shown to be duplicated (Table 3). Further, only one pair of a gene (ZmHSF-01/Zm-HSF-04) appeared to be tandemly duplicated, which was recognized on chromosome number 1 (Figure 3). The rest of duplicated genes were all segmentally duplicated, with eight different clusters containing 16 genes. These genes were recognized on chromosomes 1–9. Moreover, the molecular evolutionary rate of tandemly and segmentally duplicated HSF genes was calculated to gain insights into the selective constraints on the duplicated HSF genes. The ratio of Ka and Ks substitution rate is an effective method to investigate the selective constraint among duplicated gene pairs [64]. Hence, in the present study, Ka, Ks, and Ka/Ks values for each paralogous gene pair were calculated (Table 3). Here, 18 ZmHSF genes were shown to be duplicated. The Ka/Ks ratio for duplicated ZmHSF genes ranged from 0.3415 to 0.7572. All the HSF genes in the present study have Ka/Ks value < 1.
The outcome suggests that these genes were under strong purifying selection pressure by natural selection during the course of evolution. Further, the divergence periods of tandemly and segmentally duplicated ZmHSF genes were estimated to range from 5.96 to 38.04 with an average of 20.89 million years ago (MYA). Some paralogous gene pairs (ZmHSF-02/ZmHSF-24, ZmHSF-09/ZmHSF21, and ZmHSF-16/ZmHSF20) appeared to be recently duplicated (Table 3). The grass species are estimated to have diverged around 56–73 MYA [65,66]. In the present analysis, all the HSF genes in maize appeared to have duplicated after the divergence of grass species. Further, most of the HSF genes in maize are paralogs, and it can be concluded that duplication events (primarily segmental) played a significant role in the expansion of the HSF gene family in maize.

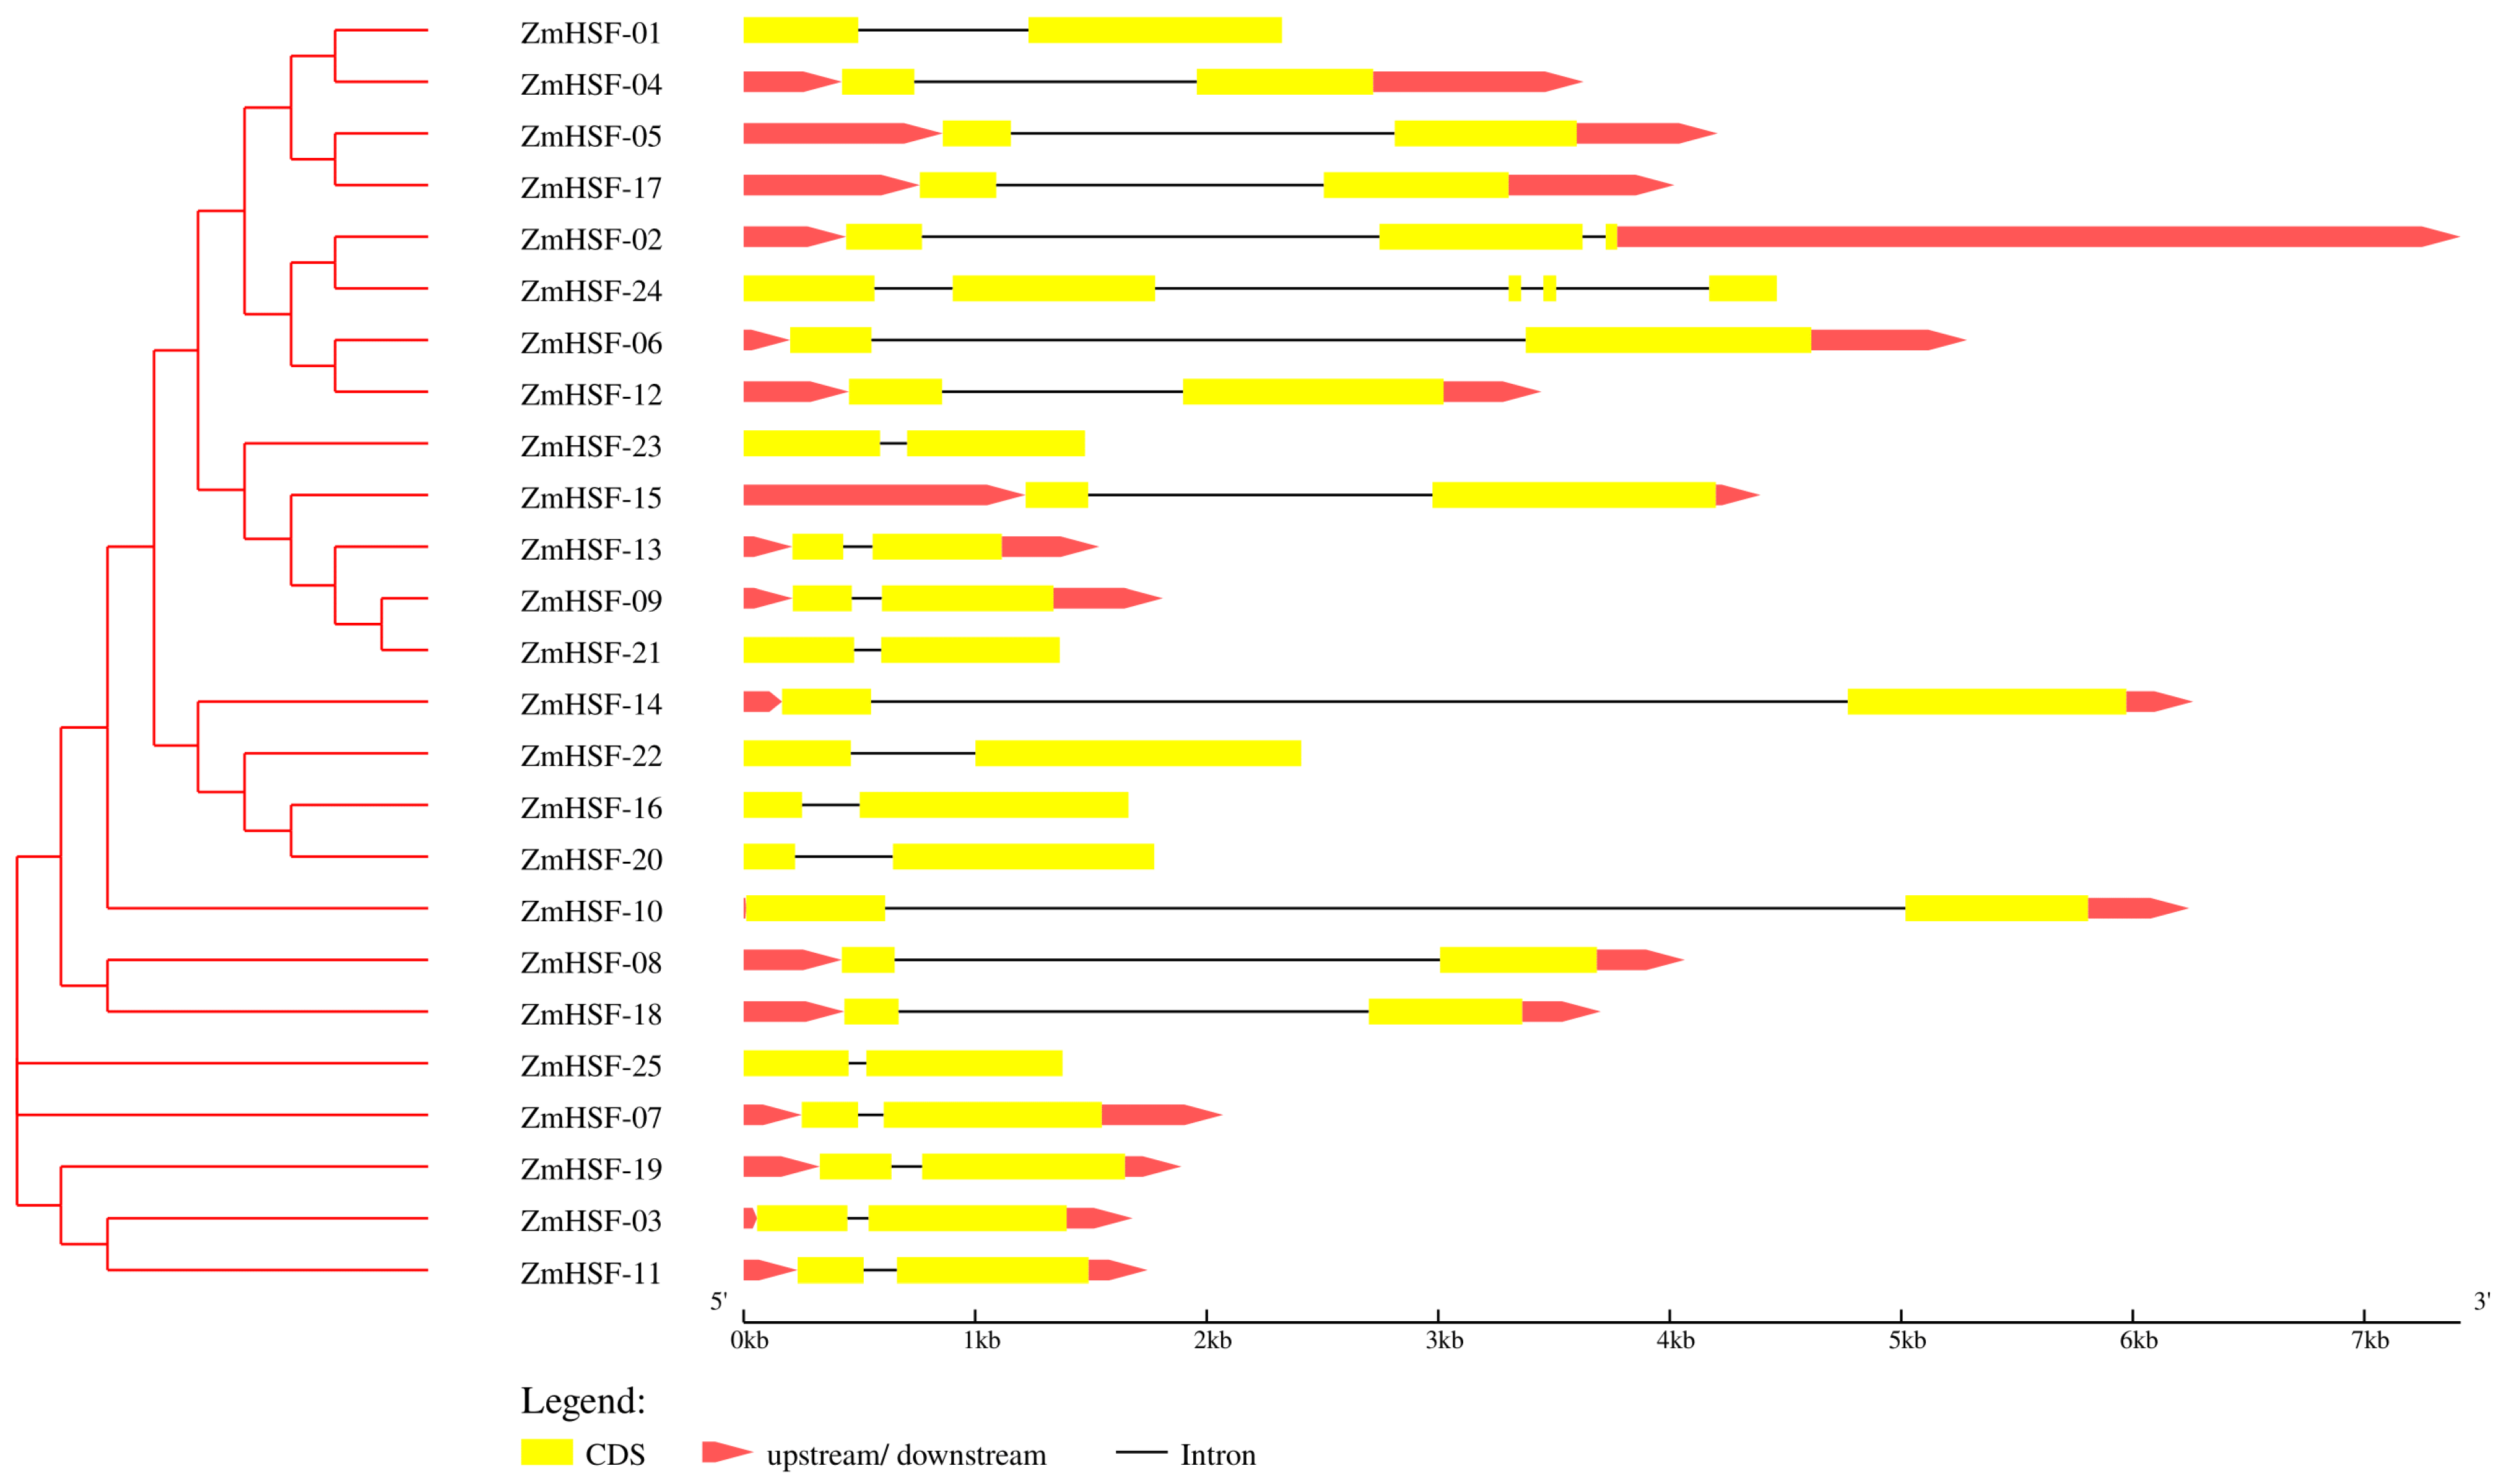
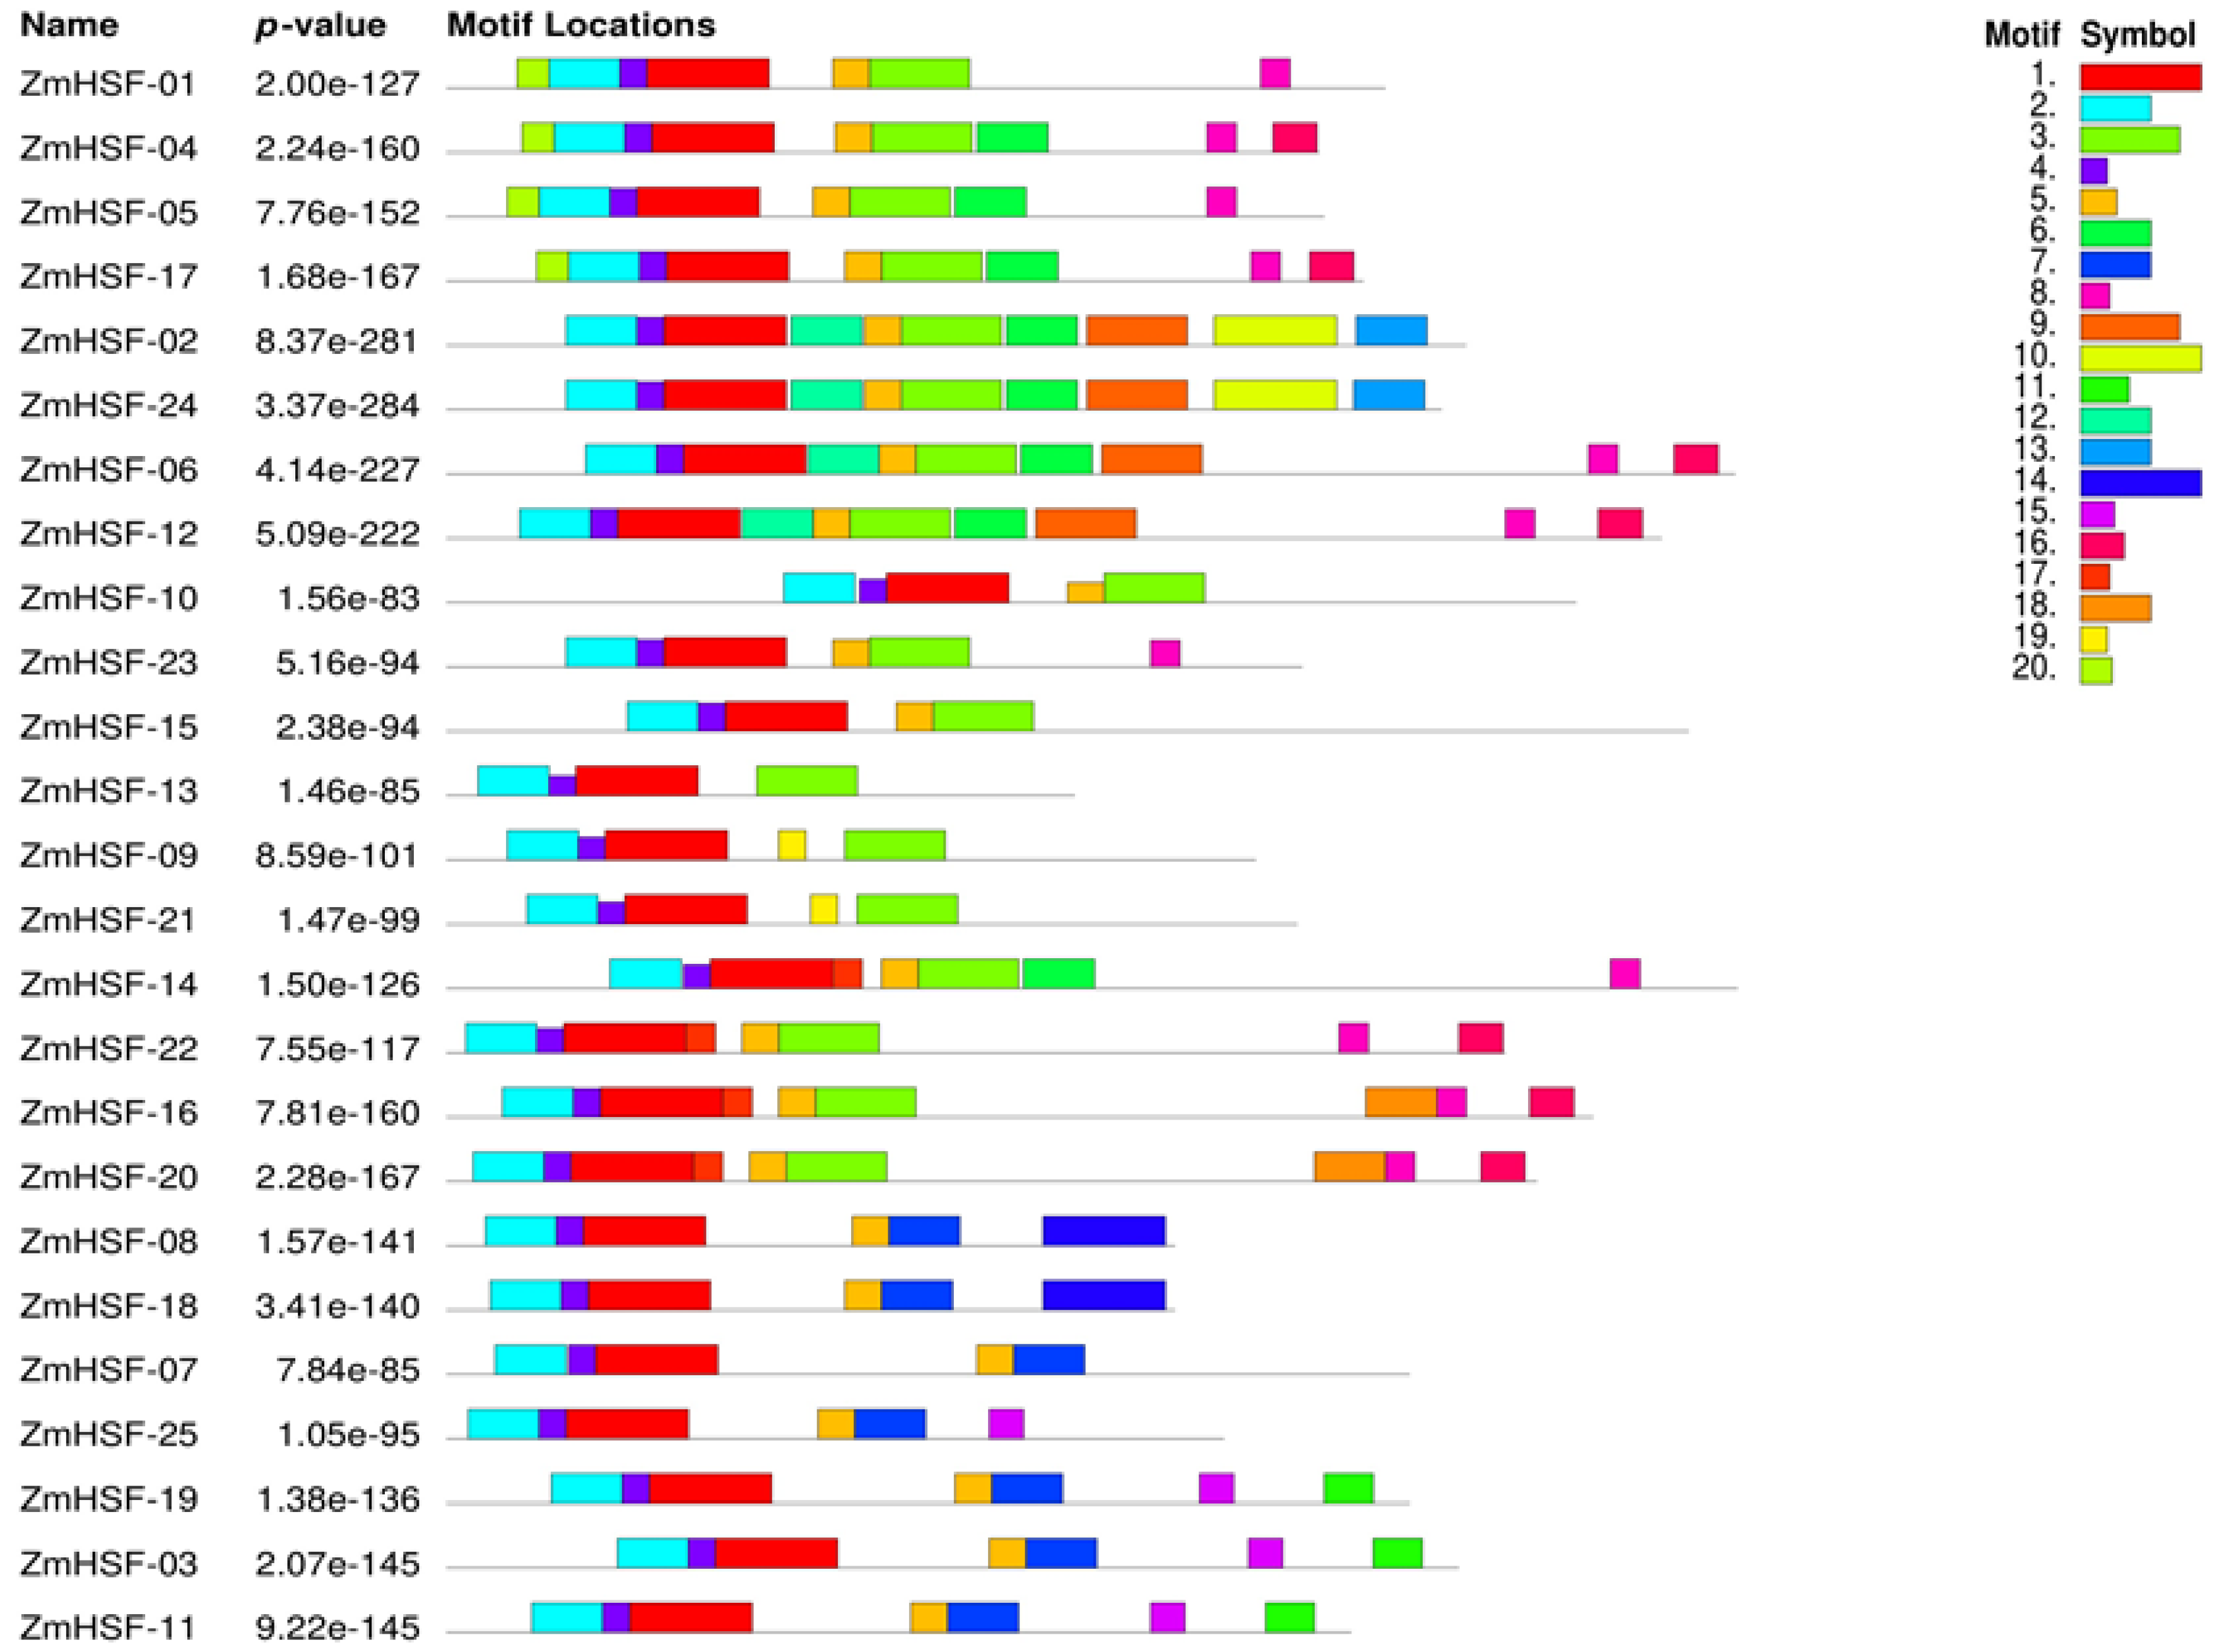
3.4. Gene Structure and Protein Motif Analysis

To investigate the structural relationship among the HSF genes, the intron–exon organization of all the targeted HSFs was analyzed using GSDS software. The intron–exon structure and number play a key role in the evolution of gene families [67,68]. The gene structure analysis was in line with the phylogenetic relationship among maize HSFs (Figure 4). In general, the intron and exon numbers were shown to be highly consistent. Particularly, 92% (23/25) HSFs contain only one intron except for HSF-02 and HSF-24 (Figure 4). Similarly, HSF-02 and HSF-24 were shown to contain three and five exons. In contrast, the rest of the HSF genes contained two exons. Further, 17 HSFs contained 5′ UTR and 3′ UTR. The HSF genes belonging to the same class and sub-class showed a similar intron–exon pattern in terms of intron number, exon length, intron phase, and overall gene length (Figure 4).
MEME was used to identify the conserved motifs/regions responsible for DNA-binding, oligomerization, nuclear localization, nuclear export, and biological activation of HSFs (Figure 5). In total, 20 motifs designated as motifs 1–20 were identified among maize HSF proteins (Table 4). The highly conserved DBD is represented by motifs 1, 2, and 4. Motif 3 corresponds to OD of class A and C HSFs. The HR-A core region of OD is represented by motif 5 and is present in all HSFs. OD of class B HSFs is depicted by motif 7. Motif 6 constitutes the NLS of class A HSFs and is present in eight members. The AHA motif is shown by motif 8 and is present in 11 class A HSFs. The NES of class A HSFs is represented by motif 16. Motif 15 constitutes the NLS of Class B2 HSFs. Certain HSFs also possess class-specific conserved motifs i.e., ZmHSF-02 and ZmHSF-24 contain motifs 10 and 13, HSFs of subclass B1 harbor motif 14, sub-class C1 HSFs motif 19, the sub-class B2 HSFs motif 11, and sub-class A4 members (ZmHSF-16, ZmHSF-20) contain motif 18. Motifs 9 and 12 are present in the same members of class A HSFs. Four members of class A HSFs contain motif 17. Motif 18 is found in two members of class A HSFs. Finally, motif 20 is found in members of sub-class A2 and A6 HSFs.

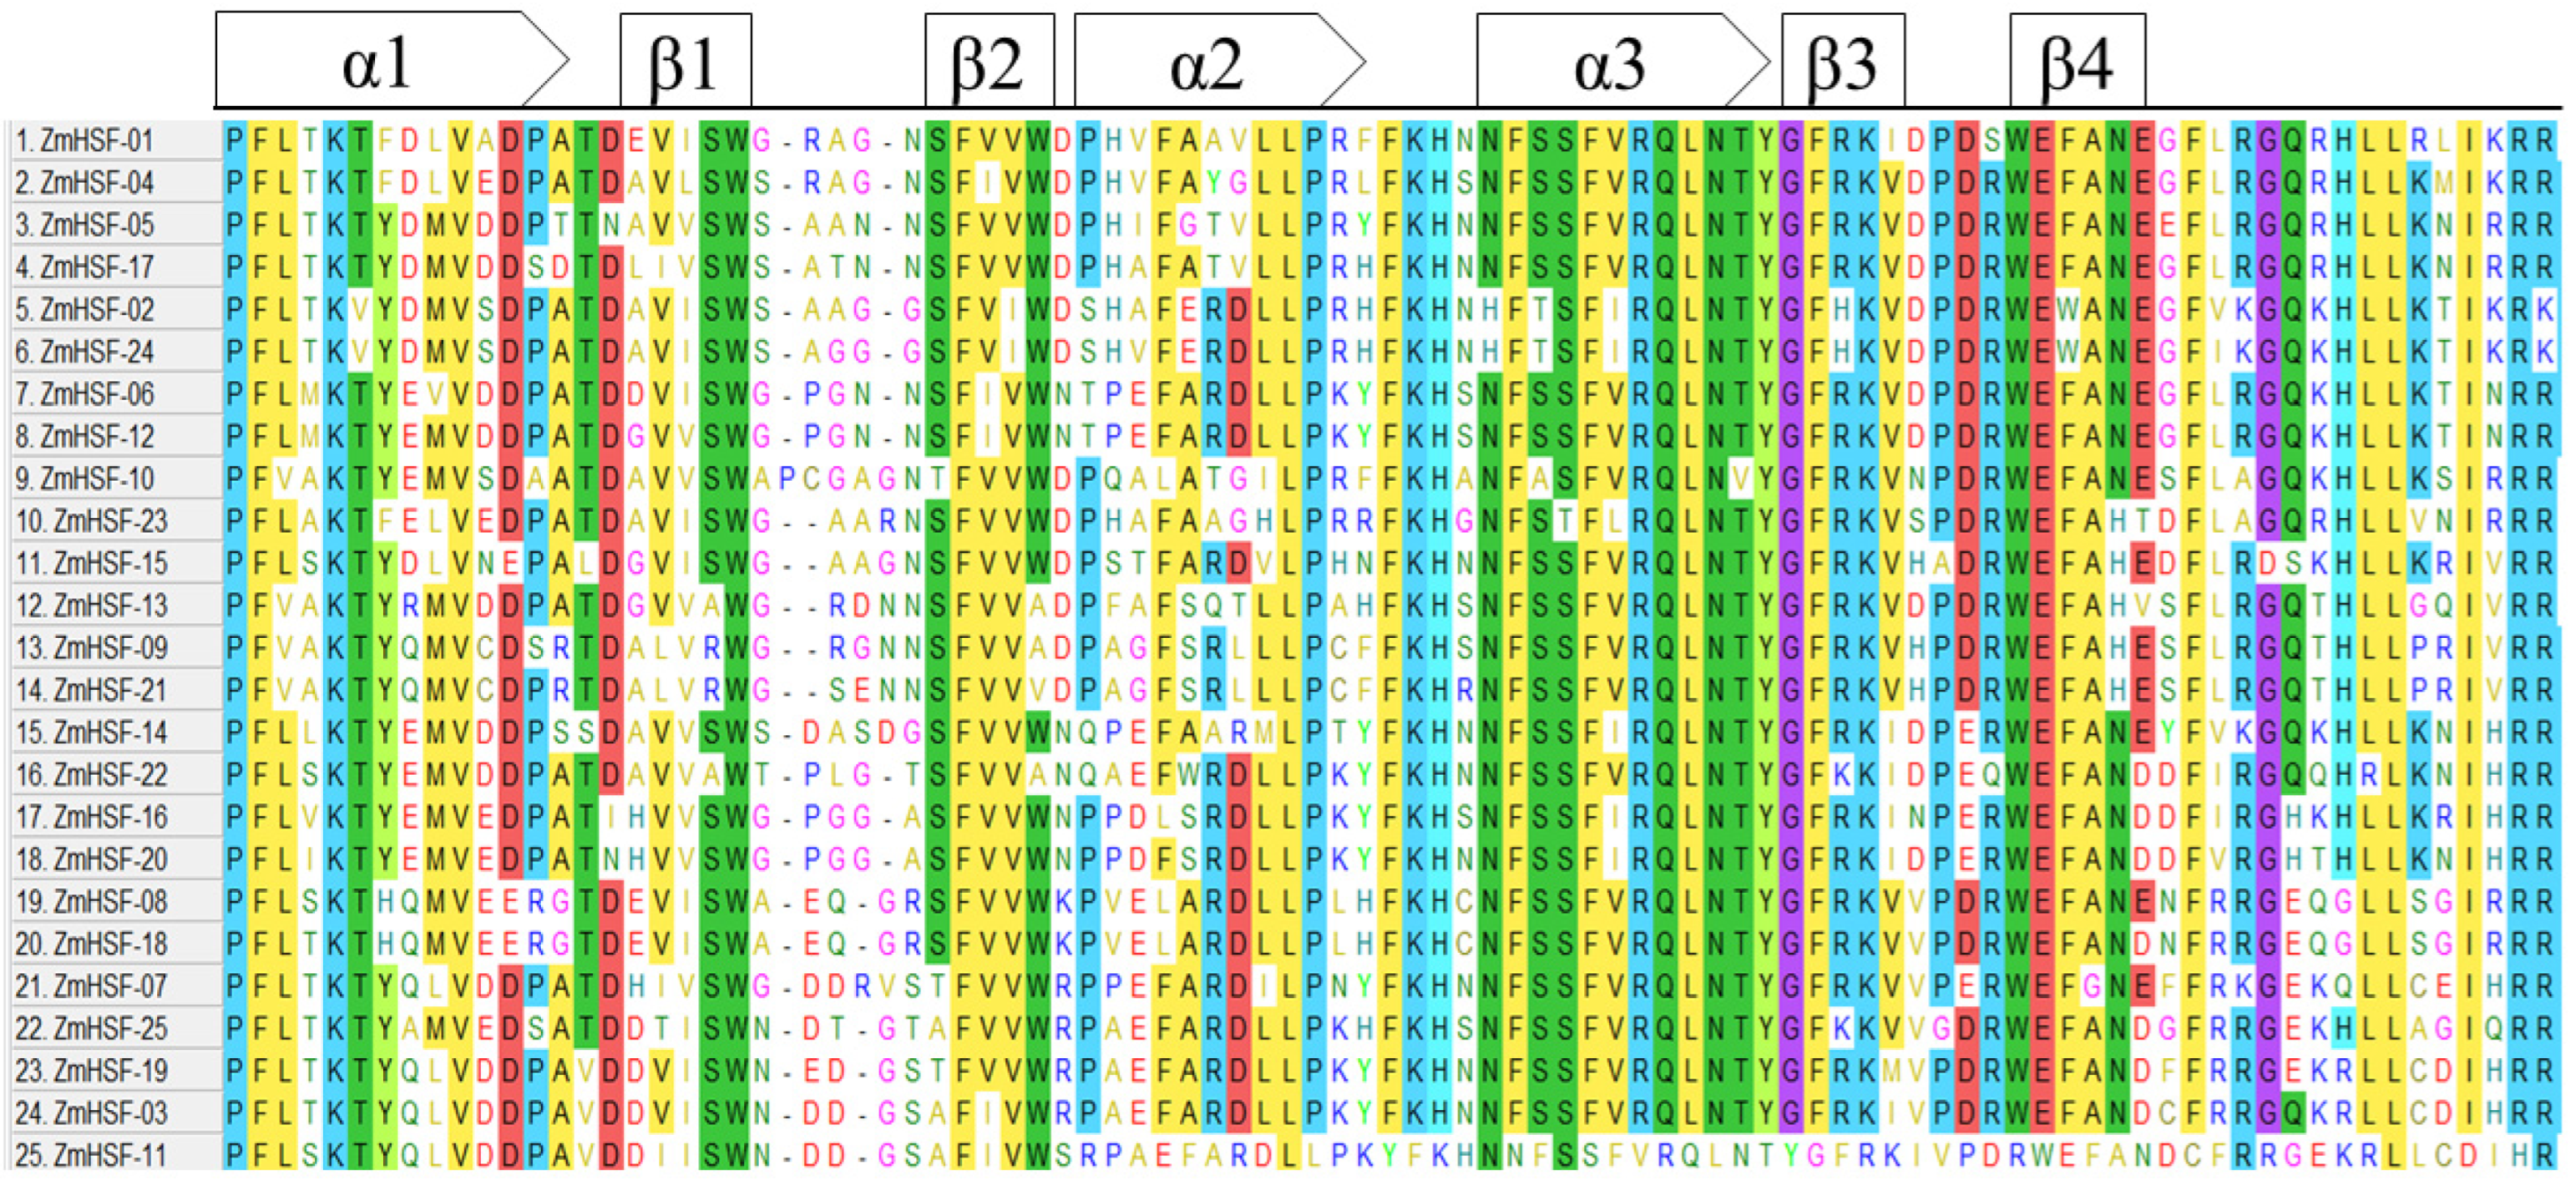
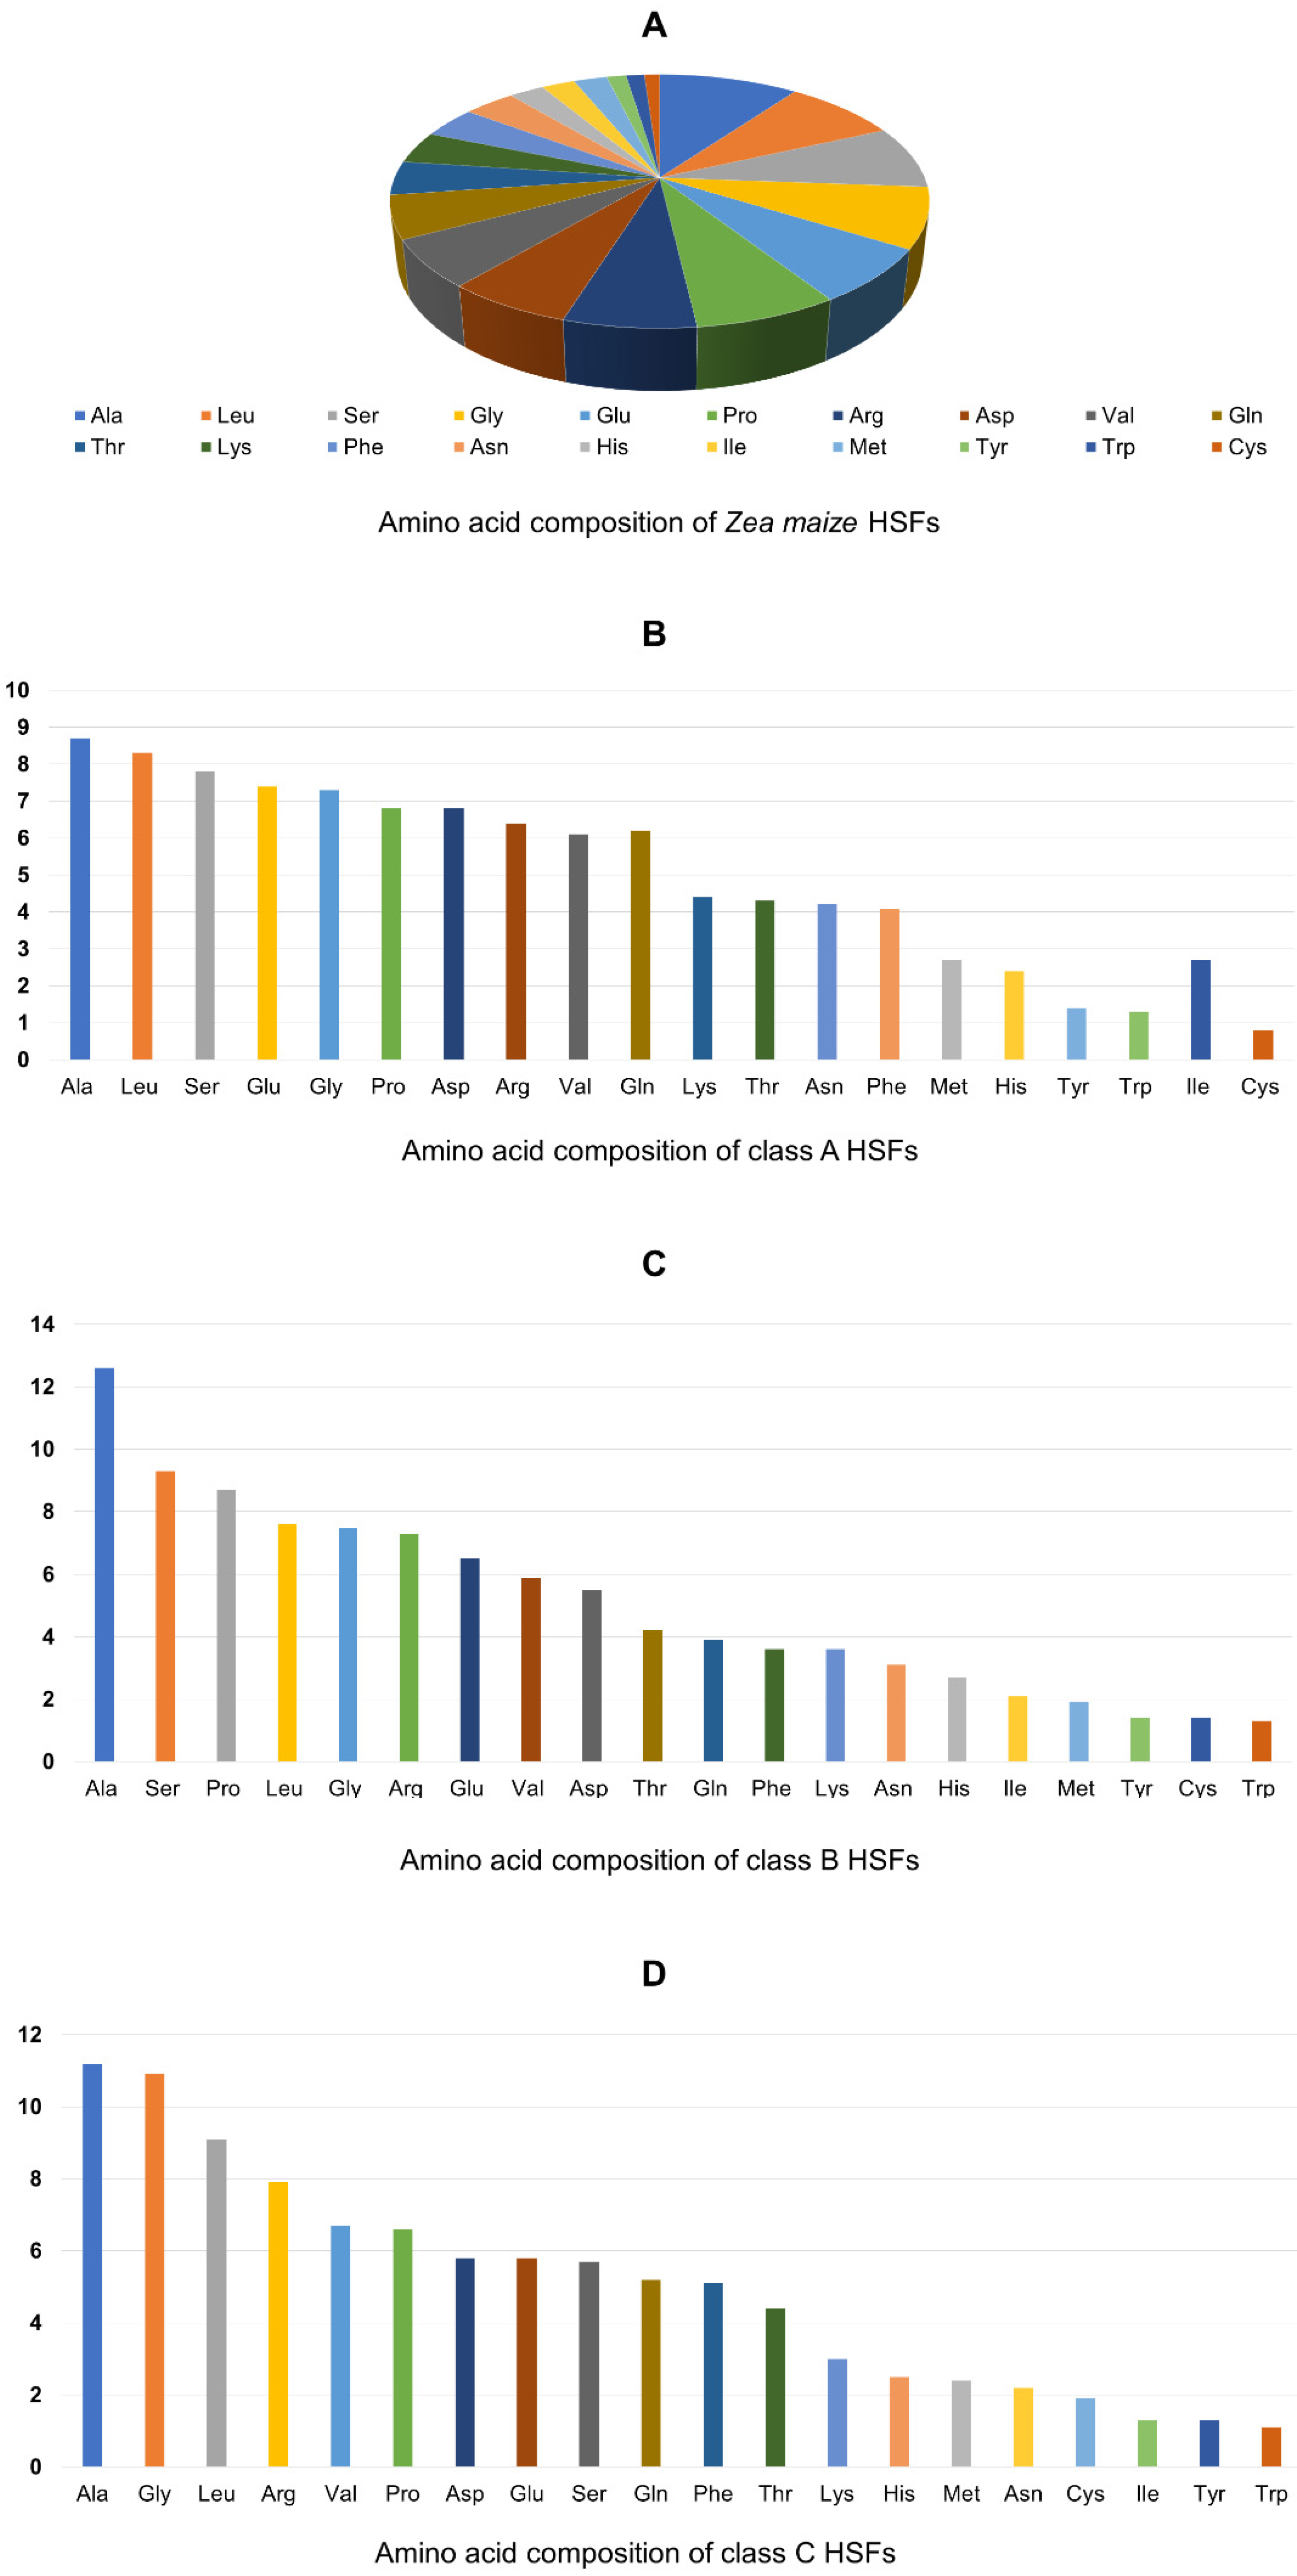
3.5. Domain Analysis and Physio-Chemical Properties

The modular structure and the functional domains of HSFs have been studied and described extensively [22]. The HSF-type DBD was highly conserved and consisted of approximately 100 amino acids (Figure 6). The locations of DBD and OD were predicted using SMART and MARCOIL (Table 5). The DBD of most maize HSFs was located at the beginning of the N-terminal. Few exceptions were ZmHSF-03, ZmHSF-10, ZmHSF-14, and ZmHSF-15. As expected, the linker length between DBD and OD of HSFBs was larger than HSFAs and HSFCs.
The physio-chemical properties of HSFs such as amino acid length, Mw, and pI were investigated using Expasy (Table 5). In addition, the amino acid composition of each group was analyzed using the online tool CoPId (Table S3). The amino acid length of class A HSF ranged from 350 (ZmHSF-23) to 528 (ZmHSF-14), for class B, 298 (ZmHSF-08) to 414 (ZmHSF-03), and in class C the amino acid length ranged from 257 (ZmHSF-13) to 348 (ZmHSF-21). The pI of class A HSFs ranged from 4.70 (ZmHSF-17) to 8.87 (ZmHSF-10). For class B it varied from 5.00 (ZmHSF-19) to 9.53 (ZmHSF-18), and for class C, pI ranged from 5.85 (ZmHSF-13) to 8.09 (ZmHSF-21). For class A, the Mw varied from 38.154 (ZmHSF-23) to 58.138 (ZmHSF-14), for class B it ranged from 33.258 (ZmHSF-18) to 44.381 (ZmHSF-03). While for class C HSFs, Mw ranged from 27.836 (ZmHSF-13) to 37.409 (ZmHSF-21). In general, the pI of class A HSFs was in acidic ranges except for ZmHSF-10, which was shown to be in a slightly basic range. The pI of class B was in slightly acidic and basic ranges. Finally, for class C the pI was in similar ranges as class B HSFs. The average amino acid composition of ZmHSFs ranged from 1.1 (cysteine) to 10.0 (alanine) (Figure 7A). The average amino acid composition of class A HSFs ranged from 0.8 (cysteine) to 8.7 (alanine) (Figure 7B). In contrast, the average amino acid composition of class B ranged from 1.3 (tryptophan) to 12.6 (alanine) (Figure 7C). Finally, the class C amino acid composition ranged from 1.1 (tryptophan) to 11.2 (alanine) (Figure 7D).

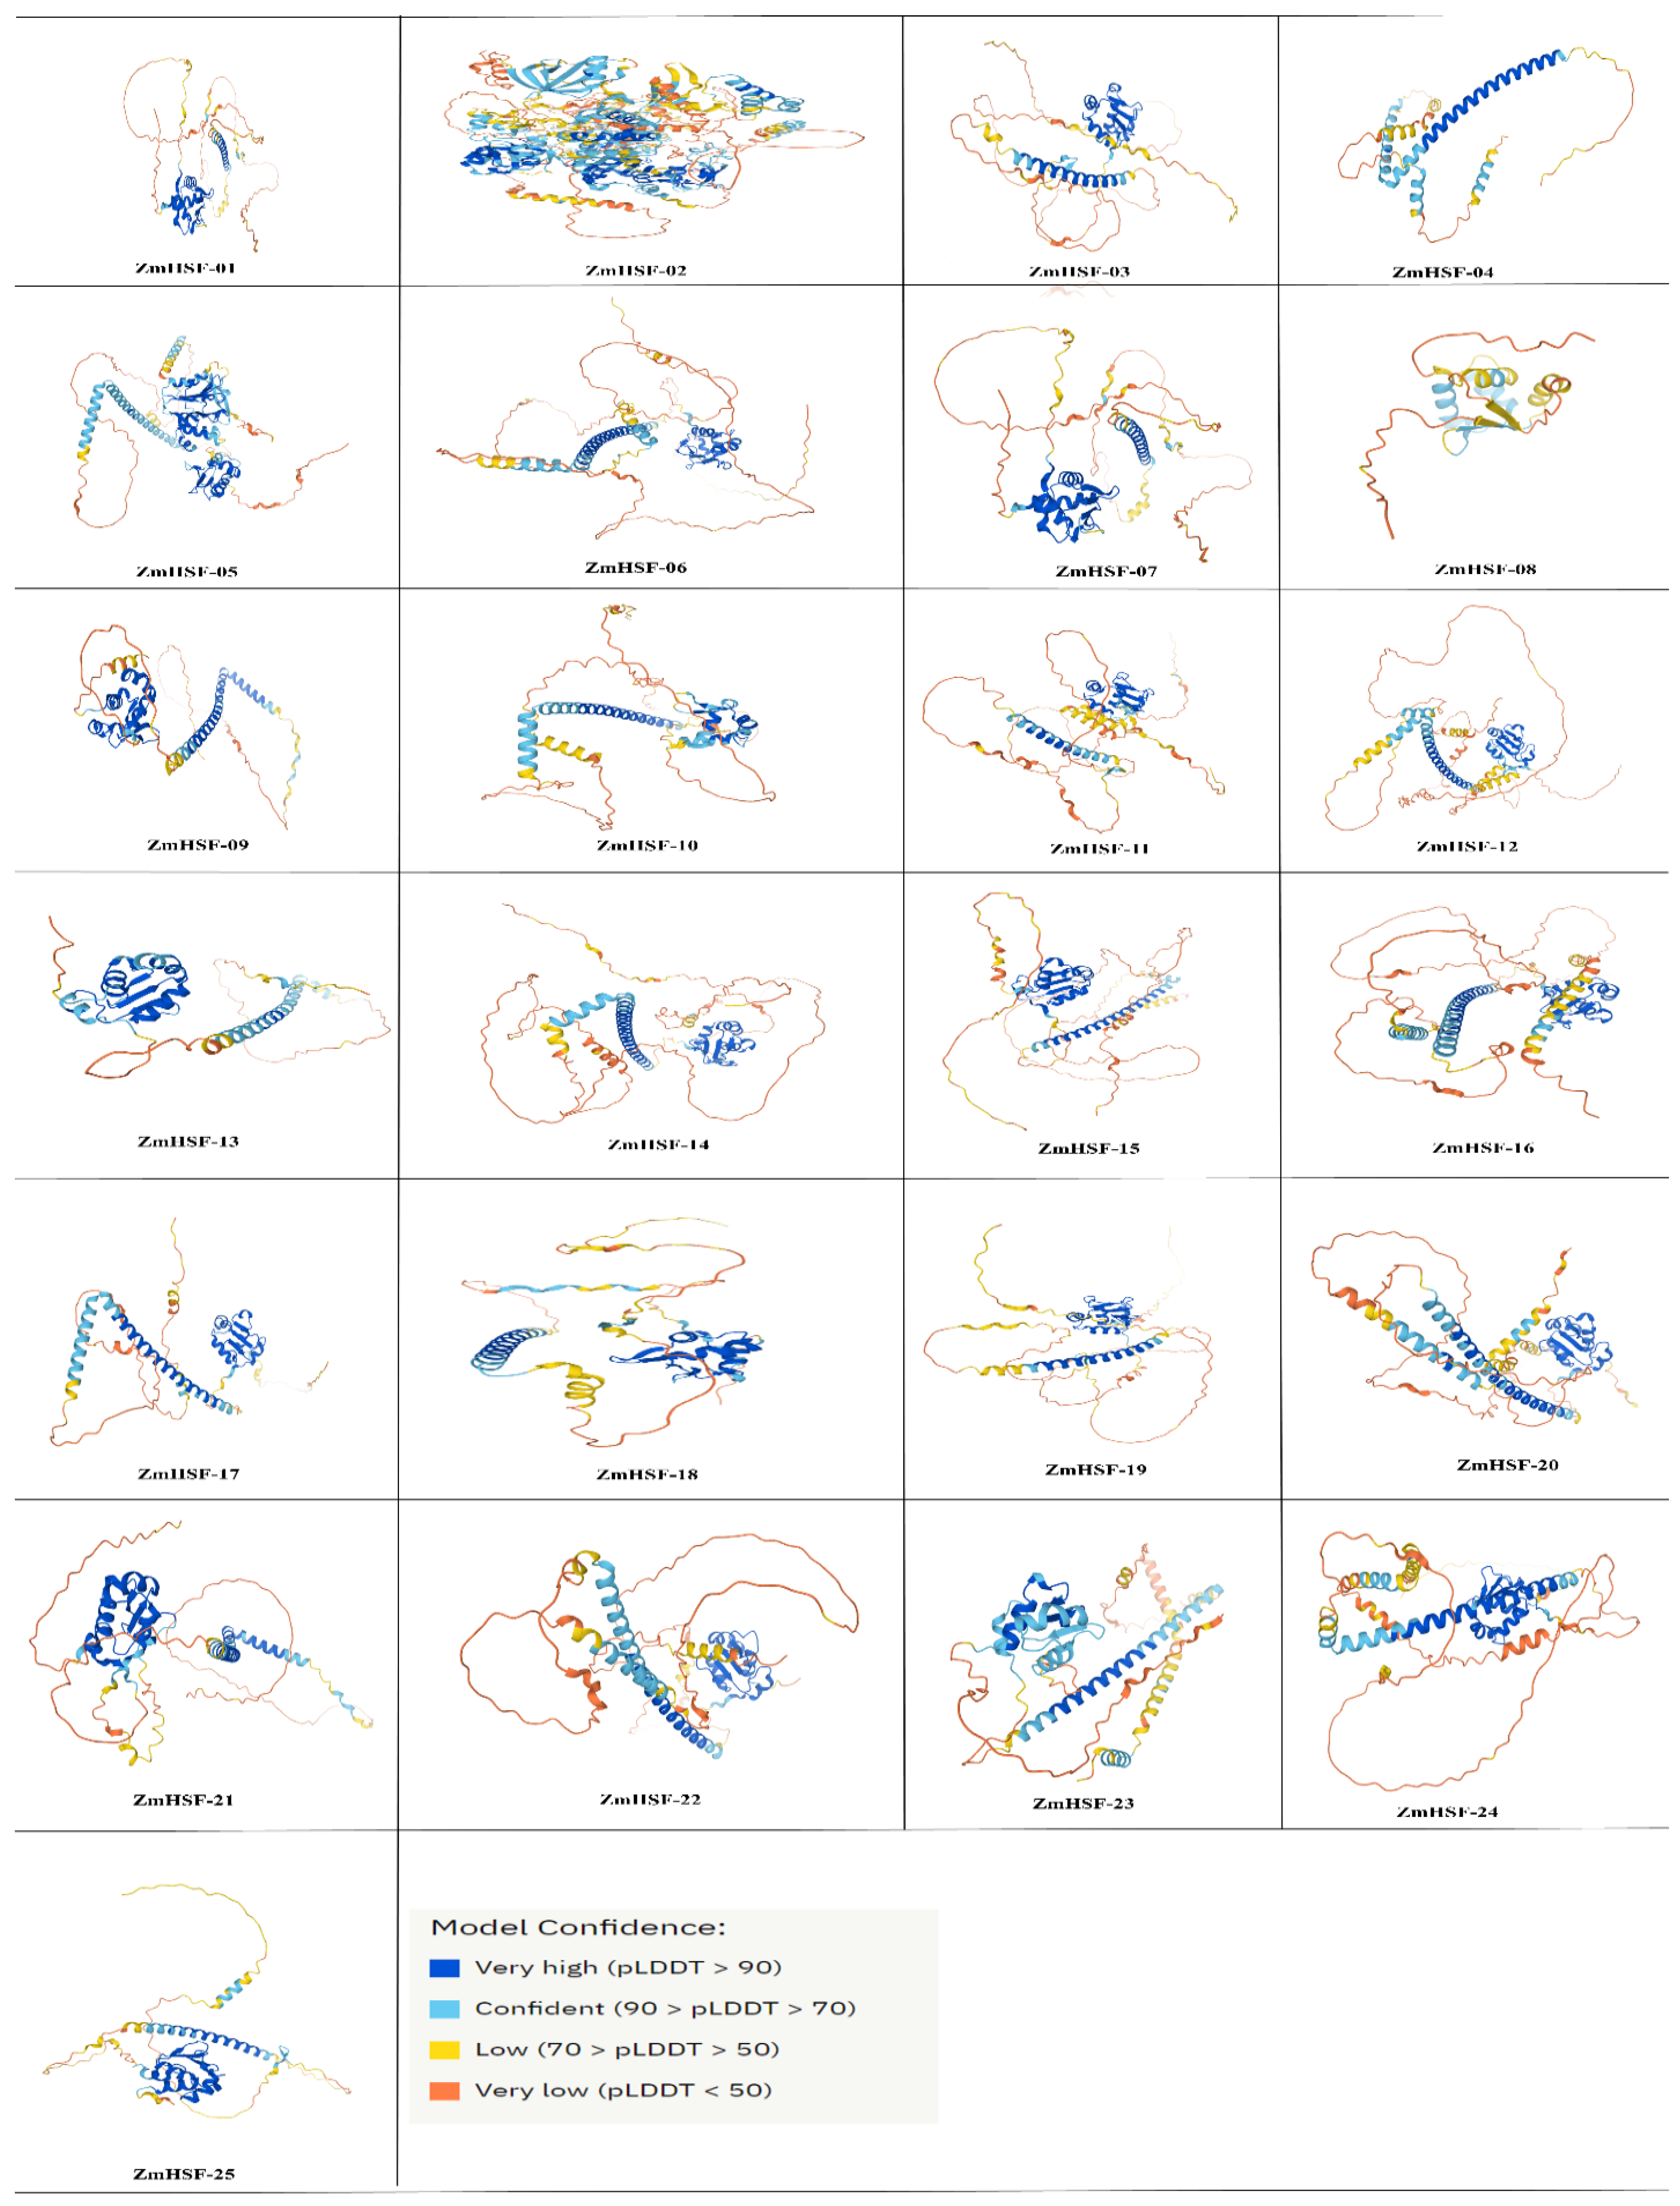
3.6. Proteins Structure and Sub-Cellular Localization of Maize HSFs

The protein structures of maize HSFs were predicted through Alphafold. The predicted models were downloaded to view their 3D structure (Figure 8). The highly conserved DBD is represented by α-helices and β-sheets. The OD can be seen to be linked with DBD through linker residues. Most maize HSFs were predicted to be localized inside the nucleus (Table 5). Exceptions were ZmHSF-10 and ZmHSF-23 (HSFA7a and HSFA7b). This indicates that class 7 HSFs might possess distinct properties.

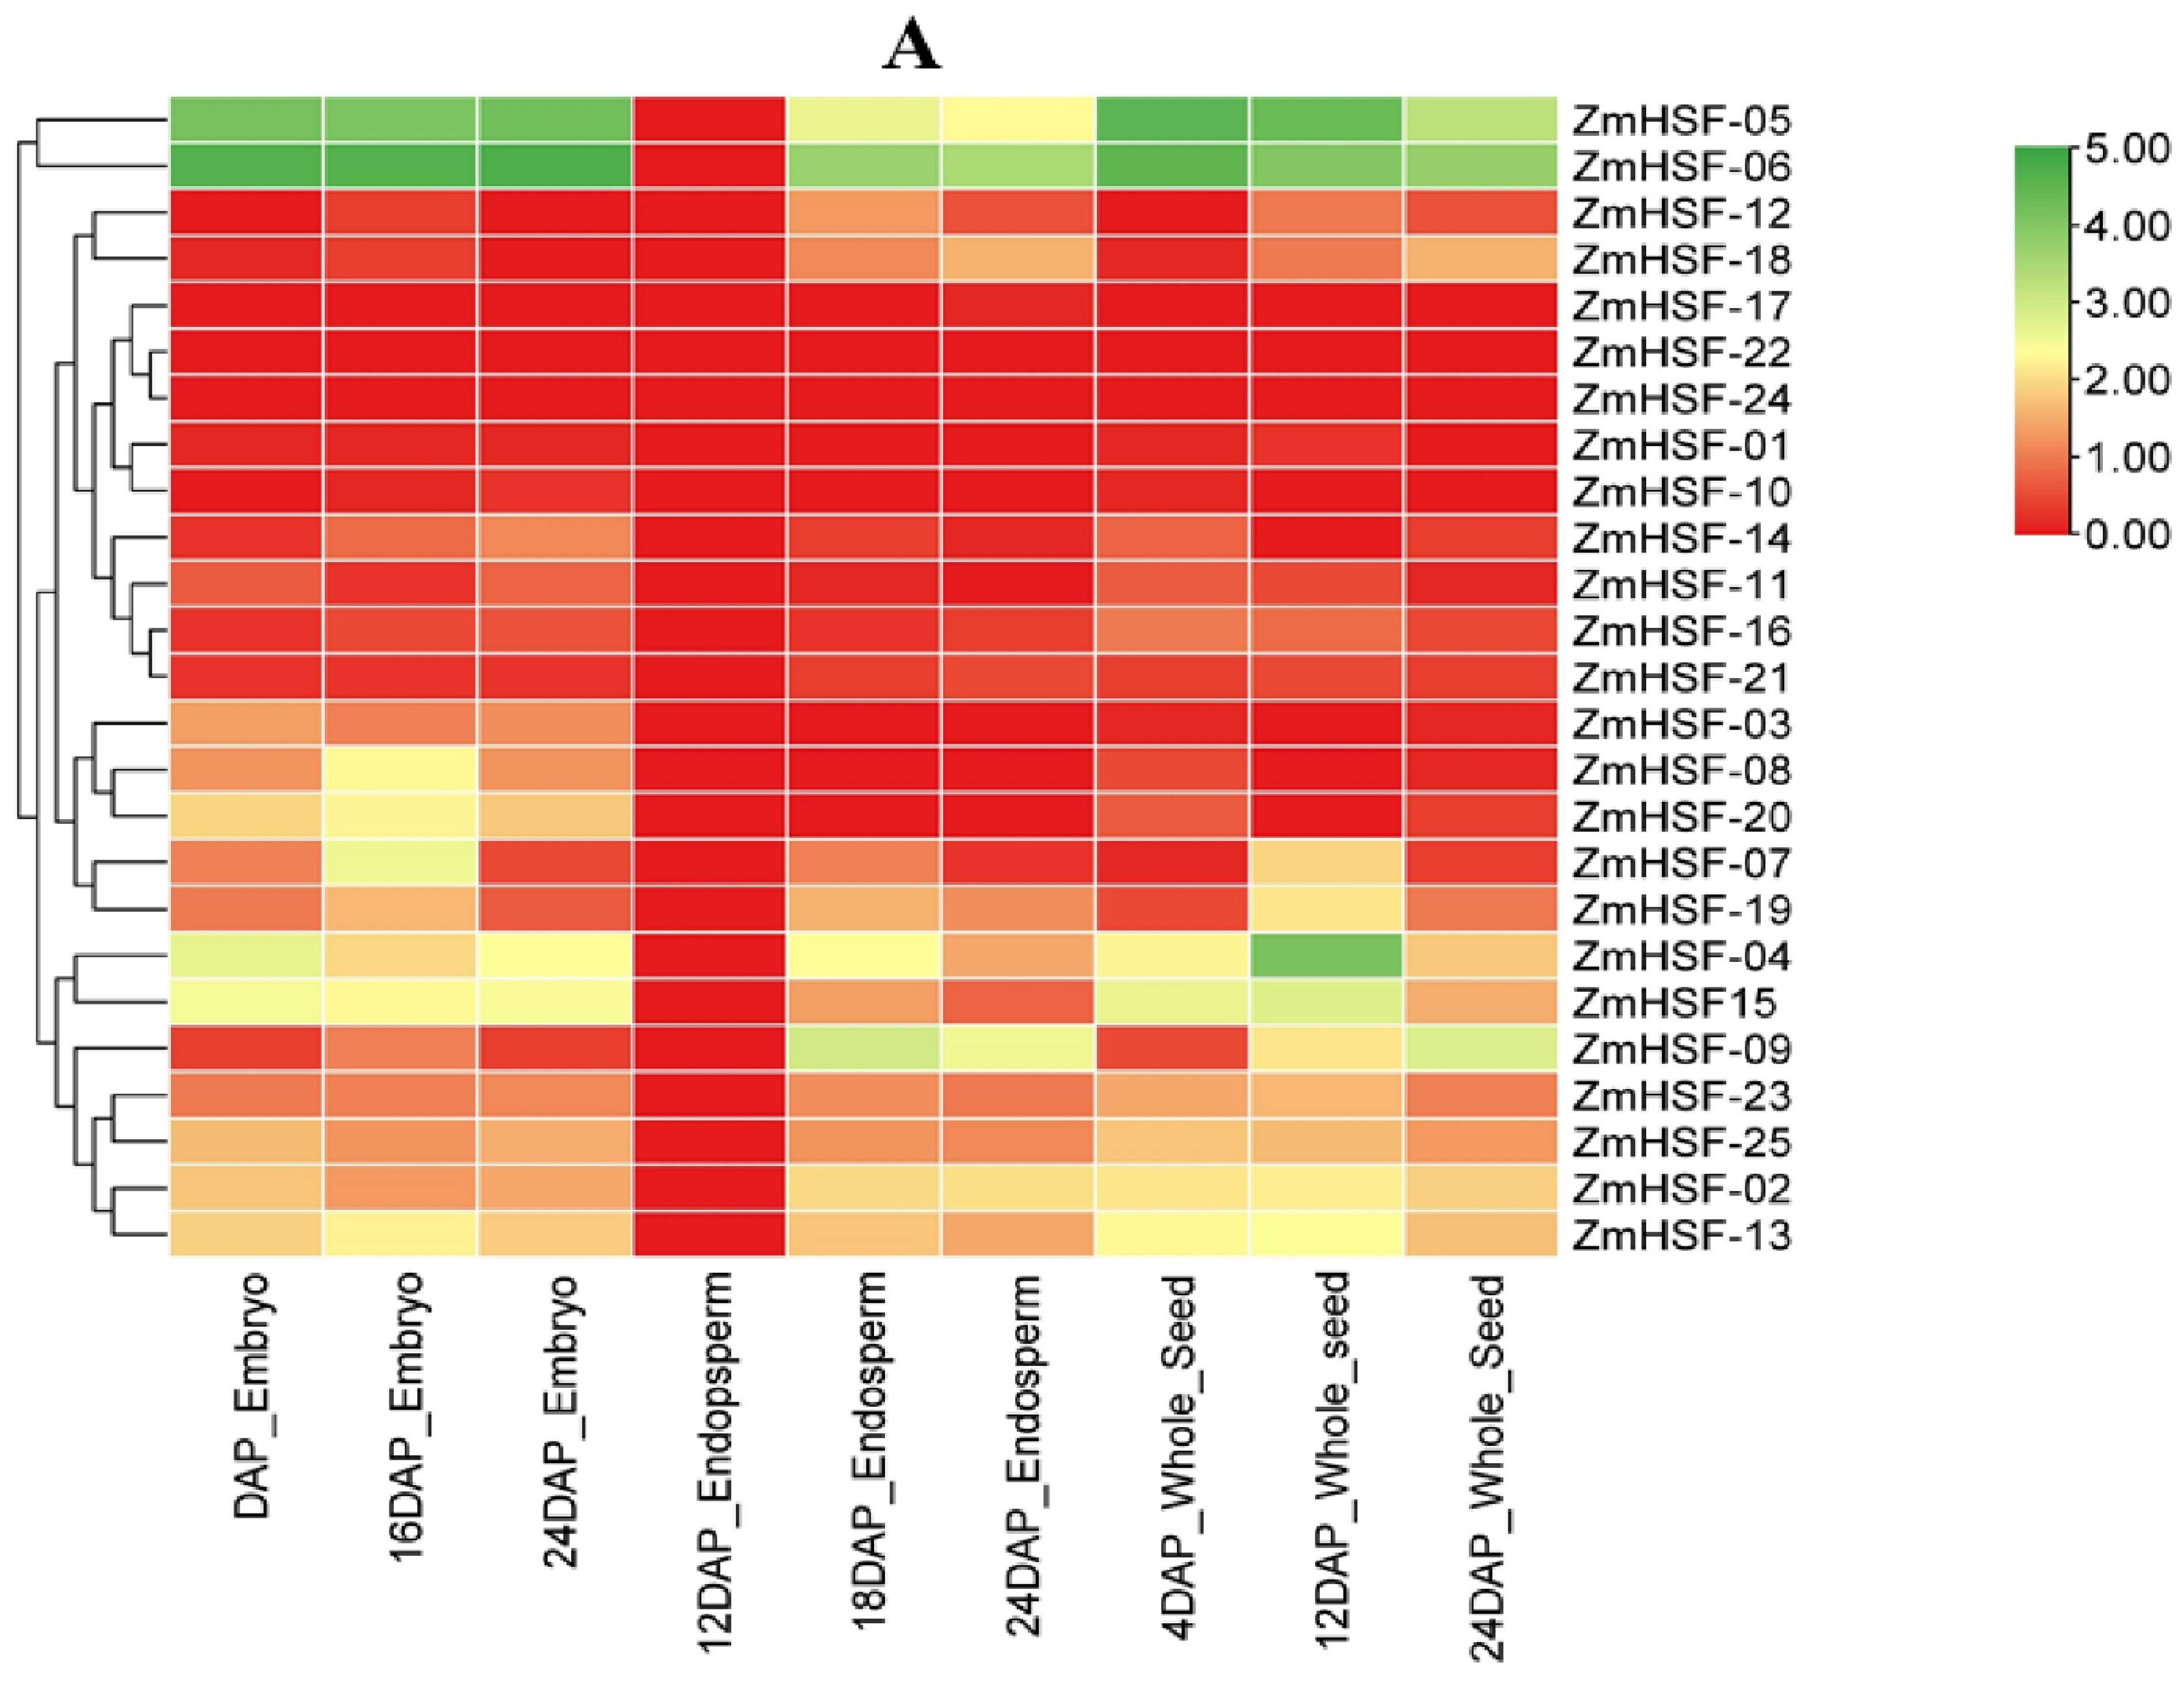
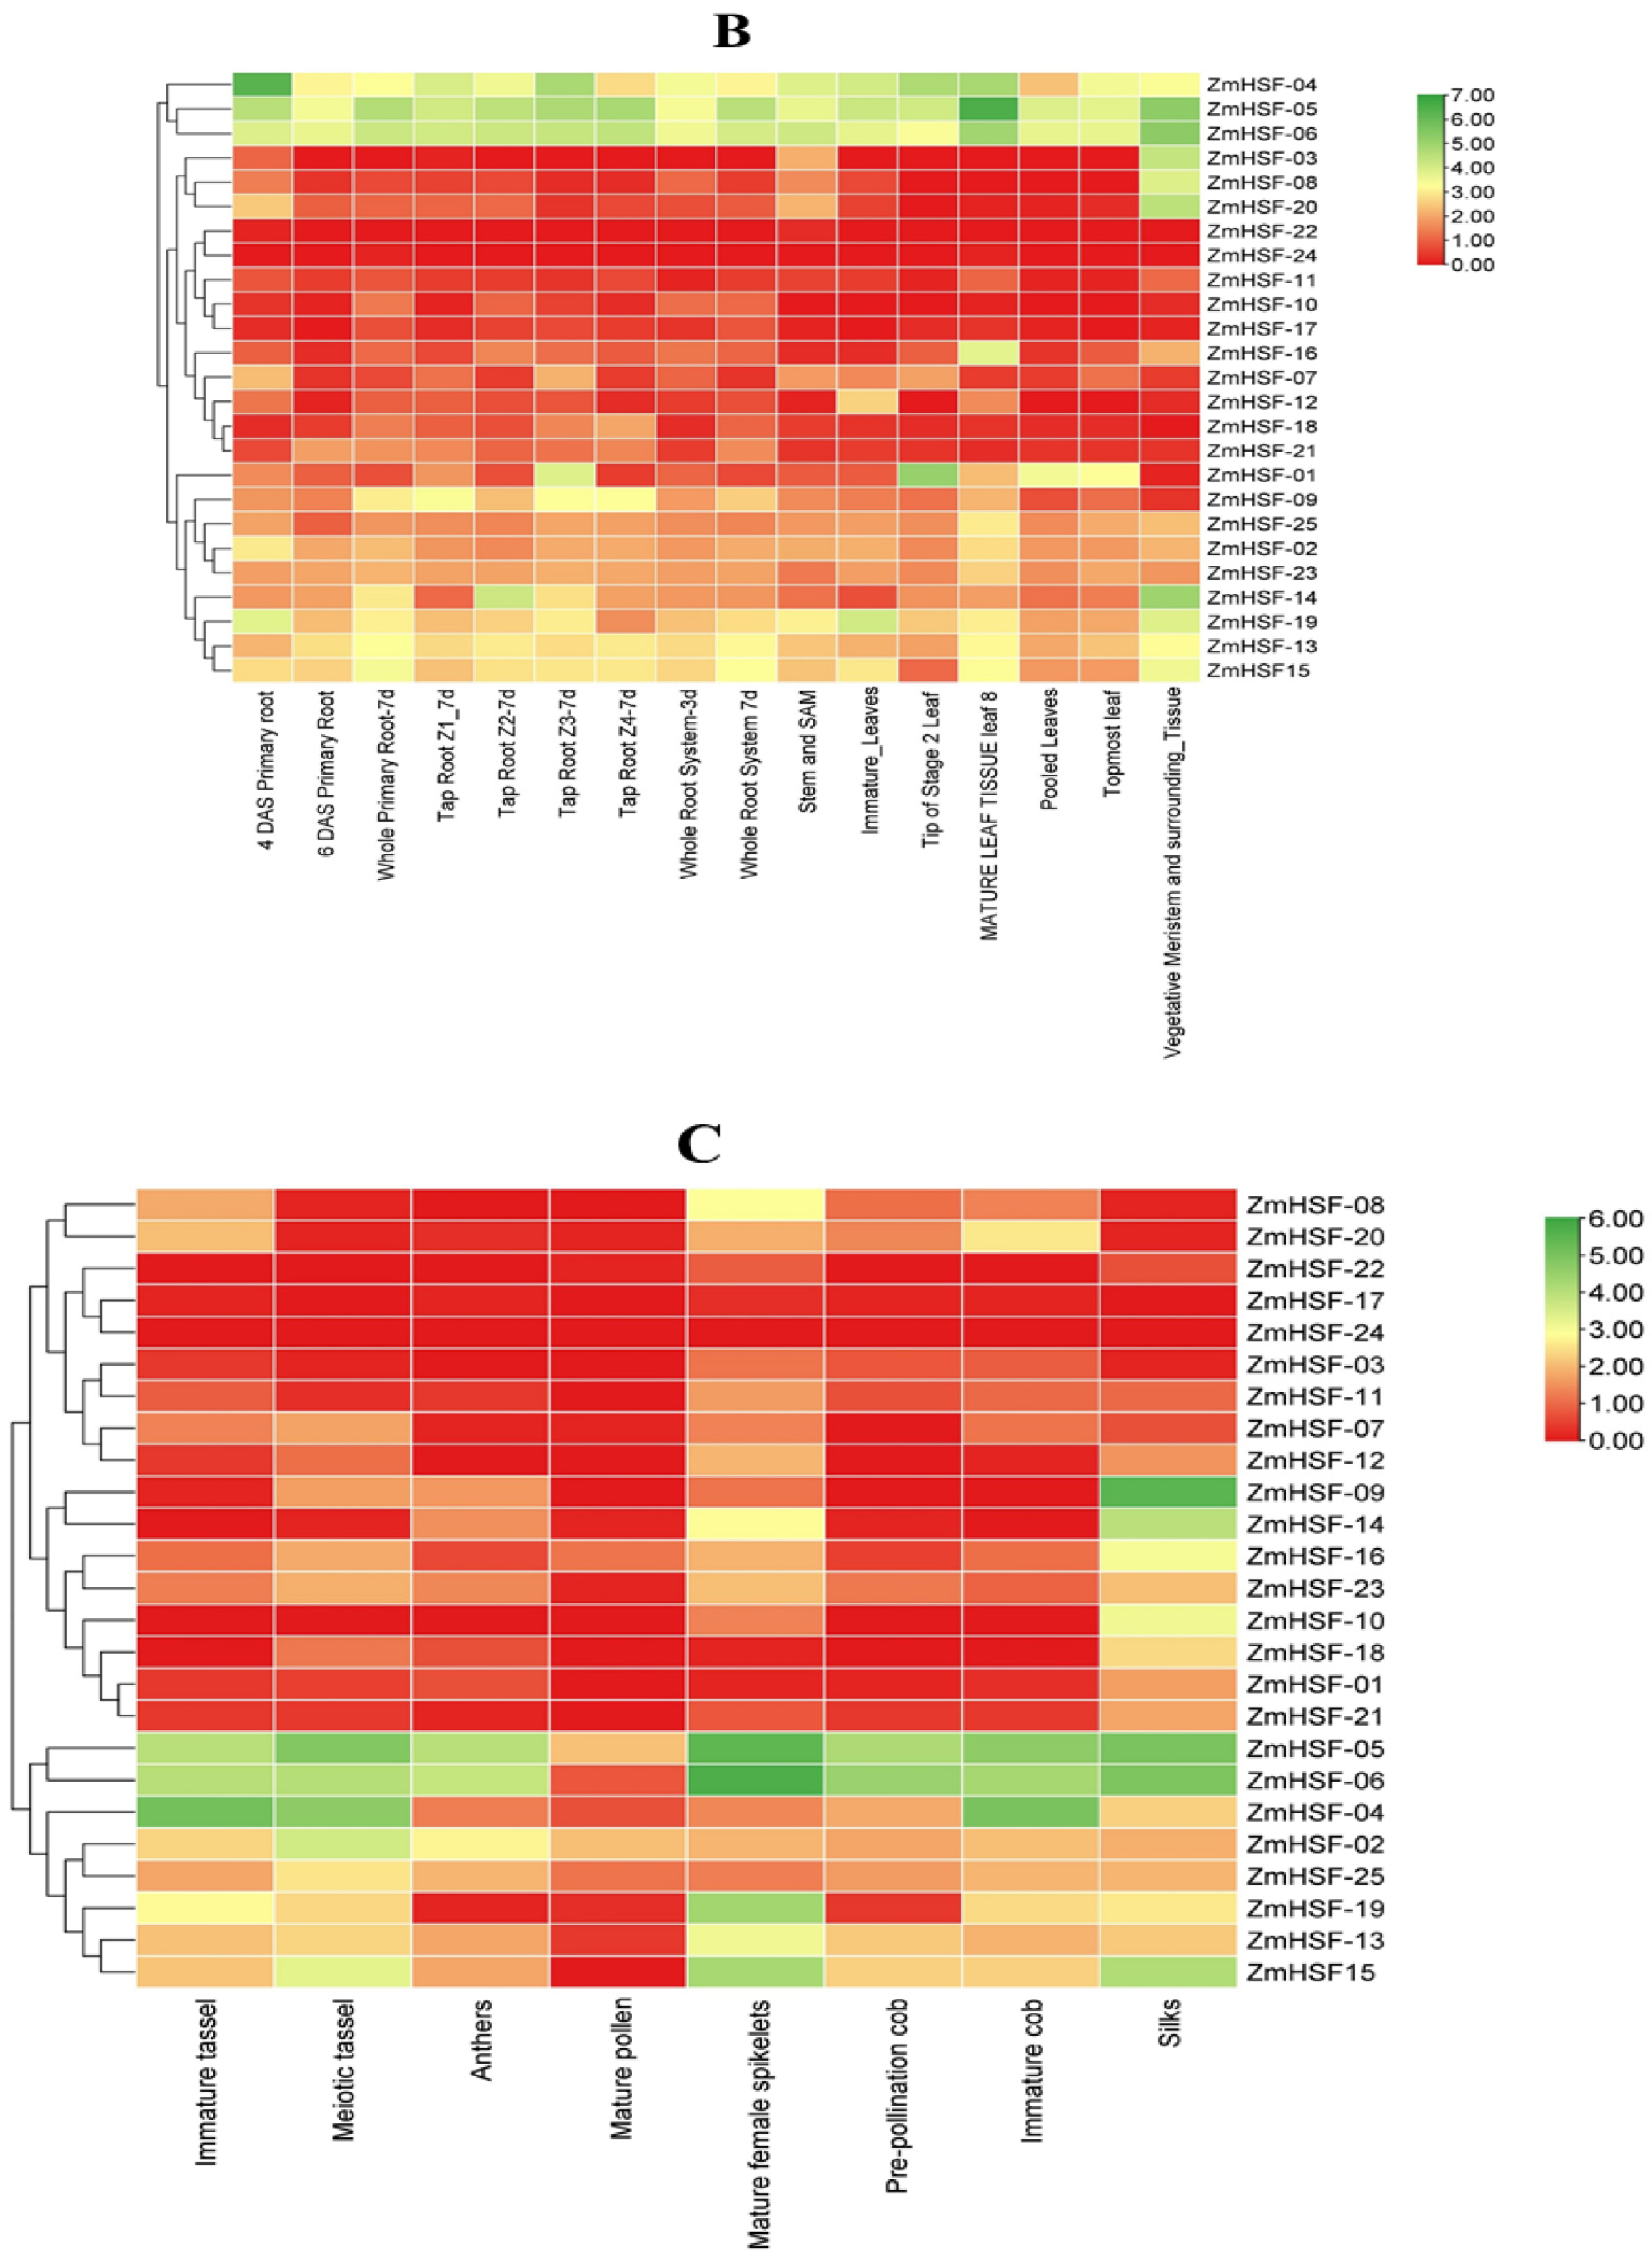
3.7. Expression Profiles of Zea mays HSFs during Different Developmental Stages

The expression patterns of Zea mays HSF genes were investigated during different growth stages and across different time scales. Although gene expression pattern is not always directly related to protein abundance, the transcriptome profiles can still provide insights into the probable role of genes in particular biological processes [69]. The transcriptome data utilized in the present study was downloaded from the maize genome database [59].
The ZmHSF-04, ZmHSF-05, and ZmHSF-06 are shown to be the most highly induced HSFs across all the tissues during different growth stages (Figure 9A–C). During seed developmental stages, ZmHSF-02, ZmHSF-03, ZmHSF-04, ZmHSF-07, ZmHSF-08, ZmHSF-09, ZmHSF-13, ZmHSF-15, ZmHSF-19, ZmHSF-20, ZmHSF-23, and ZmHSF-25 are upregulated (Figure 9A). A total of 8 HSFs showed very little or no expression at all. Interestingly, the transcripts of all ZmHSFs completely disappear 12 days after pollination. During vegetative stage, the ZmHSF-01, ZmHSF-02, ZmHSF-09, ZmHSF-13, ZmHSF-14, ZmHSF-15, ZmHSF-19, ZmHSF-23, and ZmHSF-25 are upregulated (Figure 9B). This indicates that these genes might play putative regulate role in these tissues and control vegetative growth. ZmHSF-22 and ZmHSF-24 showed no expression during vegetative stage. The highest expression of ZmHSFs was observed in root tissues. Similarly, at reproductive stage across different tissues, ZmHSF-02, ZmHSF-04, ZmHSF-13, ZmHSF-15, ZmHSF-19, and ZmHSF-25 are upregulated (Figure 9C). Interestingly, the transcripts of most HSFs except for ZmHSF-02, ZmHSF-04, ZmHSF-05, ZmHSF-06, ZmHSF-16, and ZmHSF-25 completely disappear in pollen tissues. ZmHSF-17 showed almost no expression in any tissue during reproductive stage. Most of the HSFs were highly expressed in silk tissues.

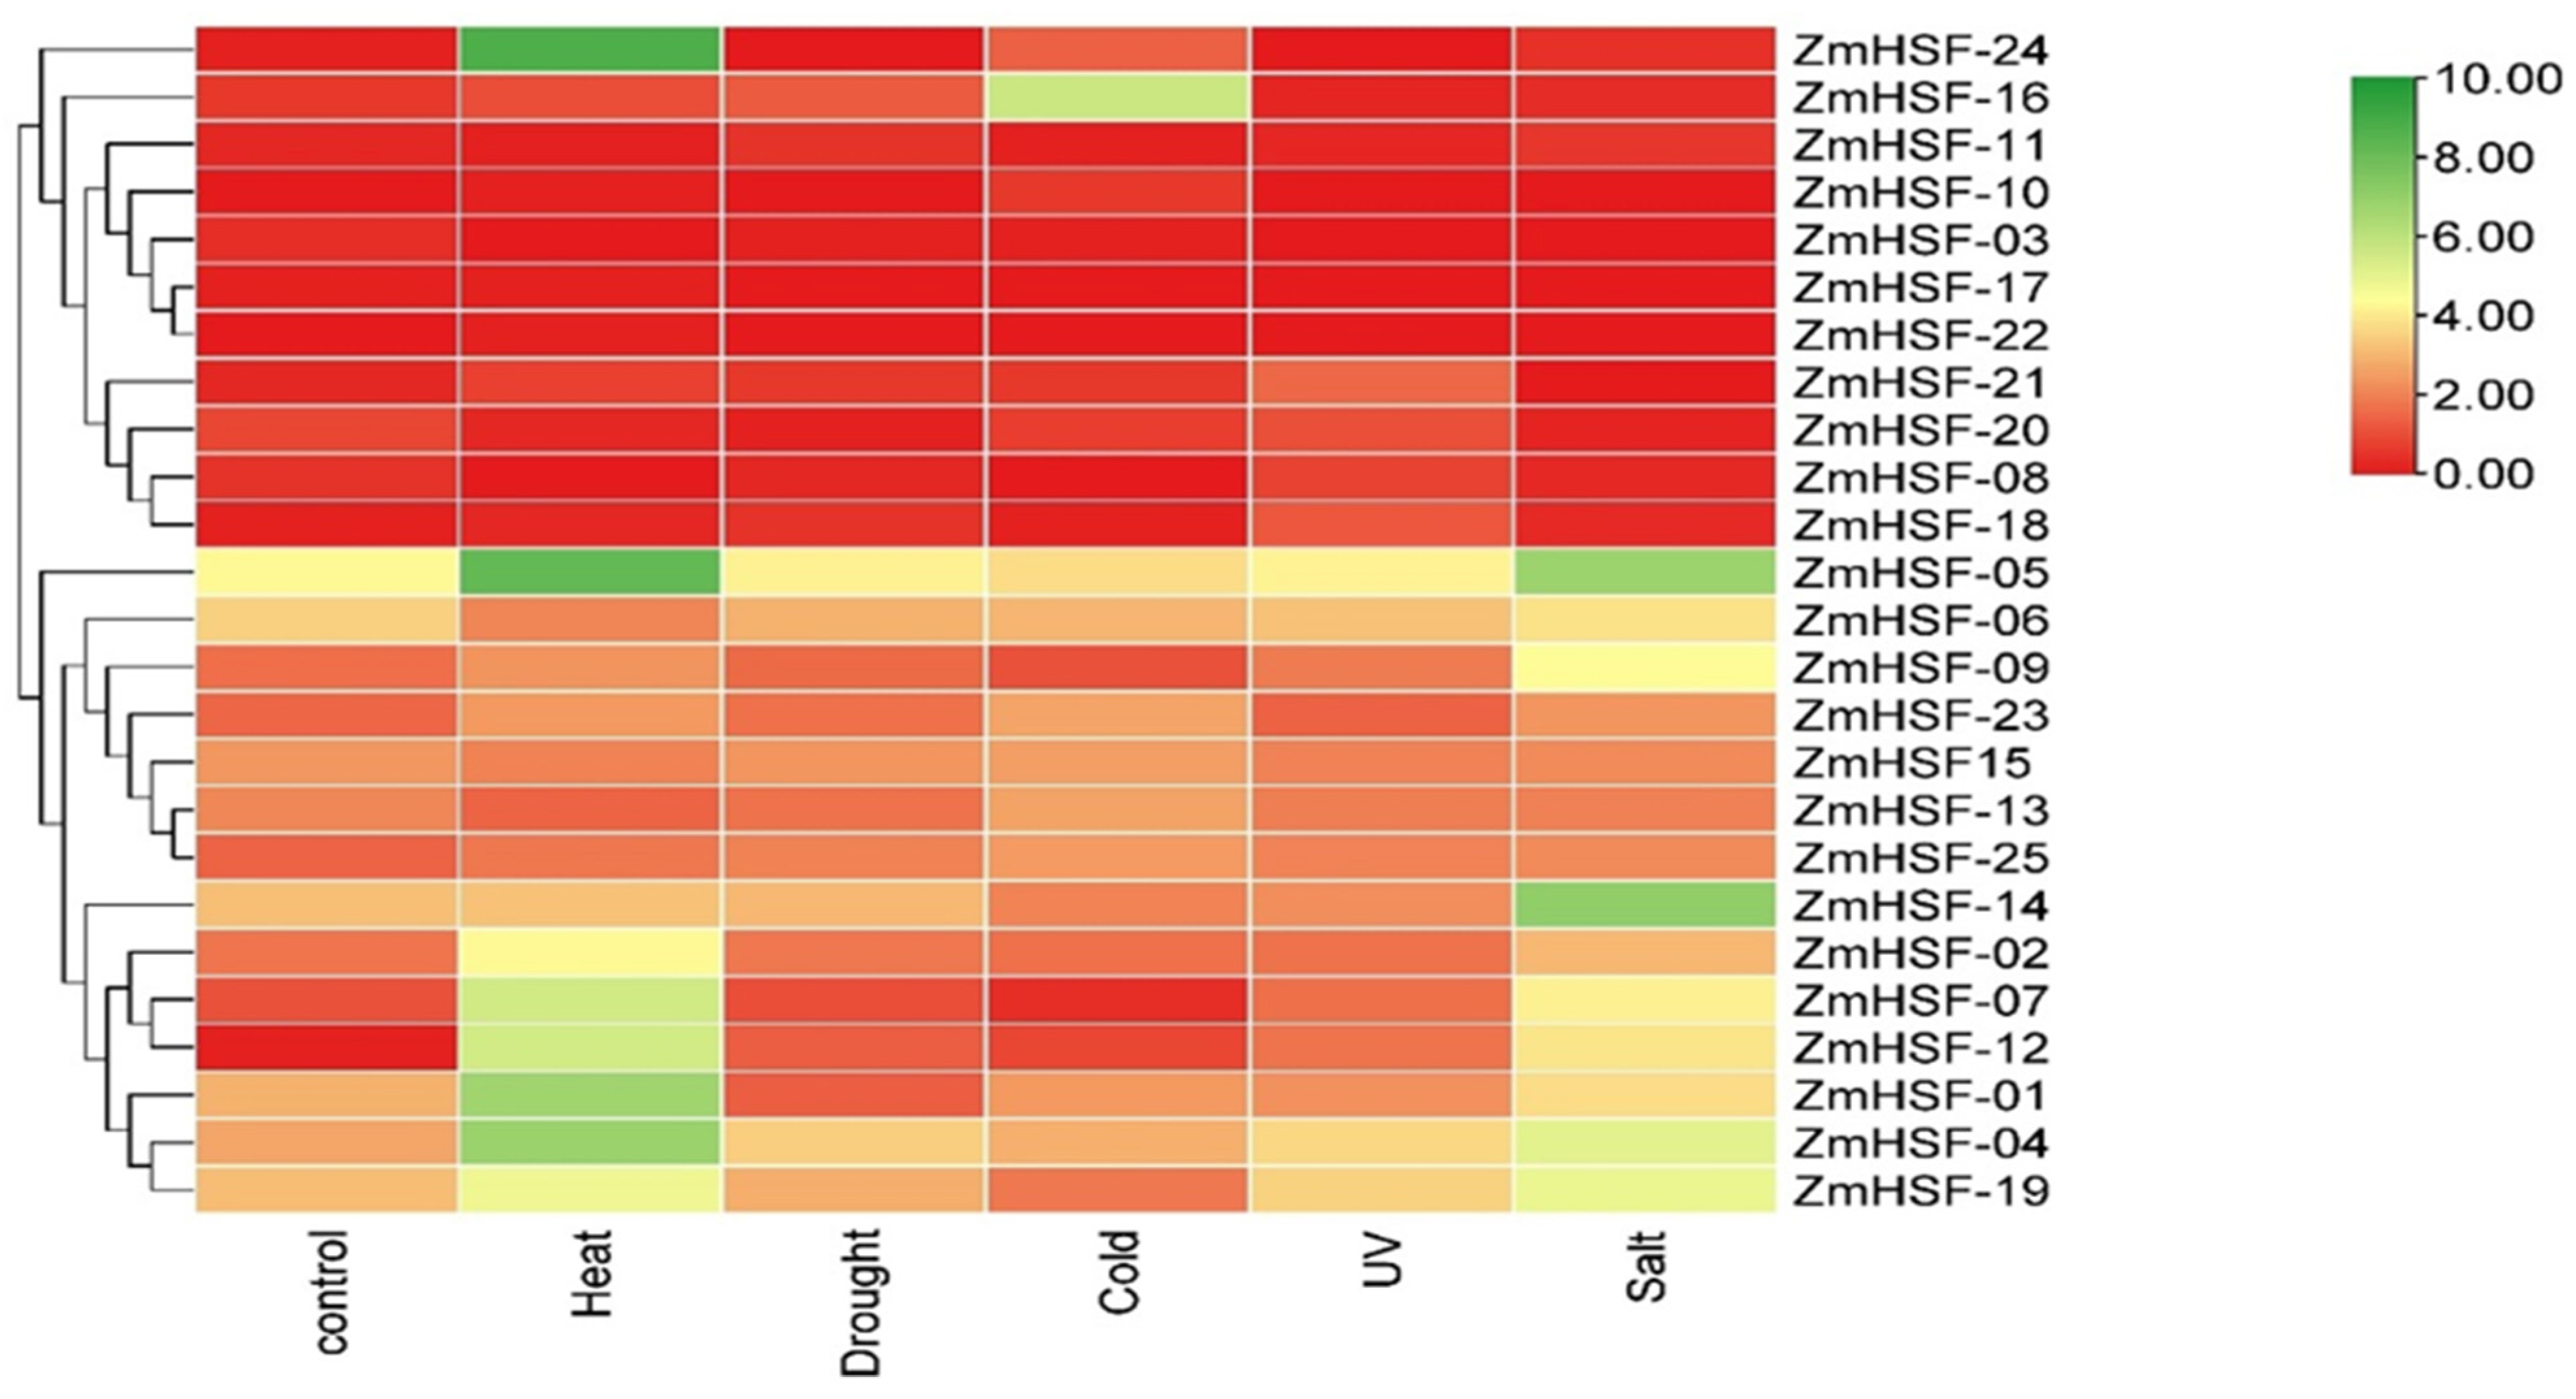
3.8. Expression Pattern of Zea mays HSFs under Abiotic Stresses

Maize growth, development, and yield is adversely affected by several abiotic stresses [70]. Therefore, to examine maize HSFs expression under different abiotic stress events, RNA-seq data was analyzed and a heat map was constructed (Figure 10; Table S5). In response to HS, members of class A and B HSFs showed the highest expression. Interestingly, under the drought stress, only the transcript of ZmHSF-05 was moderately overexpressed. Under cold stress, three members of class A HSFs (ZmHSF-05, ZmHSF-06, and ZmHSF-16) showed relatively higher expression. Moderate expression of ZmHSF-05, ZmHSF-06, ZmHSF-04, and ZmHSF-19 was observed under UV stress. Under salinity stress, ZmHSF-05 and ZmHSF-14 showed the highest expression. Under abiotic stress conditions, ZmHSF-01, ZmHSF-02, ZmHSF-05, ZmHSF-06, ZmHSF-07, ZmHSF-09, ZmHSF-12, ZmHSF-13, ZmHSF-14, ZmHSF-15, ZmHSF-19, ZmHSF-23, and ZmHSF-25 are upregulated (Figure 10). However, some HSFs were only induced by a particular stress. For example, higher transcripts of ZmHSF-24 are only detected after HS treatment. Similarly, ZmHSF-16 is slightly overexpressed after cold treatment. While, some HSFs showed almost no expression under any stress condition. These include ZmHSF-03, ZmHSF-08, ZmHSF-10, ZmHSF-11, ZmHSF-17, ZmHSF-18, ZmHSF-20, ZmHSF-21, and ZmHSF-22 (Figure 10).

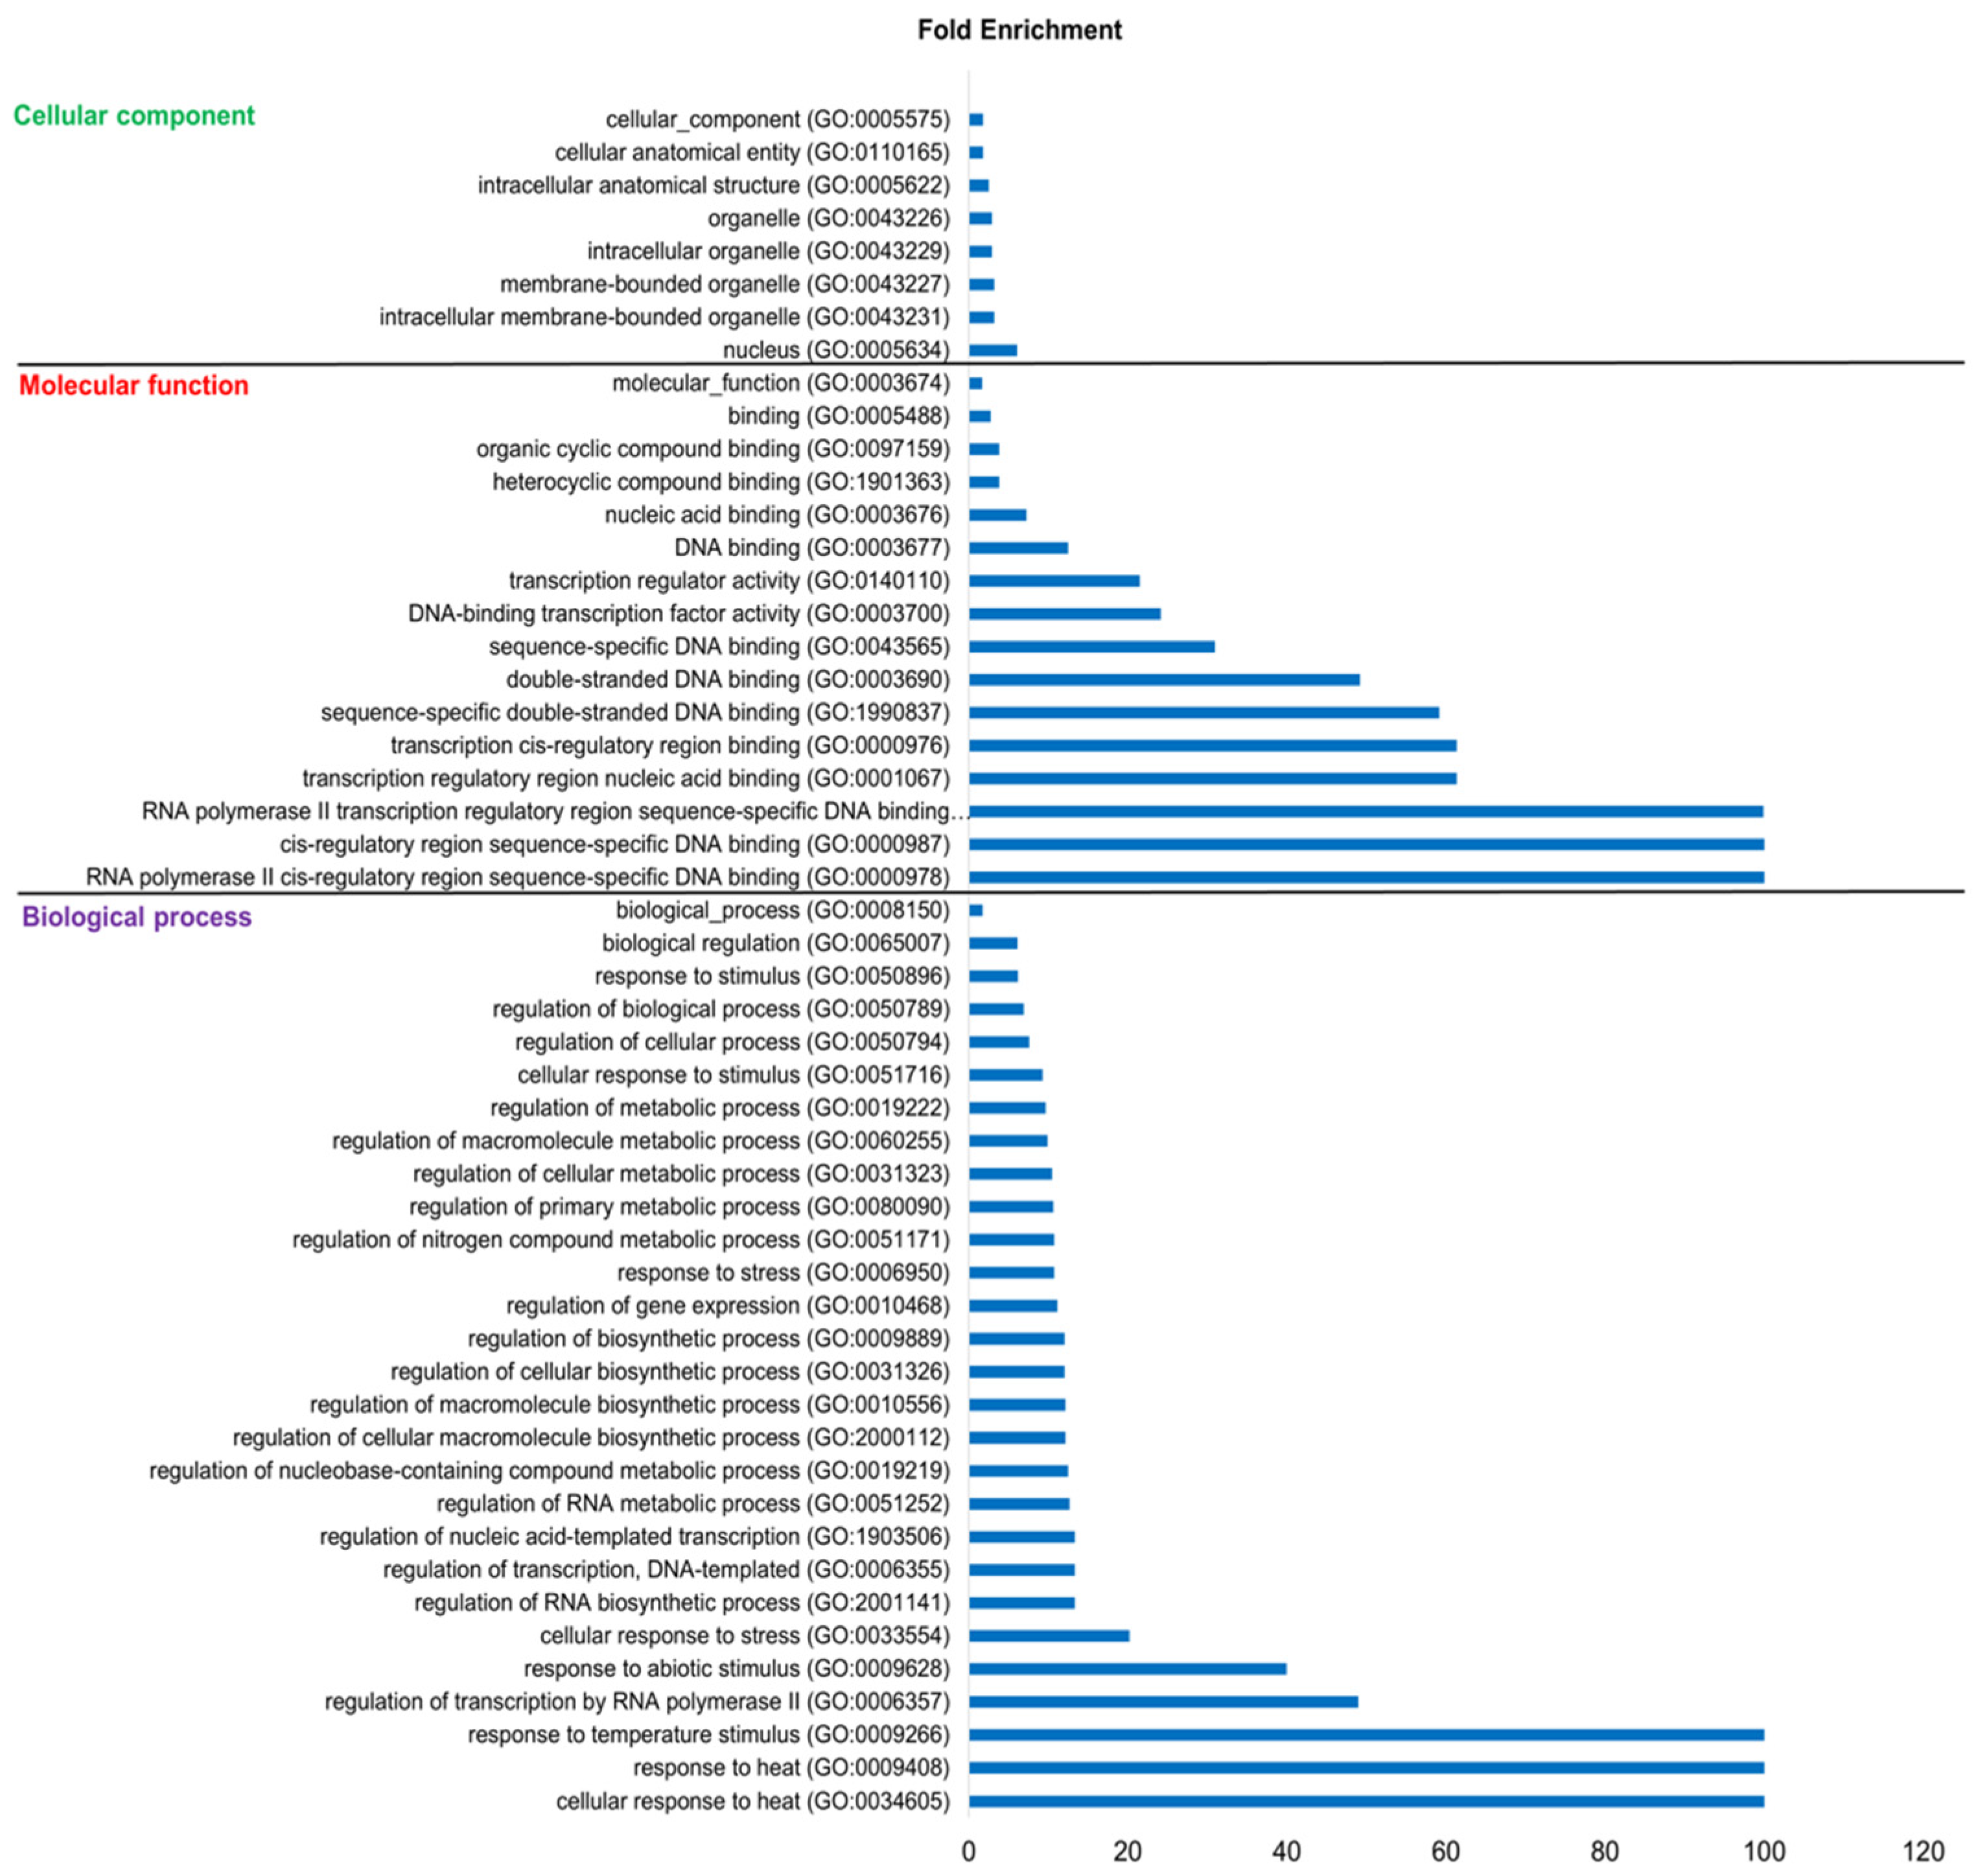
3.9. Functional Annotation of Maize HSFs

HSFs have been reported to play a major role not only under stressful conditions but also in plant growth and development [16,69]. Therefore, the regulatory functions of maize HSFs were predicted through GO annotation investigation based on the biological process (BP), molecular function (MF), and cellular component (CC) classes (Figure 11; Table S6). The BP annotation analysis indicated that maize HSFs are mainly involved in cellular response to heat (GO:0034605), response to heat (GO:0009408), response to temperature stimulus (GO:0009266), regulation of transcription by RNA polymerase II (GO:0006357), response to abiotic stimulus (GO:0009628), cellular response to stress (GO:0033554), regulation of RNA biosynthetic process (GO:2001141), etc. (Figure 11). With regard to MF annotation analysis, it was revealed that maize HSFs are mostly involved in RNA polymerase II cis-regulatory region sequence-specific DNA binding (GO:0000978), cis-regulatory region sequence-specific DNA binding (GO:0000987), RNA polymerase II transcription regulatory region sequence-specific DNA binding (GO:0000977), transcription regulatory region nucleic acid binding (GO:0001067), transcription cis-regulatory region binding (GO:0000976), sequence-specific double-stranded DNA binding (GO:1990837), double-stranded DNA binding (GO:0003690), etc. (Figure 11). The CC annotation study showed that ZmHSFs are majorly involved in the nucleus (GO:0005634), intracellular membrane-bounded organelle (GO:0043231), membrane-bounded organelle (GO:0043227), intracellular organelle (GO:0043229), organelle (GO:0043226), etc. (Figure 11). To conclude, the GO annotation study confirms the role of maize HSFs in regulating abiotic stresses and plant metabolism.

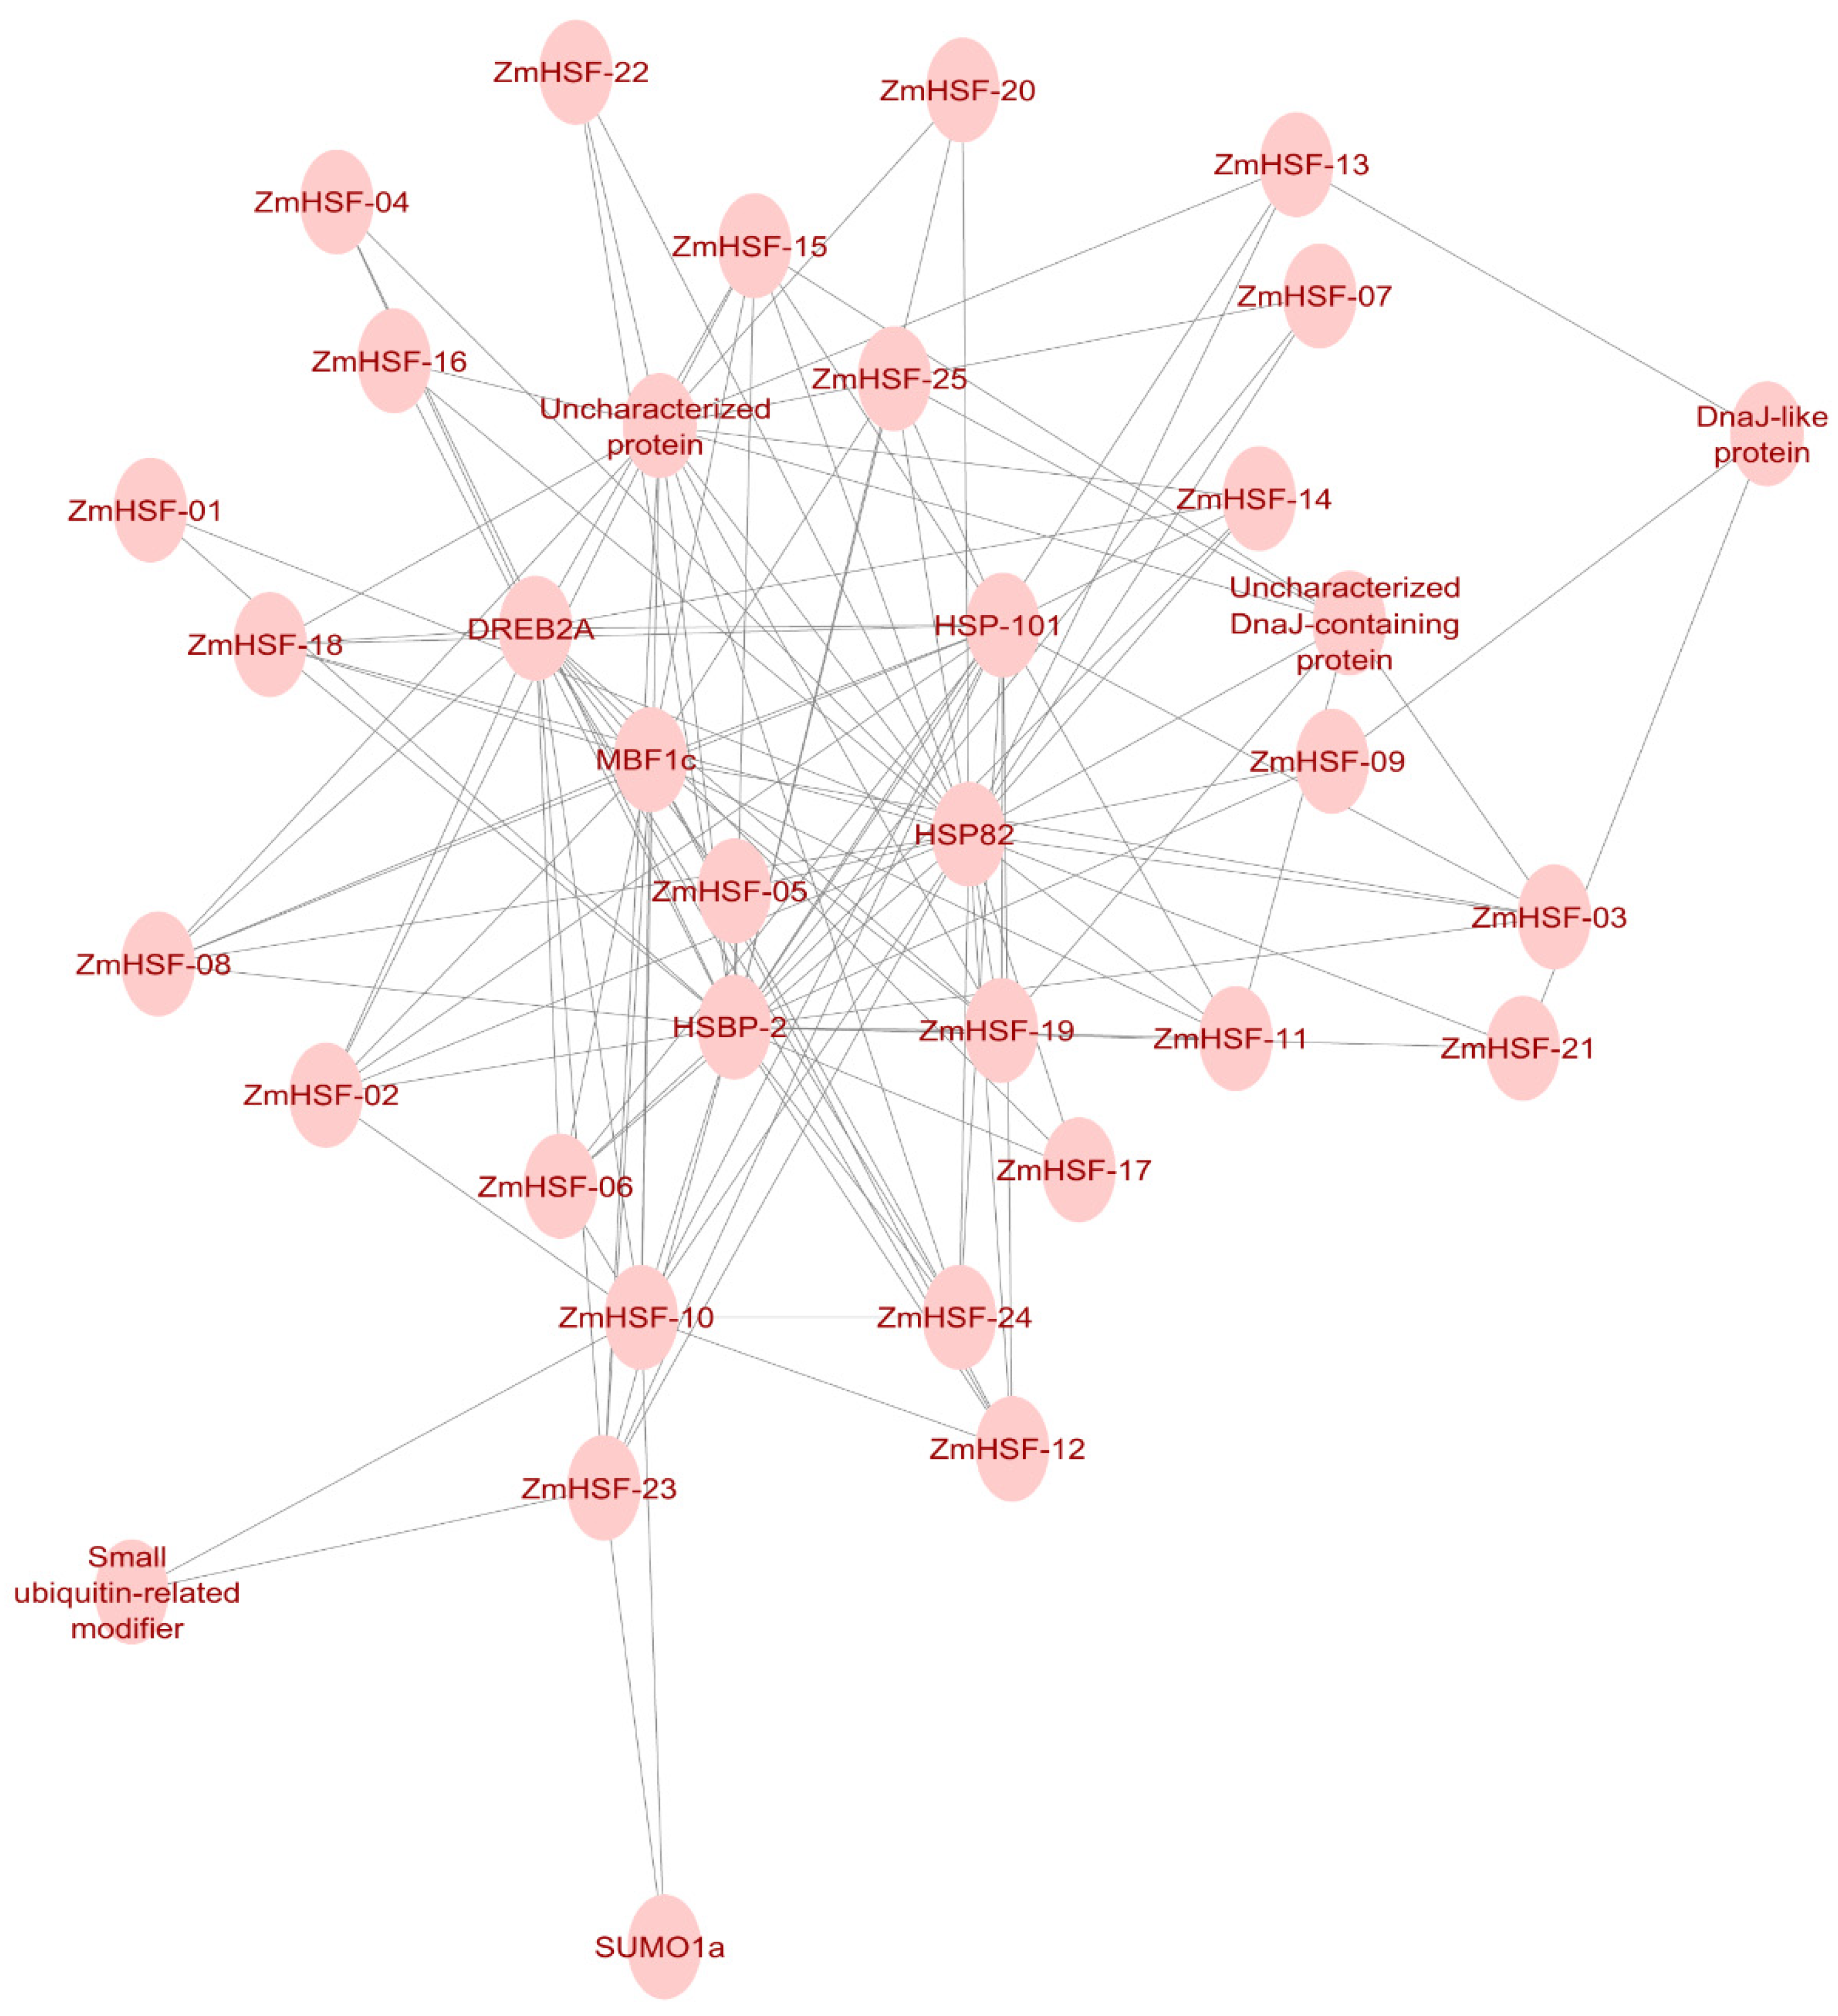
3.10. Protein–Protein Interaction Network Analysis

The protein network interaction analysis can help understand protein biological function’s and mechanisms [71]. Since both the RNA-seq data and GO annotation analysis suggested the role of HSFs in stress conditions and normal growth, we performed network analysis to predict the interacting partners of ZmHSFs (Table S7). The results showed that maize HSFs interact with themselves and a range of proteins with well-known functions in cellular growth and stress responses (Figure 12). For example, HSFs were shown to interact with molecular chaperons HSP101, HSP82 (belongs to HSP90 family), HSBP-2, and DnaJ-like protein (belongs to the HSP40 family). It was reported that HSP101 and HSA32 interact with each other and promote acquired thermotolerance in Arabidopsis [72]. The HSP82 was reported to be induced by higher temperatures. A higher concentration of HSP82 is required for normal cellular growth in yeast at higher temperatures [73]. Gu et al. reported that maize HSBP-2 and HSFA2 interact with each other and modulate raffinose biosynthesis [74]. HSFA2 was shown to bind to the promoter sequence of HSBP-2 and activate its expression. Higher raffinose synthesis improved HS tolerance of Arabidopsis thaliana. The DnaJ-like proteins are molecular co-chaperones that interact with HSP70s and control protein homeostasis [75]. DnaJ proteins have been reported to play a critical role in plant growth, development, and HS tolerance [75,76,77]. ZmHSFs also interact with two major proteins, i.e., multi-protein bridging factor 1c (MBF1c) and DREB2A. Both these proteins have been shown to accumulate under diverse abiotic stress conditions. DREB2A is a major protein, and its overexpression improves plant HS, drought stress, cold stress, etc., tolerance [78]. MBF1c is a transcriptional co-activator that modulates the expression of DREB2A, some HSFs, and phytohormones [3]. Interestingly, MBF1c is necessary for basal thermotolerance but not for acquired thermotolerance [79]. In addition, MBF1c is also shown to be required for plant developmental responses [80].
Maize HSFs are also predicted to interact with SUMO proteins. SUMOylation is a post-translational phenomenon where SUMO proteins are covalently attached and detached to target proteins [81]. This process affects several biological processes inside the cell, including transcriptional regulation of gene expression, apoptosis, programmed cell death, cellular response to stress, stability of proteins, etc. [81]. Rytz et al. reported that SIZI, a SUMO protein, targets multiple TFs, chromatin remodelers, transcriptional co-activators/repressors connected to abiotic and biotic stress responses [82]. This suggests maize HSFs may also be SUMOylated under diverse biological conditions and stress responses. To conclude, PPI analysis aligned with the RNA-seq and GO annotation analysis, which indicated that HSFs of Zea mays play an important role in abiotic stress conditions and in maize growth and metabolism.

4. Discussion

Maize (Zea mays) is a major cereal crop that is widely cultivated worldwide for food, feed, fiber, and fuel. Maize is also considered a model plant for basic and applied research in plant science [83]. Unraveling the factors regulating the growth and stress resistance would contribute significantly to the development of climate-smart, stress-resilient maize cultivars with higher agricultural productivity. The sequencing of the maize genome (B73 inbred line) in 2009 opened a plethora of opportunities to identify, analyze, and characterize stress-associated genes in maize [84]. To provide food security in the scenario of climate change and ever-growing world population, it is imperative to understand the molecular mechanisms behind plant stress resistance and explore genetic resources associated with the higher crop yield [3,15]. HSFs have been identified in several plant species, including important crops. The Arabidopsis thaliana, Oryza sativa, Zea mays, Glycine max, Populus trichocarpa, Solanum lycopersicum, Brachypodium distachyon, Sorghum bicolor, and Triticum aestivum contain 21, 25, 25, 38, 28, 26, 24, 23, and 61 HSFs in their genomes, respectively [20,40,41,42,43,44,45,71,85]. Following the sequencing of several plants, it is found out that the number of HSFs may be independent of the genome size [71]. For example, Arabidopsis thaliana (135 Mb) contains 21 HSFs [20,86], while Medicago truncatula (375 Mb) harbors 15 HSFs [43,87]. Similarly, 25 HSFs are found in Oryza sativa (430 Mb) [40,88] and an equal number of HSFs are also present in Zea mays (2.4 Gb) [41,84]. Even though the HSF gene family was previously characterized by Lin et al. [41], our work differs from theirs in multiple aspects. Their research was mostly restricted to the identification and classification of ZmHSFs. On the other hand, this comprehensive study particularly focused on the evolutionary analysis, expression profiling, GO, and PPI networks to explore the probable regulatory role played by ZmHSFs under benign and stress conditions.
The distribution of the HSF gene family in maize was analyzed by constructing a chromosomal map (Figure 1). The fact that all the chromosomes harbor at least one HSF gene suggests that Zea mays’ most recent common ancestor has HSF genes distributed widely in its genome. Phylogenetic analysis indicated the AtHSFA2, AtHSFC1 did not align with sub-class A2, C1 in the present study, which aligns with the results reported by Lin et al. [41]. Maize HSFs are divided into three classes and further into 13 sub-classes which is consistent with the HSF class number observed in other monocots. For example, the HSFs of Oryza sativa, Brachypodium distachyon, Sorghum bicolor, and Triticum aestivum are also divided into three classes and 13 sub-classes [40,45,46,85]. Despite that, differences among HSF numbers were observed in different sub-classes between monocots (Figure 2, Table 2). For example, compared to rice, Brachypodium, and Sorghum, the sub-families B4, A2, and C2 contain fewer HSF members in maize. On the other hand, the sub-classes A1, A4, A8, B1, and B2 are expanded in Zea mays (Figure 2, Table 2). Gene duplications generate new genes and provide novel possibilities for evolutionary success [89,90]. In fact, it has been proposed that tandem and segmental duplications have been the primary driving source of evolution as these events lead to expansion of gene families and generation of proteins with novel functions [91]. Tandem duplication involves the duplication of two or more genes located on the same chromosome, while segmental duplication refers to the phenomenon when genes belonging to the same clade but located on different chromosomes are duplicated [92]. In the present analysis, nine pairs of ZmHSFs were shown to be paralogs (Table 3, Figure 3). The results indicate that segmental duplication events have played a major role in the expansion of the HSF gene family in maize. An increase in gene regulatory repertoire such as transcriptional regulators, developmental regulators, signal transducers, etc., is a prerequisite for the evolution of complex systems in different organisms [22,93]. Since the gene duplication events result in the doubling of a single gene which cannot account for such large expansions, it has been suggested that whole-genome duplication (WGD) events have been instrumental in expanding the regulatory repertoire of plants [90]. It is assumed that the Arabidopsis genome experienced two rounds of WGD in the past 60–70 million years [94,95]. More than 90% increase in regulatory genes has been caused by duplication events Arabidopsis in the past 150 million years [94]. This suggests that an increase in the HSF gene members in plants accounts for WGDs. Additionally, segmental duplications occur in gene families, which evolve at a slower rate [91]. It is thought that the increase or decrease in exon number plays an important role in the evolution of a gene family [96]. Therefore, we investigated the number and distribution of introns and exons in ZmHSF genes. Our results showed that the ZmHSF genes contain 2 exons and 1 intron except for ZmHSF-02 and ZmHSF-24 (Figure 4; Table 1). Moreover, the length and position of exons and introns were well conserved in the same sub-classes but varied considerably between different sub-classes.
The previous investigations showed that HSFs play an important role in plant growth [39]. Therefore, we investigated the tissue-specific expression of ZmHSFs in 20 different developmental tissues using RNA-seq data (Figure 9A–C). Several genes showed an enhanced expression that reflects their role under various developmental stages. In particular, ZmHSF-05 (A-2a) and ZmHSF-06 (A-1a) were highly expressed almost across all the growth phases. The hsfa1abde quadruple mutants displayed abnormal phenotype and growth retardation, implying HSFA1s is also involved in developmental processes [29]. Interestingly, HSFA2 could rescue the developmental defects of hsfa1abde quadruple mutants [97]. This further supports the result obtained from our analysis and provides a strong base for further wet-lab studies to characterize the function of ZmHSF-05 and ZmHSF-06 in plant growth and development. Similarly, HSFs have been reported to play a key role in plant acclimation to abiotic stress conditions. Kumar et al. reported that TaHSFA6e modulates tolerance of wheat to HS and drought stress during pollination and grain filling stages [98]. Yokotani et al. reported that OsHSFA2e improves Arabidopsis tolerance to HS and salinity stress by activating the expression of HSPs [99]. Thus, the expression patterns of ZmHSFs were evaluated under abiotic stress conditions. Most of ZmHSFs displayed stress-specific expression, with some HSFs showing upregulation only under particular stress events (Figure 10). Jiang et al. reported that ZmHSF-04 improves plant tolerance to HS, salinity stress and increases the sensitivity to abscisic acid [100]. Similarly, ZmHSF-12 overexpression improves plant basal thermotolerance and AT [101]. These results are in line with our analysis which showed a higher transcript accumulation of these TFs under respective stress conditions (Figure 10).
The PPI analysis indicated that maize HSFs interact with molecular chaperones and stress-associated proteins (Figure 12). Molecular chaperones are present inside the cells and are constitutively expressed under normal conditions or are induced under specific developmental stages or stress conditions [102]. These chaperons perform various functions under physiological conditions inside the cells, such as signaling, folding, and stabilization, translocation, and degradation of proteins [11,102]. Under harsh environmental conditions, molecular chaperones act as powerful buffers to limit protein misfolding/unfolding and prevent protein aggregate formation that might be otherwise toxic to plant cells [25]. Here, the ZmHSFs were shown to interact with chaperons belonging to different families (HSP101, HSP90, HSP40) and genes with a well-known role in thermotolerance (HSA32, HSP82, HSBP-2). DREB2A is a major transcriptional activator that functions downstream of HSFA1s dependent transcriptional cascade in Arabidopsis thaliana [3,12,15,29]. Similarly, MBF1c is a major protein characterized by its role in regulating abiotic stress responses and growth in plants [3,82,83]. SUMO proteins are attached to their target proteins and modify their biological activities under various physiological and stress conditions [84]. In Arabidopsis, SUMOylation has been proposed as one of the molecular mechanisms that are responsible for the activation of HSFA1s [12]. Many HSFs in Arabidopsis such as HSFA1d, HSFA2, and HSFB2B have the potential to be SUMOylated [103]. In tomatoes, the knockout of SIZI (a SUMO ligase) reduces plant thermotolerance [104]. Here, ZmHSFs were shown to interact with all these proteins (DREB2A, MBF1c, and SUMO proteins), which further confirms their role in regulating the abiotic stress response.
Taken together, our present analysis provides strong support for the positive role of HSFs in the growth and development of maize by the regulation of primary metabolism. Furthermore, HSFs of maize interact with the major stress-responsive proteins and confer abiotic stress resistance.

5. Conclusions

Here, we identified a total of 25 HSFs from the maize genome through genome-wide investigation analysis. To better understand the roles of HSF genes in the maize genome, comprehensive in silico analysis was performed, including phylogenetic analysis, gene structure, and conserved protein motif analysis, gene duplication and evolutionary analysis, domain analysis, and physio-chemical properties, protein 3-D structure, GO and PPI network. Further, the expression profiles of ZmHSFs under various developmental stages, and stress conditions were studied. The results indicate that ZmHSFs play a major role in plant growth and stress responses. These discoveries will lay the basis for studying the roles of ZmHSFs genes in maize developmental processes and response to several stresses using different functional validation options, such as overexpression, knockout via CRISPR/Cas9 systems, etc.

Supplementary Materials

The following are available online at https://www.mdpi.com/article/10.3390/agronomy11112335/s1, Table S1: Protein sequences of Zea mays HSFs; Table S2: The protein sequences of Arabidopsis thaliana, Oryza sativa, Brachypodium distachyon, and Sorghum bicolor HSFs; Table S3: The class specific amino acid composition of Zea mays HSFs; Table S4: FPKM values of Zea mays HSFs under different growth stages across various tissues; Table S5: FPKM values of Zea mays HSFs under multiple abiotic stress conditions; Table S6: GO annotation file of Zea mays HSFs; Table S7: Protein–protein interaction network file of Zea mays HSFs.

Author Contributions

Conceptualization, S.H. and T.M.; methodology, S.H.; software, S.H.; formal analysis, S.H., S.R. and Y.A.; resources, A.R.; writing—original draft preparation, S.H., S.R., Y.A., A.R., J.T. and T.J.; writing—review and editing, A.R. and H.S.O.; supervision, T.M.; funding acquisition, A.R. and H.S.O. All authors have read and agreed to the published version of the manuscript.

Funding

This research received no external funding.

Institutional Review Board Statement

Not applicable.

Informed Consent Statement

Not applicable.

Data Availability Statement

Not applicable.

Conflicts of Interest

The authors declare no conflict of interest.

References

  1. Shabbir, R.; Javed, T.; Afzal, I.; Sabagh, A.E.; Ali, A.; Vicente, O.; Chen, P. Modern Biotechnologies: Innovative and Sustainable Approaches for the Improvement of Sugarcane Tolerance to Environmental Stresses. Agronomy 2021, 11, 1042. [Google Scholar] [CrossRef]
  2. Lippmann, R.; Babben, S.; Menger, A.; Delker, C.; Quint, M. Development of wild and cultivated plants under global warming conditions. Curr. Biol. 2019, 29, R1326–R1338. [Google Scholar] [CrossRef]
  3. Haider, S.; Iqbal, J.; Naseer, S.; Yaseen, T.; Shaukat, M.; Bibi, H.; Ahmad, Y.; Daud, H.; Abbasi, N.L.; Mahmood, T. Molecular mechanisms of plant tolerance to heat stress: Current landscape and future perspectives. Plant Cell Rep. 2021, 40, 2247–2271. [Google Scholar] [CrossRef]
  4. Chaturvedi, P.; Wiese, A.J.; Ghatak, A.; Záveská Drábková, L.; Weckwerth, W.; Honys, D. Heat stress response mechanisms in pollen development. New Phytol. 2021, 231, 571–585. [Google Scholar] [CrossRef]
  5. Raza, A. Metabolomics: A systems biology approach for enhancing heat stress tolerance in plants. Plant Cell Rep. 2020, 1–23. [Google Scholar] [CrossRef] [PubMed]
  6. Sharif, R.; Raza, A.; Chen, P.; Li, Y.; El-Ballat, E.M.; Rauf, A.; Hano, C.; El-Esawi, M.A. HD-ZIP gene family: Potential roles in improving plant growth and regulating stress-responsive mechanisms in plants. Genes 2021, 12, 1256. [Google Scholar] [CrossRef]
  7. Russo, S.; Marchese, A.F.; Sillmann, J.; Immé, G. When will unusual heat waves become normal in a warming Africa? Environ. Res. Lett. 2016, 11, 054016. [Google Scholar] [CrossRef]
  8. Hasanuzzaman, M.; Nahar, K.; Alam, M.; Roychowdhury, R.; Fujita, M. Physiological, biochemical, and molecular mechanisms of heat stress tolerance in plants. Int. J. Mol. Sci. 2013, 14, 9643–9684. [Google Scholar] [CrossRef] [PubMed]
  9. Hayes, S.; Schachtschabel, J.; Mishkind, M.; Munnik, T.; Arisz, S.A. Hot topic: Thermosensing in plants. Plant Cell Environ. 2021, 44, 2018–2033. [Google Scholar] [CrossRef]
  10. Zahra, N.; Shaukat, K.; Hafeez, M.B.; Raza, A.; Hussain, S.; Chaudhary, M.T.; Akram, M.Z.; Kakavand, S.N.; Saddiq, M.S.; Wahid, A. Physiological and molecular responses to high, chilling, and freezing temperature in plant growth and production: Consequences and mitigation possibilities. In Harsh Environment and Plant Resilience: Molecular and Functional Aspects; Springer: New York, NY, USA, 2021; p. 235. [Google Scholar]
  11. Mittler, R.; Finka, A.; Goloubinoff, P. How do plants feel the heat? Trends Biochem. Sci. 2012, 37, 118–125. [Google Scholar] [CrossRef]
  12. Ohama, N.; Sato, H.; Shinozaki, K.; Yamaguchi-Shinozaki, K. Transcriptional regulatory network of plant heat stress response. Trends Plant Sci. 2017, 22, 53–65. [Google Scholar] [CrossRef]
  13. Javed, T.; Shabbir, R.; Ali, A.; Afzal, I.; Zaheer, U.; Gao, S.J. Transcription factors in plant stress responses: Challenges and potential for sugarcane improvement. Plants 2020, 9, 491. [Google Scholar] [CrossRef]
  14. Raza, A.; Tabassum, J.; Kudapa, H.; Varshney, R.K. Can omics deliver temperature resilient ready-to-grow crops? Crit. Rev. Biotechnol. 2021, 41, 1209–1232. [Google Scholar] [CrossRef]
  15. Haider, S.; Iqbal, J.; Naseer, S.; Shaukat, M.; Abbasi, B.A.; Yaseen, T.; Zahra, S.A.; Mahmood, T. Unfolding molecular switches in plant heat stress resistance: A comprehensive review. Plant Cell Rep. 2021, 1–24. [Google Scholar] [CrossRef] [PubMed]
  16. Andrási, N.; Pettkó-Szandtner, A.; Szabados, L. Diversity of plant heat shock factors: Regulation, interactions, and functions. J. Exp. Bot. 2021, 72, 1558–1575. [Google Scholar] [CrossRef]
  17. Sorger, P.K.; Pelham, H.R. Yeast heat shock factor is an essential DNA-binding protein that exhibits temperature-dependent phosphorylation. Cell 1988, 54, 855–864. [Google Scholar] [CrossRef]
  18. Scharf, K.-D.; Heider, H.; Höhfeld, I.; Lyck, R.; Schmidt, E.; Nover, L. The tomato Hsf system: HsfA2 needs interaction with HsfA1 for efficient nuclear import and may be localized in cytoplasmic heat stress granules. Mol. Cell. Biol. 1998, 18, 2240–2251. [Google Scholar] [CrossRef] [Green Version]
  19. Guo, M.; Liu, J.-H.; Ma, X.; Luo, D.-X.; Gong, Z.-H.; Lu, M.-H. The plant heat stress transcription factors (HSFs): Structure, regulation, and function in response to abiotic stresses. Front. Plant Sci. 2016, 7, 114. [Google Scholar] [CrossRef] [PubMed] [Green Version]
  20. Nover, L.; Bharti, K.; Döring, P.; Mishra, S.K.; Ganguli, A.; Scharf, K.-D. Arabidopsis and the heat stress transcription factor world: How many heat stress transcription factors do we need? Cell Stress Chaperones 2001, 6, 177. [Google Scholar] [CrossRef]
  21. von Koskull-Döring, P.; Scharf, K.-D.; Nover, L. The diversity of plant heat stress transcription factors. Trends Plant Sci. 2007, 12, 452–457. [Google Scholar] [CrossRef]
  22. Scharf, K.-D.; Berberich, T.; Ebersberger, I.; Nover, L. The plant heat stress transcription factor (Hsf) family: Structure, function and evolution. Biochim. Biophys. Acta (BBA) Gene Regul. Mech. 2012, 1819, 104–119. [Google Scholar] [CrossRef]
  23. Bharti, K.; von Koskull-Döring, P.; Bharti, S.; Kumar, P.; Tintschl-Körbitzer, A.; Treuter, E.; Nover, L. Tomato heat stress transcription factor HsfB1 represents a novel type of general transcription coactivator with a histone-like motif interacting with the plant CREB binding protein ortholog HAC1. Plant Cell 2004, 16, 1521–1535. [Google Scholar] [CrossRef] [PubMed] [Green Version]
  24. Fragkostefanakis, S.; Simm, S.; El-Shershaby, A.; Hu, Y.; Bublak, D.; Mesihovic, A.; Darm, K.; Mishra, S.K.; Tschiersch, B.; Theres, K. The repressor and co-activator HsfB1 regulates the major heat stress transcription factors in tomato. Plant Cell Environ. 2019, 42, 874–890. [Google Scholar] [CrossRef] [PubMed]
  25. Jacob, P.; Hirt, H.; Bendahmane, A. The heat-shock protein/chaperone network and multiple stress resistance. Plant Biotechnol. J. 2017, 15, 405–414. [Google Scholar] [CrossRef]
  26. Czarnecka-Verner, E.; Yuan, C.-X.; Scharf, K.-D.; Englich, G.; Gurley, W.B. Plants contain a novel multi-member class of heat shock factors without transcriptional activator potential. Plant Mol. Biol. 2000, 43, 459–471. [Google Scholar] [CrossRef] [PubMed]
  27. Kotak, S.; Larkindale, J.; Lee, U.; von Koskull-Döring, P.; Vierling, E.; Scharf, K.-D. Complexity of the heat stress response in plants. Curr. Opin. Plant Biol. 2007, 10, 310–316. [Google Scholar] [CrossRef]
  28. Mishra, S.K.; Tripp, J.; Winkelhaus, S.; Tschiersch, B.; Theres, K.; Nover, L.; Scharf, K.-D. In the complex family of heat stress transcription factors, HsfA1 has a unique role as master regulator of thermotolerance in tomato. Genes Develop. 2002, 16, 1555–1567. [Google Scholar] [CrossRef] [PubMed] [Green Version]
  29. Yoshida, T.; Ohama, N.; Nakajima, J.; Kidokoro, S.; Mizoi, J.; Nakashima, K.; Maruyama, K.; Kim, J.-M.; Seki, M.; Todaka, D. Arabidopsis HsfA1 transcription factors function as the main positive regulators in heat shock-responsive gene expression. Mol. Genet. Genom. 2011, 286, 321–332. [Google Scholar] [CrossRef]
  30. Hahn, A.; Bublak, D.; Schleiff, E.; Scharf, K.-D. Crosstalk between Hsp90 and Hsp70 chaperones and heat stress transcription factors in tomato. Plant Cell 2011, 23, 741–755. [Google Scholar] [CrossRef] [PubMed] [Green Version]
  31. Charng, Y.-Y.; Liu, H.-C.; Liu, N.-Y.; Chi, W.-T.; Wang, C.-N.; Chang, S.-H.; Wang, T.-T. A heat-inducible transcription factor, HsfA2, is required for extension of acquired thermotolerance in Arabidopsis. Plant Physiol. 2007, 143, 251–262. [Google Scholar] [CrossRef] [Green Version]
  32. Lämke, J.; Brzezinka, K.; Altmann, S.; Bäurle, I. A hit-and-run heat shock factor governs sustained histone methylation and transcriptional stress memory. EMBO J. 2016, 35, 162–175. [Google Scholar] [CrossRef] [Green Version]
  33. Nishizawa, A.; Yabuta, Y.; Yoshida, E.; Maruta, T.; Yoshimura, K.; Shigeoka, S. Arabidopsis heat shock transcription factor A2 as a key regulator in response to several types of environmental stress. Plant J. 2006, 48, 535–547. [Google Scholar] [CrossRef] [PubMed]
  34. Yoshida, T.; Sakuma, Y.; Todaka, D.; Maruyama, K.; Qin, F.; Mizoi, J.; Kidokoro, S.; Fujita, Y.; Shinozaki, K.; Yamaguchi-Shinozaki, K. Functional analysis of an Arabidopsis heat-shock transcription factor HsfA3 in the transcriptional cascade downstream of the DREB2A stress-regulatory system. Biochem. Biophys. Res. Commun. 2008, 368, 515–521. [Google Scholar] [CrossRef] [PubMed]
  35. Lin, K.-F.; Tsai, M.-Y.; Lu, C.-A.; Wu, S.-J.; Yeh, C.-H. The roles of Arabidopsis HSFA2, HSFA4a, and HSFA7a in the heat shock response and cytosolic protein response. Bot. Stud. 2018, 59, 1–9. [Google Scholar] [CrossRef]
  36. Shim, D.; Hwang, J.-U.; Lee, J.; Lee, S.; Choi, Y.; An, G.; Martinoia, E.; Lee, Y. Orthologs of the class A4 heat shock transcription factor HsfA4a confer cadmium tolerance in wheat and rice. Plant Cell 2009, 21, 4031–4043. [Google Scholar] [CrossRef] [PubMed] [Green Version]
  37. Guo, X.-L.; Yuan, S.-N.; Zhang, H.-N.; Zhang, Y.-Y.; Zhang, Y.-J.; Wang, G.-Y.; Li, Y.-Q.; Li, G.-L. Heat-response patterns of the heat shock transcription factor family in advanced development stages of wheat (Triticum aestivum L.) and thermotolerance-regulation by TaHsfA2–10. BMC Plant Biol. 2020, 20, 364. [Google Scholar] [CrossRef]
  38. Kotak, S.; Vierling, E.; Bäumlein, H.; Koskull-0Döring, P.V. A novel transcriptional cascade regulating expression of heat stress proteins during seed development of Arabidopsis. Plant Cell 2007, 19, 182–195. [Google Scholar] [CrossRef] [Green Version]
  39. Albihlal, W.S.; Obomighie, I.; Blein, T.; Persad, R.; Chernukhin, I.; Crespi, M.; Bechtold, U.; Mullineaux, P.M. Arabidopsis heat shock transcription factora1b regulates multiple developmental genes under benign and stress conditions. J. Exp. Bot. 2018, 69, 2847–2862. [Google Scholar] [CrossRef] [Green Version]
  40. Guo, J.; Wu, J.; Ji, Q.; Wang, C.; Luo, L.; Yuan, Y.; Wang, Y.; Wang, J. Genome-wide analysis of heat shock transcription factor families in rice and Arabidopsis. J. Genet. Genom. 2008, 35, 105–118. [Google Scholar] [CrossRef]
  41. Lin, Y.-X.; Jiang, H.-Y.; Chu, Z.-X.; Tang, X.-L.; Zhu, S.-W.; Cheng, B.-J. Genome-wide identification, classification and analysis of heat shock transcription factor family in maize. BMC Genom. 2011, 12, 76. [Google Scholar] [CrossRef] [Green Version]
  42. Chung, E.; Kim, K.-M.; Lee, J.-H. Genome-wide analysis and molecular characterization of heat shock transcription factor family in Glycine max. J. Genet. Genom. 2013, 40, 127–135. [Google Scholar] [CrossRef] [PubMed]
  43. Wang, F.; Dong, Q.; Jiang, H.; Zhu, S.; Chen, B.; Xiang, Y. Genome-wide analysis of the heat shock transcription factors in Populus trichocarpa and Medicago truncatula. Mol. Biol. Rep. 2012, 39, 1877–1886. [Google Scholar] [CrossRef]
  44. Yang, X.; Zhu, W.; Zhang, H.; Liu, N.; Tian, S. Heat shock factors in tomatoes: Genome-wide identification, phylogenetic analysis and expression profiling under development and heat stress. Peer J. 2016, 4, e1961. [Google Scholar] [CrossRef] [PubMed] [Green Version]
  45. Wen, F.; Wu, X.; Li, T.; Jia, M.; Liu, X.; Li, P.; Zhou, X.; Ji, X.; Yue, X. Genome-wide survey of heat shock factors and heat shock protein 70s and their regulatory network under abiotic stresses in Brachypodium distachyon. PLoS ONE 2017, 12, e0180352. [Google Scholar] [CrossRef] [Green Version]
  46. Duan, S.; Liu, B.; Zhang, Y.; Li, G.; Guo, X. Genome-wide identification and abiotic stress-responsive pattern of heat shock transcription factor family in Triticum aestivum L. BMC Genom. 2019, 20, 257. [Google Scholar] [CrossRef] [PubMed]
  47. Letunic, I.; Copley, R.R.; Schmidt, S.; Ciccarelli, F.D.; Doerks, T.; Schultz, J.; Ponting, C.P.; Bork, P. SMART 4.0: Towards genomic data integration. Nucl. Acids Res. 2004, 32, D142–D144. [Google Scholar] [CrossRef] [Green Version]
  48. Delorenzi, M.; Speed, T. An HMM model for coiled-coil domains and a comparison with PSSM-based predictions. Bioinformatics 2002, 18, 617–625. [Google Scholar] [CrossRef]
  49. Horton, P.; Park, K.-J.; Obayashi, T.; Fujita, N.; Harada, H.; Adams-Collier, C.; Nakai, K. WoLF PSORT: Protein localization predictor. Nucl. Acids Res. 2007, 35, W585–W587. [Google Scholar] [CrossRef] [Green Version]
  50. Yu, C.S.; Chen, Y.C.; Lu, C.H.; Hwang, J.K. Prediction of protein subcellular localization. Proteins Struct. Funct. Bioinform. 2006, 64, 643–651. [Google Scholar] [CrossRef]
  51. Bailey, T.L.; Boden, M.; Buske, F.A.; Frith, M.; Grant, C.E.; Clementi, L.; Ren, J.; Li, W.W.; Noble, W.S. MEME SUITE: Tools for motif discovery and searching. Nucl. Acids Res. 2009, 37, W202–W208. [Google Scholar] [CrossRef]
  52. Hu, B.; Jin, J.; Guo, A.-Y.; Zhang, H.; Luo, J.; Gao, G. GSDS 2.0: An upgraded gene feature visualization server. Bioinformatics 2015, 31, 1296–1297. [Google Scholar] [CrossRef] [Green Version]
  53. Thompson, J.D.; Higgins, D.G.; Gibson, T.J. CLUSTAL W: Improving the sensitivity of progressive multiple sequence alignment through sequence weighting, position-specific gap penalties and weight matrix choice. Nucl. Acids Res. 1994, 22, 4673–4680. [Google Scholar] [CrossRef] [PubMed] [Green Version]
  54. Kumar, S.; Stecher, G.; Li, M.; Knyaz, C.; Tamura, K. MEGA X: Molecular evolutionary genetics analysis across computing platforms. Mol. Biol. Evol. 2018, 35, 1547–1549. [Google Scholar] [CrossRef] [PubMed]
  55. Gu, Z.; Cavalcanti, A.; Chen, F.-C.; Bouman, P.; Li, W.-H. Extent of gene duplication in the genomes of Drosophila, nematode, and yeast. Mol. Biol. Evol. 2002, 19, 256–262. [Google Scholar] [CrossRef] [Green Version]
  56. Yang, S.; Zhang, X.; Yue, J.-X.; Tian, D.; Chen, J.-Q. Recent duplications dominate NBS-encoding gene expansion in two woody species. Mol. Genet. Genom. 2008, 280, 187–198. [Google Scholar] [CrossRef]
  57. Lynch, M.; Conery, J.S. The evolutionary fate and consequences of duplicate genes. Science 2000, 290, 1151–1155. [Google Scholar] [CrossRef] [Green Version]
  58. Chen, C.; Chen, H.; Zhang, Y.; Thomas, R.H.; Frank, H.M.; He, Y.; Xia, R. TBtools: An Integrative Toolkit Developed for Interactive Analyses of Big Biological Data. Mol. Plant 2020, 13, 1194–1202. [Google Scholar] [CrossRef]
  59. Stelpflug, S.C.; Sekhon, R.S.; Vaillancourt, B.; Hirsch, C.N.; Buell, C.R.; de Leon, N.; Kaeppler, S.M. An expanded maize gene expression atlas based on RNA sequencing and its use to explore root development. Plant Genome 2016, 9, 1–16. [Google Scholar] [CrossRef] [PubMed]
  60. Jumper, J.; Evans, R.; Pritzel, A.; Green, T.; Figurnov, M.; Ronneberger, O.; Tunyasuvunakool, K.; Bates, R.; Žídek, A.; Potapenko, A. Highly accurate protein structure prediction with AlphaFold. Nature 2021, 596, 583–589. [Google Scholar] [CrossRef] [PubMed]
  61. Szklarczyk, D.; Gable, A.L.; Nastou, K.C.; Lyon, D.; Kirsch, R.; Pyysalo, S.; Doncheva, N.T.; Legeay, M.; Fang, T.; Bork, P. The STRING database in 2021: Customizable protein–protein networks, and functional characterization of user-uploaded gene/measurement sets. Nucleic Acids Res. 2021, 49, D605–D612. [Google Scholar] [CrossRef] [PubMed]
  62. Shannon, P.; Markiel, A.; Ozier, O.; Baliga, N.S.; Wang, J.T.; Ramage, D.; Amin, N.; Schwikowski, B.; Ideker, T. Cytoscape: A software environment for integrated models of biomolecular interaction networks. Genome Res. 2003, 13, 2498–2504. [Google Scholar] [CrossRef] [PubMed]
  63. Consortium, G.O. The gene ontology resource: 20 years and still GOing strong. Nucl. Acids Res. 2019, 47, D330–D338. [Google Scholar]
  64. Rehman, S.; Jørgensen, B.; Aziz, E.; Batool, R.; Naseer, S.; Rasmussen, S.K. Genome wide identification and comparative analysis of the serpin gene family in brachypodium and barley. Plants 2020, 9, 1439. [Google Scholar] [CrossRef] [PubMed]
  65. Gaut, B.S. Evolutionary dynamics of grass genomes. New Phytol. 2002, 154, 15–28. [Google Scholar] [CrossRef] [Green Version]
  66. Initiative, I.B. Genome sequencing and analysis of the model grass Brachypodium distachyon. Nature 2010, 463, 763–768. [Google Scholar]
  67. Ali, A.; Javed, T.; Zaheer, U.; Zhou, J.R.; Huang, M.T.; Fu, H.Y.; Gao, S.J. Genome-Wide Identification and Expression Profiling of the bHLH Transcription Factor Gene Family in Saccharum spontaneum Under Bacterial Pathogen Stimuli. Tropical Plant Biol. 2021, 14, 283–294. [Google Scholar] [CrossRef]
  68. Xu, X.; Yang, Y.; Liu, C.; Sun, Y.; Zhang, T.; Hou, M.; Huang, S.; Yuan, H. The evolutionary history of the sucrose synthase gene family in higher plants. BMC Plant Biol. 2019, 19, 566. [Google Scholar] [CrossRef] [Green Version]
  69. Fragkostefanakis, S.; Röth, S.; Schleiff, E.; Scharf, K.D. Prospects of engineering thermotolerance in crops through modulation of heat stress transcription factor and heat shock protein networks. Plant Cell Environ. 2015, 38, 1881–1895. [Google Scholar] [CrossRef]
  70. De Cuyper, C.; Struk, S.; Braem, L.; Gevaert, K.; De Jaeger, G.; Goormachtig, S. Strigolactones, karrikins and beyond. Plant Cell Environ. 2017, 40, 1691–1703. [Google Scholar] [CrossRef]
  71. Ye, J.; Yang, X.; Hu, G.; Liu, Q.; Li, W.; Zhang, L.; Song, X. Genome-wide investigation of heat shock transcription factor family in wheat (Triticum aestivum L.) and possible roles in anther development. Int. J. Mol. Sci. 2020, 21, 608. [Google Scholar] [CrossRef] [Green Version]
  72. Wu, T.-Y.; Juan, Y.-T.; Hsu, Y.-H.; Wu, S.-H.; Liao, H.-T.; Fung, R.W.; Charng, Y.-Y. Interplay between heat shock proteins HSP101 and HSA32 prolongs heat acclimation memory posttranscriptionally in Arabidopsis. Plant Physiol. 2013, 161, 2075–2084. [Google Scholar] [CrossRef] [Green Version]
  73. Borkovich, K.; Farrelly, F.; Finkelstein, D.; Taulien, J.; Lindquist, S. hsp82 is an essential protein that is required in higher concentrations for growth of cells at higher temperatures. Mol. Cell. Biol. 1989, 9, 3919–3930. [Google Scholar]
  74. Gu, L.; Jiang, T.; Zhang, C.; Li, X.; Wang, C.; Zhang, Y.; Li, T.; Dirk, L.M.; Downie, A.B.; Zhao, T. Maize HSFA2 and HSBP2 antagonistically modulate raffinose biosynthesis and heat tolerance in Arabidopsis. Plant J. 2019, 100, 128–142. [Google Scholar] [CrossRef] [PubMed]
  75. Pulido, P.; Leister, D. Novel DNAJ-related proteins in Arabidopsis thaliana. New Phytol. 2018, 217, 480–490. [Google Scholar] [CrossRef] [Green Version]
  76. Kong, F.; Deng, Y.; Wang, G.; Wang, J.; Liang, X.; Meng, Q. LeCDJ1, a chloroplast DnaJ protein, facilitates heat tolerance in transgenic tomatoes. J. Integr. Plant Biol. 2014, 56, 63–74. [Google Scholar] [CrossRef] [PubMed]
  77. Kong, F.; Deng, Y.; Zhou, B.; Wang, G.; Wang, Y.; Meng, Q. A chloroplast-targeted DnaJ protein contributes to maintenance of photosystem II under chilling stress. J. Exp. Bot. 2014, 65, 143–158. [Google Scholar] [CrossRef] [Green Version]
  78. Mizoi, J.; Shinozaki, K.; Yamaguchi-Shinozaki, K. AP2/ERF family transcription factors in plant abiotic stress responses. Biochim. Biophys. Acta (BBA) Gene Regul. Mech. 2012, 1819, 86–96. [Google Scholar] [CrossRef]
  79. Suzuki, N.; Bajad, S.; Shuman, J.; Shulaev, V.; Mittler, R. The transcriptional co-activator MBF1c is a key regulator of thermotolerance in Arabidopsis thaliana. J. Biol. Chem. 2008, 283, 9269–9275. [Google Scholar] [CrossRef] [Green Version]
  80. Jaimes-Miranda, F.; Chávez Montes, R.A. The plant MBF1 protein family: A bridge between stress and transcription. J. Exp. Bot. 2020, 71, 1782–1791. [Google Scholar] [CrossRef]
  81. Hay, R.T. SUMO: A history of modification. Mol. Cell 2005, 18, 1–12. [Google Scholar] [CrossRef] [PubMed]
  82. Rytz, T.C.; Miller, M.J.; McLoughlin, F.; Augustine, R.C.; Marshall, R.S.; Juan, Y.-T.; Charng, Y.-Y.; Scalf, M.; Smith, L.M.; Vierstra, R.D. SUMOylome profiling reveals a diverse array of nuclear targets modified by the SUMO ligase SIZ1 during heat stress. Plant Cell 2018, 30, 1077–1099. [Google Scholar] [CrossRef] [PubMed]
  83. Strable, J.; Scanlon, M.J. Maize (Zea mays): A model organism for basic and applied research in plant biology. Cold Spring Harb. Protoc. 2009, 2009, emo132. [Google Scholar] [CrossRef] [Green Version]
  84. Schnable, P.S.; Ware, D.; Fulton, R.S.; Stein, J.C.; Wei, F.; Pasternak, S.; Liang, C.; Zhang, J.; Fulton, L.; Graves, T.A. The B73 maize genome: Complexity, diversity, and dynamics. Science 2009, 326, 1112–1115. [Google Scholar] [CrossRef] [Green Version]
  85. Nagaraju, M.; Sudhakar Reddy, P.; Anil Kumar, S.; Srivastava, R.K.; Kavi Kishor, P.; Rao, D.M. Genome-wide scanning and characterization of Sorghum bicolor L. heat shock transcription factors. Curr. Genom. 2015, 16, 279–291. [Google Scholar] [CrossRef] [Green Version]
  86. Kaul, S.; Koo, H.L.; Jenkins, J.; Rizzo, M.; Rooney, T.; Tallon, L.J.; Feldblyum, T.; Nierman, W.; Benito, M.-I.; Lin, X. Analysis of the genome sequence of the flowering plant Arabidopsis thaliana. Nature 2000, 408, 796–815. [Google Scholar]
  87. Young, N.D.; Debellé, F.; Oldroyd, G.E.; Geurts, R.; Cannon, S.B.; Udvardi, M.K.; Benedito, V.A.; Mayer, K.F.; Gouzy, J.; Schoof, H. The Medicago genome provides insight into the evolution of rhizobial symbioses. Nature 2011, 480, 520–524. [Google Scholar] [CrossRef] [PubMed] [Green Version]
  88. Yu, J.; Hu, S.; Wang, J.; Wong, G.K.-S.; Li, S.; Liu, B.; Deng, Y.; Dai, L.; Zhou, Y.; Zhang, X. A draft sequence of the rice genome (Oryza sativa L. ssp. indica). Science 2002, 296, 79–92. [Google Scholar] [CrossRef]
  89. Raza, A.; Su, W.; Gao, A.; Mehmood, S.S.; Hussain, M.A.; Nie, W.; Lv, Y.; Zou, X.; Zhang, X. Catalase (CAT) Gene Family in Rapeseed (Brassica napus L.): Genome-Wide Analysis, Identification, and Expression Pattern in Response to Multiple Hormones and Abiotic Stress Conditions. Int. J. Mol. Sci. 2021, 22, 4281. [Google Scholar] [CrossRef] [PubMed]
  90. Van de Peer, Y.; Maere, S.; Meyer, A. The evolutionary significance of ancient genome duplications. Nat. Rev. Genet. 2009, 10, 725–732. [Google Scholar] [CrossRef] [Green Version]
  91. Cannon, S.B.; Mitra, A.; Baumgarten, A.; Young, N.D.; May, G. The roles of segmental and tandem gene duplication in the evolution of large gene families in Arabidopsis thaliana. BMC Plant Biol. 2004, 4, 10. [Google Scholar] [CrossRef] [Green Version]
  92. Liu, Y.; Jiang, H.; Chen, W.; Qian, Y.; Ma, Q.; Cheng, B.; Zhu, S. Genome-wide analysis of the auxin response factor (ARF) gene family in maize (Zea mays). Plant Growth Regul. 2011, 63, 225–234. [Google Scholar] [CrossRef]
  93. Solé, R.V.; Fernandez, P.; Kauffman, S.A. Adaptive walks in a gene network model of morphogenesis: Insights into the Cambrian explosion. arXiv 2003, arXiv:q-bio/0311013. [Google Scholar]
  94. Maere, S.; De Bodt, S.; Raes, J.; Casneuf, T.; Van Montagu, M.; Kuiper, M.; Van de Peer, Y. Modeling gene and genome duplications in eukaryotes. Proc. Natl. Acad. Sci. USA 2005, 102, 5454–5459. [Google Scholar] [CrossRef] [Green Version]
  95. Jiao, Y.; Wickett, N.J.; Ayyampalayam, S.; Chanderbali, A.S.; Landherr, L.; Ralph, P.E.; Tomsho, L.P.; Hu, Y.; Liang, H.; Soltis, P.S. Ancestral polyploidy in seed plants and angiosperms. Nature 2011, 473, 97–100. [Google Scholar] [CrossRef]
  96. Rose, A. Intron-mediated regulation of gene expression. Nucl. Pre-Mrna Process. Plants 2008, 326, 277–290. [Google Scholar]
  97. Liu, H.-C.; Charng, Y.-Y. Common and distinct functions of Arabidopsis class A1 and A2 heat shock factors in diverse abiotic stress responses and development. Plant Physiol. 2013, 163, 276–290. [Google Scholar] [CrossRef] [PubMed] [Green Version]
  98. Kumar, R.R.; Goswami, S.; Singh, K.; Dubey, K.; Rai, G.K.; Singh, B.; Singh, S.; Grover, M.; Mishra, D.; Kumar, S. Characterization of novel heat-responsive transcription factor (TaHSFA6e) gene involved in regulation of heat shock proteins (HSPs)—A key member of heat stress-tolerance network of wheat. J. Biotechnol. 2018, 279, 1–12. [Google Scholar] [CrossRef]
  99. Yokotani, N.; Ichikawa, T.; Kondou, Y.; Matsui, M.; Hirochika, H.; Iwabuchi, M.; Oda, K. Expression of rice heat stress transcription factor OsHsfA2e enhances tolerance to environmental stresses in transgenic Arabidopsis. Planta 2008, 227, 957–967. [Google Scholar] [CrossRef] [PubMed]
  100. Jiang, Y.; Zheng, Q.; Chen, L.; Liang, Y.; Wu, J. Ectopic overexpression of maize heat shock transcription factor gene ZmHsf04 confers increased thermo and salt-stress tolerance in transgenic Arabidopsis. Acta Physiol. Plant. 2018, 40, 9. [Google Scholar] [CrossRef]
  101. Li, G.; Zhang, Y.; Zhang, H.; Zhang, Y.; Zhao, L.; Liu, Z.; Guo, X. Characteristics and regulating role in thermotolerance of the heat shock transcription factor ZmHsf12 from Zea mays L. J. Plant Biol. 2019, 62, 329–341. [Google Scholar] [CrossRef]
  102. Banti, V.; Mafessoni, F.; Loreti, E.; Alpi, A.; Perata, P. The heat-inducible transcription factor HsfA2 enhances anoxia tolerance in Arabidopsis. Plant Physiol. 2010, 152, 1471–1483. [Google Scholar] [CrossRef] [PubMed] [Green Version]
  103. Miller, M.J.; Barrett-Wilt, G.A.; Hua, Z.; Vierstra, R.D. Proteomic analyses identify a diverse array of nuclear processes affected by small ubiquitin-like modifier conjugation in Arabidopsis. Proc. Natl. Acad. Sci. USA 2010, 107, 16512–16517. [Google Scholar] [CrossRef] [PubMed] [Green Version]
  104. Zhang, S.; Wang, S.; Lv, J.; Liu, Z.; Wang, Y.; Ma, N.; Meng, Q. SUMO E3 ligase SlSIZ1 facilitates heat tolerance in tomato. Plant Cell Physiol. 2018, 59, 58–71. [Google Scholar] [CrossRef] [PubMed] [Green Version]
Figure 1. The chromosomal position of HSF genes in maize. The scale on the left side represents megabases (Mb). The chromosome number is indicated at the middle of each bar.
Agronomy 11 02335 g001
Figure 2. A neighbor-joining phylogenetic tree was constructed after aligning protein sequences of Arabidopsis thaliana, Oryza sativa, Brachypodium distachyon, Sorghum bicolor, and Zea mays. Overall, 21 AtHSFs (marron circle), 25 OsHSFs (turquoise rhombus), 23 SbHSFs (purple rectangular), 24 BdHSFs (yellow triangle), and 25 ZmHSFs (red square) were divided into three classes and further into 15 sub-classes.
Agronomy 11 02335 g002
Figure 3. Circular illustration of the maize genome. The paralogous HSF genes are connected with grey lines. The red lines on top of the chromosomal bar represent the position of HSFs.
Agronomy 11 02335 g003
Figure 4. The intron–exon structure of maize HSF genes. A black line represents the introns. Exons are represented by a yellow rectangle and 5′ UTR and 3′ UTR by reddish-pink wedges. The gene structure of Zea mays HSFs was in alignment with the phylogenetic relationship.
Agronomy 11 02335 g004
Figure 5. Conserved motifs in maize HSFs as identified by MEME. The motifs were identified by using full-length protein sequences of ZmHSFs. Name of HSFs and p-values are indicated on the left side. Each motif is represented by a unique color, as indicated at the bottom.
Agronomy 11 02335 g005
Figure 6. Multiple sequence alignment of maize HSFs. The highly conserved DBD consists of four antiparallel β-stranded sheets (β1, β2, β3, β4) and a bundle of three α-helices (α1, α2, α3) which form the secondary structure. Rectangular boxes represent α-helices while square boxes represent β-stranded sheets.
Agronomy 11 02335 g006
Figure 7. (A) The overall amino acid composition of maize HSFs, (B) class A HSFs, (C) class B HSFs, and (D) class C HSFs.
Agronomy 11 02335 g007
Figure 8. Protein structure of maize HSFs. The prediction confidence level is presented at the bottom. For detailed information about proteins, see Table 5.
Agronomy 11 02335 g008
Figure 9. Expression profiles of maize HSFs in different seed (A), vegetative (B), and reproductive (C) tissues based on transcriptome data. The heat map was constructed using Tbtools. The color bar at the top right represents the log transformed FPKM values. Green represents higher, red lower, and yellow, medium transcript values.
Agronomy 11 02335 g009aAgronomy 11 02335 g009b
Figure 10. Expression profiles of maize HSFs under different abiotic stress conditions. Color bar at the top right represents the log-transformed FPKM values. Green represents higher, red lower, and yellow, medium transcript values.
Agronomy 11 02335 g010
Figure 11. Gene ontology enrichment analysis. The figure depicts the predicted role of HSFs in biological processes, molecular functions, and cellular components.
Agronomy 11 02335 g011
Figure 12. Protein–protein network of maize HSFs. The line connecting two proteins represents that an interaction exists between them.
Agronomy 11 02335 g012
Table 1. Detailed sequence annotation of identified maize HSF genes.
GeneTranscript IDGene IDChromosomeLocationStrandTranscript CountGenomic DNACDS LengthExonIntron
ZmHSF-01GRMZM2G165972_T02Zm00001d027757112518410–12520734+42325159021
ZmHSF-02GRMZM2G118485_T02Zm00001d028269128522823–28529222+37416125432
ZmHSF-03GRMZM2G164909_T01Zm00001d0292701197781323–19778300211680124521
ZmHSF-04GRMZM2G010871_T01Zm00001d0329231239675070–23967809763628107421
ZmHSF-05GRMZM2G132971_T01Zm00001d0344331287786016–287790222+34207108021
ZmHSF-06GRMZM2G115456_T01Zm00001d0348861299272434–299277717+15284158421
ZmHSF-07GRMZM2G088242_T01Zm00001d0058432185666362–185668432+12071118521
ZmHSF-08GRMZM2G002131_T01Zm00001d0058882186829423–186833487+14065112521
ZmHSF-09GRMZM2G089525_T01Zm00001d0441683217438918–2174407281181199621
ZmHSF-10GRMZM2G005815_T01Zm00001d0442593219545854–219552097+26244138921
ZmHSF-11GRMZM2G098696_T01Zm00001d0527384195298840–19530058421745111321
ZmHSF12GRMZM2G384339_T01Zm00001d0165205889476–89386724392149421
ZmHSF-13GRMZM2G105348_T01Zm00001d0166745150228697–15023023211536118521
ZmHSF-14GRMZM2G179802_T02Zm00001d0128235162047221–16205347536261192021
ZmHSF-15GRMZM2G059851_T01Zm00001d0162555168263116–168266561+23446152721
ZmHSF-16AC206165.3_FGT007Zm00001d0387466159812447–15981410511659141021
ZmHSF-17GRMZM2G125969_T01Zm00001d02071479712577–971659634020128421
ZmHSF-18GRMZM2G139535_T01Zm00001d0212637125896425–125900126+2370289721
ZmHSF-19GRMZM2G165272_T01Zm00001d0222957142270318- 142272208+11891118521
ZmHSF-20AC205471.4_FGT003Zm00001d0108128124710390–124712153+11764134121
ZmHSF-21GRMZM2G086880_T01Zm00001d0114068144887947–144889308+11364124821
ZmHSF-22GRMZM2G118453_T01Zm00001d0127498173979796–17398220312407187021
ZmHSF-23GRMZM2G173090_T02Zm00001d046204959460696–59462007+21473135721
ZmHSF-24GRMZM2G026742_T01Zm00001d0480419146029209–14603266244461184054
ZmHSF-25GRMZM2G301485_T01Zm00001d02609410137124859–13712623521376130021
Note: +: Positive strand −: Negative strand.
Table 2. Distribution of HSF genes in different sub-classes in selected plant species.
Sub-ClassArabidopsis
AtHSFs
Zea mays
ZmHSFs
Sorghum bicolor
SbHSFs
Oryza sativa
OsHSFs
Brachypodium distachyon
BdHSFs
A142111
A212333
A311111
A423122
A511111
A622222
A722222
A812111
A910000
B112111
B224333
B310000
B411343
C112222
C201222
Total2125232524
Table 3. Duplicated gene pairs, non-synonymous substitution rate (Ka), synonymous substitution rate (Ks), non-synonymous to synonymous substitution rate ratio (Ka/Ks), estimated time of duplication event in a million years ago (MYA), and mode of gene duplication.
Duplicated GenesKaKsKa/KsEstimated Time (MYA)Mode of Duplication
ZmHSF-01/ZmHSF-040.18370.37330.492130.59Tandem
ZmHSF-02/ZmHSF-240.02480.07270.34155.96Segmental
ZmHSF-03/ZmHSF-110.24970.37260.670230.54Segmental
ZmHSF-05/ZmHSF-170.18100.32500.557026.63Segmental
ZmHSF-06/ZmHSF-120.27720.46000.602637.70Segmental
ZmHSF-07/ZmHSF-190.15382.26410.514321.64Segmental
ZmHSF-08/ZmHSF-180.18140.23950.757219.63Segmental
ZmHSF-09/ZmHSF-210.03890.08390.46446.87Segmental
ZmHSF-16/ZmHSF200.07330.10400.70498.52Segmental
Table 4. Conserved motif sequence of Zea mays HSFs.
MotifConsensus Sequence
1LPKYFKHNNFSSFVRQLNTYGFRKVDPDRWEFANEGFLRGQKHLLKNIHR
2PFLTKTYEMVDDPATDAVVSWGAAGNSFV
3LLAELVRLRQZQQSTSEQLQALERRLQGMEQRQQQMMAFLA
4VWBPAEFARDL
5GLEEEIERLKRDKAL
6MQNPDFLRQLVQQQEKSKELEDAINKKRR
7LARELAQMRKLCNNILLLMSKYADTQQPD
8VNDDFWEZFLTE
9DGGPVDDSEAAGGGGQIIKYQPPIPEAAKQPLPKNLAFDSS
10MPMDVEMASNNVGTFDSTGNDFTDTSALCEWDDMDIFGGELEHILQQPEQ
11QSWPIYRPRPVYHPLRACNG
12KPSQDGPSDPQQPPVKTAPGPENIEIGKY
13TIEDYGYDRPWLEQDCQMEAQQNCKNPQY
14KSVKLFGVLLKDAARKRGRCEEAAASERPIKMIRIGEPWIGVPSSGPGRC
15RLFGVSIGRKRMRD
16DNVBQLTEQMGYLSSANH
17RKPIHSHSPQTQ
18VDMCSDTTTGDTSQDETTSETGGSHGPAK
19CCISMGGEDHR
20PRPMEGLHDVGPP
Table 5. The physio-chemical properties of maize HSFs proteins including group, protein ID, domains, amino acid physio-chemical properties, and sub-cellular localization.
GeneGroupProtein IDDBDODAmino AcidpIMolecular WeightLocalization
CELLO
Localization
WoLFPSORT
ZmHSF-01A-6bGRMZM2G165972_P0244–133164–1843845.3043,268.46NucleusNucleus
ZmHSF-02A-8aGRMZM2G118485_P0251–140170–1904175.0946,816.21NucleusNucleus
ZmHSF-03B-2dGRMZM2G164909_P0172–161231–2604147.1444,381.82NucleusNucleus
ZmHSF-04A-6aGRMZM2G010871_P0146–135165–2063575.0340,550.58NucleusNucleus
ZmHSF-05A-2aGRMZM2G132971_P0140–129149–2043595.5740,587.23NucleusNucleus
ZmHSF-06A-1aGRMZM2G115456_P0159–148176–2035275.1156,724.50NucleusNucleus
ZmHSF-07B-4aGRMZM2G088242_P0122–112216–2433947.8141,742.83NucleusNucleus
ZmHSF-08B-1aGRMZM2G002131_P0118–107165–1922989.1332,270.31NucleusNucleus
ZmHSF-09C-1cGRMZM2G089525_P0127–116168–1883315.9435,883.69NucleusNucleus
ZmHSF-10A-7aGRMZM2G005815_P01140–231260–2804628.8750,970.67ChloroplastNucleus
ZmHSF-11B-2bGRMZM2G098696_P0137–126196–2163705.8939,562.03NucleusNucleus
ZmHSF-12A-1bGRMZM2G059851_P0176–165190–2315084.9656,061.66NucleusNucleus
ZmHSF-13C-2aGRMZM2G105348_P0115–104135–1712575.8527,836.98NucleusNucleus
ZmHSF-14A-5GRMZM2G179802_P0269–159177–2255285.5758,138.65NucleusNucleus
ZmHSF-15A-3GRMZM2G384339_P0132–121149–1764975.0654,104.58NucleusNucleus
ZmHSF-16A-4bAC206165.3_FGP00725–114135–1554695.4151,623.79NucleusNucleus
ZmHSF-17A-2bGRMZM2G125969_P0152–141169–2103754.7042,043.73NucleusNucleus
ZmHSF-18B-1bGRMZM2G139535_P0120–109169–1892989.5332,258.35NucleusNucleus
ZmHSF-19B-2cGRMZM2G165272_P0145–134207–2343945.0041,468.10NucleusNucleus
ZmHSF-20A-4dAC205471.4_FGP00313–102123–1434465.1549,718.46NucleusNucleus
ZmHSF-21C-1aGRMZM2G086880_P0135–124173–1933488.0937,409.50NucleusNucleus
ZmHSF-22A-4aGRMZM2G118453_P0110–99120–1754335.3048,829.92NucleusNucleus
ZmHSF-23A-7bGRMZM2G173090_P0251–140164–2053504.9538,154.66CytoplasmCytoplasm
ZmHSF-24A-8bGRMZM2G026742_P0151–140170–1904074.9745,317.63NucleusNucleus
ZmHSF-25B-2aGRMZM2G301485_P0151–140170–1903185.8939,562.03NucleusNucleus
Note: a, b, c, d represents the corresponding protein groups to which these genes belong.
Publisher’s Note: MDPI stays neutral with regard to jurisdictional claims in published maps and institutional affiliations.

