Article

Short-Term Decomposition and Nutrient-Supplying Ability of Sewage Sludge Digestate, Digestate Compost, and Vermicompost on Acidic Sandy and Calcareous Loamy Soils

by
Nikolett Uzinger
1,
Orsolya Szécsy
1,*,
Nóra Szűcs-Vásárhelyi
1,2,
István Padra
3,
Dániel Benjámin Sándor
4,
Zdenko Lončarić
5,
Eszter Draskovits
1 and
Márk Rékási
1
1
Institute for Soil Sciences, Centre for Agricultural Research, Herman O. Str. 15, 1022 Budapest, Hungary
2
Faculty of Military Sciences and Officer Training, Doctoral School of Military Engineering, University of Public Service, Hungária Str. 9-11, 1101 Budapest, Hungary
3
Bácsvíz ZRt. Water and Sewer Service, Izsáki út 13, 6000 Kecskemét, Hungary
4
Inno-Water Inc., Hidegkúti út 80/D, 1028 Budapest, Hungary
5
Faculty of Agrobiotechnical Sciences, Josip Juraj Strossmayer University of Osijek, Vladimira Preloga 1, 31 000 Osijek, Croatia
*
Author to whom correspondence should be addressed.
Agronomy 2021, 11(11), 2249; https://doi.org/10.3390/agronomy11112249
Submission received: 20 September 2021 / Revised: 3 November 2021 / Accepted: 4 November 2021 / Published: 6 November 2021

Abstract

:
Organic waste and the compost and vermicompost derived from it may have different agronomic values, but little work is available on this aspect of sewage sludge. A 75-day pot experiment with perennial ryegrass (Lolium perenne) as the test plant aimed to investigate the fertiliser value and organic matter replenishment capacity of digested sewage sludge (DS) and the compost (COM) and vermicompost (VC) made from it, applied in 1% and 3% doses on acidic sand and calcareous loam. The NPK content and availability, changes in organic carbon content and plant biomass, and the efficiency of the amendments as nitrogen fertilisers were investigated. The final average residual carbon content for DS, COM, and VC was 35 ± 34, 85 ± 46, and 55 ± 46%, respectively. The organic carbon mineralisation rate depended on the soil type. The additives induced significant N mineralisation in both soils: the average increment in mineral N content was 1.7 times the total added N on acidic sand and 4.2 times it on calcareous loam for the 1% dose. The agronomic efficiency of COM and VC as fertilisers was lower than that of DS. In the short term, DS proved to be the best fertiliser, while COM was the best for organic matter replenishment.

1. Introduction

The application of organic amendments to improve soil properties is a procedure widely used all over the world. One of the most common organic materials suitable for this purpose is sewage sludge. Sewage sludge utilisation has an increasing range of applications, from agriculture to energy production, building materials, and adsorbents [1,2,3,4]. The utilisation of this material as a fertiliser could reduce the volume of synthetic mineral fertiliser required [5,6]. Although sewage sludge also acts as an organic amendment, increasing the organic matter content and water capacity of the soil, it has the drawback that it may contain inorganic and organic pollutants [7,8]. Another problem is that the organic matter in sewage sludge decomposes rapidly in the soil, so both its beneficial effect on the organic matter content of the soil and its ability to supply nutrients only apply in the short term [9]. However, these barriers to application can be overcome by sludge treatment processes [10].
Composting is one of the most widely used processes for treating sewage sludge, as it is able to stabilise the organic matter and nutrient contents [11], possibly leading to a slower, more balanced nutrient supply [12]. Moreover, the co-composting of sewage sludge with green wastes or additives might moderate the environmental risks involved in its application, as composting decreases not only the number of pathogens and the concentration of certain organic contaminants, but also the plant availability of inorganic contaminants [12]. In addition, with appropriate technology, the utilisation of sewage sludge compost in agricultural fields could contribute to sustainable soil health [10].
One alternative to conventional composting is vermicomposting, during which the contribution of earthworms to decomposition aids and hastens waste stabilisation [13]. The organic matter formed during vermicomposting may be more stable, with a higher degree of humification (based on the humic acid/fulvic acid ratio) than that obtained from conventional composting, therefore having a longer-lasting effect [14,15]. However, contradictory results have been published, showing that the organic matter of vermicompost may decompose in the soil just as fast or even faster than that of compost [14,16].
It can thus be seen that the agronomic value of the original organic waste and the compost or vermicompost produced from it may be quite different. Several studies have focused on the comparison of these materials from this aspect. Based on plant biomass yield, vermicompost has been proven to be much more favourable than compost when the doses applied had the same contents of plant nutrients [17,18]. According to Kalantari et al., this is due to the more advantageous element-uptake conditions provided by vermicompost [19]. In regard to their effect on soil microbial activity, Yagi et al. found that it was more enhanced by vermicompost than by compost [20]. Choosing the appropriate dose is of key importance for both materials, as an inappropriate dosage could lead to phytotoxic effects. However, this danger was reported to be less pronounced in the case of vermicompost [21]. According to Ngo et al., vermicompost is preferable to compost due to its beneficial effect on plant growth, while having similar positive effects on the quantity and quality of soil organic matter (SOM) [14]. However, according to Tognetti et al., the more favourable effects of vermicompost compared with compost cannot be generalised, as both the composition of the material and the treatment method have a significant effect on the agronomic value of the resulting material [22].
As shown above, although numerous similar studies have been reported, no agronomic comparison between sewage sludge, as one of the most significant types of organic waste, and its compost and vermicompost has yet been carried out. For this reason, the effects of municipal sewage sludge digestate (DS) and of the compost (COM) and vermicompost (VC) derived from the same sludge were evaluated from the perspectives of soil improvement and nutrient supply on an agronomically less valuable acidic sandy soil and on a more favourable calcareous loamy soil. Their ability to improve the soil was assessed as the increase in soil organic carbon content caused by the additives by the end of the experiment, and their contribution to the nutrient supply in terms of the total and potential plant-available fractions of macronutrients in the soil, the quantity of biomass developed as the outcome of the treatments, their effectiveness as nitrogen fertilisers, and their influence on N uptake efficiency. It was hypothesised that the availability of plant nutrients (N, P, and K) and the resulting biomass would be the highest in the DS treatment, whereas the increase in soil organic matter content would be greatest in the VC treatment. It is hoped that the results will contribute to the establishment of a more appropriate strategy for the utilisation of sewage sludge digestates as fertilisers and soil amendments.

2. Materials and Methods

2.1. Experimental Setup

The effect of DS, COM, and VC on the soil pH, organic matter content, and macroelement content was studied on two soil types taken from the ploughed layer (0–20 cm) of fields at the experimental stations of the Institute for Soil Sciences and Agricultural Chemistry, Centre for Agricultural Research, Hungary. The acidic sandy soil (brown forest soil, Lamellic Arenosol) was from Nyírlugos (47°43′ N, 22°00′ E) and the calcareous loam (calcareous chernozem, Calcaric Phaeosem) was from Nagyhörcsök (46°54′ N, 18°31′ E).
Digested municipal sewage sludge was provided by Bácsvíz Zrt (a company for water and wastewater services in Kecskemét, Bács-Kiskun County, Hungary). Excess sludge removed from the sludge treatment system on-site went through a process of gravity thickening by the addition of a 0.4% polyelectrolyte solution. Sludge digestion was followed by another dewatering process using polyelectrolytes. COM was produced from DS in an industrial-scale, actively aerated, and closed-windrow system. A mixture of digestate and green waste with a volumetric ratio of 1:4 was placed in a windrow measuring 745 m3, bordered by concrete walls and covered with GORE® membrane. A 21-day actively aerated composting period with a temperature above 60 °C was followed by a 21-day maturing period without aeration. VC made from digested sewage sludge was produced via vermicomposting in beds measuring 1.2 m × 11 m × 0.4 m placed on the soil surface. In order to prevent subsequent excessive heat development and to remove toxic ammonia gas, the DS was aerated by regular turning for two weeks before the vermicomposting process started. Once the sludge properties were appropriate for the earthworms, it was treated with vermicompost tea, a solution made from worm castings. After this, 500,000 earthworms (Eisenia fetida (Savigny)) were placed in the bed. These were sifted out of the material at the end of the 8-week vermicomposting process.
In the pot experiment the amendments were applied in their original wet state at ratios of 1% and 3% m/m on 1 kg of soil, in three replicates per treatment. Before the experiment the soils were dried, ground, and passed through a 2 mm sieve. It should be noted that the doses used would be extremely high under field conditions. The mixing ratios were calculated to correspond to approximately 30 t/ha and 90 t/ha loads in the upper 20 cm ploughed layer of arable land. The total number of pots was: 2 soils × 3 amendments × 2 doses + control × 3 replicates = 54. The pots had a base area of 8 × 8 cm, a height of 12 cm, and a surface area of 10 × 10 cm. After thorough homogenisation the mixtures were wetted to 65% of maximum field capacity, placed in pots, and kept at a constant temperature of 20 °C in a dark room for two weeks. The pots were arranged in the growth chambers using a completely randomised design. After the incubation period, 1.78 g perennial ryegrass (Lolium perenne) seeds were sown in each pot, which is equal to the optimal sowing density on a 10 × 10 cm soil surface, based on the 1000-seed weight. After placing the seeds into the loosened, upper soil layer, the soil surface was compressed. A 12/12 h photoperiod and a temperature of 26/16 °C, representing day (600 μmol/m2/s photon flux density) and night phases, were applied in the growth chamber. The pots were weighed twice a week and water loss was replaced. At the end of the two-month growing period the aboveground biomass of the plants was removed and weighed. Soil and plant samples were dried and prepared for further investigations.

2.2. Chemical Analysis

The pH of soils and additives was assessed according to the ISO Standard in a 1:2.5 soil:water suspension 12 h after mixing [23]. The organic carbon (OC) content was analysed using a modified Walkley–Black method [24]. The total N contents in soil, additives, and plants were determined with the Kjeldahl method [25,26]. The NH4-N and NO3-N concentrations were measured in KCl extracts [27]. The pseudo-total P, K, Ca, and Mg concentrations of the soil and additives were determined after microwave Teflon bomb digestion with aqua regia [28]. The plant-available P and K concentrations in the soil were measured with ammonium-acetate + EDTA (AL) extract [28]. The element concentrations in the soil and additive extracts were analysed by means of ICP-AES (Jobin Yvon ULTIMA 2 sequential instrument), using Merck calibration standards and following the manufacturer’s instructions. The extract of a standard soil sample was also analysed as a quality control in each measurement session. The chemical properties of the soils and additives are presented in Table 1. The OC and element contents provided by the different doses are given in Table 2.

2.3. Data Processing and Statistical Analyses

Among the soil and plant properties measured, three parameters (residual carbon content, agronomic efficiency, and apparent nitrogen recovery efficiency) were chosen to evaluate the additives as soil ameliorants and fertilisers. The following equation was used to estimate the residual carbon content (RC) of the 3% doses of the additives [29]:
RC (%) = (OCe − OCc)/OCam × 100
where RC is the percentage OC from the additive remaining in the soil; OCe is the OC% of the soil at the end of the experiment; OCc is the OC% of the control soil; and OCam is the amount of OC added in the given treatment.
Two efficiency parameters were used to evaluate the fertiliser efficiency of the organic amendments, both calculated according to Agegnehu et al. [30]. Agronomic efficiency (AE) can be defined as the ratio of perennial ryegrass biomass increment relative to the nitrogen applied:
AE (g biomass increment/g N) = (BMt − BMc)/Na
where BMt is the biomass obtained on treated soil (g), BMc is the biomass produced on control soil (g), and Na is the amount of nitrogen applied (g).
Apparent nitrogen recovery efficiency (ARE) represents the N uptake efficiency of perennial ryegrass as a function of the nitrogen applied:
ARE (%) = (Nt − Nc)/Na × 100
where Nt is the nitrogen uptake of treated plants (g), Nc is the nitrogen uptake of control plants (g), and Na is the amount of nitrogen applied (g).
The experimental data were analysed for treatment effects using factorial analysis of variance (ANOVA) and Tukey’s post hoc test. Significant differences between the treatments were calculated at the level of p < 0.05. The number of replicates may result in some limitations in the interpretation of the data. At the same time, great care was taken to homogenise the soils and amendments used and to cultivate the plants uniformly, thus minimizing the amount of error caused by external conditions. Statistica v.13 (StatSoft Inc. Tulsa, OK, USA) software was used for all the statistical evaluations.

3. Results

3.1. Properties of the Organic Amendments

Substantial differences were detected in the concentrations of the components in COM and VC, compared both to the original material (DS) and to each other (Table 1). The percentage of OC, in line with the total N content, was the highest in DS and the lowest in COM. The ratio of inorganic nitrogen forms compared to the total N content proved to be highest in the case of COM. Regarding the mineral nitrogen forms, in DS the ratio of NH4-N to NO3-N was 90, whereas in COM and VC this value was only 16 and 1.6, respectively. As for the total P and K contents, COM contained around 50% less P and three times more K than DS and VC, the latter two having nearly the same concentration. The C/N ratio of all three materials proved to be below 10. This value was almost equal in the case of DS and VC (6.72 and 7.00, respectively), while it was higher for COM (8.72). Based on the inorganic nitrogen concentrations in the dry matter, COM could be expected to be the most effective fertiliser in the short term, followed by DS and VC (Table 2).

3.2. Soil Properties

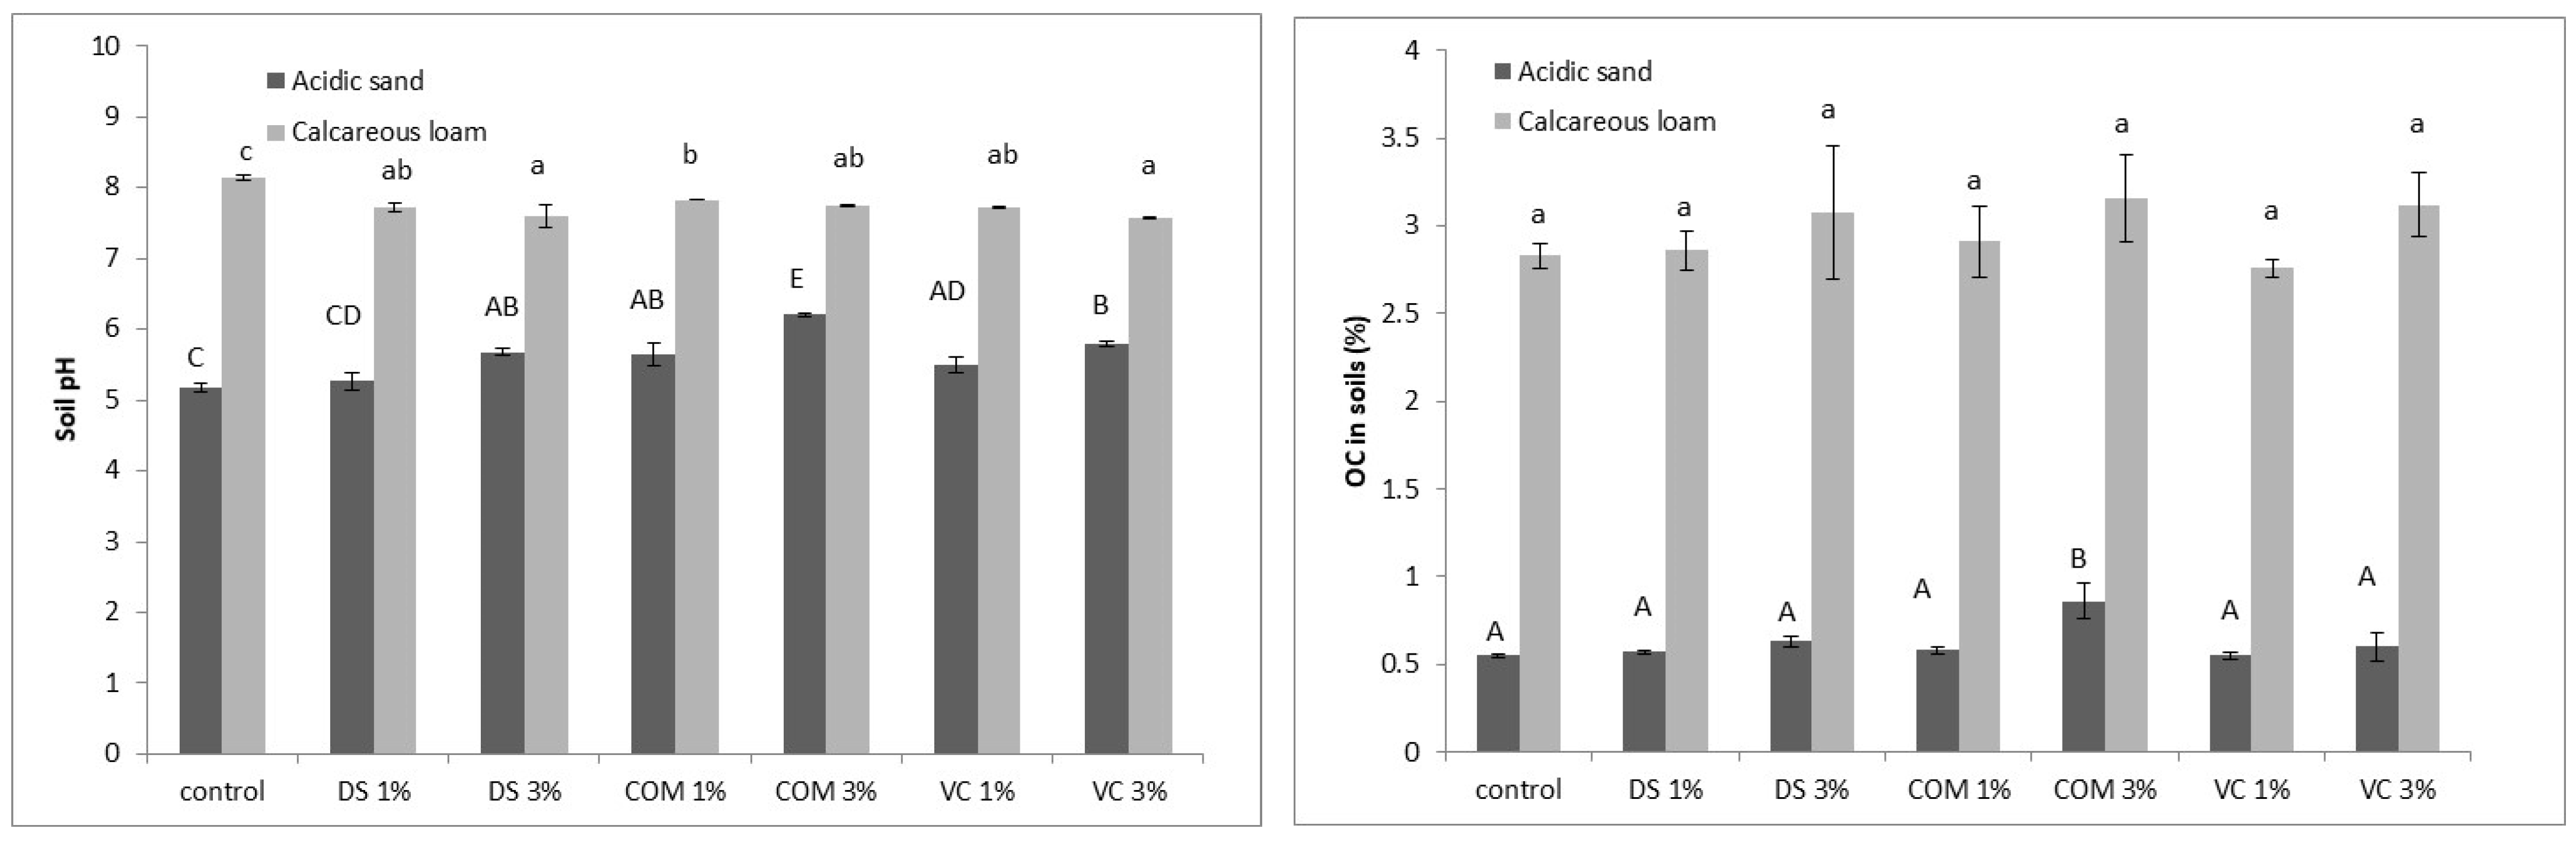
3.2.1. Changes in the pH and Organic Carbon Content of the Soils

A significant increase in pH was observed in the acidic sandy soil in all the treatments except 1% DS; the highest increase, 1 pH unit, being recorded for the 3% COM dose. In the calcareous loamy soil, although significant decreases in soil pH could be observed in all the treatments, the soil continued to be slightly alkaline (Figure 1).
There was only a significant increase in the OC content of the acidic sandy soil in the 3% COM treatment. Compared to the control soil, no significant increase in OC content could be verified statistically for the loam soil (Figure 1).
RC values were used to evaluate the effects of the 3% dose of amendments. On the acidic sandy soil, the OC increment was equal to 49%, 81%, and 24% of the amount of organic matter added with DS, COM, and VC, respectively, while on the calcareous loam these ratios were 22%, 88%, and 86%, respectively. However, despite the large discrepancies between the soils, the differences were not significant (Table 3). Based on the mean values, the mineralisation level of the organic matter was the highest in the case of DS, followed by the VC and COM treatments.

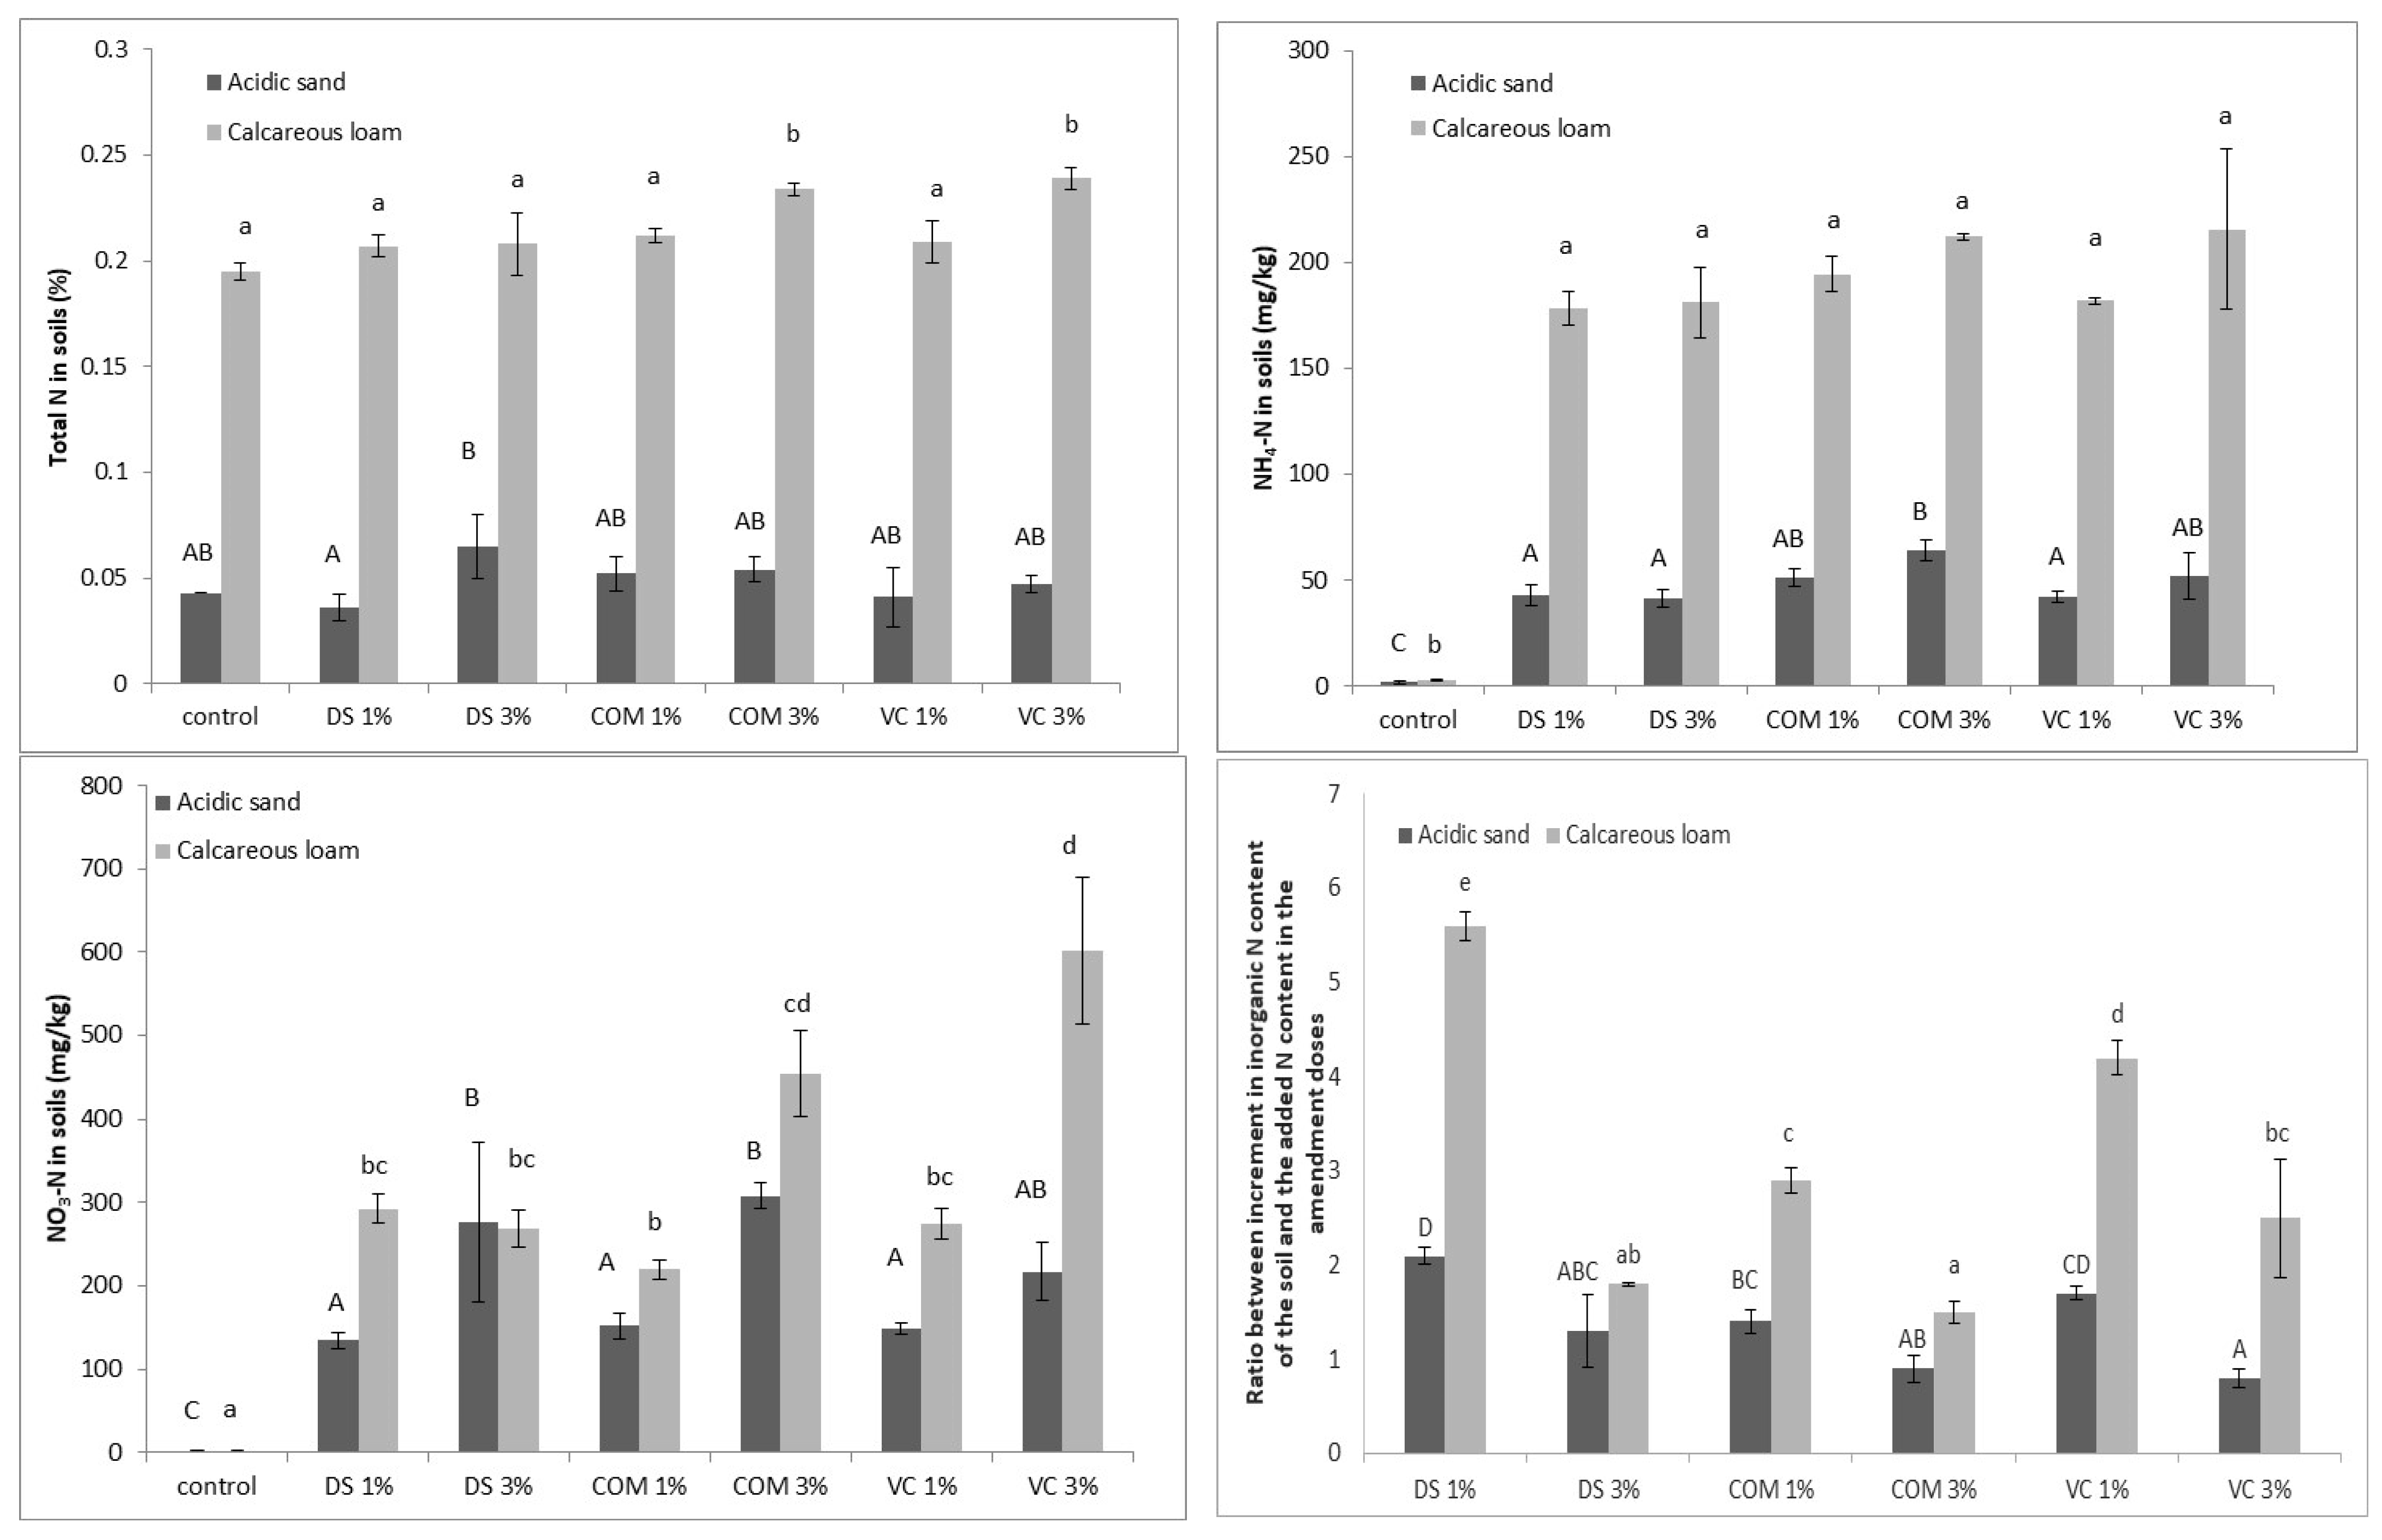
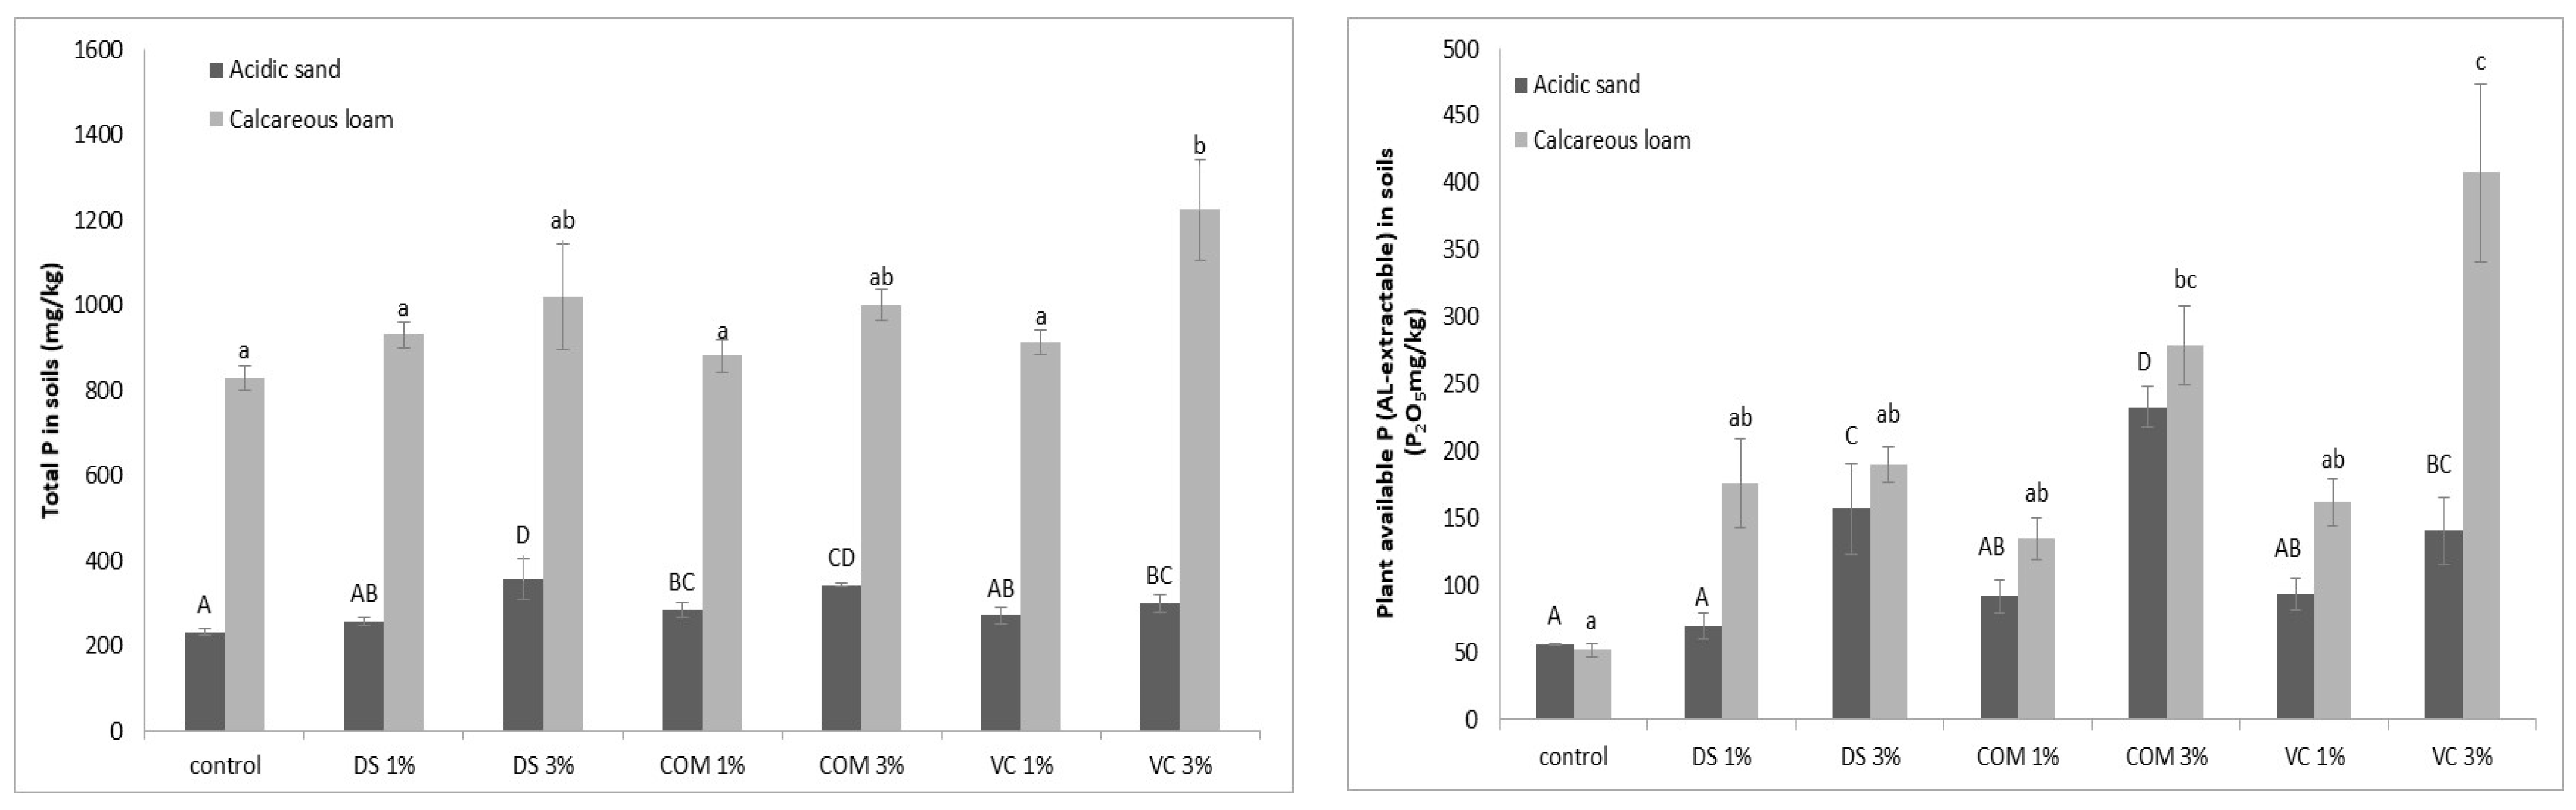
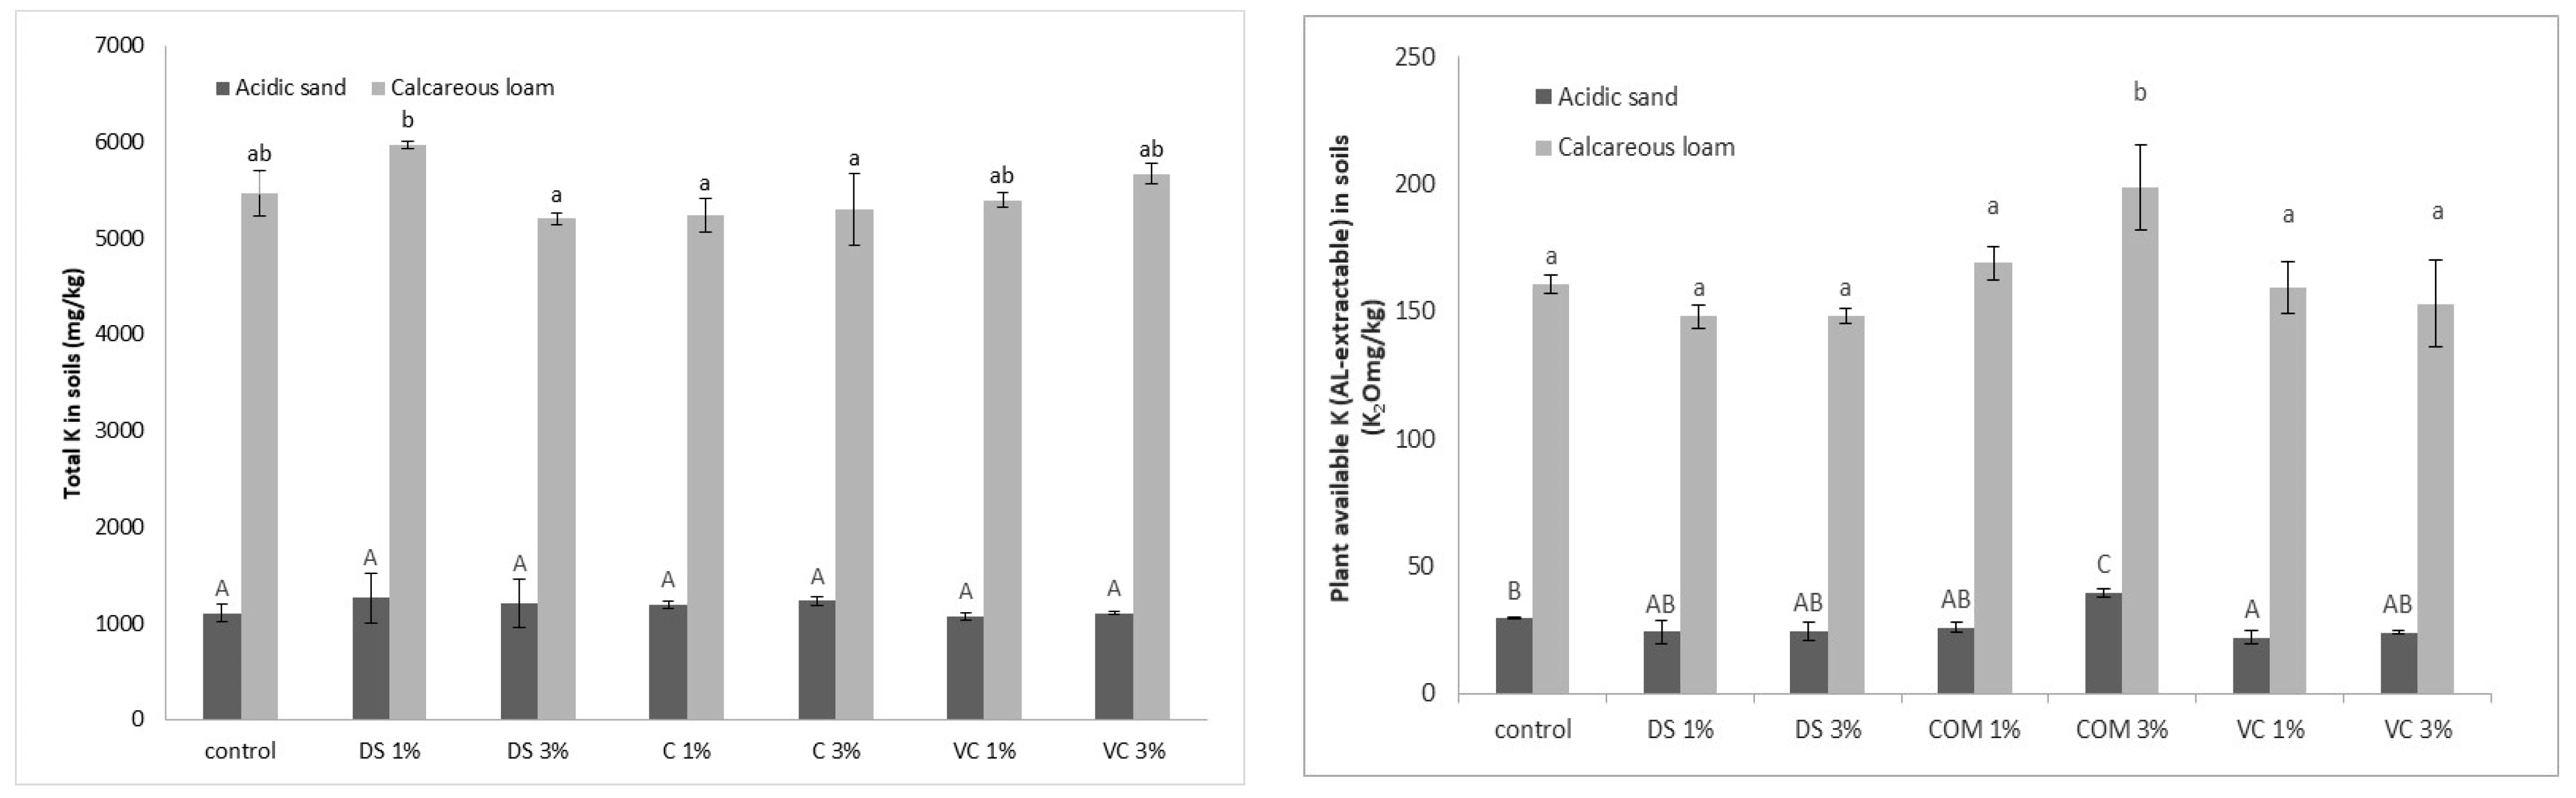
3.2.2. Macroelements (N, P, and K) in Soils

None of the treatments resulted in significant differences in the total N content of the acidic sandy soil compared to the control (Figure 2). On the calcareous loamy soil, however, both 3% COM and 3% VC produced a significant 20% increase in total N content in comparison with the control soil (Figure 2).
The NH4-N concentration was raised significantly by all the treatments on both soils, but no great differences could be detected between either the additives or the doses, with the exception of 3% COM on acidic sand. The mean NH4-N concentration increased more than 60 times compared to the control on the calcareous loam, while this increment was 25-fold on the sandy soil.
The concentration of NO3-N was also raised significantly by all the treatments compared to the control, but in this case there were also detectable differences between the treatments. With the exception of the 3% DS treatment, the NO3-N concentrations measured in the calcareous loamy soil were higher than in the acidic sand, while the control concentrations in the two soils were fairly close (2.2 and 1.3 mg/kg, respectively). The average increase in NO3-N concentration was 158-fold on acidic sand and 180-fold on calcareous loamy soil compared to the control. On calcareous loam the 3% doses of COM and VC doubled the NO3-N concentration compared with the 1% dose, while DS raised the NO3-N concentration to the same extent in both doses. On acidic sand the 3% doses of DS and COM increased the NO3-N concentration two-fold compared to the 1% dose, while this increase was only 1.5-fold for VC and could not be verified statistically.
To evaluate the materials as N sources, it is necessary to examine how the amount of N added in each treatment relates to the inorganic N (NH4-N + NO3-N) content of the soil. Except for the 3% COM and VC treatments on acidic sand, the increment in inorganic N content was higher than the total N content supplied by the amendments. Relatively, the 1% doses were found to be more effective in increasing the mineral N concentration in the soil. On acidic sand the increment in inorganic N concentration was twice as high as the total N content of the 1% DS treatment, 1.4 times more than that of the 1% COM treatment and 1.7 times more than that of the 1% VC treatment. On calcareous loam the same values were 5.5 for 1% DS, 3 for 1% COM, and 4 for the 1% VC treatment. In the case of the 3% doses, the increase in mineral N concentration did not reach twice the amount of N delivered, with the exception of the 3% VC treatment on calcareous loam (Figure 2).
Whereas the total P concentration of the calcareous loamy soil was almost four times higher in the control treatment than that of the sandy soil, the available P fraction was nearly the same in both soils (Figure 3). The total amount of P applied with the VC treatments was nearly equal to that of the COM treatments, while the P content of the DS doses was only around half as much (Table 2). The total P content in acidic sand was only enhanced considerably by the 3% doses, especially in the 3% DS and COM treatments, where the increase was nearly 50% (Figure 3). On calcareous loam, the total P content only increased significantly in the 3% VC treatment compared with the control soil.
As for the plant-available P fractions, none of the 1% doses resulted in significant changes on the two soils compared to the control. However, when the 3% doses were applied, the available P fraction increased more on calcareous loam than on acidic sand. Among the 3% treatments, the COM treatment raised the available P concentration to the greatest extent on acidic sand, but the other two amendments also increased it significantly compared with the control soil. On calcareous loam, only the 3% COM and VC treatments resulted in statistically verified, equal differences compared to the control. The plant-available P content was thus enhanced to the largest extent by COM on acidic sand and by VC and COM on calcareous loam.
The amount of K added with the amendments was negligible compared to the original K content of the soil (Figure 4). Therefore, the change in K content induced by the treatments was not significant in either of the soils compared to the control. As for the plant-available K, a significant increase was only verified in the case of the 3% COM dose on both soils.

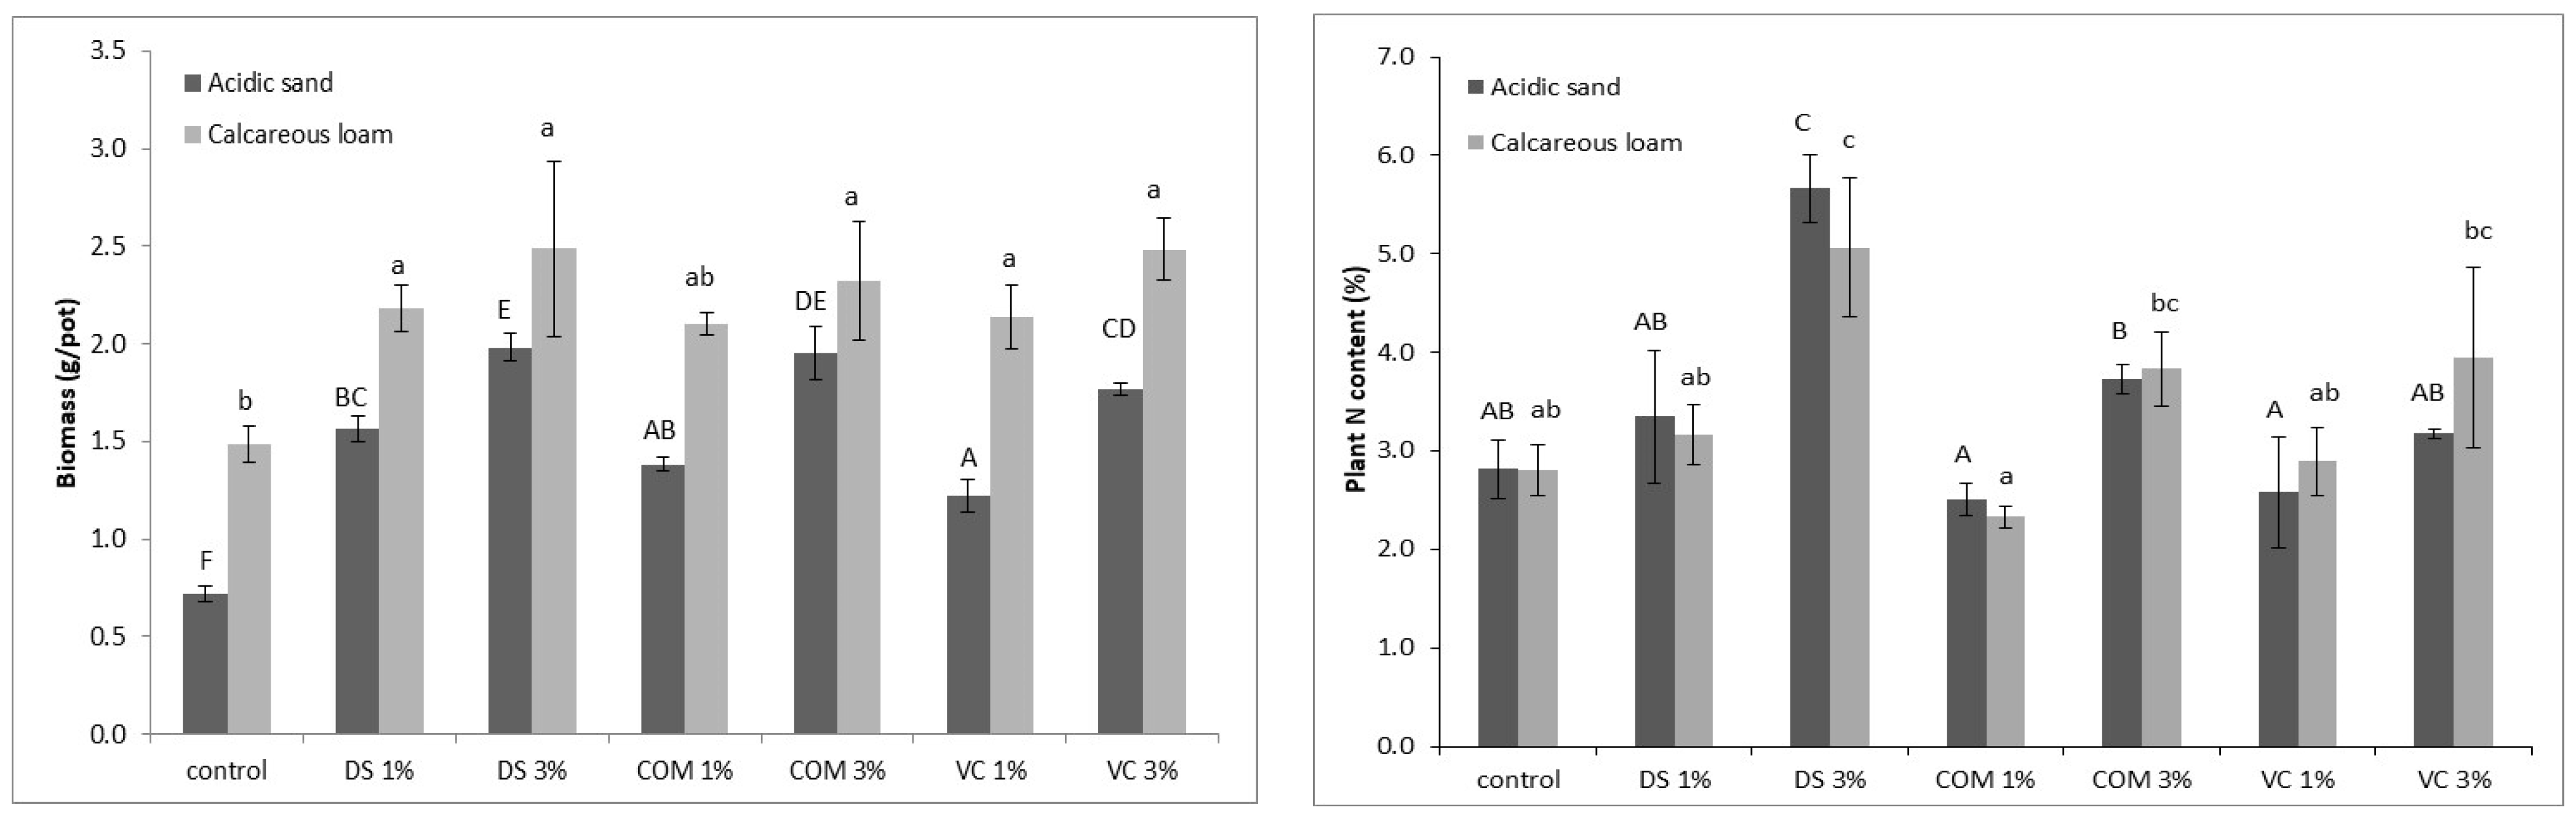
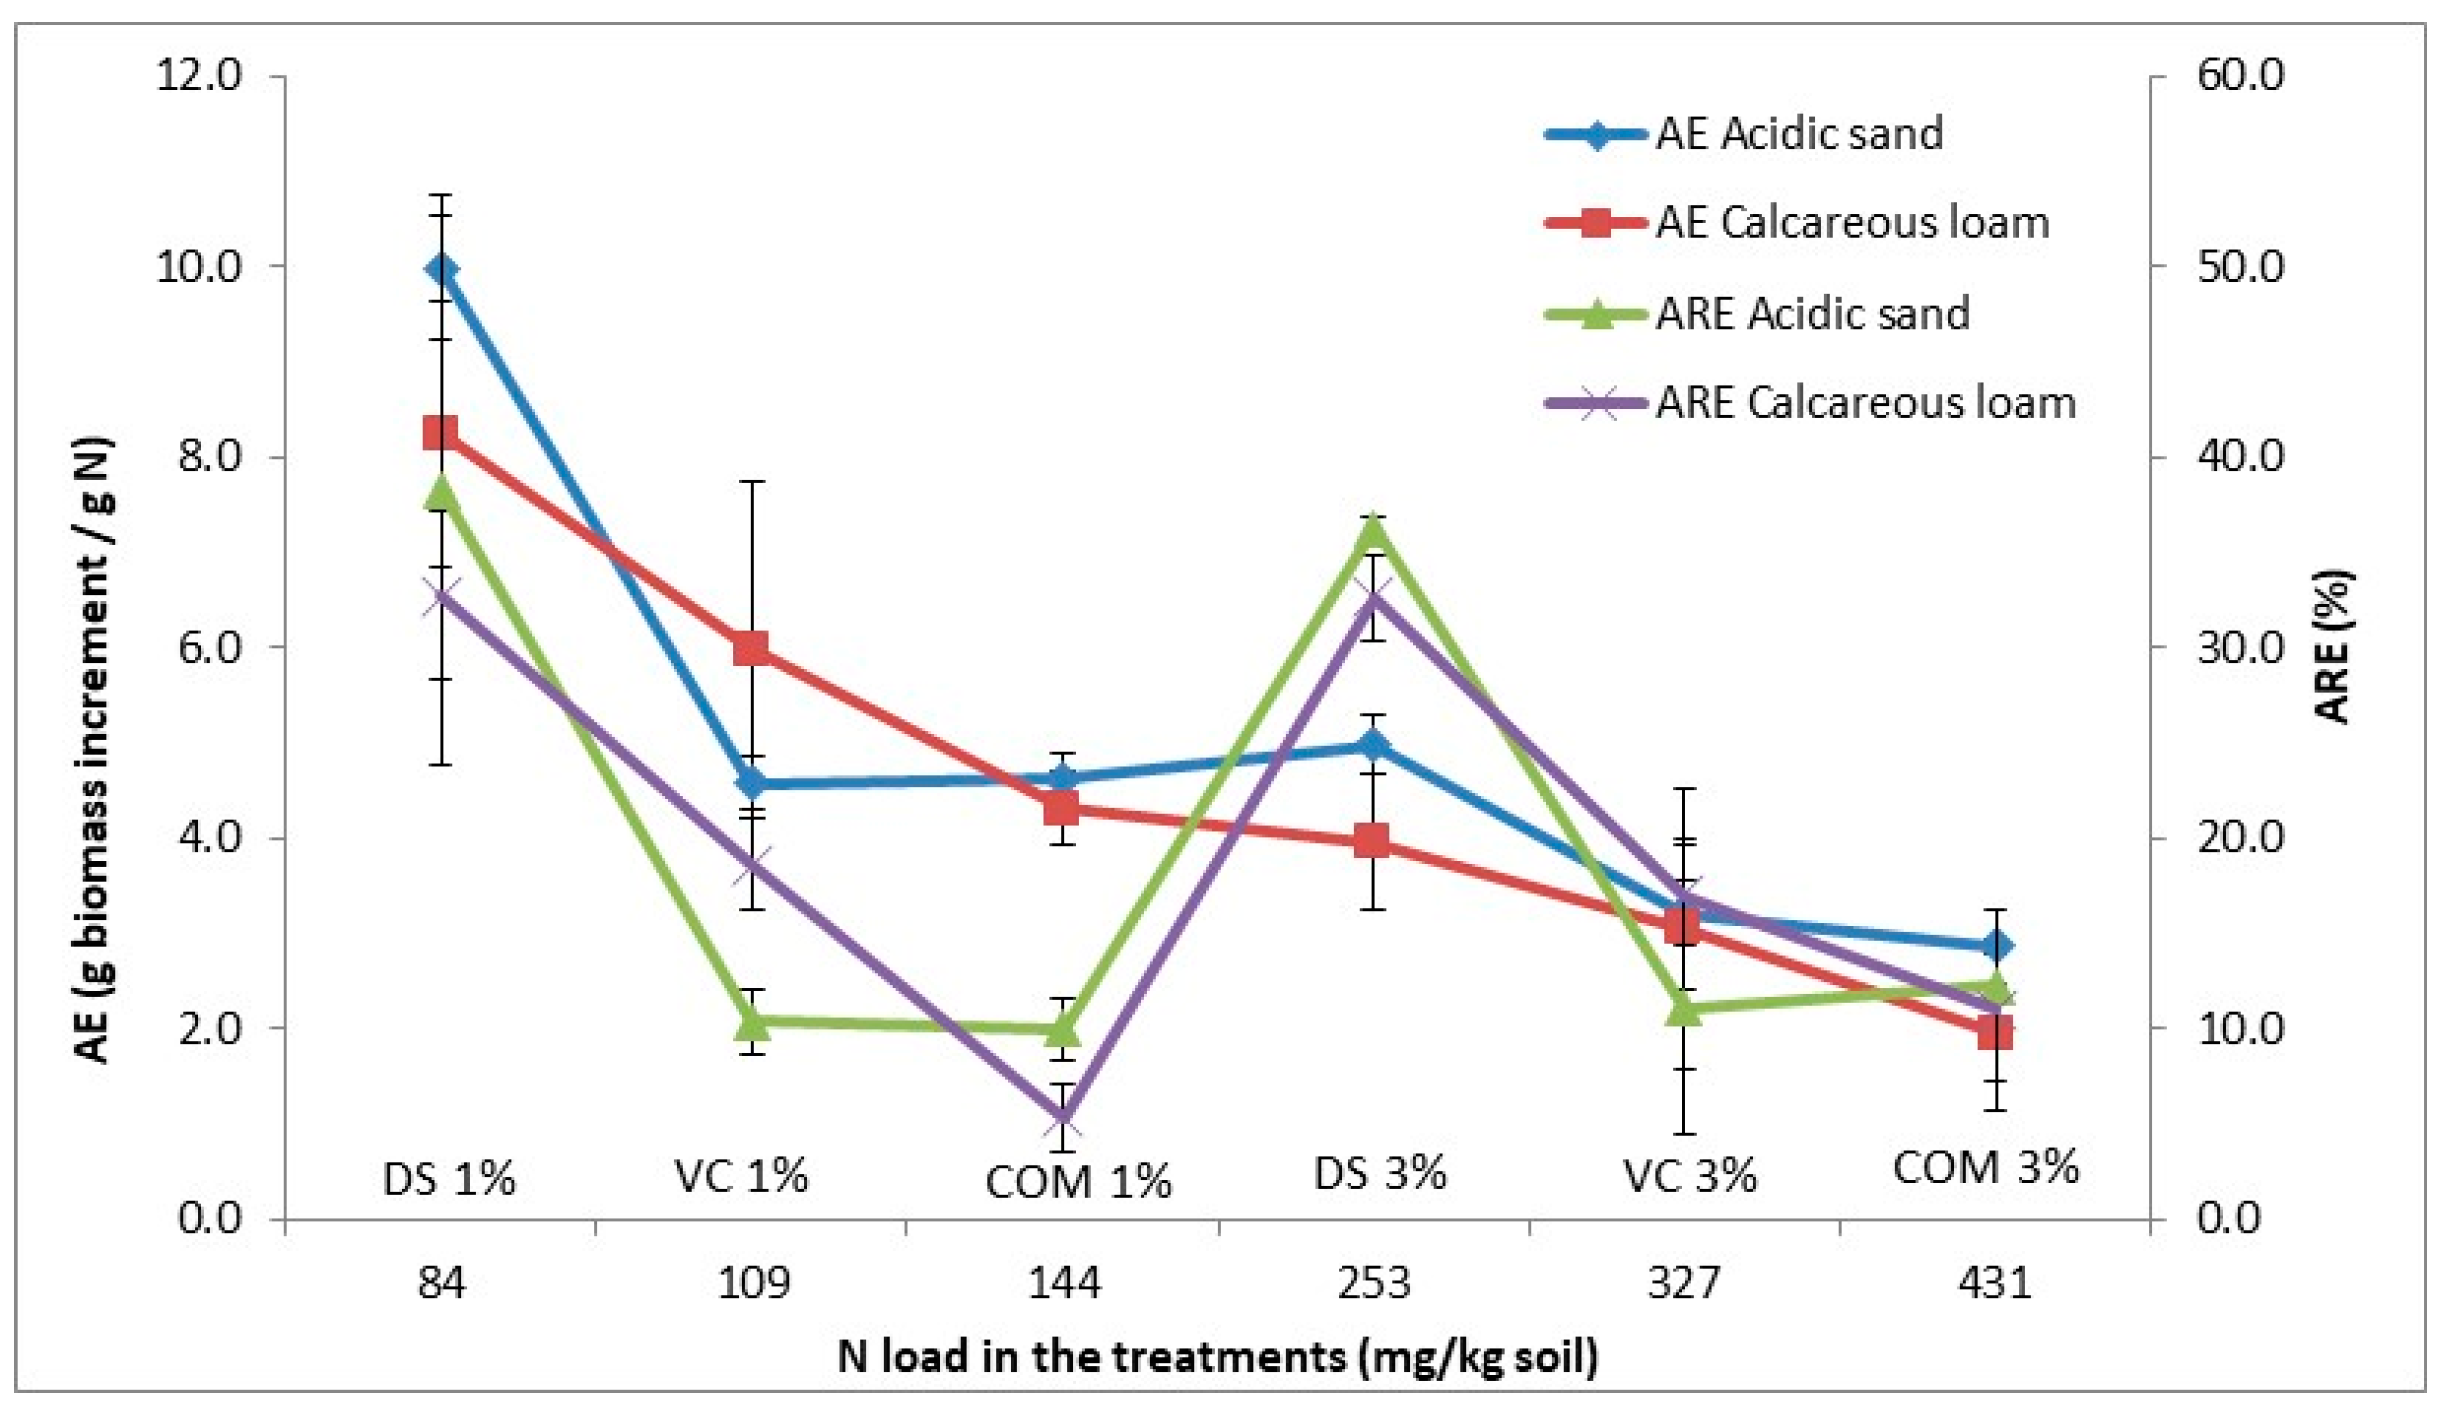
3.3. Plant Biomass and Agronomic Efficiency of Organic Amendments

On the calcareous loam the aboveground ryegrass biomass was increased significantly (1.5-fold) by all the organic amendments compared to the control, except for the 1% COM treatment (Figure 5). On acidic sand the effects of the treatments on biomass were diverse. The highest biomass increase (2.7-fold) compared with the control was observed for the 3% doses of DS and COM. The 3% VC dose caused a slightly smaller, 2.5-fold increase in the biomass of perennial ryegrass. A mean increase of nearly 40% was detected in the biomass for the 3% dose of all three amendments compared with the 1% dose. Among the 1% doses, the DS treatment was the most effective, resulting in a more than two-fold increase in the average biomass, but the 1% dose of the other two amendments gave similar results.
The effect of each treatment on the biomass can only be assessed as the amount of nutrients they deliver to the soil and the availability of these nutrients to the plants. AE and ARE values were used to evaluate the efficiency of the amendments as fertilisers. Correlation analysis showed that the nutrient most closely correlated with plant biomass was N on both soils (Table 4). Phosphorus only exhibited a correlation with biomass on acidic sand, while changes in soil K content had no significant effect on plant biomass.
The mean AE was about 10% higher on acidic sand (5.04) than on calcareous loam (4.59). The highest AE values were seen on both soils in the 1% DS treatment, which contained the lowest amount of N (Table 2). On acidic sand the 3% DS, 1% COM, and 1% VC treatments had the same AE values, though the N content in 3% DS was 2.5 times higher than in 1% VC (Figure 6). The least efficient treatment on acidic sand was 3% COM, which contained the highest amount of N. The same trends in AE values were observed on calcareous loam. The most effective material in regard to agronomic efficiency was DS, with an average AE value of 6.8, while the AE values of COM and VC were similar, being 3.4 and 4.2, respectively.
The mean ARE values were nearly the same on acidic sand and calcareous loam (19.7% and 19.6%, respectively). Compared to the decreasing trend observed as a function of N doses for the AE values, the main difference for the ARE values was the outstanding value recorded in the 3% DS treatment on both soils. Considering both the soils, not only was the average yield the highest in the 3% DS treatment, but the plants also had the highest N content (Figure 5), resulting in the highest N uptake of all the treatments.

4. Discussion

4.1. Amendment Properties

The relatively lower OC, P, and N contents and the higher K content of COM were the result of the addition of green waste [31]. Based on the NO3-N to NH4-N ratio, both composting and vermicomposting enhanced nitrification [32]. It can be assumed that the high mineral N content of COM as opposed to its total N content was caused by elevated microbial activity [22]. The total N concentration decreased slightly compared to DS due to the process of vermicomposting. This could be partly the consequence of NH3 loss during ventilation prior to vermicomposting and partly the result of NO3-N being leached into the soil. Moreover, the procedure of vermicomposting itself might contribute to N loss, depending on the quality of the materials applied [33]. It can be assumed that the main reason for the differences in the properties of COM and VC was the green waste applied prior to composting, because the nutrient content and availability of the end products of the composting and vermicomposting of DS were almost the same [34]. The low C/N ratio of all three amendments might have promoted their rapid mineralisation and mitigated N immobilisation [35]. The relatively higher C/N ratio of COM could be attributed to the presence of plant residues. Regarding the composition of organic matter, DS consists mostly of bacterial cytoplasm that can be easily decomposed, while COM and VC may contain humified organic components that are not readily decomposable [36].

4.2. Organic Carbon Content

The only treatment that proved to be efficient in increasing the OC content was the addition of 3% COM to acidic sand. This could be partly due to the high amount of organic matter present in this treatment, and partly because the mineralisation of the green waste components in COM is much slower than that of DS or VC, which contain no materials of plant origin, so the increase in OC could be more durable in the COM treatments [31].
The degradation of the organic matter added to soil is primarily influenced by the pH, texture, and moisture content of the soil. A lower pH and a finer texture may retard decomposition processes. A lower pH may weaken microbial activity, while a higher content of clay is able to protect organic compounds from decomposition by adsorption [29,37]. Based on the RC values, in the present experiment the soil texture proved to be the most decisive factor in the decomposition of organic compounds from VC and the soil pH in the decomposition of DS, while no clear distinction could be made in the case of COM decomposition. The similar RC values recorded for COM on the two soils may be traced back to the high ratio of plant material in this amendment, since, according to Scott et al., soil texture has a moderate effect on the decomposition rate of plant residues [38]. The RC values indicated that the organic matter of DS was decomposed to a lesser extent on acidic sandy soil, which is in line with the results of Hamdi et al., who reported that sewage sludge applied to sandy soil with a lower pH probably increased the organic matter content more than the same amount of sewage sludge applied on sandy loam with a higher pH [39]. Torri et al. also found that soil pH was the most decisive factor for sewage sludge decomposition in the soil, resulting in lower residual carbon values in soils with a higher pH [29]. The pH dependence of the decomposition of the organic matter in sewage sludge is presumably due to the high proportion of this substance that contains a labile organic matter fraction consisting of low-molecular-weight compounds, the solubility of which is significantly affected by pH [29,40].
Although there was no statistically verifiable difference between the RC values obtained on the two soils, the results are nevertheless worth discussing in more detail. Comparing the two processed materials, the RC values in the 3% COM and VC treatments were almost the same (88% and 84%, respectively) on loamy soil, while on sandy soil the residual carbon in the 3% COM treatment was almost four times higher than in the 3% VC treatment (83% and 22%, respectively). These results are in agreement with earlier findings where similar trends could be observed: equal decomposition rates for VC and COM on soil with 50% clay and 1.9 g/kg of OC [14], and a faster decomposition of VC than COM on soil with 10% clay and 9.87 g/kg of OC [16]. Based on these observations Ngo et al. suggested that a higher SOM content may result in VC being decomposed faster than COM [16]. However, in the present study VC decomposition was faster than that of COM in the sandy soil despite its lower SOM content, suggesting that the texture could have had a more decisive influence on the decomposition rates of the two materials, and that the OC of VC may be more prone to decomposition in coarser textured soils.

4.3. Nutrient Content

Data in the literature suggest that initial ammonification occurs within the first 15–20 days after organic materials are added to the soil, followed later by a decrease in the NH4-N concentration due to nitrification and immobilisation [41,42]. Mineralisation and immobilisation occur in the soil simultaneously, and their ratio depends on soil properties and the characteristics of the organic material added [43]. The comparable NH4-N concentrations measured in the soils in spite of dissimilarities between the treatments were possibly due to the incomplete mineralisation of the organic matter in the amendments during the experimental period. As a result, measurements carried out 75 days after application showed that the equilibrium between ammonification and nitrification/immobilisation characteristics of the given soil had been reached. The equilibrium value was thus characteristic of the soil type rather than of the quality of the materials applied.
The higher inorganic N contents in calcareous loamy soil than in acidic sandy soil after the treatments can be explained by several factors. The microbial activity of calcareous loamy soil is higher than that of acidic sand, which may cause more intense N mineralisation, resulting in higher NH4-N and NO3-N concentrations [44]. The decrease in pH as a result of the treatments may also have contributed marginally to the increased ammonification on calcareous loam, since the ammonification of organic matter incorporated into the soil increases with the acidification of the medium, but this relationship is only significant below a pH of 6 [45]. Additionally, due to the higher cation exchange capacity of the loamy soil, it can bind more NH4+ ions, which may also contribute to the higher NH4-N concentration [46]. Moreover, in terms of the nitrification process, both the pH and the microbial activity are more favourable on calcareous loam soil, which explains the higher average NO3-N concentrations [45,47].
The source of the surplus inorganic N in the soil after the treatments was the native soil N content of SOM, which may have been mineralised by micro-organisms in the priming process or, in terms of the N cycle, may have been due to a positive added nitrogen interaction. The basis for this is that the excess N added with the amendments causes a C deficiency in the soil, which is compensated for by the micro-organisms from the soil’s own OC stock [48].
The 1% doses of the amendments triggered proportionally higher rates of native soil N mineralisation. On the calcareous loamy soil there was no significant difference in the aboveground biomass produced by the 1% and 3% doses. The aboveground biomass of perennial ryegrass is directly proportional to its root biomass [49]. Plant roots play a crucial role in priming. The SOM turnover rate in the rhizosphere is 2–3 times higher than in the soil [50]. It can be assumed that the 1% and 3% doses resulted in equal quantities of root biomass on calcareous loam, so the priming effect could also be considered to be equal for the two doses. Consequently, the 1% dose was relatively more efficient in enhancing priming than the 3% dose. On the acidic sandy soil, the aboveground biomass was larger in the 3% treatments, meaning that the larger root biomass developed in these treatments caused a more intensive priming effect. Therefore, the differences observed in the ratio of added N to native soil N mineralisation between the 1% and the 3% treatments were not as pronounced as on the loamy soil.
The pH value of the calcareous loam was more favourable for P mobility, as shown by the plant-available P content of this soil [51]. On the acidic sand, the relatively low efficiency of VC in increasing the plant-available P content compared to COM can presumably be attributed to the fact that the P in this additive was still bound to the Fe and Al salts used in wastewater treatment, while in COM more P can be found in the organic fraction [52]. The release of P is inhibited by the low solubility of these salts, especially in acidic soils [53].
An increase in the plant-available K concentration was only observed in the case of the 3% COM treatment. This might be because, firstly, the largest K load was applied in this treatment and secondly, because the plant residues in COM contained a significant amount of readily released K [54,55].

4.4. Plant Biomass and Agronomic Efficiency

The positive effect of the amendments on biomass growth was not unexpected, as the doses were high enough to supply a significant quantity of nutrients, but were below the level where sewage-sludge-based materials have a detrimental effect on the growth of perennial ryegrass [22,56].
The higher AE values obtained on acidic sand were in accordance with the findings of Agegnehu et al., who reported that, on soil with lower control yields, the efficiency of N fertilisation was higher [30]. Increasing N doses are usually accompanied by a decrease in AE [30,57]. Low AE values may also indicate an environmental risk, since a low N utilisation rate may lead to N loss and potential NO3-N contamination of the groundwater [58]. The higher AE of DS is no doubt the consequence of the intensive priming effect of this material (Figure 2). There were no significant differences in the AE values for the same doses of VC and COM, which contradicts the results of Doan et al., who found that VC made from buffalo manure resulted in greater plant biomass than conventional compost produced from the same material [17]. The AE values observed in the experiment can generally be said to be low, no doubt due to the high nitrogen doses applied. [30].
The ARE values in the DS treatments (35% on average) were close to the values obtained by Cookson et al. under field conditions using mineral fertiliser, with perennial ryegrass as the test plant (43% on average) [59]. The outstanding ARE values in the 1% DS treatment can be explained by the priming effect, but in the case of 3% DS it can be hypothesised that the nutrient availability and balance were the most favourable in this treatment, resulting in more efficient N uptake [30].

5. Conclusions

Composting and vermicomposting significantly lowered the NH4-N/NO3-N ratio of DS. Due to the presence of green waste, COM contained around 50% less P and three times more K than DS and VC. The ratio of inorganic N forms compared to total N was the highest in COM.
The mineralisation of VC organic matter took place faster than that of COM in the acidic sandy soil, while the degradation rates of these two materials were the same in calcareous loam. This difference might be due to the texture of the soils.
Each amendment improved the nutrient content in both soils. The additives induced significant N mineralisation in both soils, with the result that the inorganic N content was higher than the total N content of the amendments. This effect was more pronounced in the case of DS and on calcareous loamy soil, probably due to the more intensive microbial activity in this soil.
With regard to agronomic efficiency, the most effective material was DS in this short-term experiment. Its AE value was twice as high as that of COM and 50% higher than that of VC.
Based on the results obtained in this limited assessment, COM proved to be the best amendment, since its OC content was the most recalcitrant of all the materials investigated, probably due to the addition of green waste. However, the efficiency of COM as a fertiliser was the same as that of VC, and both materials were less effective than DS from this point of view.

Author Contributions

Conceptualisation, N.U. and M.R.; methodology, N.U., M.R. and I.P.; validation, N.U. and M.R.; formal analysis, N.U.; investigation, N.U., M.R. and E.D.; resources, N.U.; data curation, N.U.; writing—original draft preparation, N.U. and M.R.; writing—review and editing, O.S., N.S.-V., D.B.S. and Z.L.; visualisation, E.D. and M.R.; supervision, N.U. and M.R.; project administration, N.U.; funding acquisition, N.U. All authors have read and agreed to the published version of the manuscript.

Funding

The work was financed by the Hungarian Ministry of Agriculture (AKGF/10/2021_10) and by the WALUE—Waste to Value—GINOP-2.2.1-15-2017-00080 as well as 2018-2.1.12-TÉT-HR-2018-00006 project.

Data Availability Statement

The raw data supporting the conclusions of this article will be made available by the authors, without undue reservation.

Conflicts of Interest

The authors declare that there is no conflict of interest.

References

  1. Świerczek, L.; Cieślik, B.M.; Konieczka, P. The potential of raw sewage sludge in construction industry—A review. J. Clean. Prod. 2018, 200, 342–356. [Google Scholar] [CrossRef]
  2. Teoh, S.K.; Li, L.Y. Feasibility of alternative sewage sludge treatment methods from a lifecycle assessment (LCA) perspective. J. Clean. Prod. 2020, 247, 119495. [Google Scholar] [CrossRef]
  3. Zaharioiu, A.; Bucura, F.; Ionete, E.I.; Ionete, R.E.; Ebrasu, D.; Sandru, C.; Marin, F.; Oancea, S.; Niculescu, V.; Miricioiu, M.G.; et al. Thermochemical decomposition of sewage sludge—An eco-friendly solution for a sustainable energy future by using wastes. Rev. Chim. 2020, 71, 171–181. [Google Scholar] [CrossRef]
  4. Miricioiu, M.G.; Zaharioiu, A.; Oancea, S.; Bucura, F.; Raboaca, M.S.; Filote, C.; Ionete, R.E.; Niculescu, V.C.; Constantinescu, M. Sewage sludge derived materials for CO2 adsorption. Appl. Sci. 2021, 11, 7139. [Google Scholar] [CrossRef]
  5. Elsalam, H.E.A.; El- Sharnouby, M.E.; Mohamed, A.E.; Raafat, B.M.; El-Gamal, E.H. Effect of Sewage Sludge Compost Usage on Corn and Faba Bean Growth, Carbon and Nitrogen Forms in Plants and Soil. Agronomy 2021, 11, 628. [Google Scholar] [CrossRef]
  6. Singh, R.P.; Agrawal, M. Potential benefits and risks of land application of sewage sludge. Waste Manag. 2008, 28, 347–358. [Google Scholar] [CrossRef] [PubMed]
  7. Seleiman, M.F.; Santanen, A.; Mäkelä, P.S. Recycling sludge on cropland as fertilizer–Advantages and risks. Resour. Conserv. Recycl. 2020, 155, 104647. [Google Scholar] [CrossRef]
  8. Urra, J.; Alkorta, I.; Garbisu, C. Potential Benefits and Risks for Soil Health Derived From the Use of Organic Amendments in Agriculture. Agronomy 2019, 9, 542. [Google Scholar] [CrossRef] [Green Version]
  9. Ajwa, H.A.; Tabatabai, M.A. Decomposition of different organic materials in soils. Biol. Fert. Soils 1994, 18, 175–182. [Google Scholar] [CrossRef]
  10. Bernal, M.P.; Navarro, A.F.; Sanchez-Monedero, M.A.; Roig, A.; Cegarra, J. Influence of sewage sludge compost stability and maturity on carbon and nitrogen mineralization in soil. Soil Biol. Biochem. 1998, 30, 305–313. [Google Scholar] [CrossRef]
  11. Lim, S.L.; Lee, L.H.; Wu, T.Y. Sustainability of using composting and vermicomposting technologies for organic solid waste biotransformation: Recent overview, greenhouse gases emissions and economic analysis. J. Clean. Prod. 2016, 111, 262–278. [Google Scholar] [CrossRef]
  12. Song, U.; Lee, E.J. Environmental and economical assessment of sewage sludge compost application on soil and plants in a landfill. Resour. Conserv. Recycl. 2010, 54, 1109–1116. [Google Scholar] [CrossRef]
  13. Garg, P.; Gupta, A.; Satya, S. Vermicomposting of different types of waste using Eisenia foetida: A comparative study. Bioresour. Technol. 2006, 97, 391–395. [Google Scholar] [CrossRef] [PubMed]
  14. Ngo, P.T.; Rumpel, C.; Dignac, M.F.; Billou, D.; Duc, T.T.; Jouquet, P. Transformation of buffalo manure by composting or vermicomposting to rehabilitate degraded tropical soils. Ecol. Eng. 2011, 37, 269–276. [Google Scholar] [CrossRef]
  15. Fornes, F.; Mendoza-Hernández, D.; García-de-la-Fuente, R.; Abad, M.; Belda, R.M. Composting versus vermicomposting: A comparative study of organic matter evolution through straight and combined processes. Bioresour. Technol. 2012, 118, 296–305. [Google Scholar] [CrossRef] [PubMed]
  16. Ngo, P.T.; Rumpel, C.; Doan, T.T.; Jouquet, P. The effect of earthworms on carbon storage and soil organic matter composition in tropical soil amended with compost and vermicompost. Soil Biol. Biochem. 2012, 50, 214–220. [Google Scholar] [CrossRef]
  17. Doan, T.T.; Ngo, P.T.; Rumpel, C.; Nguyen, B.V.; Jouquet, P. Interactions between compost, vermicompost and earthworms influence plant growth and yield: A one-year greenhouse experiment. Sci. Hortic. 2013, 160, 148–154. [Google Scholar] [CrossRef]
  18. Ievinsh, G.; Andersone-Ozola, U.; Zeipiņa, S. Comparison of the effects of compost and vermicompost soil amendments in organic production of four herb species. Biol. Agric. Hortic. 2020, 36, 267–282. [Google Scholar] [CrossRef]
  19. Kalantari, S.; Ardalan, M.M.; Alikhani, H.A.; Shorafa, M. Comparison of compost and vermicompost of yard leaf manure and inorganic fertilizer on yield of corn. Commun. Soil Sci. Plant Anal. 2010, 42, 123–131. [Google Scholar] [CrossRef]
  20. Yagi, R.; Ferreira, M.E.; Cruz, M.C.P.D.; Barbosa, J.C. Organic matter fractions and soil fertility under the influence of liming, vermicompost and cattle manure. Sci. Agric. 2003, 60, 549–557. [Google Scholar] [CrossRef]
  21. Belda, R.M.; Mendoza-Hernández, D.; Fornes, F. Nutrient-rich compost versus nutrient-poor vermicompost as growth media for ornamental-plant production. J. Plant Nutr. Soil Sci. 2013, 176, 827–835. [Google Scholar] [CrossRef]
  22. Tognetti, C.; Laos, F.; Mazzarino, M.J.; Hernández, M.T. Composting vs. vermicomposting: A comparison of end product quality. Compost Sci. Util. 2005, 13, 6–13. [Google Scholar] [CrossRef]
  23. ISO 10390:2005 Soil Quality–Determination of pH; International Organization for Standardization: Geneva, Switzerland, 2005.
  24. MSZ-08-0452:1980 Use of High-Capacity Analyser Systems for Soils Analyses. Quantitative Determination of the Organic Carbon Content of the Soil on Contiflo Analyzer System; Hungarian Standard Association: Budapest, Hungary, 1980. (In Hungarian) [Google Scholar]
  25. ISO 11261:1995. Soil Quality—Determination of Total Nitrogen—Modified Kjeldahl Method; International Organization for Standardization: Geneva, Switzerland, 1995.
  26. MSZ EN ISO 5983-2:2009 Animal Feeding Stuffs. Determination of Nitrogen Content and Calculation of Crude Protein Content. Part 2: Block Digestion and Steam Distillation Method; Hungarian Standard Association: Budapest, Hungary, 2009. (In Hungarian)
  27. MSZ 20135:1999. Determination of the Soluble Nutrient Element Content of the Soil; Hungarian Standard Association: Budapest, Hungary, 1999. (In Hungarian)
  28. MSZ 21470-50:2006. Environmental Testing of Soils. Determination of Total and Soluble Toxic Element, Heavy Metal and Chromium (VI) Content; Hungarian Standard Association: Budapest, Hungary, 2006. (In Hungarian)
  29. Torri, S.; Alvarez, R.; Lavado, R. Mineralization of carbon from sewage sludge in three soils of the Argentine Pampas. Commun. Soil Sci. Plant Anal. 2003, 34, 2035–2043. [Google Scholar] [CrossRef]
  30. Agegnehu, G.; Nelson, P.N.; Bird, M.I. The effects of biochar, compost and their mixture and nitrogen fertilizer on yield and nitrogen use efficiency of barley grown on a Nitisol in the highlands of Ethiopia. Sci. Total Environ. 2016, 569–570, 869–879. [Google Scholar] [CrossRef]
  31. Doublet, J.; Francou, C.; Poitrenaud, M.; Houot, S. Influence of bulking agents on organic matter evolution during sewage sludge composting; consequences on compost organic matter stability and N availability. Bioresour. Technol. 2011, 102, 1298–1307. [Google Scholar] [CrossRef] [PubMed]
  32. Lv, B.; Zhang, D.; Cui, Y.; Yin, F. Effects of C/N ratio and earthworms on greenhouse gas emissions during vermicomposting of sewage sludge. Bioresour. Technol. 2018, 268, 408–414. [Google Scholar] [CrossRef]
  33. Gupta, R.; Garg, V.K. Stabilization of primary sewage sludge during vermicomposting. J. Hazard. Mater. 2008, 153, 1023–1030. [Google Scholar] [CrossRef]
  34. Rékási, M.; Mazsu, N.; Draskovits, E.; Bernhardt, B.; Szabó, A.; Rivier, P.A.; Farkas, C.; Borsányi, B.; Pirkó, B.; Molnár, S.; et al. Comparing the agrochemical properties of compost and vermicomposts produced from municipal sewage sludge digestate. Bioresour. Technol. 2019, 291, 121861. [Google Scholar] [CrossRef]
  35. Qiu, S.; McComb, A.J.; Bell, R.W. Ratios of C, N and P in soil water direct microbial immobilisation–mineralisation and N availability in nutrient amended sandy soils in southwestern Australia. Agric. Ecosyst. Environ. 2008, 127, 93–99. [Google Scholar] [CrossRef]
  36. Correa, R.S.; White, R.E.; Weatherley, A.J. Effect of compost treatment of sewage sludge on nitrogen behavior in two soils. Waste Manag. 2006, 26, 614–619. [Google Scholar] [CrossRef] [PubMed]
  37. Merckx, R.; den Hartog, A.; van Veen, J.A. Turnover of root derived material and related microbial biomass formation in soils of different texture. Soil Biol. Biochem. 1985, 17, 565–569. [Google Scholar] [CrossRef]
  38. Scott, N.A.; Cole, C.V.; Elliott, E.T.; Huffman, S.A. Soil Textural Control on Decomposition and Soil Organic Matter Dynamics. Soil Sci. Soc. Am. J. 1996, 60, 1102–1109. [Google Scholar] [CrossRef]
  39. Hamdi, H.; Hechmi, S.; Khelil, M.N.; Zoghlami, I.R.; Benzarti, S.; Mokni-Tlili, S.; Hassen, A.; Jedidi, N. Repetitive land application of urban sewage sludge: Effect of amendment rates and soil texture on fertility and degradation parameters. CATENA 2019, 172, 11–20. [Google Scholar] [CrossRef]
  40. Carabassa, V.; Ortiz, O.; Alcañiz, J.M. Sewage sludge as an organic amendment for quarry restoration: Effects on soil and vegetation. Land Degrad. Dev. 2018, 29, 2568–2574. [Google Scholar] [CrossRef]
  41. Huang, C.C.; Chen, Z.S. Carbon and nitrogen mineralization of sewage sludge compost in soils with a different initial pH. Soil Sci. Plant Nutr. 2009, 55, 715–724. [Google Scholar] [CrossRef]
  42. Khalil, M.I.; Hossain, M.B.; Schmidhalter, U.S. Carbon and nitrogen mineralization in different upland soils of the subtropics treated with organic materials. Soil Biol. Biochem. 2005, 37, 1507–1518. [Google Scholar] [CrossRef]
  43. Nugroho, S.G.; Kuwatsuka, S. Concurrent observation of several processes of nitrogen metabolism in soil amended with organic materials. Soil Sci. Plant Nutr. 1990, 36, 215–224. [Google Scholar] [CrossRef]
  44. Szili-Kovács, T.; Zsuposné Oláh, Á.; Kátai, J.; Villányi, I.; Takács, T. Talajbiológiai és talajkémiai változók közötti összefüggések néhány tartamkísérlet talajában. Agrok. Talajt. 2009, 58, 309–324. [Google Scholar] [CrossRef]
  45. Pietri, J.A.; Brookes, P.C. Nitrogen mineralisation along a pH gradient of a silty loam UK soil. Soil Biol. Biochem. 2008, 40, 797–802. [Google Scholar] [CrossRef]
  46. Amlinger, I.; Götz, B.; Dreher, P.; Geszti, J.; Weissteiner, C. Nitrogen in biowaste and yard waste compost: Dynamics of mobilisation and availability—a review. Eur. J. Soil Biol. 2003, 39, 107–116. [Google Scholar] [CrossRef]
  47. Pedra, F.; Polo, A.; Ribeiro, A.; Domingues, H. Effects of municipal solid waste compost and sewage sludge on mineralization of soil organic matter. Soil Biol. Biochem. 2007, 39, 1375–1382. [Google Scholar] [CrossRef]
  48. Liu, X.-J.A.; van Groenigen, K.J.; Dijkstra, P.; Hungate, B.A. Increased plant uptake of native soil nitrogen following fertilizer addition—Not a priming effect? Appl. Soil Ecol. 2017, 114, 105–110. [Google Scholar] [CrossRef]
  49. Bai, Y.C.; Gu, C.H.; Tao, T.Y.; Wang, L.; Feng, K.; Shan, Y.H. Growth characteristics, nutrient uptake, and metal accumulation of ryegrass (Lolium perenne L.) in sludge-amended mudflats. Acta Agric. Scand. 2013, 63, 352–359. [Google Scholar]
  50. Kuzyakov, Y. Priming effects: Interactions between living and dead organic matter. Soil Biol. Biochem. 2010, 42, 1363–1371. [Google Scholar] [CrossRef]
  51. Penn, C.J.; Camberato, J.J. A critical review on soil chemical processes that control how soil pH affects phosphorus availability to plants. Agriculture 2019, 9, 120. [Google Scholar] [CrossRef] [Green Version]
  52. Kahiluoto, H.; Kuisma, M.; Ketoja, E.; Salo, T.; Heikkinen, J. Phosphorus in manure and sewage sludge more recyclable than in soluble inorganic fertilizer. Environ. Sci. Technol. 2015, 49, 2115–2122. [Google Scholar] [CrossRef] [Green Version]
  53. Sims, J.T.; Pierzynski, G.M. Chemistry of phosphorus in soils. In Chemical Processes in Soils, 1st ed.; Tabatabai, M.A., Sparks, D.L., Eds.; Soil Science Society of America Inc.: Madison, WI, USA, 2005; Volume 8, pp. 151–186. [Google Scholar]
  54. Nieves-Cordones, M.; Al Shiblawi, F.R.; Sentenac, H. Roles and transport of sodium and potassium in plants. In The Alkali Metal Ions: Their Role for Life; Sigel, A., Sigel, H., Sigel, R., Eds.; Springer: Cham, Switzerland, 2016; pp. 291–324. [Google Scholar]
  55. Timmermann, F.; Kluge, R.; Bolduan, R.; Mokry, M.; Janning, S.; Grosskopf, W.; Schreiber, A.; Ziegler, W.; Koscielniak, N. Nachhaltige Kompostverwertung in der Landwirtschaft. In Praxisbzogene Anwendungsrichtlinien sowie Vermarktungskonzepte für den nachhaltigen Einsatz von gütegesicherten Komposten imlandwirtschaftlichen Pflanzenbau; DBU Abschlussbericht zum Verbundforschungsprojekt Hrsg: Leonberg, Germany, 2003. [Google Scholar]
  56. Cheng, H.; Xu, W.; Liu, J.; Zhao, Q.; He, Y.; Chen, G. Application of composted sewage sludge (CSS) as a soil amendment for turfgrass growth. Ecol. Eng. 2007, 29, 96–104. [Google Scholar] [CrossRef]
  57. Limon-Ortega, A.; Sayre, K.D.; Francis, C.A. Wheat nitrogen use efficiency in a bed planting system in Northwest Mexico. Agron. J. 2000, 92, 303–308. [Google Scholar] [CrossRef]
  58. Koós, S.; Pirkó, B.; Szatmári, G.; Csathó, P.; Magyar, M.; Szabó, J.; Fodor, N.; Pásztor, L.; Laborczi, A.; Pokovai, K.; et al. Influence of the Shortening of the Winter Fertilization Prohibition Period in Hungary Assessed by Spatial Crop Simulation Analysis. Sustainability 2021, 13, 417. [Google Scholar] [CrossRef]
  59. Cookson, W.R.; Rowarth, J.S.; Cameron, K.C. The response of a perennial ryegrass (Lolium perenne L.) seed crop to nitrogen fertilizer application in the absence of moisture stress. Grass Forage Sci. 2000, 55, 314–325. [Google Scholar] [CrossRef]
Figure 1. Changes in soil pH and organic carbon content (OC) 75 days after the application of digested sludge (DS), digested sludge compost (COM) and digested sludge vermicompost (VC) in 1% and 3% doses. Error bars represent the standard deviation (SD) of the mean with 3 replicates. Uppercase letters indicate significant differences between treatments on acidic sand and lowercase letters significant differences between treatments on calcareous loam (p < 0.05).
Agronomy 11 02249 g001
Figure 2. Changes in the concentration of total N, NH4-N, and NO3-N, as well as the ratio of the increment in the inorganic N (NH4-N + NO3-N) content of the soil to the N added with the amendments 75 days after the application of digested sludge (DS), digested sludge compost (COM), and digested sludge vermicompost (VC) in 1% and 3% doses. Error bars represent the standard deviation (SD) of the mean with 3 replicates. Uppercase letters indicate significant differences between treatments on acidic sand and lowercase letters indicate significant differences between treatments on calcareous loam (p < 0.05).
Agronomy 11 02249 g002
Figure 3. Changes in the concentration of total and plant-available P in the soil 75 days after the application of digested sludge (DS), digested sludge compost (COM), and digested sludge vermicompost (VC) in 1% and 3% doses. Error bars represent the standard deviation (SD) of the mean with 3 replicates. Uppercase letters indicate significant differences between treatments on acidic sand and lowercase letters indicate significant differences between treatments on calcareous loam (p < 0.05).
Agronomy 11 02249 g003
Figure 4. Changes in the concentration of total and plant-available K in the soil 75 days after the application of digested sludge (DS), digested sludge compost (COM), and digested sludge vermicompost (VC) in 1% and 3% doses. Error bars represent the standard deviation (SD) of the mean with 3 replicates. Uppercase letters indicate significant differences between treatments on acidic sand and lowercase letters indicate significant differences between treatments on calcareous loam (p < 0.05).
Agronomy 11 02249 g004
Figure 5. Changes in the aboveground biomass and N content of perennial ryegrass two months after sowing on soils treated with digested sludge (DS), digested sludge compost (COM), and digested sludge vermicompost (VC) in 1% and 3% doses. Error bars represent the standard deviation (SD) of the mean with 3 replicates. Uppercase letters indicate significant differences between treatments on acidic sand and lowercase letters indicate significant differences between treatments on calcareous loam (p < 0.05).
Agronomy 11 02249 g005
Figure 6. Agronomic efficiency (AE) and apparent nitrogen recovery efficiency (ARE) as a function of the nitrogen loads in the digested sludge (DS), digested sludge compost (COM), and digested sludge vermicompost (VC) treatments. Error bars represent the standard deviation (SD) of the mean with 3 replicates.
Agronomy 11 02249 g006
Table 1. Chemical properties of the soils, digested sludge (DS), compost (COM), and vermicompost (VC). Values are given in terms of dry matter.
ParameterAcidic SandCalcareous LoamDSCOMVC
pH 5.188.146.847.016.77
OC%0.321.652519.121.9
Total N%0.040.23.722.193.13
C/N 88.256.728.727.00
NH4-Nmg/kg1.92322161919202
NO3-Nmg/kg0.592.2124.7121127
Total Pmg/kg23382920,60611,58224,139
Total Kmg/kg11095466129449061719
Total Camg/kg59529,71149,37245,53656,587
Total Mgmg/kg9749634553663876155
Sand % (<0.05 mm)%8517---
Silt % (0.05–0.002 mm)%1060---
Clay % (>0.002 mm)%523---
Dry matter *%--22.765.534.8
* Dried at 105 °C.
Table 2. Calculated organic carbon, total and mineral N, and pseudo-total element loads in the digested sludge (DS), compost (COM), and vermicompost (VC) treatments (mg/kg soil).
TreatmentOCNNH4-NNO3-NPKCaMg
DS 1%567845.00.056472.9411212.6
DS 3%170025315.10.1681408.8133637.7
COM 1%125214412.60.7907632.1329841.8
COM 3%375543137.72.36922896.40895125.5
VC 1%7621090.70.441845.9819721.4
VC 3%22873272.11.32325217.9559164.3
Table 3. Residual carbon content (RC, percentage of added organic carbon remaining in the soil, Equation (1)) for digested sludge (DS), digested sludge compost (COM), and digested sludge vermicompost (VC) on the two soils (%). Data are the mean ± SD of the 3 replicates. Uppercase letters indicate significant differences between columns and lowercase letters significant differences between rows (p < 0.05).
SoilsDSCOMVC
Acidic sand49 ± 18 aA81 ± 27 aA24 ± 35 aA
Calcareous loam22 ± 44 aA88 ± 67 aA86 ± 33 aA
Mean35 ± 3485 ± 4655 ± 46
Table 4. Correlation coefficients between soil nutrient contents and the aboveground biomass of perennial ryegrass on the investigated soils.
Total NInorganic NTotal PPlant-Available PTotal KPlant-Available K
Biomass on acidic sand0.491 *0.907 ***0.813 ***0.777 **NSNS
Biomass on calcareous loam0.587 **0.533 *NSNSNSNS
Significant at * p < 0.05, ** p < 0.01, *** p < 0.001; NS: not significant.
Publisher’s Note: MDPI stays neutral with regard to jurisdictional claims in published maps and institutional affiliations.

