Article

Human Waste Substitute Strategies Enhanced Crop Yield, Crop Quality, and Soil Fertility in Vegetable Cultivation Soils in North China

Agro-Environmental Protection Institute, Ministry of Agriculture and Rural Affairs, Tianjin 300191, China
*
Author to whom correspondence should be addressed.
Agronomy 2021, 11(11), 2232; https://doi.org/10.3390/agronomy11112232
Submission received: 14 October 2021 / Revised: 30 October 2021 / Accepted: 30 October 2021 / Published: 4 November 2021

Abstract

:
Replacing chemical fertilizers with human waste for vegetable planting is a traditional, economical, and environmentally friendly waste resource utilization strategy. However, whether the human waste substitute strategy can improve soil fertility and increase crop yield and quality compared to the simple application of chemical fertilizers is still unclear, especially under acidic and alkaline soil conditions. In this study, we studied the effects of different ratios of human waste (urine and feces) to chemical fertilizer on the crop yield, crop quality, soil fertility, and soil chemical parameters in alkaline Cambisols and acidic Alisols cultivated with water spinach (Ipomoea aquatica Forssk.). The application variants of human waste and chemical fertilizer were as follows: (i) Control, no fertilization (CK), (ii) human waste application (HW), (iii) chemical fertilizer application (CF), (iv) 1/3 human waste to chemical fertilizer (P1), and (v) 2/3 human waste to chemical fertilizer (P2). Human waste application increased the total nitrogen, available phosphorus, available potassium, organic matter, NO3-N, and conductivity in soil, enhanced soil enzyme activity, slowed down soil acidification, and increased the yield, soluble sugar, and vitamin C contents of the water spinach while reducing its nitrate content. Our findings indicate that human waste substitution improved soil fertility while reducing the potential risks of soil acidification, salinization, and human exposure to nitrates. These findings may be applied to increase vegetable production and quality, improve the soil environment, and increase the utilization of human waste as a valuable resource.

Graphical Abstract

Highlights:
The application of human waste increased the available nutrients in the soil.
The application of human waste reduced soil acidification and secondary salinization caused by chemical fertilizers.
The activity of soil enzymes increased after the application of human waste.
The application of human waste increased water spinach production, vitamin C, and reduced nitrate accumulation.

1. Introduction

The types of toilets being promoted in the rural toilet renovation project in China include a three-compartment septic tank, double-vault funnel, double-pit alternate, biogas-linked, urine–feces division, and integrated flushing toilet [1]. Among these, the three-compartment septic tank toilet has become the most popular. In this toilet, human waste (urine and feces) enters a three-compartment septic tank where it is stored in the third tank after anaerobic fermentation and static separation and then collected by the feces collection truck for centralized processing [2]. This type of toilet has been widely promoted in rural areas of China. With the increasing population and the increasing use of three-compartment septic tank toilets, the amount of human waste is increasing [3], as are the costs and demand for centralized disposal. There is an urgent need to develop economical and environmentally sound techniques for human waste disposal.
One of the goals of the toilet revolution is to prevent pollution from human waste and to promote recycling [4]. For millennia, farmers worldwide have relied on human waste as fertilizer. Human waste (urine and feces) has an extensive agricultural history in East Asia, dating back to the third century BCE. [5]. The earliest text describing the application of human waste as a fertilizer was found in Qi Min Yao Shu. Later, in the Qing dynasty, human waste became a valuable agricultural resource for sale and trade. In Japan’s Edo era, human waste was banned from rivers to prevent it from being wasted [6]. Before the development of modern hydraulic sanitation systems, most European cities relied on human waste collectors to remove excrement from cesspits and privies. As in Asia, human waste was collected and spread in rural agricultural fields [7]. In Ghana, human waste is commonly used in rural areas to increase crop yields, such as maize and sorghum, helping to overcome the limitations of poor soils and the cost of commercial fertilizers [8]. The United States Environmental Protection Agency estimates that approximately 8 million tons of dry biosolids are produced in the country annually, but only about half of this material is applied to land, while USDA-certified organic agricultural operations are prohibited from using it [7]. Furthermore, in Wisconsin (USA), human waste is not permitted on land used to produce vegetable crops [9]. Animal manure is often composted into fertilizer or anaerobically digested and then applied to farmland [10]. Similarly, human waste can be treated by anaerobic digestion in septic tanks, in addition to composting for fertilization [11]. Properly treated human waste is a valuable resource.
However, industrial capitalism turned human waste from an agricultural resource to a source of pollution and waste [12]. Chemical fertilizers are now predominant in many industrialized countries because of their ability to quickly provide known quantities of nutrients and because they are cheap and relatively easy to use [13,14]. Human waste contains many pathogens that can cause serious infectious and parasitic intestinal diseases, and untreated fecal sludge discharged into the environment poses a serious risk to public health [4]. However, with the risk of the “culture of flushing” and the invention of mineral fertilizers [15,16], hygiene concerns over the use of human waste have been reduced. Conversely, the industrialization of agricultural production and increased fertilizer use have led to considerable perturbation of nutrient cycles, with detrimental effects on ecosystems and human health [17,18,19]. On the other hand, contemporary research has shown that in areas where soils have been depleted, the application of human waste or treated biosolids can improve soil structure and porosity while increasing organic carbon [20]. Human waste has a high nutrient value [21], and a growing movement of farmers, sanitation engineers, and scholars see the use of human waste as an alternative method for agricultural fertilization on a planet with dwindling resources [4].
The irrational application of chemical fertilizers has caused serious soil compaction, acidification, and environmental pollution, which seriously threatens the safety of agricultural products and the agroecological environment. Therefore, in 2016, China launched a national key special project, “Integrated technology research and development of chemical fertilizer and pesticide application reduction and efficiency enhancement”, which aimed to reduce the application of chemical fertilizers while ensuring the stable production of major crops. Combined with the goal of recycling human waste from rural toilets in China, a human waste substitute strategy is expected to play an important role in reducing chemical fertilizer application and promoting environmental protection.
At present, no research has been conducted on the influence of human waste and the combined application of human waste and chemical fertilizer on soil fertility, yield, and quality of water spinach. In this study, septic tank-treated human waste (urine and feces) was used to grow water spinach to investigate its effects. We hypothesized the following: (1) The addition of human waste would increase soil fertility and buffer soil acidity and salinization; (2) the addition of human waste would increase the yield and quality of water spinach; and (3) soil enzyme activity, vegetable yield, and quality are closely related to soil nutrients.

2. Materials and Methods

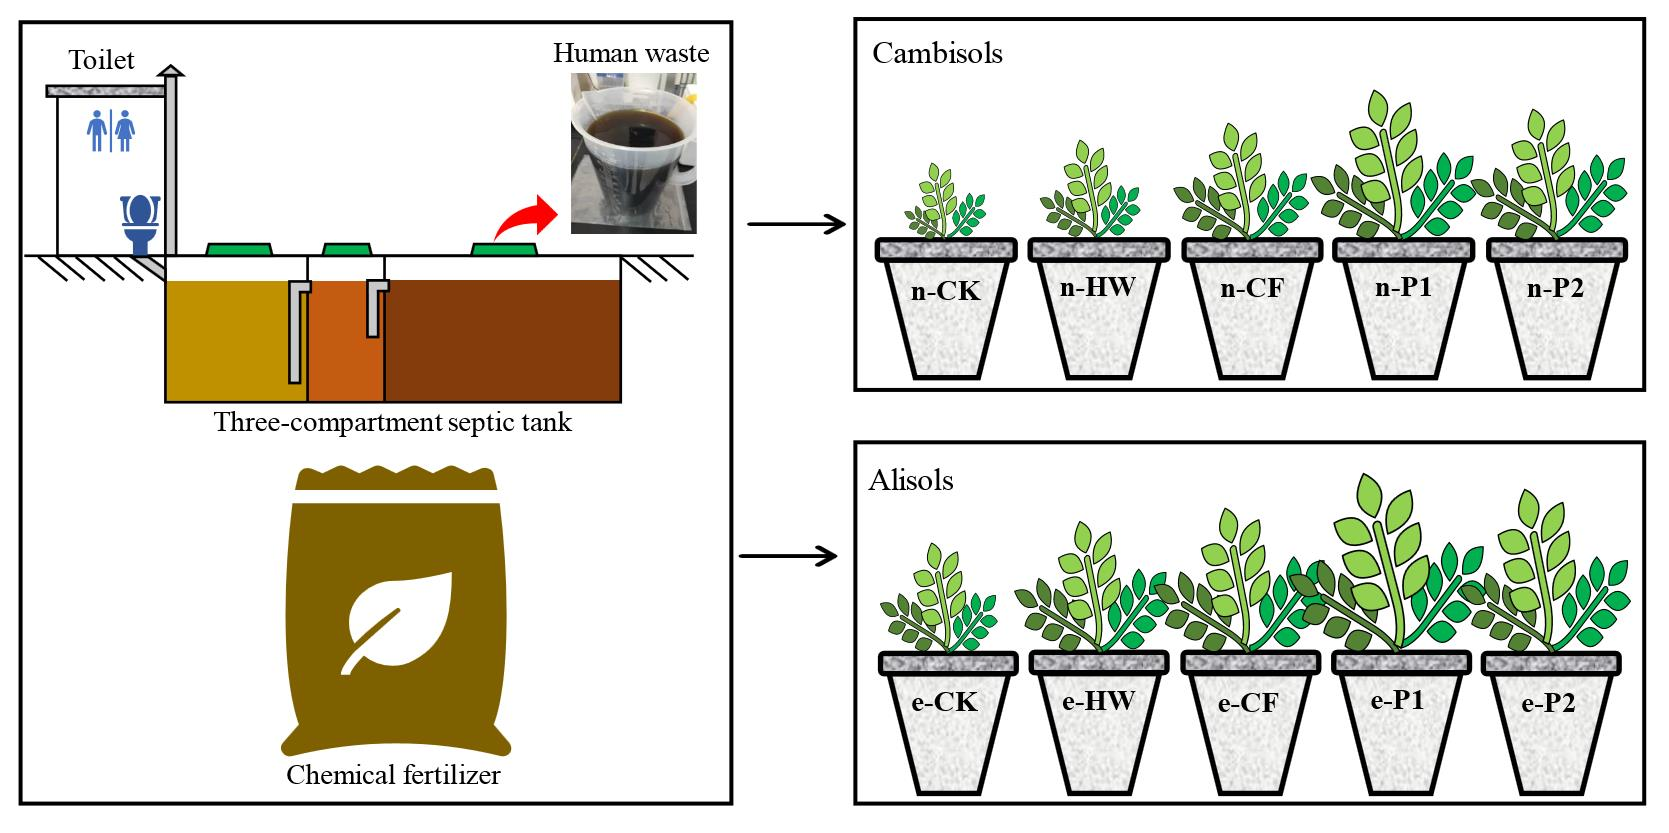
2.1. Experimental Design

The experimental soil was obtained from the surface layer (0–20 cm) of farmland in the suburbs of Baiguoshu Village, Laifeng County, Enshi Tujia, and Miao Autonomous Prefecture, Hubei Province (109°7′4.26″ E, 29°24′45.77″ N), and Zheyaogou Village, Tongxin County, Wuzhong City, Ningxia Hui Autonomus Region, China (106°22′21.6″ E, 36°50′24.19″ N). The soil was passed through a 2 mm nylon sieve and air dried. The soils from Enshi Tujia and Miao Autonomous Prefecture were Alisols (soil taxonomic names are based on the World Reference Base for Soil Resources (WRB, 2014; Update, 2015)) containing total nitrogen (TN) 0.24%, total carbon (TC) 2.10%, C/N 8.76, available phosphorus (AP) 83.8 mg·kg−1, available potassium (AK) 39.1 g·kg−1, pH 4.6, and electrical conductivity (EC) 0.2 mS·cm−1. The soils from Wuzhong City were lime Cambisols containing TN 0.06%, TC 1.89%, C/N 32.88, AP 73.8 mg·kg−1, AK 6.2 g·kg−1, pH 8.8, and EC 0.5 mS·cm−1.
Human waste (urine and feces) was obtained from the third compartment of a rural three-compartment septic tank in Guangrao County, Shandong Province (118°25′26.37″ E, 37°8′52″ N). The human waste was stored in a sealed container for 12 months and then the chemical properties and sanitary indicators were determined: TN 3.5 g·kg−1, total phosphorus 5.1 g·kg−1, total potassium 3.2 g·kg−1, organic matter (OM) 38.0 g·kg−1, pH 7.9, fecal coliform value 0.04, ascarid eggs mortality rate 100%, and salmonella bacteria undetected. The Chinese national standard (Hygienic Requirements for Harmless Disposal of Night Soil GB 7959-2012) clearly stipulates that “It is strictly forbidden to use human waste that has not been harmlessly treated for agricultural fertilization and direct discharge.” The above-mentioned sanitary indicators meet the requirements of the harmless treatment of human waste of this standard, so the human waste used in this experiment can be used for agricultural fertilization and direct discharge.
The selected experimental site was in the smart greenhouse of the Agro-Environmental Protection Institute, Ministry of Agriculture, and Rural Affairs. Water spinach seeds (harvested from Qingxian County, Hebei Province) were sown in May 2020. Three replicate sets were planted for each treatment, with three uniform plants in each pot (5 kg soil). During the growth period of 50 days, the room temperature was adjusted to approximately 25 °C, the water required for the growth of water spinach was replenished regularly and quantitatively, and physical measures were taken to prevent pests until harvest.
Each treatment provided the same nitrogen level, and the average amount of fertilizer applied to vegetable plants in China was applied for all groups. One control and four treatments were applied to the two soil types: (i) Control, no fertilization (CK), (ii) human waste application (HW), (iii) chemical fertilizer application (CF), (iv) 1/3 human waste to chemical fertilizer (P1), and (v) 2/3 human waste to chemical fertilizer (P2). Inorganic urea (46.40% N), superphosphate (12.00% P2O5), and potassium sulfate (50.00% K2O) were used as sources of N, P, and K, respectively, all of which were applied as basal fertilizers in potted soil (Table 1).

2.2. Soil and Vegetable Sampling and Preparation

During the water spinach growth cycle, soil samples were collected every 10 days for the analysis of NH4+-N and NO3-N. After the water spinach was harvested, soil samples were collected, dried, and sieved for analysis of chemical properties and enzyme activities. The collected water spinach samples were used to analyze the yield and quality.

2.3. Soil Chemistry and Enzyme Activity

NH4+-N and NO3-N were extracted from soil using 0.01 M CaCl2 and determined using an AA3 continuous flow analyzer (SEAL Analytical, Norderstedt, Germany). Soil N, C, and C/N were determined using an elemental analyzer. AP was determined using a spectrophotometer, AK was determined using a ZEEnit 700 P flame graphite furnace atomic absorption spectrometer (Analytik Jena AG, Jena, Germany), and pH was determined using a SevenCompact S210 pH meter (Mettler Toledo Instrument [Shanghai] Co., Ltd., Shanghai, China). EC was measured with an SX-650 pen-type conductivity/resistivity/TDS/ salinometer (Shanghai Sanxin Instrument Factory, Shanghai, China) in a 1:2.5 soil:water suspension. The OM was determined using the K2Cr2O7-H2SO4 redox method.
The soil urease (S-UE), soil acid phosphatase (S-ACP), soil alkaline phosphatase (S-ALP), soil catalase (S-CAT), and soil sucrase (S-SC) activities were determined using the Solarbio soil urease kit (Solarbio, BC0120), soil acid phosphatase kit (Solarbio, BC0140), soil alkaline phosphatase kit (Solarbio, BC0280), soil catalase kit (Solarbio, BC0100), and soil sucrase kit (Solarbio, BC0240), respectively.

2.4. Vegetable Yield and Quality

The water spinach was weighed using an electronic balance. Nitrate content was determined by ion chromatography (National Food Safety Standard for the Determination of Nitrite and Nitrate in Food GB 5009.33-2016). Soluble sugar content was analyzed according to the determination of soluble sugar in vegetables and products Shaffer-Somogyi (NY/T 1278-2007). Vitamin C content was measured according to the National Food Safety Standard for the Determination of Ascorbic Acid in Food (GB 5009.86-2016).

2.5. Statistical Analysis

Data were analyzed using SPSS Statistics 26.0 (IBM, Armonk, NY, USA). The effects of the human waste substitute strategy on soil chemical properties, soil enzyme activities, crop yield, and quality were assessed using one-way analysis of variance and Duncan’s multiple range test. Redundancy analysis (RDA) is a development of multiple linear regression that can analyze the linear relationship between soil chemical properties and soil enzyme activities, soil chemical properties, and vegetable yield and quality by reflecting the two variables in the same Cartesian coordinate system. RDA was applied to evaluate the associations between enzyme activities and soil chemical properties, vegetable yield and quality, and soil chemical properties using Canoco 5.0, for Windows. The tables were constructed using Microsoft Office 2019 and images were drawn using Origin 2021.

3. Results and Discussions
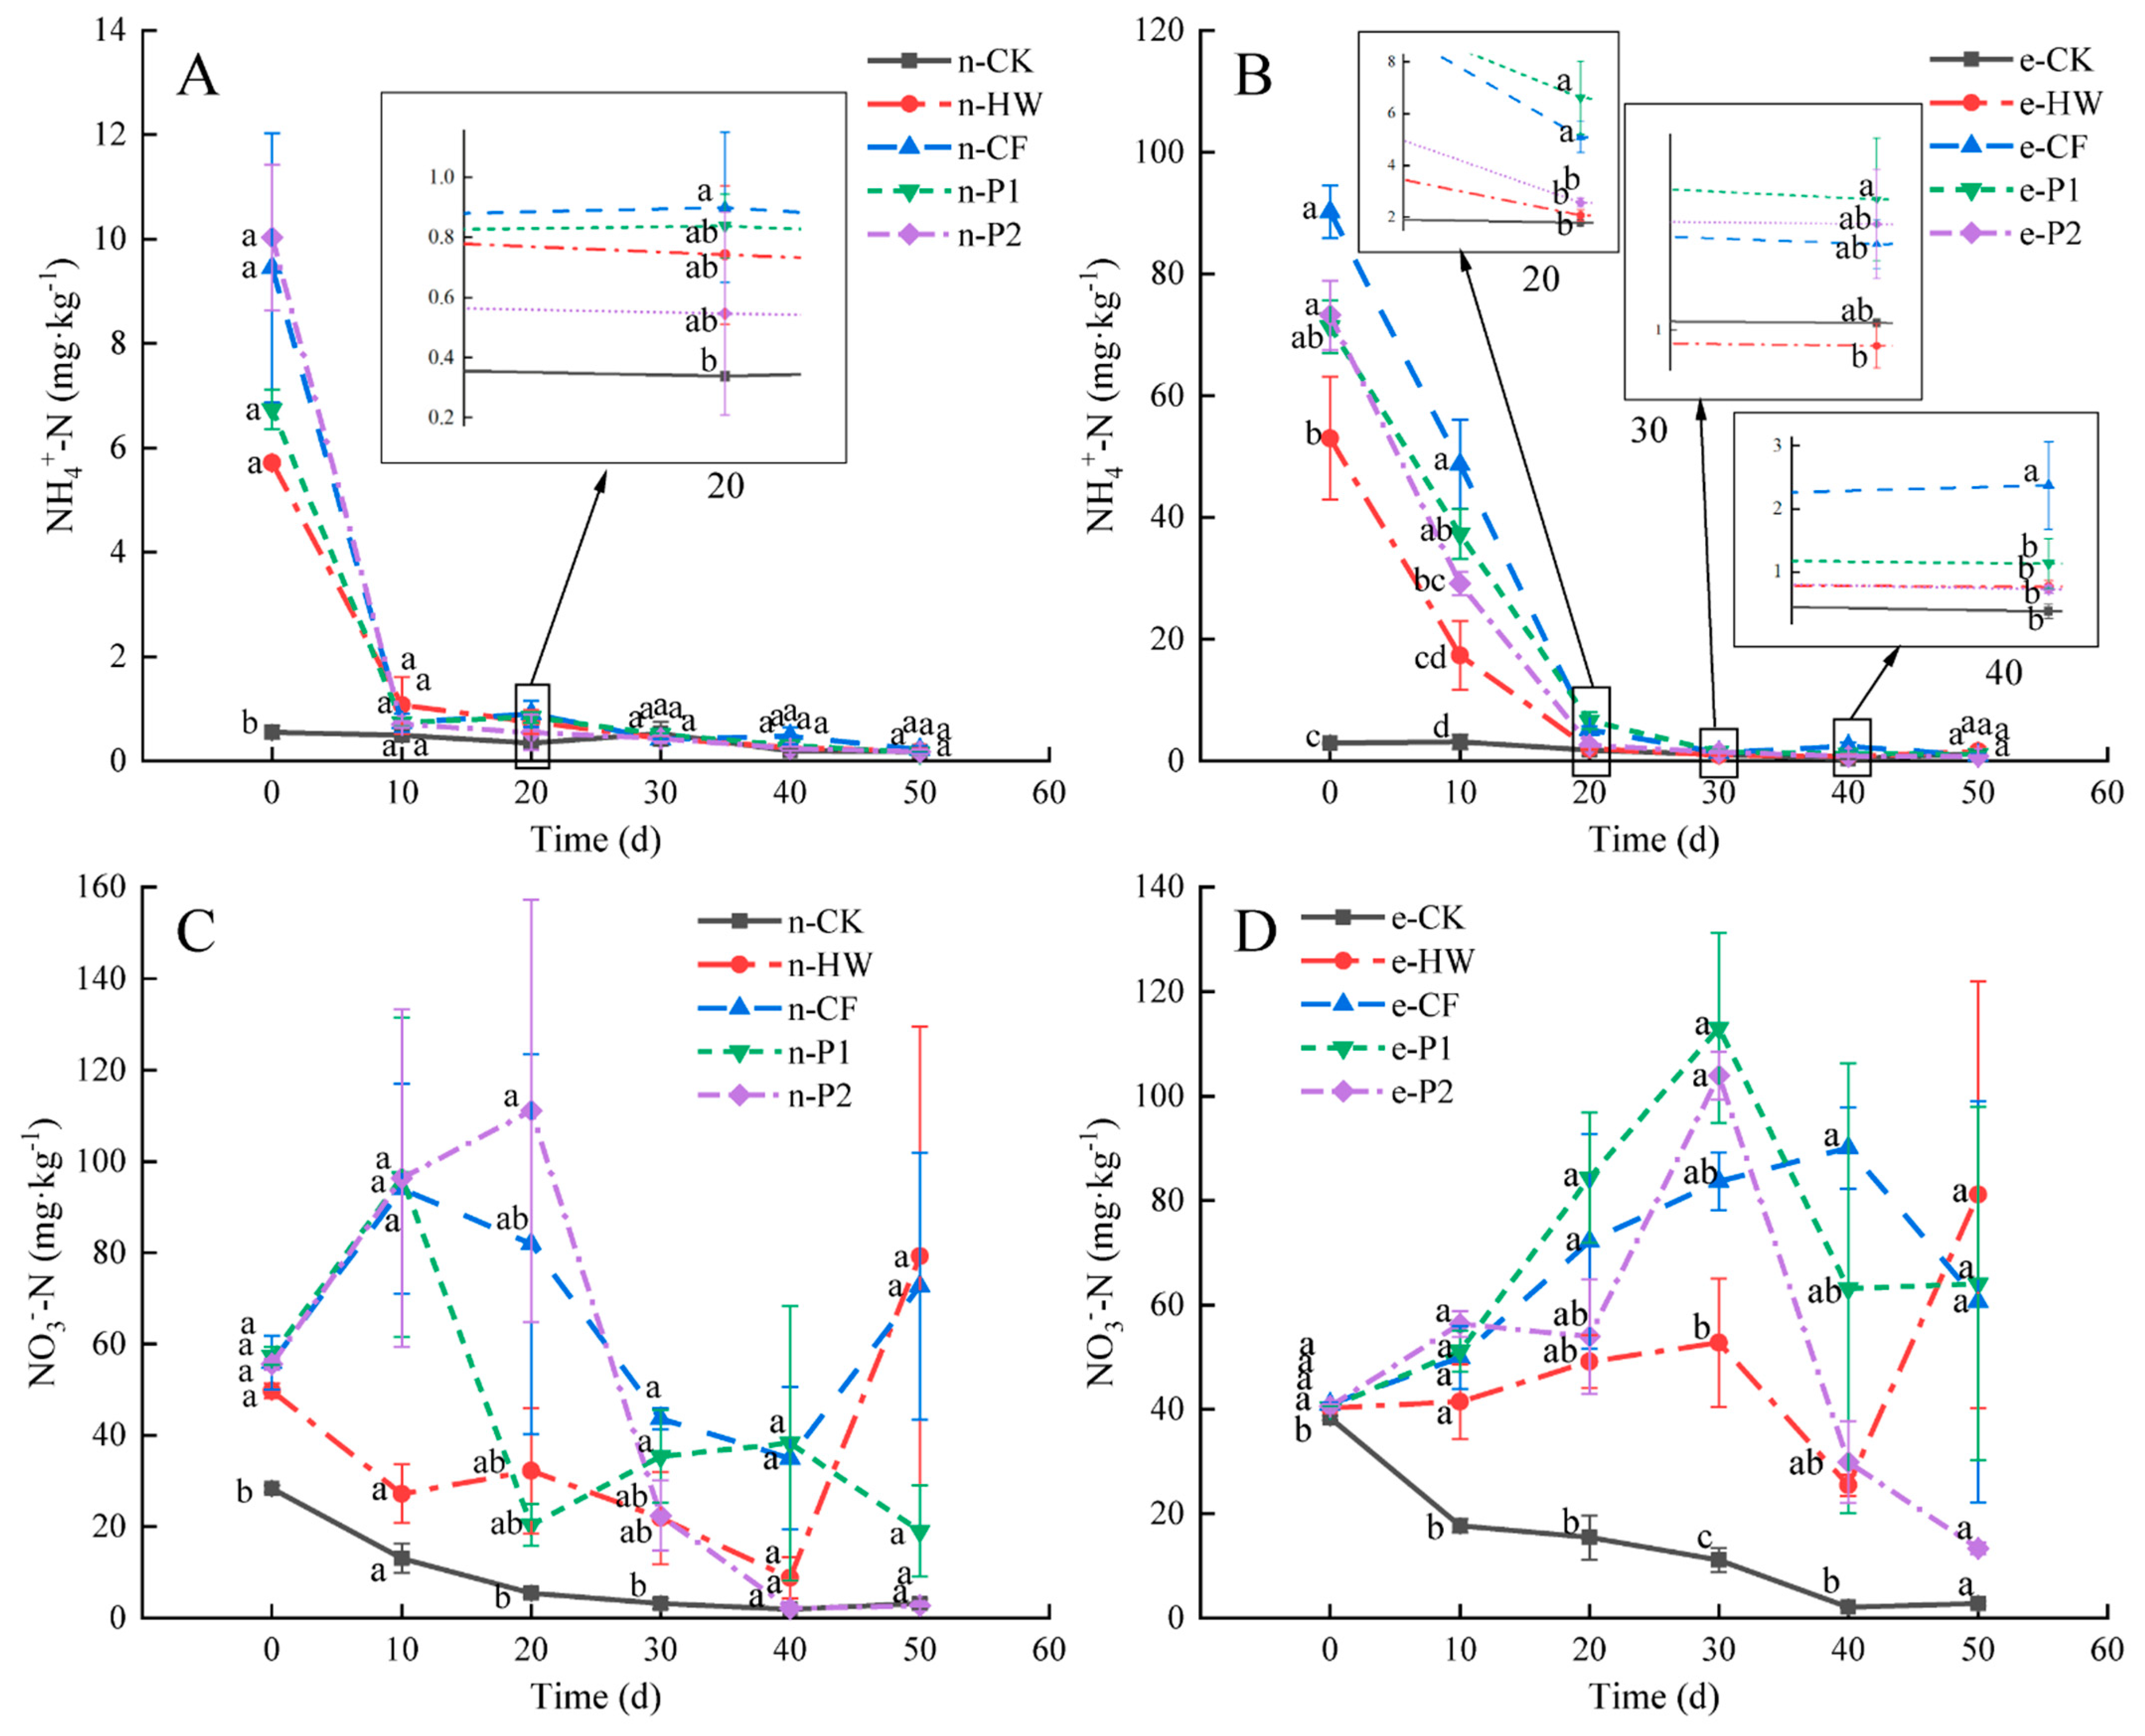
3.1. Soil Chemistry

Our results show that human waste and chemical fertilizer altered the chemical properties of the soil, particularly pH, EC, AP, and AK.
Fertilization increased the AP and AK content of Cambisols (Table 2). AP and AK were the highest in CF-treated soil (35.2 mg·kg−1 and 122.2 mg·kg−1, respectively), followed by HW, P1, P2, and CK. The AP and AK of the P1 treatment were significantly higher than that of the CK control, 3.60 times and 1.39 times, respectively (p < 0.05). In Alisols, the AP and AK content increased the most after CF treatment (86.0 mg·kg−1 and 113.5 mg·kg−1, respectively), followed by P1 and P2 treatments, which were 1.47 times and 1.32 times higher than the CK control, respectively (p < 0.05). After HW treatment, AP was 1.08 times that of the CK control but the difference was not significant (p > 0.05). AK was the highest after P1 treatment (117.2 mg·kg−1), significantly higher than that of the P2 treatment, but not significantly different from the CF treatment, and the AK content of CF, P1, and P2 treatments was significantly higher than that of the CK control (p < 0.05). Cheng et al. [22] found that microbial fertilizer and organic fertilizer increased the effective phosphorus and potassium content. Human waste is rich in stable OM and nutrients [23]. Soil AP and AK were significantly higher in the treatment groups than in the control group (p < 0.05) and were positively correlated with the amount of chemical fertilizer. It could be argued that the chemical fertilizer contained more nutrients than the organic fertilizer, or that the organic manure released its nutrients more slowly over a longer period [24], so the soil nutrient enhancement effect was not as pronounced [25]. Soil phosphatase catalyzes the hydrolysis of organic phosphorus to release inorganic phosphorus, which also increases soil available phosphorus [26,27].
In Cambisols, the soil pH values of CF, P1, P2, and HW treatments were significantly reduced by 0.5, 0.4, 0.3, and 0.3 (p < 0.05), respectively. In Alisols, fertilization (HW, CF, P1, and P2) significantly reduced the pH by 0.4, 0.7, 0.6, and 0.5, respectively (p < 0.05). Soil pH is determined by the production and consumption of protons (H+). The application of human waste, chemical fertilizer, or a combination of both reduced the pH of both types of soil. The NH4+-N content in both soils showed a downward trend throughout the growth cycle (Figure 1A), while NO3-N increased over time (Figure 1B), indicating that the soil acidification resulted from the release of a large amount of H+ by the fertilizer [28]. Soils with different initial pH values have different acid-buffering capacities [29]. In the treatment of Alisols, a higher proportion of chemical fertilizer resulted in a lower pH. Studies have shown that in acidic soils, the effect of ammonium nitrogen addition on soil pH depends on the direct effect of fertilizer nitrogen and the indirect effect of nitrification [30]. It has been observed that chemical nitrogen application shifts soil into Al3+ buffering stages. Al released into the soil solution by hydrolysis of Al hydroxides on the surface of clay minerals at pH < 5 decreases the saturation of base cations and increases soil acidification [31]. The pH reduction in Cambisols was not as pronounced as in Alisols, possibly because the root system of water spinach is not as well developed in Cambisols and fewer H+ ions are secreted [32], or because microorganisms are less abundant than in Alisols and thus fewer organic acids are secreted [33].
The ECs of Cambisols after CF, P1, and P2 treatments were 3.0, 1.4, and 0.4 times (p < 0.05) higher than that of the CK control (HW treatment was 1.0 times higher but not significantly different), and the ECs of Alisols after CF, P1, and P2 treatments were 10.0, 7.0, and 4.7 times (p < 0.05) higher than that of the CK control (HW treatment was 2.3 times higher but not significantly different). Before treatment, Alisols had a significantly lower EC than Cambisols. The EC of Alisols after P2 treatment was significantly higher than that of P2-treated Cambisols, but there were no significant differences between the two soils after HW, CF, or P1 treatments. Lv et al. [34] found that EC has a strong negative correlation with soil pH, which is consistent with the results of the present study (Table 2). Compared with the control group, the EC of the treatment groups increased, with CF being the most effective treatment. The higher the proportion of chemical fertilizer in the treatment, the greater the EC value, presumably due to an increase in the concentration of dissolved solutes in the soil [24].
TN, TC, C/N, and OM in Cambisols showed no significant differences between treatments (p > 0.05) or compared with the control, with the exception of C/N, which was significantly reduced by 6.3% after CF treatment. TN and OM in Alisols after treatment were significantly higher than in Cambisols after the corresponding treatments. The TC in Alisols after HW and P2 treatments was significantly higher than in Cambisols after the corresponding treatments, while there were no significant differences between the CK, CF, and P1 groups after treatment in the two soils. The C/N ratio in the CK, HW, and CF Alisols groups was significantly higher than that in Cambisols.
NH4+-N is the main source of nitrogen nutrients absorbed by plants and is also an important product in the process of soil nitrogen transformation [35]. During the water spinach growth cycle, the NH4+-N content of Cambisols and Alisols exhibited a downward trend (Figure 1A,B). The initial NH4+-N contents of the HW, CF, P1, and P2 groups in Cambisols were 5.7, 9.4, 6.7, and 10.0 mg·kg−1, respectively (all were significantly higher than the 0.6 mg·kg−1 of the control group, with no significant differences between the treatments). The initial NH4+-N contents of the HW, CF, P1, and P2 groups in Alisols were 53.0, 90.2, 71.3, and 73.2 mg·kg−1, respectively, which were all significantly higher than the control group (2.9 mg·kg−1). Soil pH is an important factor in controlling nitrification activity; increasing pH often increases the rate of nitrification [36,37]. The NH4+-N soil content was still high after 10 days, which may be because the acidic soil environment inhibited the nitrification rate of Alisols.
Soil nitrate nitrogen (NO3-N) is an important indicator of soil fertility and productivity. In Cambisols, soil NO3-N in the P1 and P2 groups initially increased and then decreased, while in the CF group it increased, decreased, and increased again, presumably due to the chemical fertilizer elevating soil ammonium nitrogen and increasing the rate of nitrification. In the early growth stages, the soil NO3-N content increased rapidly. During peak growth, a large amount of NO3-N was consumed. Wang et al. [38] found that after 58 days of sowing corn, the soil NO3-N decreased because the corn was in the peak growth period and needed more soil nutrients. Growth slowed after 40 days and the NO3-N produced by nitrification exceeded the absorption capacity of the water spinach and accumulated rapidly in the soil. The soil NO3-N content under HW treatment initially decreased and then increased, while a consistent downward trend was evident in the CK control group (Figure 1C).
In Alisols, NO3-N in the HW, CF, P1, and P2 groups initially increased and then decreased, while the CK group showed a consistent downward trend (Figure 1D). Due to the influence of the pH of the Alisols, the nitrification rate was slow, peaking on day 40, after which the NO3-N content rapidly decreased. From the 20th day, the NO3-N content of the P1 treatment was higher than that of the P2 treatment. This may be because in the early stage of fertilization, chemical fertilizers released more ammonium nitrogen into the soil, increasing nitrification and the NO3-N content. During the peak growth period, the consumption of NO3-N increased, ammonium nitrogen provided by the fertilizer decreased, the nitrification rate decreased, and the NO3-N content began to decrease. The peaks of NO3-N in the P1 and P2 treatments in Alisols were later than those in Cambisols due to the influence of soil pH.

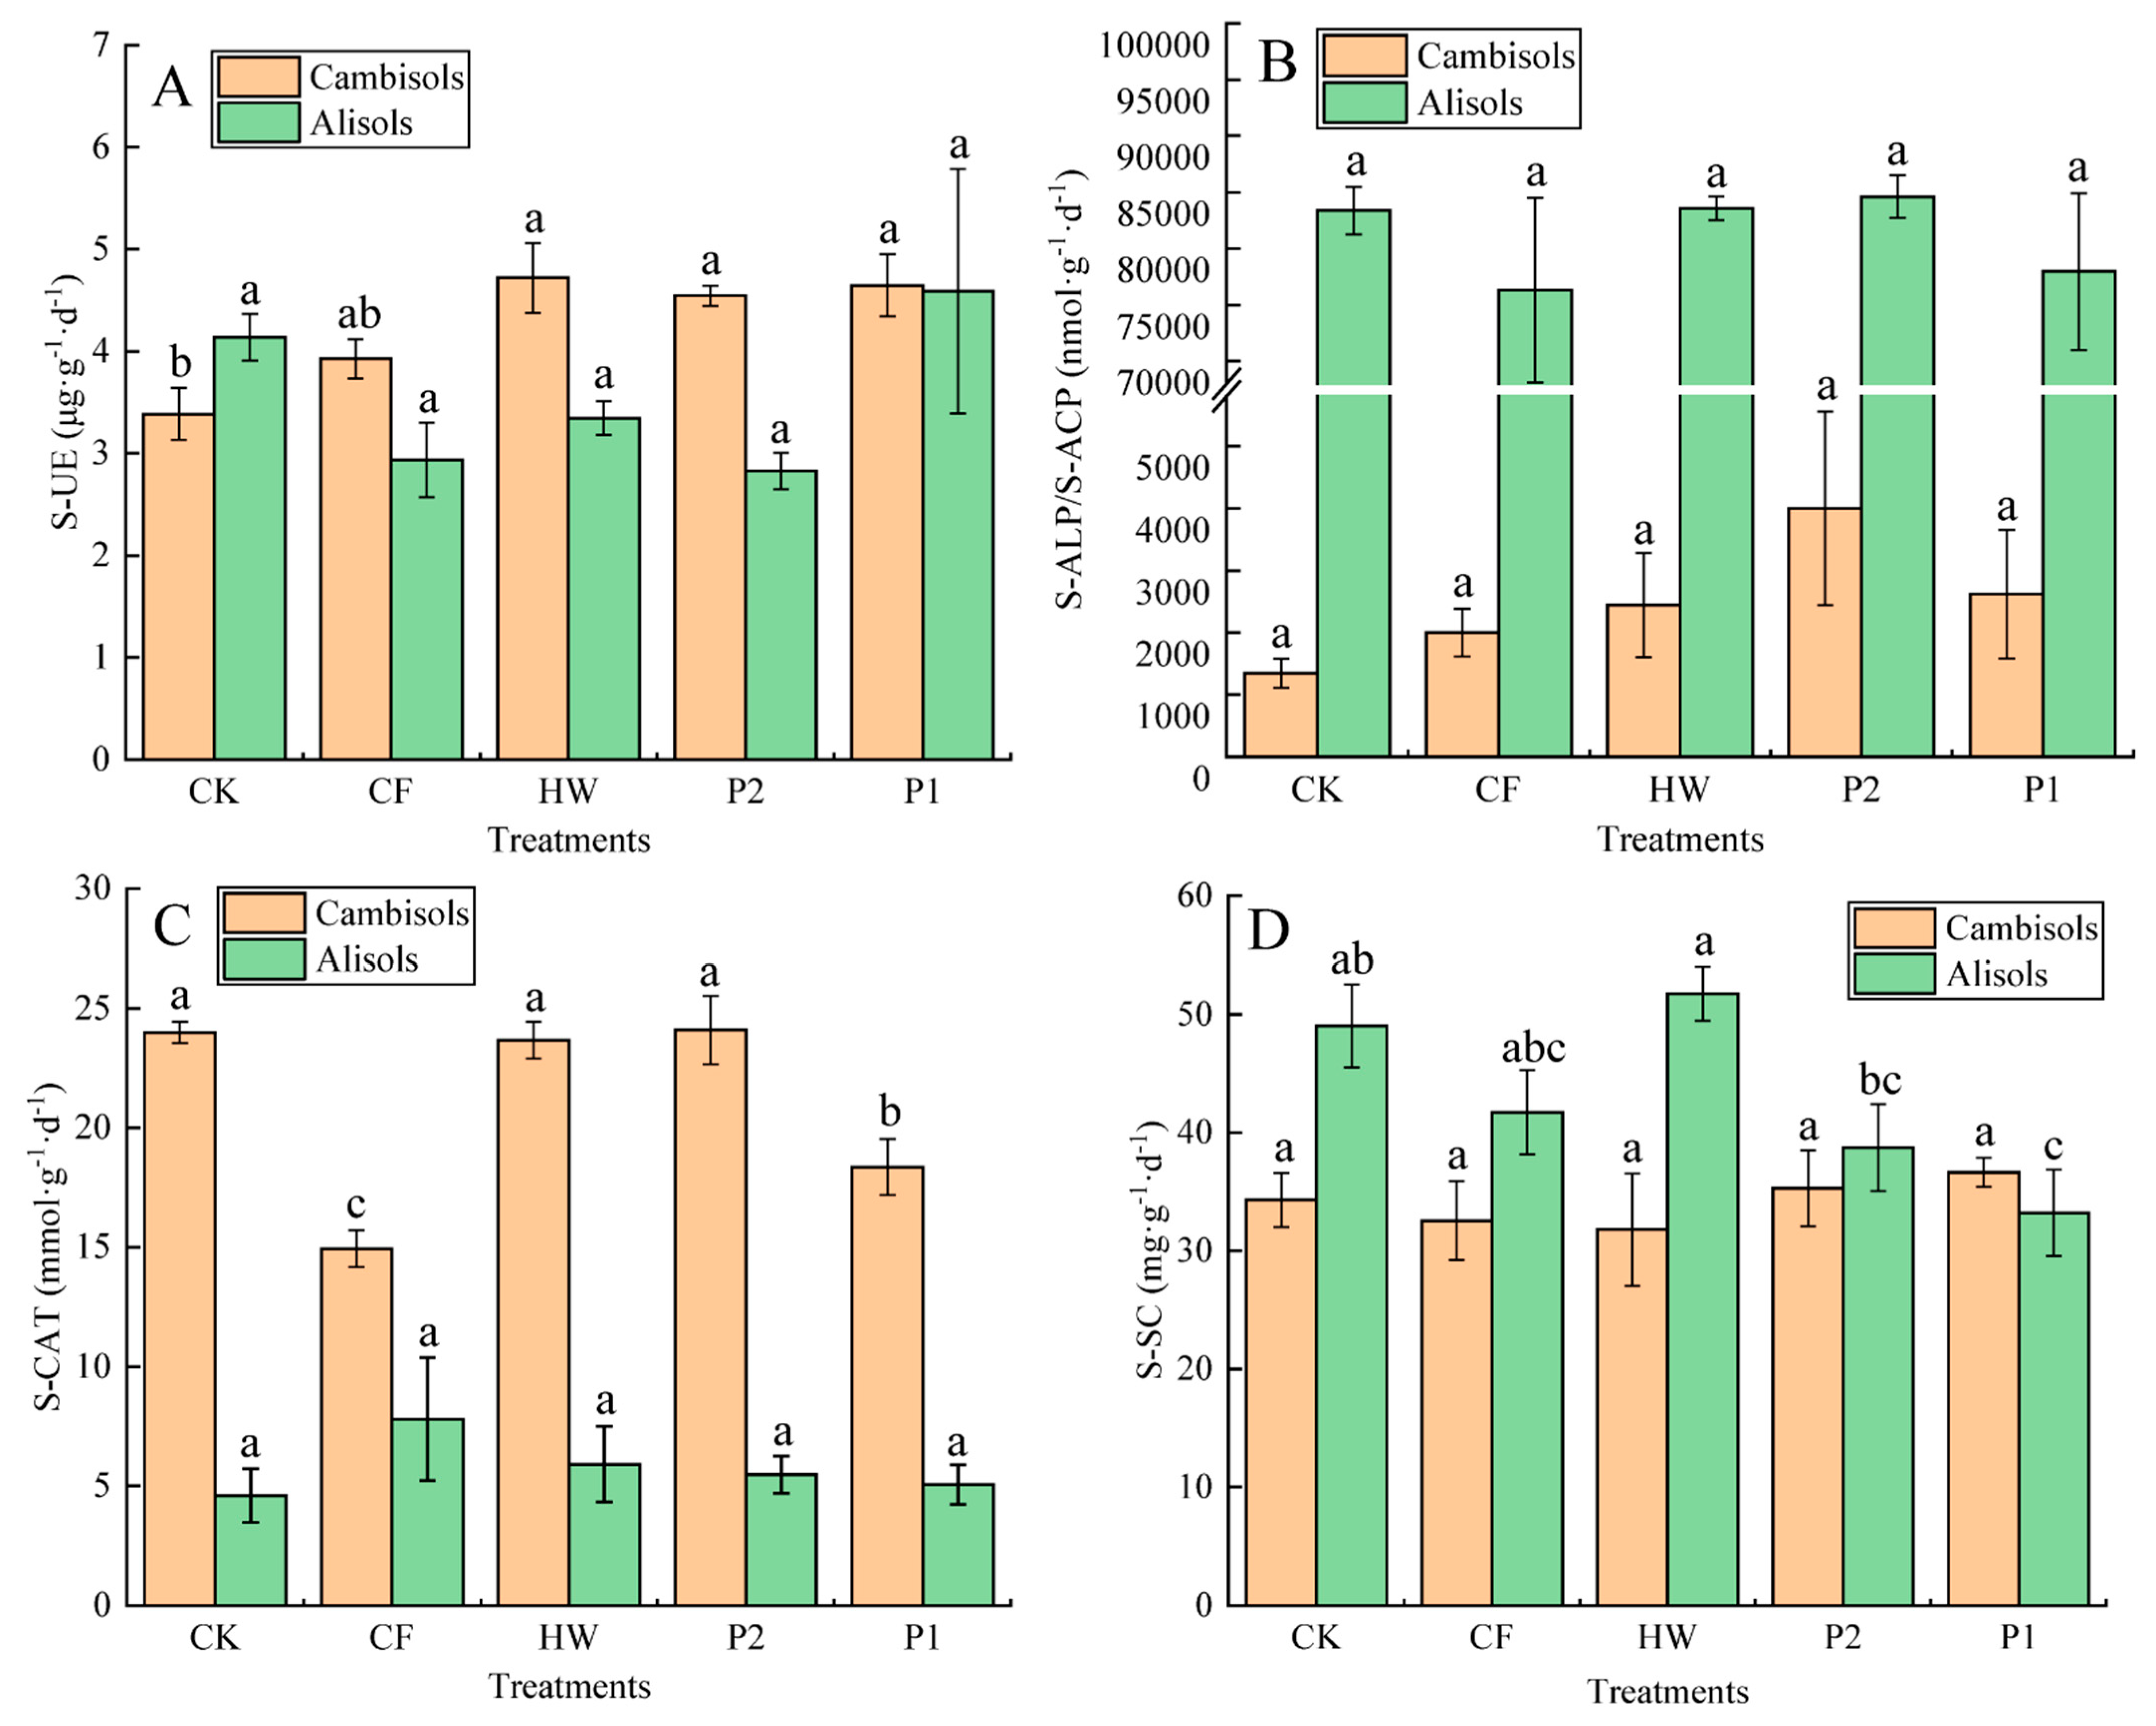
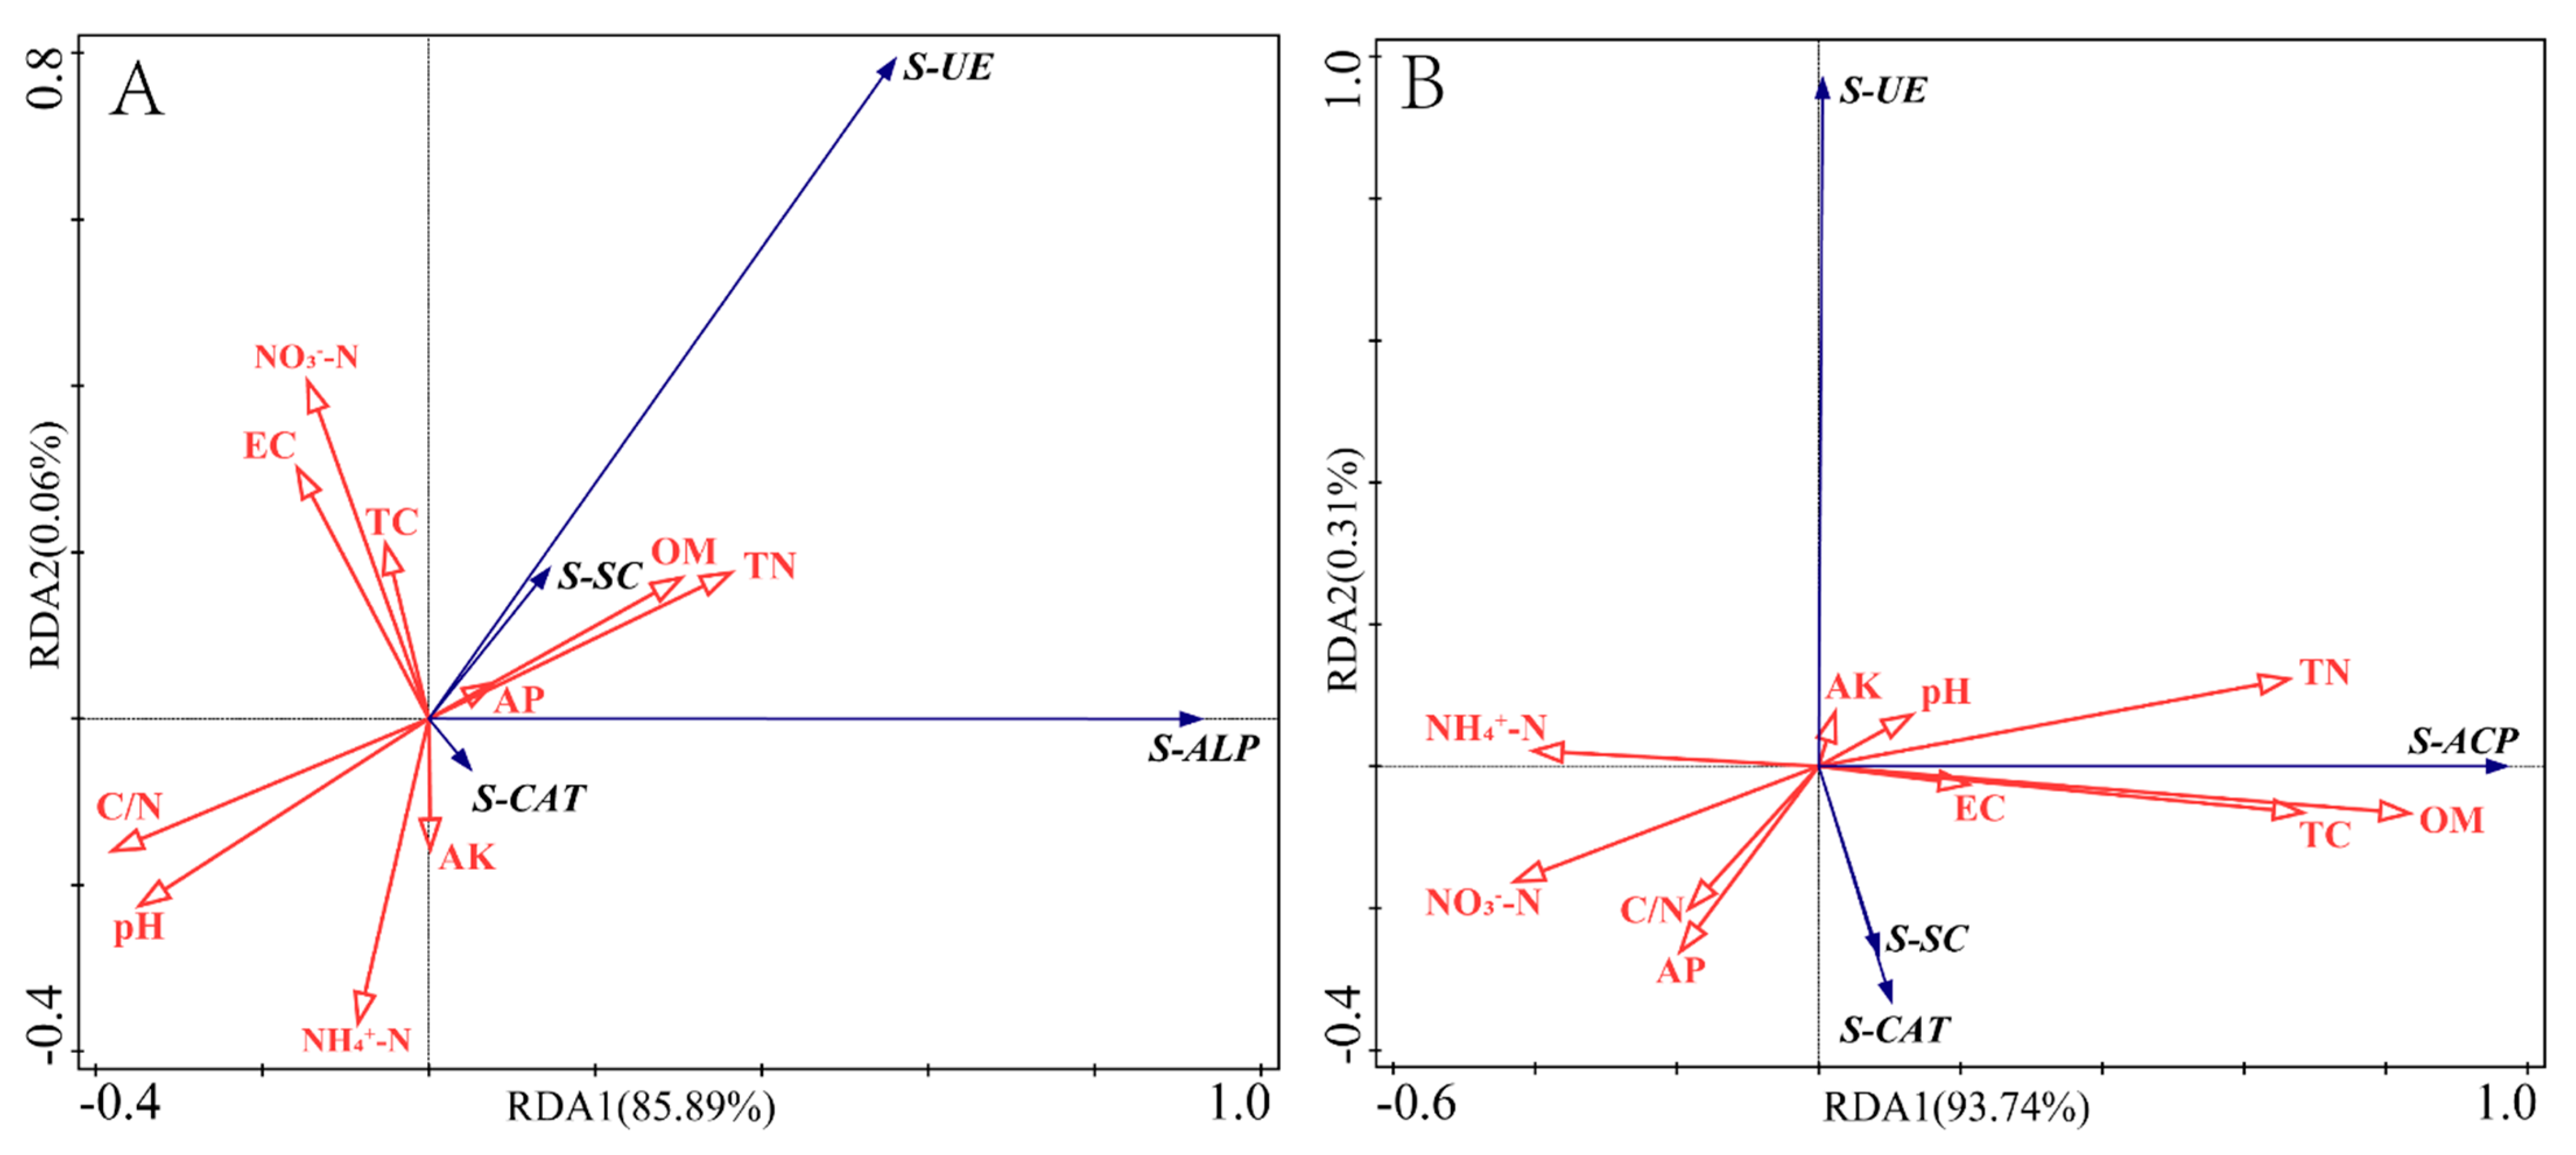
3.2. Soil Enzyme Activity and Correlation with Soil Chemistry

Soil enzymes (Figure 2A) are catalytic proteins that participate in many important biochemical processes and are closely related to soil fertility [39]. Urease plays a vital role in the soil nitrogen cycle [40]. The application of human waste (HW) or combined human waste and chemical fertilizer (P1 and P2) significantly increased Cambisols’ soil urease activity (p < 0.05). S-UE activity was the highest under HW treatment (4.7 μg·g−1·d−1): 39.2% and 20.4% higher than the CK and CF groups, respectively. P2 treatment increased S-UE activity by 33.9% and 15.8% compared with CK and CF, while under P1 treatment, S-UE activity increased by 36.9% and 18.4%, respectively.
In Alisols, HW, CF, and P2 treatments reduced S-UE activity compared with the CK control, with P2 having the lowest activity (2.8 μg·g−1·d−1). P1 treatment increased S-UE activity to 4.6 μg·g−1·d−1, but there was no significant difference between treatments (p > 0.05).
The S-UE activity of the HW, CF, and P2 treatments in Cambisols was significantly higher in Alisols (p < 0.05). The S-UE activity of the CK control in Cambisols was significantly lower than that in Alisols (p < 0.05), but there was no significant difference in S-UE activity between the two soils treated with P1 (p > 0.05). It is possible that the application of human waste and chemical fertilizers provided a large amount of nitrogen to the Cambisols, resulting in a rapid increase in S-UE. The pH of Alisols was reduced by fertilization. Soil microorganisms that secrete urease have difficulty adapting to this acidification and their population falls, which reduces enzyme activity [41].
Soil phosphatase participates in the conversion and circulation of phosphorus, catalyzing the hydrolysis of organic phosphorus to release inorganic orthophosphate [42]. Figure 2B shows the activity of Cambisols soil alkaline phosphatase (S-ALP) and Alisols’ soil acid phosphatase (S-ACP). After fertilization, S-ALP activity increased, P2 had the highest activity (4000.0 nmol·g−1·d−1), and CK the lowest (1346.2 nmol·g−1·d−1).
S-ACP activity was reduced under CF and P1 treatments compared with the CK control, with CF being the lowest (76317.4 nmol·g−1·d−1). HW and P2 treatments increased S-ACP activity, with P2 being the highest (84614.1 nmol·g−1·d−1). S-ALP activity in Cambisols was significantly higher than that in Alisols under the corresponding treatment (p < 0.05). Fertilization increased S-ALP activity in Cambisols, whereas chemical fertilizer reduced S-ACP activity in Alisols. In both soils, phosphatase activities increased with the proportion of human waste in the treatment groups (Figure 2B). It is possible that chemical fertilizers increase soil inorganic phosphorus concentrations, thereby inhibiting phosphatase secretion by microorganisms and plants [43,44].
Figure 2C illustrates the activity of catalase (S-CAT) in Cambisols and Alisols. S-CAT is an indicator of soil aerobic microbial activity, which is related to the number and fertility of aerobic microbes [45]. S-CAT degrades hydrogen peroxide in the soil, protects crops from poisoning, and impacts crop growth [46]. P1 and CF treatments significantly reduced Cambisols S-CAT (p < 0.05). CF treatment had the lowest activity (14.9 nmol·g−1·d−1), but there was no significant difference between CK, HW, and P2 treatments. HW, P2, and P1 treatments were 58.4%, 61.3%, and 22.9% higher than that of the CF treatment (p < 0.05), respectively.
S-CAT activity in Cambisols was significantly higher than that in the corresponding treatment in Alisols (p < 0.05). Quan et al. [47] found that S-CAT is significantly positively correlated with soil pH. In the present study, the greater the proportion of chemical fertilizer in the treatment, the lower the soil pH and enzyme activity. CF treatment showed the lowest S-CAT activity, whereas fertilization with Alisols increased this activity (Figure 2C), which may be due to an increase in aerobic catalase-secreting microorganisms due to the addition of nutrients.
Soil sucrase (S-SC) hydrolyzes sucrose into monosaccharides that can be absorbed by the body. Its products are closely related to the OM, nitrogen, and phosphorus contents of the soil, the number of microorganisms, and the intensity of soil respiration. S-SC activity can be used to evaluate soil compaction and the degree and index of soil fertility. Figure 2D shows the S-SC activity in Cambisols and Alisols. Compared with the control, the application of human waste (HW) or chemical fertilizer (CF) reduced S-SC activity in Cambisols, while combinations of human waste and chemical fertilizer (P1 and P2) increased it (p > 0.05). P1 treatment led to the highest S-SC activity (36.6 mg·g−1·d−1) and HW treatment the lowest (31.8 mg·g−1·d−1).
In Alisols, P1 treatment significantly reduced S-SC activity (p < 0.05) to 33.2 mg·g−1·d−1, while HW treatment increased it to 51.8 mg·g−1·d−1. This may be caused by human waste application improving the soil structure and porosity, enhancing soil respiration, and increasing enzyme activity. S-SC activity in Cambisols was significantly higher than that in the corresponding treatment in Alisols (p < 0.05).
Table 3 shows the differences in the activities of the four enzymes by different soil chemical properties. The first axis (encompassing 10 soil chemical properties) explained 86.80% of the four enzyme activities in Cambisols. The cumulative interpretation of the relationship between enzyme activity and soil chemistry reached 100%, indicating that the first axis was sufficient to explain this relationship. In Alisols, the first axis explained 86.32% of the enzyme–chemistry relationship.
Soil enzymes are active ingredients in various biochemical processes and nutrient cycles and are derived mainly from soil microorganisms, plant root exudates, and plant and animal residues. Of these, soil microbes make the greatest contribution [41]. Alterations in soil environmental factors can significantly change the characteristics of the microbial community and the resulting soil enzyme activity [48].
From the two-dimensional sequence diagram (Figure 3A) of soil enzyme activity and chemical properties of Cambisols, we found that the arrow lines of pH, NO3-N, NH4+-N, TN, and C/N were the longest, indicating that these chemical properties played a better role in explaining soil enzyme activities than others. TN had a significant positive correlation with S-UE, S-SC, and S-ALP. C/N was significantly negatively correlated with S-UE, S-SC, and S-ALP. This shows that TN is the dominant factor affecting the S-UE, S-SC, and S-ALP of Cambisols. NH4+-N had a significant positive correlation with S-CAT and a significant negative correlation with S-UE and S-SC. NO3-N had a significant negative correlation with S-CAT. Highly soluble salt in salinized soil not only has adverse effects on its physical and chemical properties, but also affects the growth and development of crops and the metabolic processes of crop roots and microbes [49]. It may be that the addition of ammonium nitrogen via fertilizer reduced soil pH and Cambisols’ S-SC and S-UE activities were inhibited, while the elevated AK and AP content increased the soil salt concentration, thereby inhibiting S-CAT activity. pH had a significant negative correlation with S-ALP and a very significant negative correlation with S-UE and S-SC. Soil pH affects not only the decomposition and mineralization of organic macromolecules, the dispersion and aggregation of soil colloids, and the types and activities of microorganisms and their redox reactions, but also has a direct impact on the rate of soil enzymes participating in biochemical reactions [50]. Studies have shown that high pH usually inhibits the growth of microorganisms and is negatively correlated with certain enzyme activities [51], indicating that the number and activity of microorganisms that can secrete S-ALP, S-UE, and S-SC may have been suppressed.
From the two-dimensional sequence diagram (Figure 3B) of soil enzyme activity and chemical properties of Alisols, we found that the arrow lines of OM, NO3-N, NH4+-N, TN, TC, and AP were the longest, indicating that these chemical properties played a better role in explaining soil enzyme activities than others. OM, TN, and TC had a very significant positive correlation with S-ACP. Soil nutrients, including OM, nitrogen, phosphorus, potassium, and other elements, are closely related to soil enzyme activity [52,53]. Nutrients determine the substrate and environment for enzymatic reactions, thus affecting enzyme activity. Soil carbon turnover and nutrient cycling, in turn, depend on enzyme activity [54,55]. Kawaguschi et al. [56] found that phosphatase activity was positively correlated with organic carbon and TN. It has also been reported that bacteria are the main source of S-ALP [26], while the main source of S-ACP is fungi [42,57]. The application of nutrients to acidic soil suitable for growth and reproduction may promote the secretion of acid phosphatase by such fungi. Research has shown that phosphatase activity is related to OM and nitrogen utilization through inorganic and organic nitrogen amendments [58]. The addition of exogenous nitrogen stimulates microorganisms to allocate excess nitrogen to phosphatase, improves the activity of S-ACP, and accelerates the process of organic phosphorus mineralization and the return of inorganic phosphorus [43]. NO3-N and NH4+-N levels were significantly negatively correlated with S-ACP. It may be that the increase in ammonia NO3-N and NH4+-N in Alisols aggravated the acidification of the soil and the activity of S-ACP was inhibited. AP and AK are not only key nutrients for plant growth and environmental sustainability but are also reliable measures of soil productivity [59,60]. In this study, AP was positively correlated with S-SC and S-CAT scores. This may be because AP promotes the growth of plant roots and the reproduction of microorganisms, thereby secreting S-SC and S-CAT.

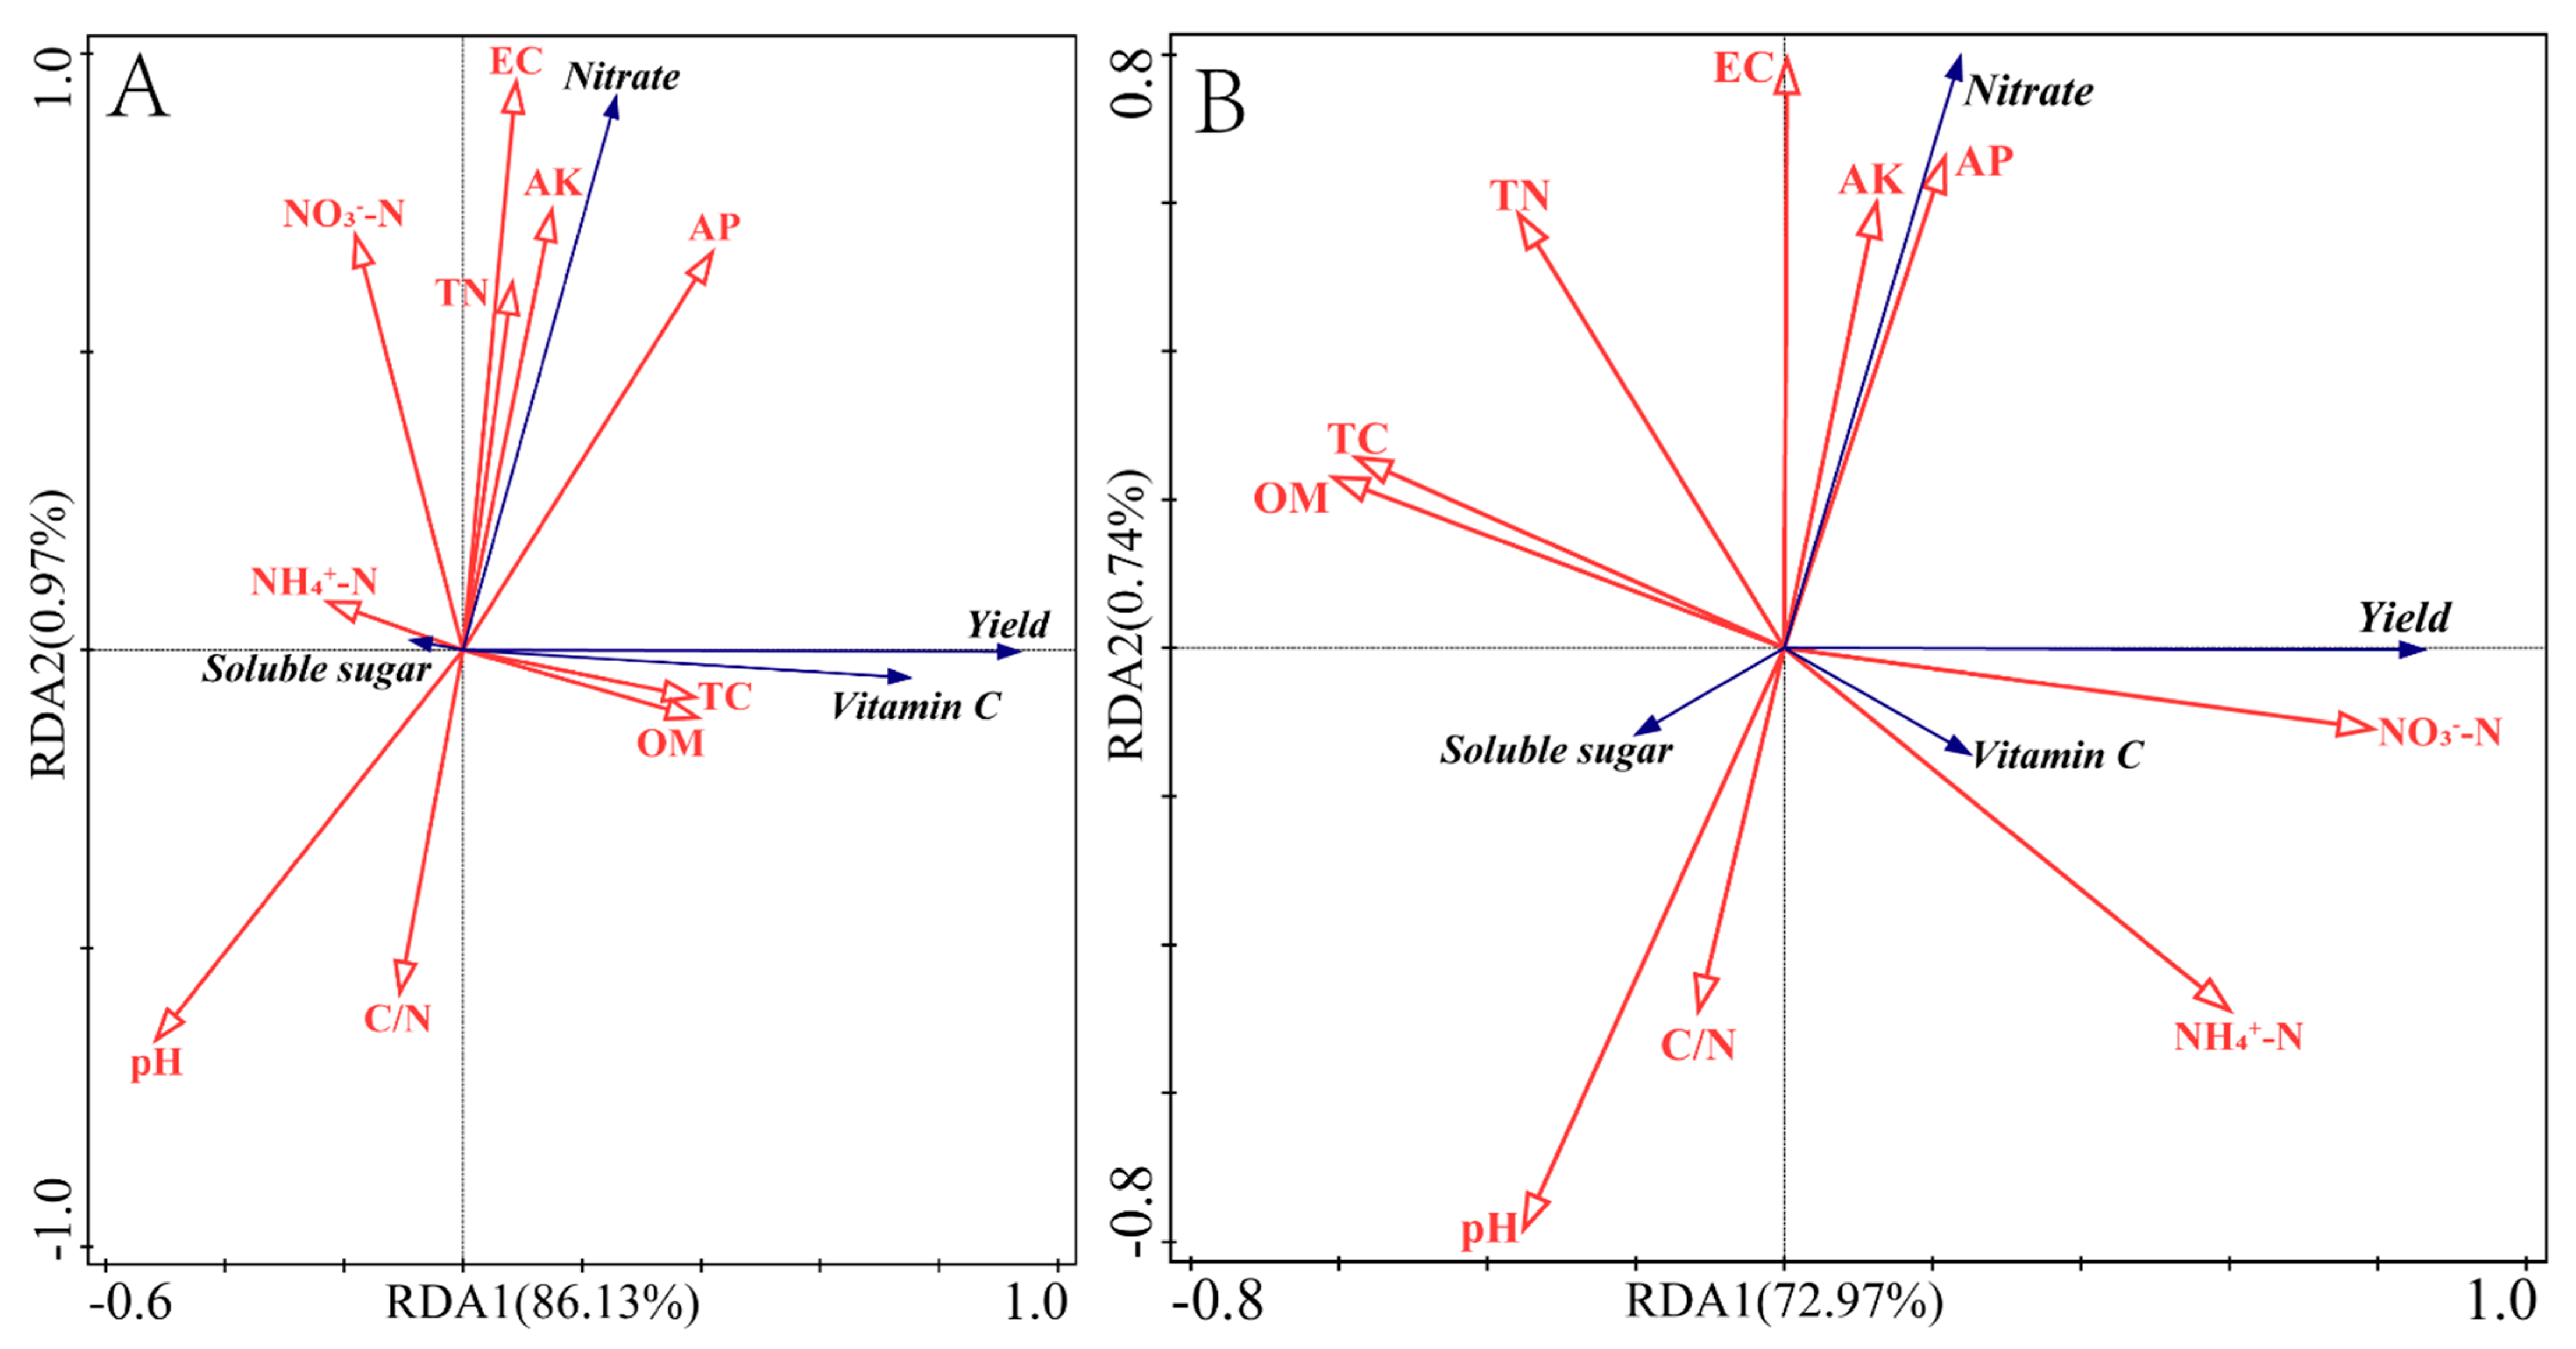
3.3. Yield and Quality Analysis and Correlation with Soil Fertility

China is the largest vegetable producer in the world. In 2017, 20 million hectares were cultivated, over four times more than in 1985 [61]. At present, 4.67 million hectares of vegetable production are in solar greenhouses [62], increasing the area capable of producing vegetables off-season [63]. Human waste is rich in nutrients (including nitrogen, phosphorus, and potassium) required by plants and can be used as both irrigation water and fertilizer. It can improve the physical, chemical, and biological properties of soil, thereby increasing vegetable yield and quality [23]. Human waste also contains other beneficial substances, such as carbohydrates, trace elements, crude protein, and amino acids, which play important roles in improving soil properties [64].
As shown in Table 4, the application of human waste (HW), chemical fertilizer (CF), or a combination of both (P1, P2) significantly increased the water spinach yield in Cambisols, with P1 and P2 giving significantly higher yields than HW and CF (p < 0.05). P1 treatment gave the highest yield (19,296.0 kg·ha−1) and the CK control the lowest (4272.6 kg·ha−1). HW, CF, P1, and P2 treatments increased production by 123.7%, 183.3%, 351.6%, and 330.3%, respectively, compared with the control. Yields from the P1 and P2 treatments were 2.0 and 1.9 times higher than those of the HW treatment, and 1.6 times and 1.5 times higher than the CF treatment, respectively. There were no significant differences between HW and CF or between P1 and P2.
In Alisols, HW treatment gave the highest yield (24,460.0 kg·ha−1) and CK the lowest (16,208.7 kg·ha−1). HW, CF, P1, and P2 treatments increased the yield by 50.9%, 34.2%, 48.2%, and 46.6%, respectively, but there were no significant differences between the treatments (p > 0.05). Yields from the CK and HW Alisols groups were significantly higher than those of the corresponding groups in the Cambisols (p < 0.05).
Concentrations of TN, AP, and AK reflect the capacity of the soil to supply these nutrients. N, P, and K are essential elements for plant growth. Choudhary et al. [65] and Cai et al. [66] reported that TN, AN, AP, and AK were all significantly increased after fertilization, leading to increased production. Soil nutrients are the major yield-limiting factors. In this study, vegetable yields increased after fertilization, and P1 and P2 treatments gave the highest yields. A combination of organic manure and mineral fertilizers improves nutrient availability for plants and has a positive effect on crop yield [67]. Such combined application is a better approach for enhancing and sustaining soil fertility and crop yields than the application of chemical or organic fertilizers alone [68,69]. Alisols’ NH4+-N concentration was positively correlated with water spinach yield, as was the NO3-N concentration, because both NH4+-N and NO3-N are nutrients that are directly absorbed by the plant. OM was negatively correlated with the yield. These results indicate that the application of manure creates conditions for the proliferation of soil microorganisms and the secretion of organic acids, thereby inhibiting the growth of water spinach [33].
Nitrates are a basic component of soils and plants and are naturally present in most fruits and vegetables. Human nitrate intake mainly comes from vegetables, water sources, and additives/preservatives used in meat [70]. Nitrate accumulation in vegetables occurs when they absorb more than they require for sustainable growth. Approximately 5% of all dietary nitrates are reduced to nitrites in the saliva and gastrointestinal tract [71]. Nitrites are highly unstable and can be metabolized within the digestive tract to N-nitroso compounds, which comprise nitrosamines and nitrosamides [72,73]. Nitrosamines produced through acid catalysis of nitrites in certain nitrogen compounds are carcinogenic and volatile [74,75,76]. CF and P1 treatment significantly increased the nitrate content of water spinach in Cambisols (p < 0.05). CF (6.2 g·kg−1) and P1 treatment nitrates were 43.1 times and 23.5 times higher than the CK control (0.1 g·kg−1), respectively, while CF nitrates were 3.43 times the P2 treatment (p < 0.05).
All four treatments significantly increased the nitrate content of water spinach in Alisols (p < 0.05). P2 treatment resulted in the highest nitrate content (4.7 g·kg−1) and the CK control the lowest (0.05 g·kg−1). Nitrate contents after P2, CF, HW, and P1 treatments were 93.4, 88.6, 72.6, and 72.6 times the control value. The nitrate content in the Cambisols CK control was significantly higher than that in the Alisols control, and HW and P2 in the Alisols were significantly higher than in Cambisols (p < 0.05). Fertilization increased the nitrate content of water spinach, with higher proportions of chemical fertilizer giving higher nitrate concentrations.
HW and P2 treatments reduced the soluble sugar content of water spinach in Cambisols (p < 0.05) by 52.8% and 54.2%, respectively. The CK control had the highest content (0.7%) and P2 the lowest (0.3%). The soluble sugar content after P1 treatment was 2.1 and 2.2 times that of the HW and P2 treatments, respectively. However, there were no significant differences between the HW, CF, P2 treatments, and the CK, CF, and P1 treatments (p > 0.05). HW and CF treatments reduced the soluble sugar content of water spinach in the Alisols, whereas treatments P1 and P2 increased it. P2 treatment yielded the highest content (0.4%) and HW the lowest (0.2%). There were no significant differences in soluble sugar content between the corresponding treatments in the two soil types (p > 0.05).
Water-soluble vitamin C has two bioactive forms: l-ascorbic acid and dehydroascorbic acid. It is found naturally in various foods, particularly fruits and vegetables [77]. Ascorbic acid content is elevated in fresh produce grown under high-intensity light [78]. It regulates collagen synthesis, prevents scurvy, and protects healthy cells from oxidative damage by scavenging free radicals [79]. Combined treatments P1 and P2 significantly increased the vitamin C content of water spinach in Cambisols (p < 0.05), with P1 being the highest (10.6 mg·100 g−1), while HW treatment had the lowest (7.5 mg·100 g−1). The P1 and P2 treatments increased vitamin C by 39.5% and 19.7%, respectively, compared to the control. The P1 vitamin C content was 1.4, 1.3, and 1.2 times that of the HW, CF, and P2 treatments, respectively. The P2 vitamin C content was 1.4 times the HW treatment (p < 0.05), but there were no significant differences between the CK, HW, and CF groups, or between CF and P2. There were no significant differences in vitamin C in water spinach grown in Alisols (p > 0.05) with different treatments, which ranged from 8.4 mg·100 g−1 (P2) to 6.6 mg·100 g−1 (HW). Water spinach vitamin C was significantly higher after P1 treatment in Cambisols than in Alisols (p < 0.05).
Table 5 illustrates the effects of soil nutrient properties on the yield and quality (first axis) of water spinach. The first and second axes (encompassing 10 soil nutrient properties) explained 86.13% and 0.97%, respectively, of the yield and quality differences in Cambisols. The cumulative interpretation of the relationship between yield, quality, and soil nutrient properties reached 99.86%, indicating that the first two axes were sufficient to explain this relationship (which was mainly determined by the first axis). The corresponding values in Alisols were 72.97% and 0.74%, with the first axis again explaining most of the yield/quality–chemistry relationship (cumulative interpretation reached 99.60%).
From the two-dimensional sequence diagram (Figure 4A) of water spinach yield and quality and soil chemical properties, we found that the arrow lines of pH, EC, AP, AK, and NO3-N were the longest, indicating that these chemical properties played key roles in explaining the soil enzyme activities of Cambisols. The angles between EC, AP, AK, and nitrate were very small and the directions were the same, indicating very significant positive correlations. NO3-N showed a significant positive correlation with nitrate and there was a significant negative correlation between pH and nitrate, yield, and vitamin C.
From the two-dimensional sequence diagram (Figure 4B) of water spinach yield and quality and soil chemical properties, we found that the arrow lines of pH, EC, NO3-N, and NH4+-N were the longest, indicating that these chemical properties played key roles in explaining the soil enzyme activities of Alisols. pH had a significant positive correlation with soluble sugar and a very significant negative correlation with nitrate. EC and nitrate levels were significantly positively correlated. The angle between NO3-N and yield was very small and the direction was the same, showing a very significant positive correlation and significant positive correlations with vitamin C. The angle between NH4+-N and vitamin C was very small and the direction was the same, showing a very significant positive correlation and significant positive correlations with yield. Our results show that the addition of human excrement provides a variety of nutrients for spinach, promoting plant growth and vitamin C synthesis.
The pH of both soils was highly negatively correlated with nitrates, probably because the chemical fertilizers increased nitrogen levels in the soil and promoted plant root growth, enhancing their capacity to absorb nutrients and increasing the contents of basic ions (which is reflected in the increase in soil EC). Nitrification reduces soil pH and nitrates are absorbed by the root system and stored in the vegetables. There was a significant negative correlation between pH and yield, indicating that soil environments with too high or too low pH will negatively affect the yield and quality of water spinach.

4. Conclusions

Applying combinations of human waste and chemical fertilizers has more positive effects on soil chemical properties, soil enzyme activities, and water spinach yield and quality than the application of human waste or chemical fertilizers alone. The application of human waste promoted soil nutrients (TN, AP, AK, NH4+-N, and NO3-N), reduced the acidity of Cambisols and Alisols, and slowed soil salinization, repairing the soil and making it more suitable for crop planting. Lower pH enhances metal availability, which is not beneficial for the quality of plants, and human waste is more suitable for use in soil with pH > 5. HW increased the S-UE activity in Cambisols, while the P1 combination decreased S-CAT activity in Cambisols and the S-SC activity of Alisols. Human waste substitute strategies increased water spinach yield and vitamin C content, while also increasing nitrate content and reducing soluble sugar content. In addition, soil chemical properties are significantly related to soil enzyme activity, vegetable yield, and quality, indicating that soil enzyme activity, vegetable yield, and quality are closely related to soil nutrients and pH. We concluded that human waste substitute strategies can reduce the use of chemical fertilizers, increase soil fertility efficiency, and vegetable yield and quality. However, due to the lack of long-term field trials based on human waste, it is necessary to carefully test the effects of human waste on soil fertility and field crops. In addition, we also need to pay attention to the safety risk research of the environment after the application of human waste and make further efforts for the resource utilization of human waste and environmental protection.

Author Contributions

Conceptualization, C.Z. and X.Z.; methodology, X.W.; software, B.Y.; validation, H.C.; formal analysis, B.L.; investigation, C.Z. and H.C.; resources, B.Y.; data curation, B.L.; writing—original draft preparation, B.Y; writing—review and editing, X.Z.; visualization, H.C. All authors have read and agreed to the published version of the manuscript.

Funding

This work was financially supported by the Central Public-interest Scientific Institution Basal Research Fund (No. Y2021LM01) and the Nature Science Foundation of Tianjin (No. 19JCQNJC13400).

Institutional Review Board Statement

Not applicable.

Informed Consent Statement

Not applicable.

Data Availability Statement

Not applicable.

Acknowledgments

We sincerely appreciate the anonymous reviewers and Editor Zoe Xu for the critical and valuable comments to help improve this manuscript.

Conflicts of Interest

The authors have no conflict of interest in preparing and presenting the attached research.

References

  1. Hu, M.; Fan, B.; Wang, H.; Qu, B.; Zhu, S. Constructing the ecological sanitation: A review on technology and methods. J. Clean. Prod. 2016, 125, 1–21. [Google Scholar] [CrossRef]
  2. Adhikari, J.R.; Lohani, S.P. Design, installation, operation and experimentation of septic tank—UASB wastewater treatment system. Renew. Energy 2019, 143, 1406–1415. [Google Scholar] [CrossRef]
  3. Kim, J.; Kim, J.; Lee, C. Anaerobic co-digestion of food waste, human feces, and toilet paper: Methane potential and synergistic effect. Fuel 2019, 248, 189–195. [Google Scholar] [CrossRef]
  4. Cheng, S.; Li, Z.; Uddin, S.M.N.; Mang, H.-P.; Zhou, X.; Zhang, J.; Zheng, L.; Zhang, L. Toilet revolution in China. J. Environ. Manag. 2017, 216, 347–356. [Google Scholar] [CrossRef]
  5. McNeill, J.R.; Winiwarter, V. Breaking the Sod: Humankind, History, and Soil. Science 2004, 304, 1627–1629. [Google Scholar] [CrossRef] [Green Version]
  6. Smil, V. Enriching the Earth: Fritz Haber, Carl Bosch, and the Transformation of World Food Production; The MIT Press: Cambridge, MA, USA, 2000. [Google Scholar] [CrossRef]
  7. Kawa, N.C.; Ding, Y.; Kingsbury, J.; Goldberg, K.; Lipschitz, F.; Scherer, M.; Bonkiye, F. Night Soil: Origins, Discontinuities, and Opportunities for Bridging the Metabolic Rift. Ethnobiol. Lett. 2019, 10, 40–49. [Google Scholar] [CrossRef]
  8. Cofie, O.O.; Kranjac-Berisavljevic, G.; Drechsel, P. The use of human waste for peri-urban agriculture in Northern Ghana. Renew. Agric. Food Syst. 2005, 20, 73–80. [Google Scholar] [CrossRef]
  9. Snowdon, J.; Cliver, D.; Converse, J. Land disposal of mixed human and animal wastes: A review. Waste Manag. Res. 1989, 7, 121–134. [Google Scholar] [CrossRef]
  10. Morales, M.D.C.; Harris, L.; Öberg, G. Citizenshit: The Right to Flush and the Urban Sanitation Imaginary. Environ. Plan. A: Econ. Space 2014, 46, 2816–2833. [Google Scholar] [CrossRef] [Green Version]
  11. Innes, R. Economics of Agricultural Residuals and Overfertilization: Chemical Fertilizer Use, Livestock Waste, Manure Management, and Environmental Impacts. Encycl. Energy Nat. Resour. Environ. Econ. 2013, 19, 50–57. [Google Scholar] [CrossRef]
  12. Conti, F.; Toor, S.S.; Pedersen, T.H.; Seehar, T.H.; Nielsen, A.H.; Rosendahl, L.A. Valorization of animal and human wastes through hydrothermal liquefaction for biocrude production and simultaneous recovery of nutrients. Energy Convers. Manag. 2020, 216, 112925. [Google Scholar] [CrossRef]
  13. Colón, J.; Forbis-Stokes, A.A.; Deshusses, M.A. Anaerobic digestion of undiluted simulant human excreta for sanitation and energy recovery in less-developed countries. Energy Sustain. Dev. 2015, 29, 57–64. [Google Scholar] [CrossRef] [Green Version]
  14. Powell, J.M.; Gourley, C.J.P.; Rotz, C.A.; Weaver, D.M. Nitrogen use efficiency: A potential performance indicator and policy tool for dairy farms. Environ. Sci. Policy 2010, 13, 217–228. [Google Scholar] [CrossRef]
  15. Erisman, J.W.; Sutton, M.A.; Galloway, J.; Klimont, Z.; Winiwarter, W. How a century of ammonia synthesis changed the world. Nat. Geosci. 2008, 1, 636–639. [Google Scholar] [CrossRef]
  16. Gerber, P.J.; Uwizeye, A.; Schulte, R.P.O.; Opio, C.I.; de Boer, I.J.M. Nutrient use efficiency: A valuable approach to benchmark the sustainability of nutrient use in global livestock production? Curr. Opin. Environ. Sustain. 2014, 9–10, 122–130. [Google Scholar] [CrossRef]
  17. Galloway, J.N.; Aber, J.D.; Erisman, J.W.; Seitzinger, S.P.; Howarth, R.W.; Cowling, E.B.; Cosby, B.J. The Nitrogen Cascade. BioScience 2003, 53, 341–356. [Google Scholar] [CrossRef]
  18. Leip, A.; Billen, G.; Garnier, J.; Grizzetti, B.; Lassaletta, L.; Reis, S.; Simpson, D.; Sutton, M.A.; de Vries, W.; Weiss, F.; et al. Impacts of European livestock production: Nitrogen, sulphur, phosphorus and greenhouse gas emissions, land-use, water eutrophication and biodiversity. Environ. Res. Lett. 2015, 10, 115004. [Google Scholar] [CrossRef]
  19. Sutton, M.A.; Oenema, O.; Erisman, J.W.; Leip, A.; Van Grinsven, H.; Winiwarter, W. Too much of a good thing. Nature 2011, 472, 159–161. [Google Scholar] [CrossRef] [Green Version]
  20. Tian, G.; Granato, T.C.; Cox, A.E.; Pietz, R.I.; Carlson, C.R.; Abedin, Z. Soil Carbon Sequestration Resulting from Long-Term Application of Biosolids for Land Reclamation. J. Environ. Qual. 2009, 38, 61–74. [Google Scholar] [CrossRef]
  21. Ngone, M.; Koottatep, T.; Fakkaew, K.; Polprasert, C. Assessment of nutrient recovery, air emission and farmers’ perceptions of indigenous mound burning practice using animal and human wastes in Myanmar. Agric. Ecosyst. Environ. 2018, 261, 54–61. [Google Scholar] [CrossRef] [Green Version]
  22. Cheng, H.; Zhang, D.; Huang, B.; Song, Z.; Ren, L.; Hao, B.; Liu, J.; Zhu, J.; Fang, W.; Yan, D.; et al. Organic fertilizer improves soil fertility and restores the bacterial community after 1,3-dichloropropene fumigation. Sci. Total. Environ. 2020, 738, 140345. [Google Scholar] [CrossRef]
  23. Singh, S.; Mohan, R.R.; Rathi, S.; Raju, N.J. Technology options for faecal sludge management in developing countries: Benefits and revenue from reuse. Environ. Technol. Innov. 2017, 7, 203–218. [Google Scholar] [CrossRef] [Green Version]
  24. MacRae, R.J.; Hill, S.B.; Mehuys, G.R.; Henning, J. Farm-Scale Agronomic and Economic Conversion from Conventional to Sustainable Agriculture. Adv. Agron. 1990, 43, 155–198. [Google Scholar] [CrossRef]
  25. Garzón, E.; González-Andrés, F.; García-Martínez, V.M.; De Paz, J.M. Mineralization and Nutrient Release of an Organic Fertilizer Made by Flour, Meat, and Crop Residues in Two Vineyard Soils with Different pH Levels. Commun. Soil Sci. Plant Anal. 2011, 42, 1485–1496. [Google Scholar] [CrossRef]
  26. Nannipieri, P.; Giagnoni, L.; Landi, L.; Renella, G. Role of Phosphatase Enzymes in Soil. Soil Biol. 2010, 260, 215–243. [Google Scholar] [CrossRef]
  27. Nash, D.M.; Haygarth, P.; Turner, B.; Condron, L.M.; McDowell, R.; Richardson, A.E.; Watkins, M.; Heaven, M. Using organic phosphorus to sustain pasture productivity: A perspective. Geoderma 2014, 221–222, 11–19. [Google Scholar] [CrossRef]
  28. Song, H.; Guo, J.; Ren, T.; Chen, Q.; Li, B.; Wang, J. Increase of Soil pH in a Solar Greenhouse Vegetable Production System. Soil Sci. Soc. Am. J. 2012, 76, 2074–2082. [Google Scholar] [CrossRef]
  29. Wang, J.; Tu, X.; Zhang, H.; Cui, J.; Ni, K.; Chen, J.; Cheng, Y.; Zhang, J.; Chang, S.X. Effects of ammonium-based nitrogen addition on soil nitrification and nitrogen gas emissions depend on fertilizer-induced changes in pH in a tea plantation soil. Sci. Total. Environ. 2020, 747, 141340. [Google Scholar] [CrossRef]
  30. Zhao, W.; Cai, Z.-C.; Xu, Z.-H. Does ammonium-based N addition influence nitrification and acidification in humid subtropical soils of China? Plant Soil 2007, 297, 213–221. [Google Scholar] [CrossRef]
  31. Stevens, C.J.; Dise, N.B.; Gowing, D.J. Regional trends in soil acidification and exchangeable metal concentrations in relation to acid deposition rates. Environ. Pollut. 2009, 157, 313–319. [Google Scholar] [CrossRef] [PubMed] [Green Version]
  32. Tang, C.; Conyers, M.K.; Nuruzzaman, M.; Poile, G.J.; Liu, D.L. Biological amelioration of subsoil acidity through managing nitrate uptake by wheat crops. Plant Soil 2010, 338, 383–397. [Google Scholar] [CrossRef]
  33. Das, I.; Pradhan, M. Potassium-Solubilizing Microorganisms and Their Role in Enhancing Soil Fertility and Health. In Potassium Solubilizing Microorganisms for Sustainable Agriculture; Springer: New Delhi, India, 2016; pp. 281–291. [Google Scholar] [CrossRef]
  34. Lv, H.; Zhao, Y.; Wang, Y.; Wan, L.; Wang, J.; Butterbach-Bahl, K.; Lin, S. Conventional flooding irrigation and over fertilization drives soil pH decrease not only in the top but also in subsoil layers in solar greenhouse vegetable production systems. Geoderma 2020, 363, 114156. [Google Scholar] [CrossRef]
  35. Cong, R.H.; Zhang, L.; Lu, Y.H.; Huang, Q.H.; Shi, X.J.; Li, X.K.; Ren, T.; Lu, J.W. Adsorption-desorption characteristics of soil ammonium under long-term straw returning condition. J. Plant Nutr. Fertil. 2017, 23, 380–388. (In China) [Google Scholar] [CrossRef]
  36. Ste-Marie, C.; Paré, D. Soil, pH and N availability effects on net nitrification in the forest floors of a range of boreal forest stands. Soil Biol. Biochem. 1999, 31, 1579–1589. [Google Scholar] [CrossRef]
  37. Cheng, Y.; Wang, J.; Mary, B.; Zhang, J.-B.; Cai, Z.-C.; Chang, S.X. Soil pH has contrasting effects on gross and net nitrogen mineralizations in adjacent forest and grassland soils in central Alberta, Canada. Soil Biol. Biochem. 2013, 57, 848–857. [Google Scholar] [CrossRef]
  38. Xiukang, W.; Zhanbin, L.; Yingying, X. Effects of mulching and nitrogen on soil temperature, water content, nitrate-N content and maize yield in the Loess Plateau of China. Agric. Water Manag. 2015, 161, 53–64. [Google Scholar] [CrossRef]
  39. Monreal, C.M.; Bergstrom, D.W. Soil enzymatic factors expressing the influence of land use, tillage system and texture on soil biochemical quality. Can. J. Soil Sci. 2000, 80, 419–428. [Google Scholar] [CrossRef]
  40. García-Ruiz, R.; Ochoa, V.; Hinojosa, M.B.; Carreira, J.A. Suitability of enzyme activities for the monitoring of soil quality improvement in organic agricultural systems. Soil Biol. Biochem. 2008, 40, 2137–2145. [Google Scholar] [CrossRef]
  41. Zhang, Y.L.; Chen, L.J.; Chen, X.H.; Tan, M.L.; Duan, Z.H.; Wu, Z.J.; Li, X.J.; Fan, X.H. Response of soil enzyme activity to long-term restoration of desertified land. Catena 2015, 133, 64–70. [Google Scholar] [CrossRef]
  42. Turner, B.L.; Haygarth, P.M. Phosphatase activity in temperate pasture soils: Potential regulation of labile organic phosphorus turnover by phosphodiesterase activity. Sci. Total. Environ. 2005, 344, 27–36. [Google Scholar] [CrossRef]
  43. Olander, L.P.; Vitousek, P.M. Regulation of soil phosphatase and chitinase activityby N and P availability. Biogeochemistry 2000, 49, 175–191. [Google Scholar] [CrossRef]
  44. Deforest, J.L.; Smemo, K.A.; Burke, D.J.; Elliott, H.L.; Becker, J.C. Soil microbial responses to elevated phosphorus and pH in acidic temperate deciduous forests. Biogeochemistry 2011, 109, 189–202. [Google Scholar] [CrossRef]
  45. García, C.; Hernandez, T. Biological and biochemical indicators in derelict soils subject to erosion. Soil Biol. Biochem. 1997, 29, 171–177. [Google Scholar] [CrossRef]
  46. Visser, S.; Parkinson, D. Soil biological criteria as indicators of soil quality: Soil microorganisms. Am. J. Altern. Agric. 1992, 7, 33–37. [Google Scholar] [CrossRef]
  47. Quan, G.L.; Xie, K.Y.; Tong, Z.Y.; Li, X.L.; Wan, X.F. The effect of compound bio-fertilizers on soil physical and chemical properties and soil enzyme activity in Leymus chinensis steppe. Acta Prataculturae Sin. 2016, 25, 27–37. [Google Scholar] [CrossRef]
  48. Liu, E.; Yan, C.; Mei, X.; He, W.; Bing, S.H.; Ding, L.; Liu, Q.; Liu, S.; Fan, T. Long-term effect of chemical fertilizer, straw, and manure on soil chemical and biological properties in northwest China. Geoderma 2010, 158, 173–180. [Google Scholar] [CrossRef]
  49. Liu, C.; Xu, J.; Ding, N.; Fu, Q.; Guo, B.; Lin, Y.; Li, H.; Li, N. The effect of long-term reclamation on enzyme activities and microbial community structure of saline soil at Shangyu, China. Environ. Earth Sci. 2012, 69, 151–159. [Google Scholar] [CrossRef]
  50. Dick, W.A.; Cheng, L.; Wang, P. Soil acid and alkaline phosphatase activity as pH adjustment indicators. Soil Biol. Biochem. 2000, 32, 1915–1919. [Google Scholar] [CrossRef]
  51. Singh, K. Microbial and Enzyme Activities of Saline and Sodic Soils. Land Degrad. Dev. 2015, 27, 706–718. [Google Scholar] [CrossRef]
  52. Sahrawat, K.L. Relationships between soil urease activity and other properties of some tropical wetland rice soils. Nutr. Cycl. Agroecosys. 1983, 4, 145–150. [Google Scholar] [CrossRef] [Green Version]
  53. Burke, D.J.; Weintraub, M.; Hewins, C.R.; Kalisz, S. Relationship between soil enzyme activities, nutrient cycling and soil fungal communities in a northern hardwood forest. Soil Biol. Biochem. 2011, 43, 795–803. [Google Scholar] [CrossRef]
  54. Li, Y.-T.; Rouland-LeFèvre, C.; Benedetti, M.F.; Li, F.-B.; Pando, A.; Lavelle, P.; Dai, J. Microbial biomass, enzyme and mineralization activity in relation to soil organic C, N and P turnover influenced by acid metal stress. Soil Biol. Biochem. 2009, 41, 969–977. [Google Scholar] [CrossRef]
  55. Weintraub, S.R.; Wieder, W.R.; Cleveland, C.C.; Townsend, A.R. Organic matter inputs shift soil enzyme activity and allocation patterns in a wet tropical forest. Biogeochemistry 2012, 114, 313–326. [Google Scholar] [CrossRef]
  56. Kawaguschi, S.; Payera, S.M.; Yamada, Y. Soil Properties and Enzyme Activity along Narrow Topographic Environments of Salna Series Soil in Bangladesh; Bulletin of the Institute of Tropical Agriculture, Kyushu University: Fukuoka, Japan, 1995; Volume 18, pp. 71–79. [Google Scholar]
  57. Jiang, Y.; Liu, M.; Zhang, J.; Chen, Y.; Chen, X.; Chen, L.; Li, H.; Zhang, X.-X.; Sun, B. Nematode grazing promotes bacterial community dynamics in soil at the aggregate level. ISME J. 2017, 11, 2705–2717. [Google Scholar] [CrossRef] [PubMed]
  58. Kalembasa, S.; Symanowicz, B. Enzymatic activity of soil after applying various waste organic materials, ash, and mineral fertilizers. Pol. J. Environ. Studies 2012, 21, 1635–1641. [Google Scholar] [CrossRef]
  59. Arif, M.S.; Riaz, M.; Shahzad, S.M.; Yasmeen, T.; Ashraf, M.; Siddique, M.; Mubarik, M.S.; Bragazza, L.; Buttler, A. Fresh and composted industrial sludge restore soil functions in surface soil of degraded agricultural land. Sci. Total. Environ. 2018, 619–620, 517–527. [Google Scholar] [CrossRef]
  60. Yang, J.; Yang, F.; Yang, Y.; Xing, G.; Deng, C.; Shen, Y.; Luo, L.; Li, B.; Yuan, H. A proposal of “core enzyme” bioindicator in long-term Pb-Zn ore pollution areas based on topsoil property analysis. Environ. Pollut. 2016, 213, 760–769. [Google Scholar] [CrossRef] [Green Version]
  61. National Bureau of Statistics of the People’s Republic of China. China Statistical Yearbook; China Statistics Press: Beijing, China, 2020; pp. 383–385.
  62. Fei, C.; Zhang, S.R.; Liang, B.; Li, J.L.; Jiang, L.H.; Xu, Y.; Ding, X.D. Characteristics and correlation analysis of soil microbial biomass phosphorus in greenhouse vegetable soil with different planting years. Acta Agric. Boreali-Sin. 2018, 33, 195–202, (In Chinese with English abstract). [Google Scholar] [CrossRef]
  63. Chang, J.; Wu, X.; Wang, Y.; Meyerson, L.A.; Gu, B.; Min, Y.; Xue, H.; Peng, C.; Ge, Y. Does growing vegetables in plastic greenhouses enhance regional ecosystem services beyond the food supply? Front. Ecol. Environ. 2013, 11, 43–49. [Google Scholar] [CrossRef]
  64. Pu, C.; Liu, H.; Ding, G.-C.; Sun, Y.; Yu, X.; Chen, J.; Ren, J.; Gong, X. Impact of direct application of biogas slurry and residue in fields: In situ analysis of antibiotic resistance genes from pig manure to fields. J. Hazard. Mater. 2018, 344, 441–449. [Google Scholar] [CrossRef]
  65. Choudhary, M.; Panday, S.C.; Meena, V.S.; Singh, S.; Yadav, R.P.; Mahanta, D.; Mondal, T.; Mishra, P.K.; Bisht, J.K.; Pattanayak, A. Long-term effects of organic manure and inorganic fertilization on sustainability and chemical soil quality indicators of soybean-wheat cropping system in the Indian mid-Himalayas. Agric. Ecosyst. Environ. 2018, 257, 38–46. [Google Scholar] [CrossRef]
  66. Cai, A.; Xu, M.; Wang, B.; Zhang, W.; Liang, G.; Hou, E.; Luo, Y. Manure acts as a better fertilizer for increasing crop yields than synthetic fertilizer does by improving soil fertility. Soil Tillage Res. 2019, 189, 168–175. [Google Scholar] [CrossRef]
  67. Diacono, M.; Montemurro, F. Long-term effects of organic amendments on soil fertility. A review. Agron. Sustain. Dev. 2010, 30, 401–422. [Google Scholar] [CrossRef] [Green Version]
  68. Zhang, W.; Xu, M.; Wang, X.; Huang, Q.; Nie, J.; Li, Z.; Li, S.; Hwang, S.W.; Lee, K.B. Effects of organic amendments on soil carbon sequestration in paddy fields of subtropical China. J. Soils Sediments 2012, 12, 457–470. [Google Scholar] [CrossRef]
  69. Yang, X.-Y.; Sun, B.-H.; Zhang, S.-L. Trends of Yield and Soil Fertility in a Long-Term Wheat-Maize System. J. Integr. Agric. 2014, 13, 402–414. [Google Scholar] [CrossRef]
  70. Wolff, I.A.; Wasserman, A.E. Nitrates, Nitrites, and Nitrosamines. Science 1972, 177, 15–19. [Google Scholar] [CrossRef]
  71. Prasad, S.; Chetty, A.A. Nitrate-N determination in leafy vegetables: Study of the effects of cooking and freezing. Food Chem. 2008, 106, 772–780. [Google Scholar] [CrossRef]
  72. Ahn, H.J.; Yook, H.S.; Rhee, M.S.; Lee, C.H.; Cho, Y.J.; Byun, M.W. Application of Gamma Irradiation on Breakdown of Hazardous Volatile N-Nitrosamines. J. Food Sci. 2002, 67, 596–599. [Google Scholar] [CrossRef]
  73. Ezeagu, I.E. Nitrate and nitrite contents in ogi and the changes occurring during storage. Food Chem. 1996, 56, 77–79. [Google Scholar] [CrossRef]
  74. Pérez-Olmos, R.; Herrero, R.; Lima, J.L.F.C.; MCBSM Montenegro. Sequential potentiometric determination of chloride and nitrate in meat products. Food Chem. 1997, 59, 305–311. [Google Scholar] [CrossRef]
  75. Swann, P.F. The toxicology of nitrate, nitrite andn-nitroso compounds. J. Sci. Food Agric. 1975, 26, 1761–1770. [Google Scholar] [CrossRef]
  76. White, J.W. Relative significance of dietary sources of nitrate and nitrite. J. Agric. Food Chem. 1975, 23, 886–891. [Google Scholar] [CrossRef]
  77. Pénicaud, C.; Peyron, S.; Bohuon, P.; Gontard, N.; Guillard, V. Ascorbic acid in food: Development of a rapid analysis technique and application to diffusivity determination. Food Res. Int. 2010, 43, 838–847. [Google Scholar] [CrossRef]
  78. Lee, S.K.; Kader, A.A. Preharvest and postharvest factors influencing vitamin C content of horticultural crops. Postharvest Biol. Technol. 2000, 20, 207–220. [Google Scholar] [CrossRef] [Green Version]
  79. Ngo, B.; Van Riper, J.; Cantley, L.C.; Yun, J. Targeting cancer vulnerabilities with high-dose vitamin C. Nat. Rev. Cancer 2019, 19, 271–282. [Google Scholar] [CrossRef]
Figure 1. (A) and (C) are the changes of NH4+-N and NO3-N in soil of Cambisols at different periods, and (B) and (D) are the changes of NH4+-N and NO3-N in soil of Alisols at different periods. “n” represents the treatment of soil Cambisols, and “e” represents the treatment of soil Alisols. CK = no fertilization; HW = human waste application; CF = chemical fertilizer application; P1 = 1/3 human waste to chemical fertilizer; P2 = 2/3 human waste to chemical fertilizer. The mean value accompanying the same letter in the same period (N = 3) in Duncan’s multiple range test showed no statistically significant difference (p = 0.05).
Agronomy 11 02232 g001
Figure 2. Mean value accompanying the same letter in the same period (N = 3) in Duncan’s multiple range test difference test showed no statistically significant difference (p = 0.05).
Agronomy 11 02232 g002
Figure 3. (A) is biplot of the first two axes of the RDA for Cambisols’ chemical properties and Cambisols’ enzyme activities; (B) is biplot of the first two axes of the RDA for Alisols’ chemical properties and Alisols’ enzyme activities.
Agronomy 11 02232 g003
Figure 4. (A) is biplot of the first two axes of the RDA for Cambisols’ chemical properties and vegetable’s yield and quality; (B) is biplot of the first two axes of the RDA for Alisols’ chemical properties and vegetable’s yield and quality.
Agronomy 11 02232 g004
Table 1. Fertilizer application rates to soil in different treatments.
TreatmentHuman Waste (g · pot−1)Urea (g · pot−1)Superphosphate (g · pot−1)Potassium Sulfate (g · pot−1)
CK----
HW136.6---
CF-1.013.21.0
P145.50.78.80.7
P291.00.34.40.3
Table 2. Soil chemical properties.
Soil TypesTreatmentTN (%)TC (%)C/NAP (mg · kg−1)AK (mg · kg−1)OM (g · kg−1)pH (1:2.5)EC (mS · cm−1)
Cambisolsn-CK0.04 ± 0.00aB1.91 ± 0.00aA46.17 ± 1.80aA6.8 ± 0.0cB54.8 ± 2.6cA6.0 ± 0.2aB8.5 ± 0.1aA0.5 ± 0.0bA
n-HW0.05 ± 0.01aB1.90 ± 0.00aB39.06 ± 4.99aA7.2 ± 0.4cB60.4 ± 2.6bcA6.1 ± 0.0aB8.2 ± 0.1abA1.0 ± 0.4bA
n-CF0.05 ± 0.01aB1.90 ± 0.01aA39.50 ± 5.10aA35.2 ± 5.6aB122.2 ± 10.1aA6.1 ± 0.2aB8.0 ± 0.1bA2.0 ± 0.4aA
n-P10.05 ± 0.00aB1.92 ± 0.00aA41.22 ± 0.80aB24.5 ± 3.6bB76.1 ± 3.3bB6.1 ± 0.1aB8.1 ± 0.1bA1.2 ± 0.3abA
n-P20.05 ± 0.00aB1.90 ± 0.01aB40.98 ± 1.97aB14.6 ± 1.1cB67.8 ± 4.8bcA6.2 ± 0.2aB8.2 ± 0.0abA0.7 ± 0.1bB
Alisolse-CK0.23 ± 0.01aA1.96 ± 0.03aA8.63 ± 0.18aB43.8 ± 0.7dA39.9 ± 1.9cB35.3 ± 0.5aA4.9 ± 0.04aB0.3 ± 0.0dB
e-HW0.23 ± 0.00aA1.95 ± 0.01aA8.40 ± 0.11abB47.1 ± 1.1dA53.0 ± 2.0bcA34.9 ± 0.2aA4.6 ± 0.06bB1.0 ± 0.3cdA
e-CF0.24 ± 0.01aA1.90 ± 0.06aA8.09 ± 0.14bB86.0 ± 4.6aA113.5 ± 8.2aA33.9 ± 1.2aA4.2 ± 0.02dA3.3 ± 0.7aA
e-P10.23 ± 0.00aA1.90 ± 0.02aA8.19 ± 0.14abA64.6 ± 0.8bA117.2 ± 4.0aA34.2 ± 0.2aA4.3 ± 0.044dB2.4 ± 0.3abA
e-P20.24 ± 0.00aA1.99 ± 0.03aA8.47 ± 0.13abA57.7 ± 1.6cA69.1 ± 13.5bA35.9 ± 0.9aA4.4 ± 0.01cB1.7 ± 0.3bcA
Note: TN: Total nitrogen; TC: Total carbon; AP: Available phosphorus; AK: Available potassium; OM: Organic matter; EC: Electrical conductivity. Values are means (N = 3) ± standard errors. Lowercase letters indicate significant differences between different treatments under the same soil type (p ≤ 0.05); uppercase letters indicate significant differences between different soil types under the same treatment (p ≤ 0.05) as determined by Duncan’s multiple range test. Number of replications (N) = 3. “n” represents the treatment of soil Cambisols, and “e” represents the treatment of soil Alisols.
Table 3. Summary of the RDA results for soil enzyme activities in relation to soil chemical properties.
CambisolsAlisols
AxesAxis IAxis IIAxis IIIAxis IVAxis IAxis IIAxis IIIAxis IV
Eigenvalues0.85890.00060.00000.00000.93740.00310.0000-
Cumulative percentage variance of soil enzyme (%)85.8985.9585.9585.9593.7494.0594.06-
Soil enzyme activity-soil chemical properties correlations0.92710.87670.92600.89380.96980.96890.9049-
Cumulative percentage variance of soil enzyme activity-soil chemical properties correlations (%)99.93100.00100.00100.0099.67100.00100.00-
Sum of all canonical eigenvalues0.85950.9405
Sum of all eigenvalues1.0001.000
Table 4. Water spinach yield and quality.
Soil TypesTreatmentsYield (kg ha−1)Nitrate (g · kg−1)Soluble Sugar (%)Vitamin C (mg 100 g−1)
Cambisolsn-CK4272.6 ± 424.7cB0.14 ± 0.00cA0.72 ± 0.06aA7.6 ± 0.0cA
n-HW9558.5 ± 469.8bB3.09 ± 1.51abcB0.34 ± 0.08bA7.5 ± 0.6cA
n-CF12,103.7 ± 2542.8bA6.17 ± 0.27aA0.41 ± 0.10abA8.0 ± 0.5bcA
n-P119,296.0 ± 1577.2aA3.43 ± 1.45abA0.71 ± 0.18aA10.6 ± 0.4aA
n-P218,385.4 ± 988.8aA1.80 ± 0.51bcB0.33 ± 0.03bA9.1 ± 0.5bA
Alisolse-CK16,208.7 ± 1333.6aA0.05 ± 0.01bB0.36 ± 0.12aA7.6 ± 0.5aA
e-HW24,460.0 ± 3085.1aA3.63 ± 0.79aA0.25 ± 0.01aA6.6 ± 0.7aA
e-CF21,754.3 ± 3487.3aA4.43 ± 0.72aA0.25 ± 0.01aA6.8 ± 1.5aA
e-P124,015.2 ± 1391.1aA3.63 ± 0.37aA0.40 ± 0.04aA7.7 ± 0.4aB
e-P223,767.8 ± 2064.7aA4.67 ± 0.84aA0.41 ± 0.08aA8.4 ± 0.2aA
Note: Values are mean (N = 3) ± standard error. Lowercase letters indicate significant differences between different treatments under the same soil type (p ≤ 0.05); uppercase letters indicate significant differences between different soil types under the same treatment (p ≤ 0.05) as determined by Duncan’s multiple range test. Number of replications (N) = 3. “n” represents the treatment of soil Cambisols, and “e” represents the treatment of soil Alisols.
Table 5. Summary of the RDA results for yield and quality of water spinach in relation to soil chemical properties.
CambisolsAlisols
AxesAxis IAxis IIAxis IIIAxis IVAxis IAxis IIAxis IIIAxis IV
Eigenvalues0.86130.00970.00120.00000.72970.00740.00290.0000
Cumulative interpretation of vegetable yield and quality characteristics (%)86.1387.1087.2287.2372.9773.7174.0074.01
Vegetable yield and quality-soil chemical properties correlations0.93380.94850.94690.87370.86090.83760.77170.8573
Cumulative percentage variance of vegetable yield and quality-soil chemical properties correlations (%)98.7599.86100.00100.0098.5999.60100.00100.00
Sum of all canonical eigenvalues0.87100.7371
Sum of all eigenvalues1.0001.000
Publisher’s Note: MDPI stays neutral with regard to jurisdictional claims in published maps and institutional affiliations.

