
Optimal Planting Date of Kernza Intermediate Wheatgrass Intercropped with Red Clover


Abstract
:1. Introduction
2. Materials and Methods
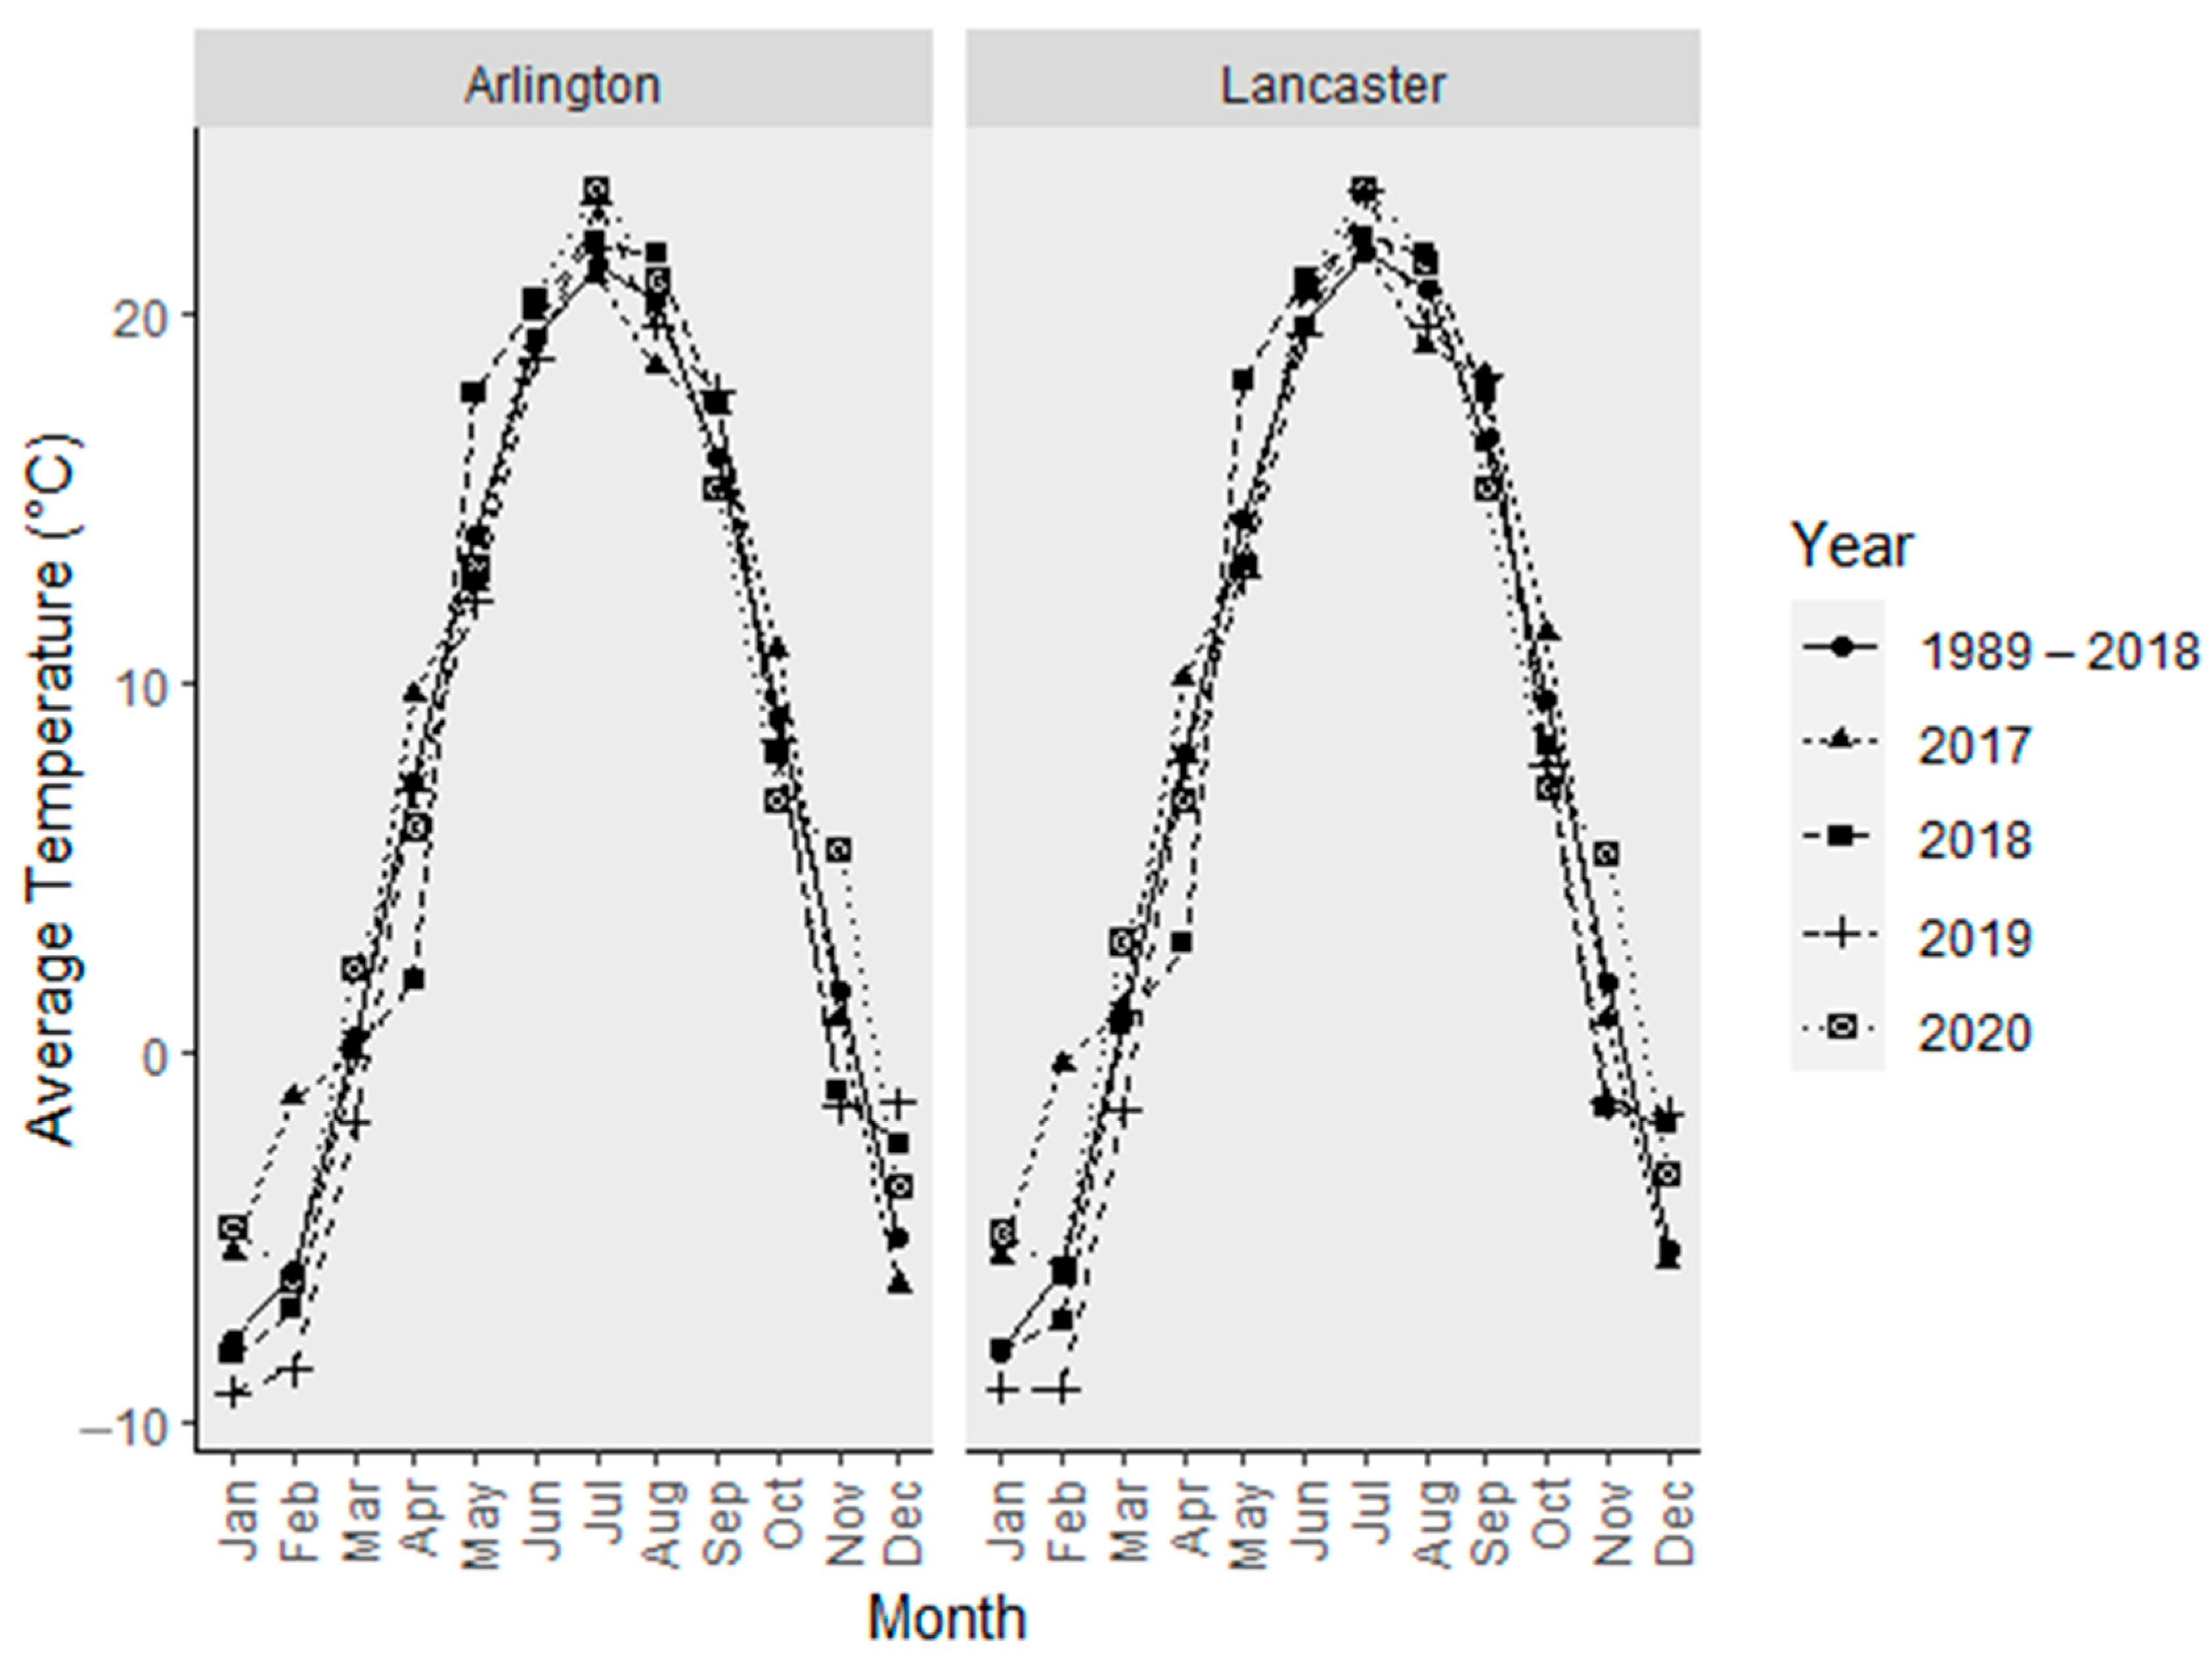
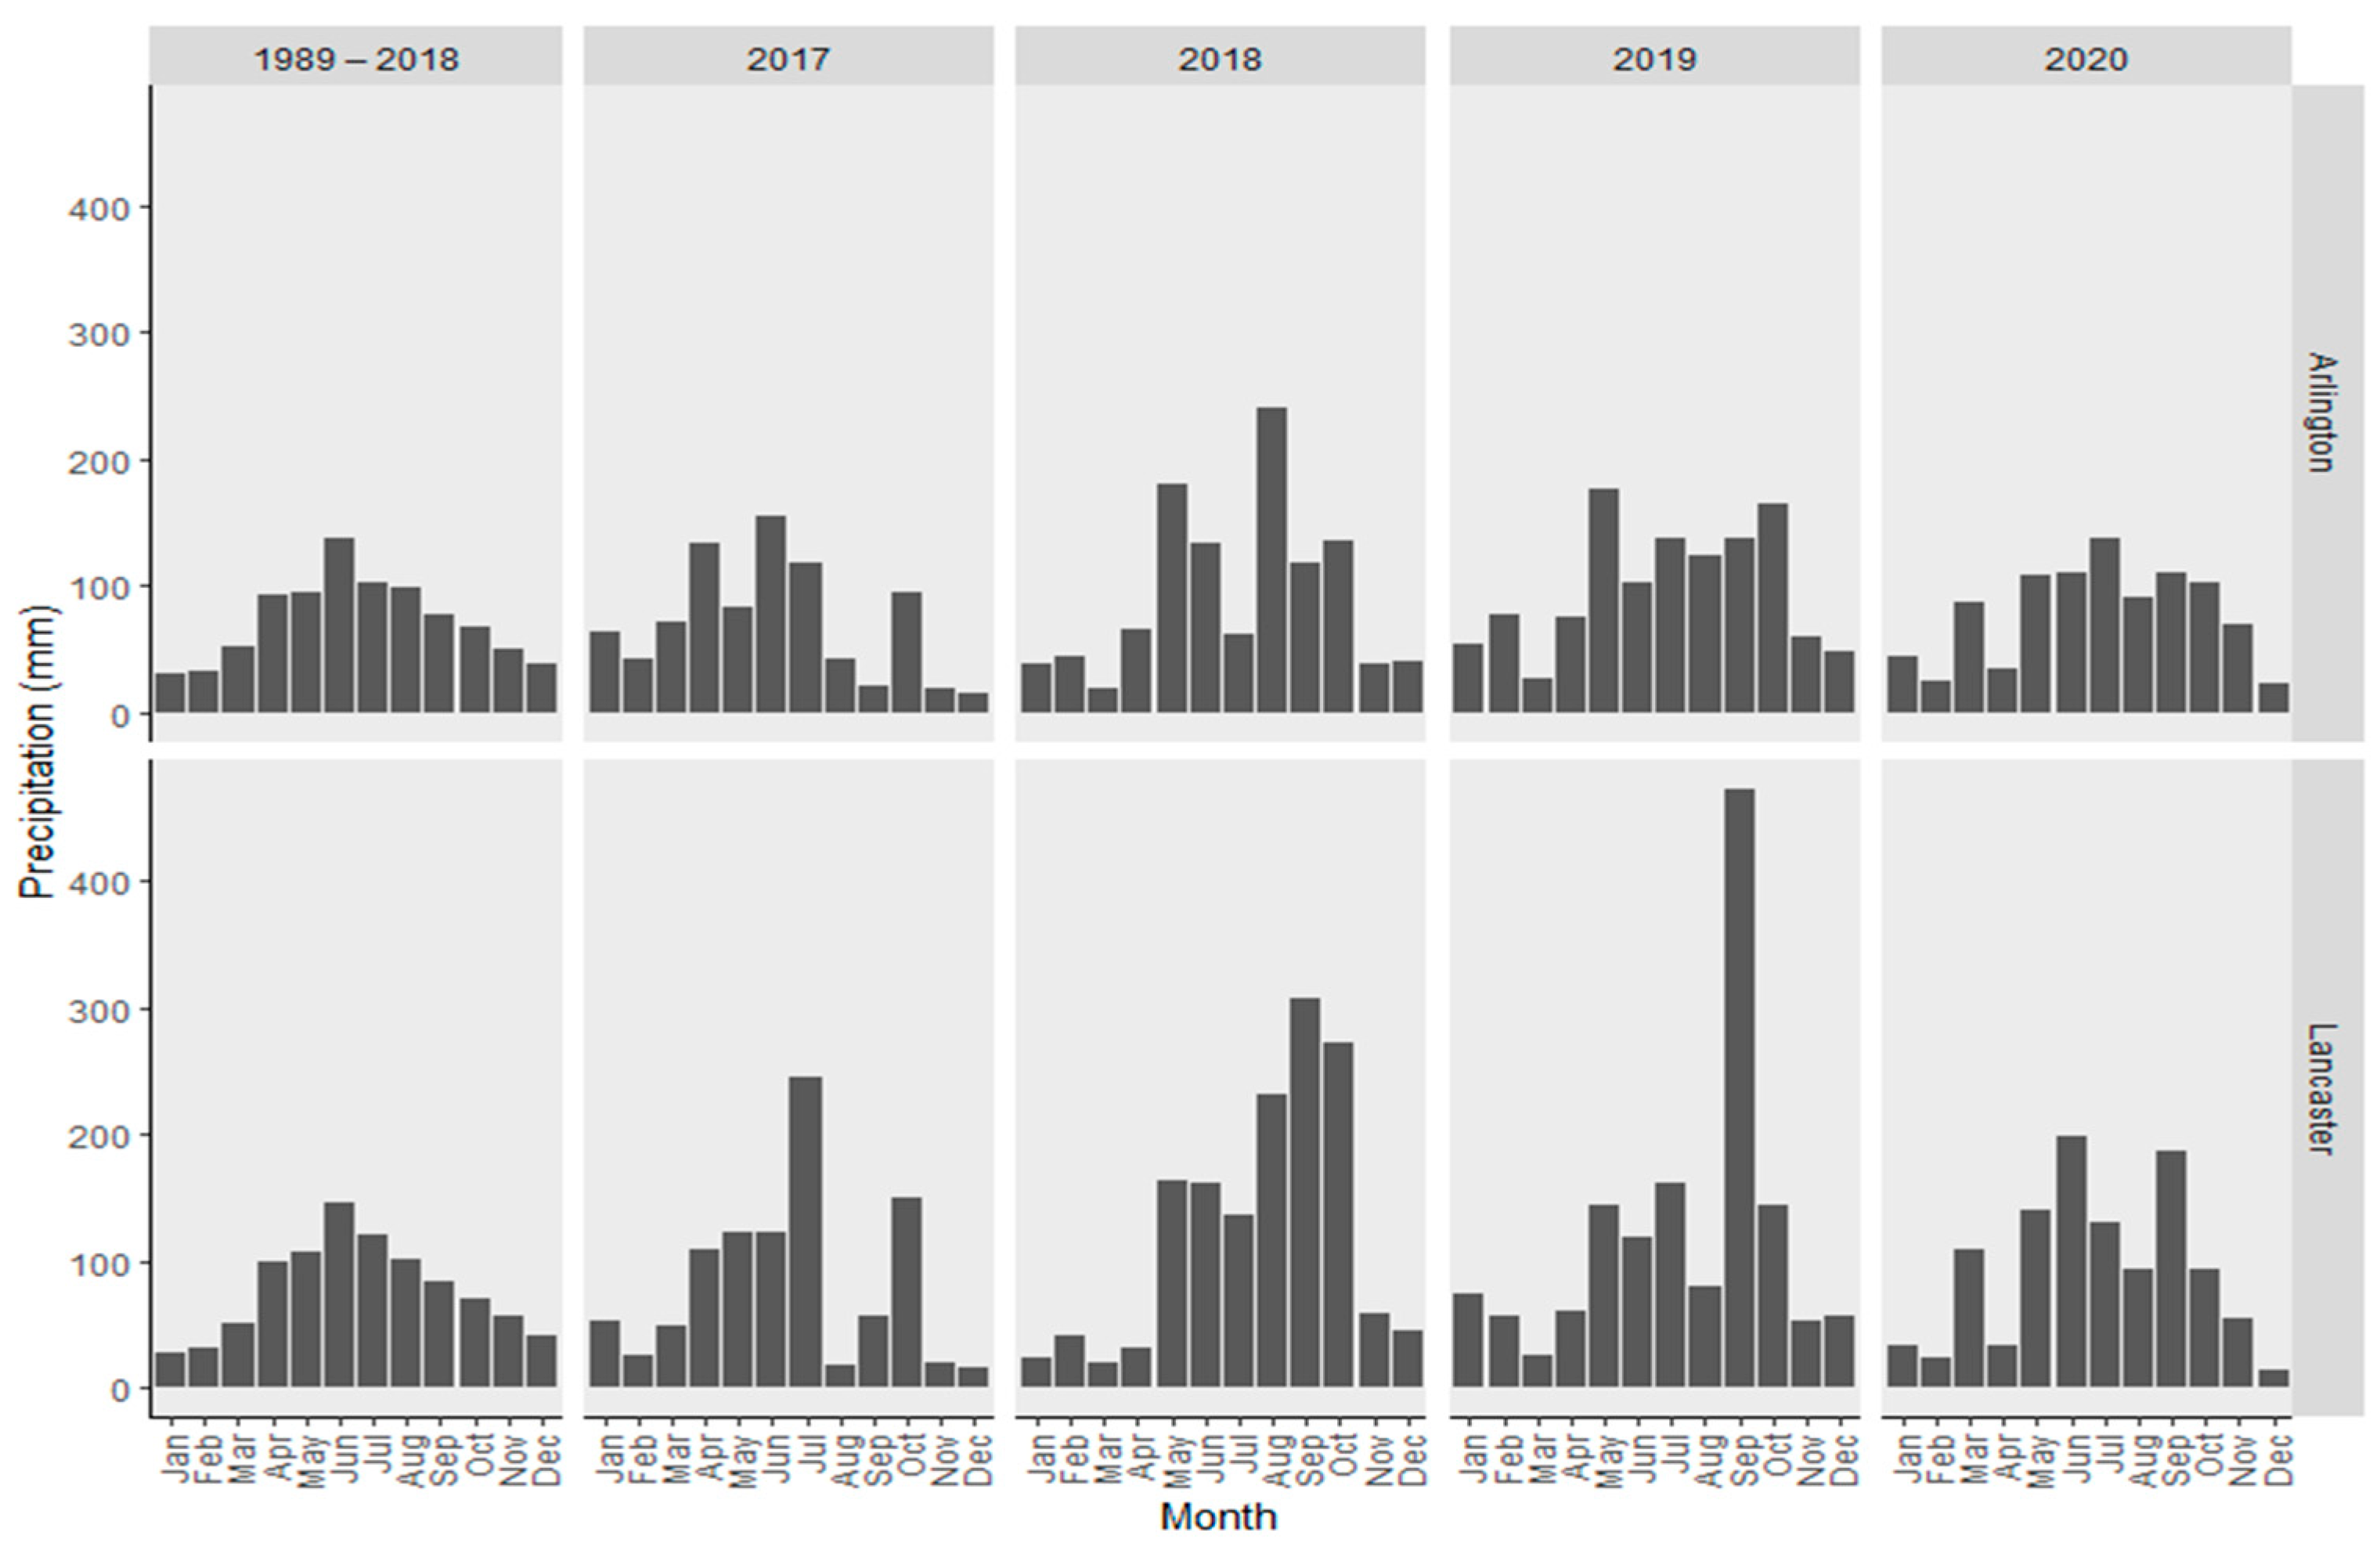
2.1. Site Characterization
2.2. Experimental Design and Management
2.3. Forage and Grain Sampling
2.4. Statistical Analyses
3. Results
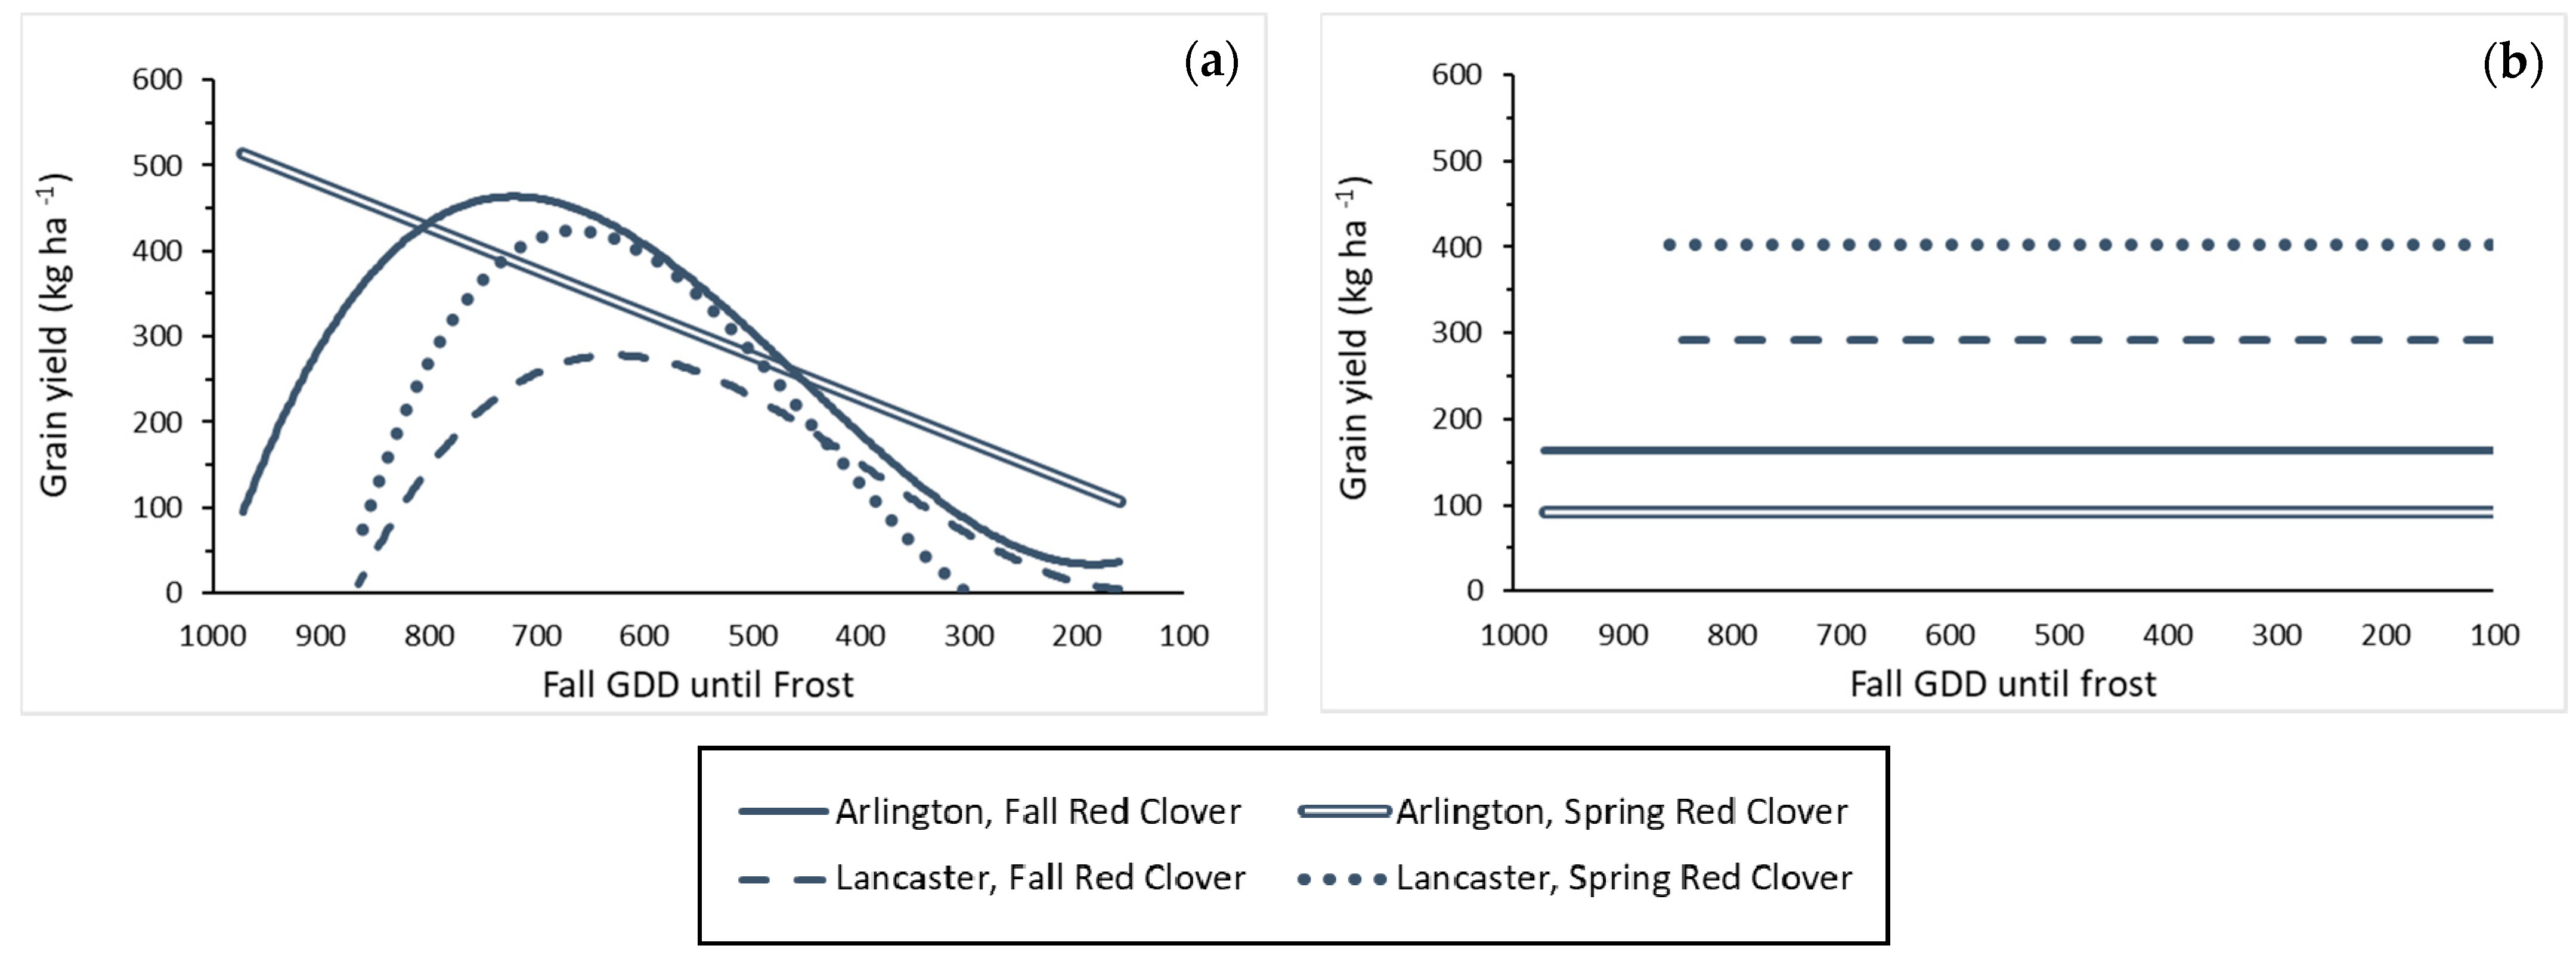
3.1. Grain Yield
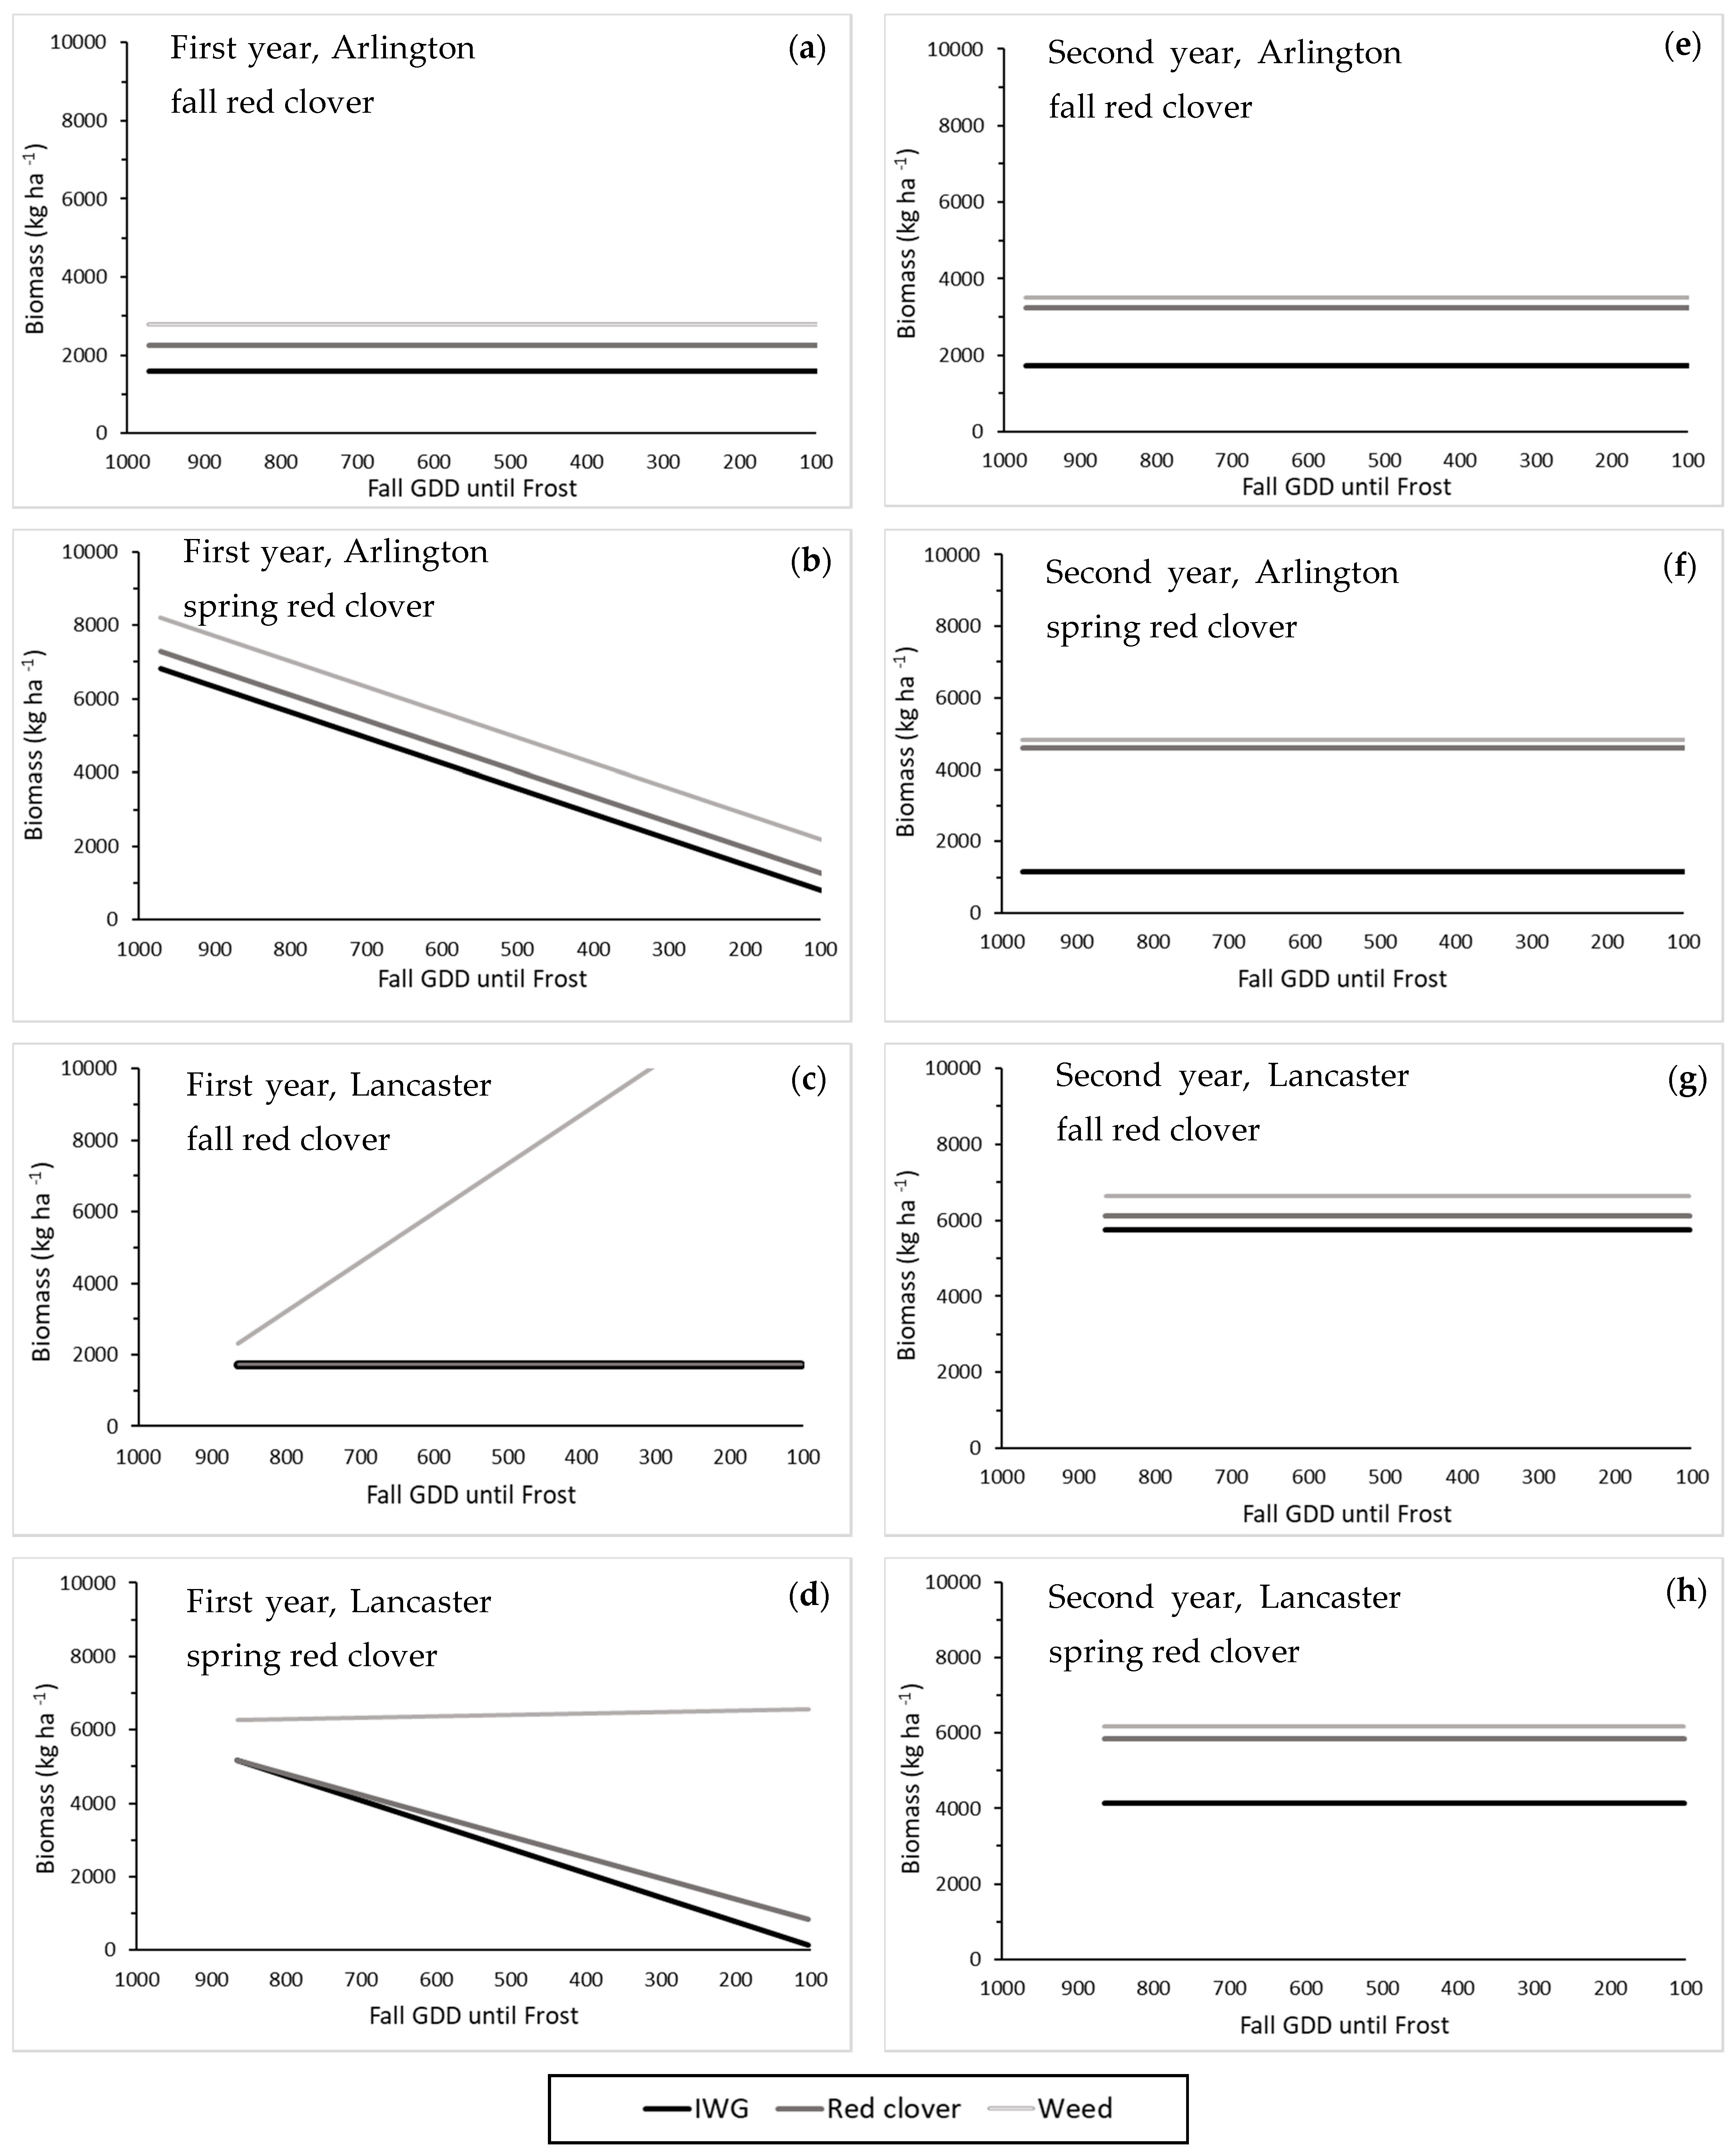
3.2. Intermediate Wheatgrass Summer Biomass
3.3. Fall and Total Intermediate Wheatgrass Biomass
3.4. Red Clover Summer Biomass
3.5. Weed Summer Biomass
3.6. Optimal Planting Dates
4. Discussion
4.1. Intermediate Wheatgrass Planting Date
4.2. Red Clover Planting Season
4.3. Planting Intermediate Wheatgrass in the Spring
5. Conclusions
Supplementary Materials
Author Contributions
Funding
Data Availability Statement
Acknowledgments
Conflicts of Interest
References
- Pimentel, D.; Cerasale, D.; Stanley, R.C.; Perlman, R.; Newman, E.M.; Brent, L.C.; Mullan, A.; Chang, D.T. Annual vs. perennial grain production. Agric. Ecosyst. Environ. 2012, 161, 1–9. [Google Scholar] [CrossRef]
- Crews, T.E.; Carton, W.; Olsson, L. Is the future of agriculture perennial? Imperatives and opportunities to reinvent agriculture by shifting from annual monocultures to perennial polycultures. Glob. Sustain. 2018, 1, e11. [Google Scholar] [CrossRef] [Green Version]
- Glover, J.D.; Reganold, J.P.; Bell, L.W.; Borevitz, J.; Brummer, E.C.; Buckler, E.S.; Cox, C.M.; Cox, T.S.; Crews, T.E.; Culman, S.W.; et al. Increased food and ecosystem security via perennial grains. Science 2010, 328, 1638–1639. [Google Scholar] [CrossRef] [PubMed] [Green Version]
- DeHaan, L.R.; Van Tassel, D.L. Useful insights from evolutionary biology for developing perennial grain crops. Am. J. Bot. 2014, 101, 1801–1819. [Google Scholar] [CrossRef] [PubMed]
- Bajgain, P.; Zhang, X.; Jungers, J.M.; DeHaan, L.R.; Heim, B.; Sheaffer, C.C.; Wyse, D.L.; Anderson, J.A. ‘MN- Clear-water’, the first food-grade intermediate wheatgrass (Kernza perennial grain) cultivar. J. Plant Regist. 2020, 14, 288–297. [Google Scholar] [CrossRef]
- Cattani, D.J. Selection of a perennial grain for seed productivity across years: Intermediate wheatgrass as a test species. Can. J. Plant Sci. 2016, 97, 516–524. [Google Scholar] [CrossRef]
- Plant Materials Technical Note: Intermediate Wheatgrass (Thinopyrum intermedium L.): An Introduced Conservation Grass for Use in Montana and Wyoming. Available online: https://www.nrcs.usda.gov/Internet/FSE_PLANTMATERIALS/publications/mtpmctn11288.pdf (accessed on 29 June 2021).
- DeHaan, L.R.; Ismail, B.P. Perennial cereals provide ecosystem benefits. Cereal Foods World 2017, 62, 278–281. [Google Scholar] [CrossRef]
- Jungers, J.M.; DeHaan, L.R.; Betts, K.J.; Sheaffer, C.C.; Wyse, D.L. Intermediate wheatgrass grain and forage yield responses to nitrogen fertilization. Agron. J. 2017, 109, 462–472. [Google Scholar] [CrossRef] [Green Version]
- Duchene, O.; Dumont, B.; Cattani, D.J.; Fagnant, L.; Schlautman, B.; DeHaan, L.R.; Barriball, S.; Jungers, J.M.; Picasso, V.D.; David, C.; et al. Process-based analysis of Thinopyrum intermedium phenological development across various environments highlights the importance of dual induction for reproductive growth and agronomic performance. Agric. For. Meteor. 2021, 301–302, 108341. [Google Scholar] [CrossRef]
- Picasso, V.D.; Brummer, E.C.; Liebman, M.; Dixon, P.M.; Wilsey, B.J. Crop species diversity affects productivity and weed suppression in perennial polycultures under two management strategies. Crop Sci. 2008, 48, 331–342. [Google Scholar] [CrossRef]
- Jensen, E.S.; Carlsson, G.; Hauggaard-Nielsen, H. Intercropping of grain legumes and cereals improves the use of soil N resources and reduces the requirement for synthetic fertilizer N: A global-scale analysis. Agron. Sustain. Dev. 2020, 40, 5. [Google Scholar] [CrossRef] [Green Version]
- Favre, J.R.; Castiblanco, T.M.; Combs, D.K.; Wattiaux, M.A.; Picasso, V.D. Forage nutritive value and predicted fiber digestibility of Kernza intermediate wheatgrass in monoculture and in mixture with red clover during the first production year. Anim. Feed Sci. Technol. 2019, 258, 114298. [Google Scholar] [CrossRef]
- Ivancic, K.A.; Locatelli, A.; Tracy, W.F.; Picasso, V.D. Kernza intermediate wheatgrass (Thinopyrum intermedium) response to a range of vernalization conditions. Can. J. Plant Sci. 2021. [Google Scholar] [CrossRef]
- Crain, J.; DeHaan, L.R.; Poland, J. Genomic prediction enables rapid selection of high-performing genets in an intermediate wheatgrass breeding program. Plant Genome 2021, 14, e20080. [Google Scholar] [CrossRef] [PubMed]
- Lanker, M.; Bell, M.; Picasso, V.D. Farmer perspectives and experiences introducing the novel perennial grain Kernza intermediate wheatgrass in the US Midwest. Renew. Agric. Food Syst. 2019, 35, 653–662. [Google Scholar] [CrossRef] [Green Version]
- Jungers, J.M.; Frahm, C.S.; Tautges, N.E.; Ehlke, N.J.; Wells, M.S.; Wyse, D.L.; Sheaffer, C.C. Growth, development, and biomass partitioning of the perennial grain crop Thinopyrum intermedium. Ann. Appl. Biol. 2018, 172, 346–354. [Google Scholar] [CrossRef]
- Zimbric, J.W.; Stoltenberg, D.E.; Picasso, V.D. Effective weed suppression in dual-use intermediate wheatgrass systems. Agron. J. 2020, 112, 2164–2175. [Google Scholar] [CrossRef] [Green Version]
- Blue, E.N.; Mason, S.C.; Sander, D.H. Influence of planting date, seeding rate, and phosphorus rate on wheat yield. Agron. J. 1990, 82, 762–768. [Google Scholar] [CrossRef]
- Dahlke, B.J.; Oplinger, E.S.; Gaska, J.M.; Martinka, M.J. Influence of planting date and seeding rate on winter wheat grain yield and yield components. J. Prod. Agric. 1993, 6, 408–414. [Google Scholar] [CrossRef]
- Top 8 Recommendations for Winter Wheat Establishment in 2015. Available online: https://ipcm.wisc.edu/blog/2015/08/top-8-recommendations-for-winter-wheat-establishment-in-2015/ (accessed on 13 July 2021).
- Intercropping Legumes with Native Warm-Season Grasses for Livestock Forage Production in the Mid-South. Available online: https://extension.tennessee.edu/publications/Documents/SP731-G.pdf (accessed on 30 August 2021).
- United States Department of Agriculture (USDA)—Natural Resources Conservation Service. Available online: https://websoilsurvey.sc.egov.usda.gov/App/HomePage.htm (accessed on 2 February 2021).
- National Oceanic and Atmospheric Administration (NOAA)—National Centers for Environmental Information. Available online: https://www.ncdc.noaa.gov/cdo-web/datatools/lcd (accessed on 2 February 2021).
- McMaster, G.S.; Wilhelm, W.W. Growing degree-days: One equation, two interpretations. Agric. For. Meteor. 1997, 87, 291–300. [Google Scholar] [CrossRef] [Green Version]
- SAS Institute. The SAS System for Windows. Release 9.4; Sas Inst.: Cary, NC, USA, 2021. [Google Scholar]
- Darapuneni, M.K.; Morgan, G.D.; Shaffer, O.J.; Dodla, S. Impact of planting date and seeding rate on forage and grain yields of dual-purpose wheat in central Texas. Crop Forage Turf. Manag. 2016, 2, 1–8. [Google Scholar] [CrossRef]
- Effect of Planting Date and Seed Treatment on Diseases and Insect Pests of Wheat. Available online: https://extension.okstate.edu/fact-sheets/effect-of-planting-date-and-seed-treatment-on-diseases-and-insect-pests-of-wheat.html (accessed on 18 June 2021).
- Lyon, D.J.; Baltensperger, D.D.; Siles, M. Wheat grain and forage yields are affected by planting and harvest dates in the central great plains. Crop Sci. 2001, 41, 488–492. [Google Scholar] [CrossRef] [Green Version]
- Pinto, P.; DeHaan, L.; Picasso, V. Post-harvest management practices impact on light penetration and Kernza intermediate wheatgrass yield components. Agronomy 2021, 11, 442. [Google Scholar] [CrossRef]
- Undersander, D.J.; Greub, L.J. Summer-fall seeding dates for six cool-season grasses in the Midwest United States. Agron. J. 2007, 99, 1579–1586. [Google Scholar] [CrossRef]
- Sheaffer, C.C.; Evers, G.W. Cool-season legumes for humid areas. In Forages the Science of Grassland Agriculture, 6th ed.; Barnes, R.F., Nelson, C.J., Moore, K.J., Collins, M., Eds.; Blackwell Publishing: Ames, IW, USA, 2007; Volume 2, pp. 179–190. [Google Scholar]
- Kazula, M.J.; Andrzejewska, J.; Conley, S.P.; Albrecht, K.A. intercropping winter cereals in kura clover for spring forage production. Can. J. Plant Sci. 2019, 99, 740–750. [Google Scholar] [CrossRef]
- Singer, J.W.; Casler, M.D.; Kohler, K.A. Wheat effect on frost-seeded red clover cultivar establishment and yield. Agron. J. 2006, 98, 265–269. [Google Scholar] [CrossRef]


| Arlington | Lancaster | |||||||
|---|---|---|---|---|---|---|---|---|
| 2017 | 2018 | 2017 | 2018 | |||||
| Planting Date | GDD until Frost | Planting Date | GDD until Frost | Planting Date | GDD until Frost | Planting Date | GDD until Frost | |
| Late August | 30 Aug | 972 | - | - | - | - | 30 Aug | 865 |
| Mid-September | 15 Sep | 728 | - | - | 13 Sep | 798 | 13 Sep | 597 |
| Late September | 27 Sep | 468 | 21 Sep | 420 | 28 Sep | 473 | 27 Sep | 335 |
| Mid-October | 20 Oct | 162 | 14 Oct | 138 | 10 Oct | 291 | 12 Oct | 156 |
| Late October | - | - | 30 Oct | 54 | 26 Oct | 103 | - | - |
| Spring | 30 Apr 2018 | - | 8 Apr 2019 | - | 15 Apr 2018 | - | 3 Apr 2019 | - |
| Arlington | Lancaster | |||
|---|---|---|---|---|
| 2017 | 2018 | 2017 | 2018 | |
| Plot size | 2.6 × 3.4 m2 | 1.7 × 3 m2 | 3 × 4.6 m2 | |
| IWG planting density | 13.5 kg ha−1 | 10.6 kg ha−1 | ||
| Row spacing | 30.5 cm | 38.1 cm | ||
| Fall red clover planting density | 7.8 kg ha−1 | 8.4 kg ha−1 | ||
| Red clover frost seeding date | 2 Mar 2018 | 8 Apr 2019 | 12 Mar 2018 | 2 Apr 2019 |
| Red clover frost seeding density | 11.2 kg ha−1 | 10.1 kg ha−1 | 10.1 kg ha−1 | |
| 1st year Fertilization rate | 44.8 kg ha−1 of N | - | 56 kg ha−1 of N | 102 kg ha−1 of N |
| - | - | 45 kg ha−1 of P2O5 | 34 kg ha−1 of P2O5 | |
| - | - | 84 kg ha−1 of K2O | 258 kg ha−1 of K2O | |
| 1st year Fertilization time | Mid-May & Mid-June 2018 | - | Late March 2018 | May 2019 |
| 2nd year Fertilization rate | 45 kg ha−1 of N | 42 kg ha−1 of N | 102 kg ha−1 of N | - |
| - | - | 34 kg ha−1 of P2O5 | - | |
| - | - | 258 kg ha−1 of K2O | - | |
| 2nd year Fertilization time | Mid-June 2019 | Mid-June 2019 | May 2019 | - |
| 1st year Summer harvest date | 7 Aug 2018 | 8 Aug 2019 | 3 Aug 2018 | 30 July 2019 |
| 1st year Fall harvest date | 26 Oct 2018 | 22 Oct 2019 | 15 Oct 2018 | 25 Oct 2019 |
| 2nd year Summer harvest date | 6 Aug 2019 | 30 July 2020 | 30 July 2019 | 4 Aug 2020 |
| Arlington | Lancaster | ||||||
|---|---|---|---|---|---|---|---|
| GDD | Average Date | 90% Date | GDD | Average Date | 90% Date | ||
| Kernza grain yield | Fall red clover | 721 | 8 Sep | 1 Sep | 630 | 15 Sep | 8 Sep |
| Spring red clover | 972 | 26 Aug | 19 Aug | 664 | 13 Sep | 6 Sep | |
| End of GDD accumulation | 0 | 28 Nov | 12 Nov | 0 | 29 Nov | 13 Nov | |
Publisher’s Note: MDPI stays neutral with regard to jurisdictional claims in published maps and institutional affiliations. |
© 2021 by the authors. Licensee MDPI, Basel, Switzerland. This article is an open access article distributed under the terms and conditions of the Creative Commons Attribution (CC BY) license (https://creativecommons.org/licenses/by/4.0/).
Share and Cite
Olugbenle, O.; Pinto, P.; Picasso, V.D. Optimal Planting Date of Kernza Intermediate Wheatgrass Intercropped with Red Clover. Agronomy 2021, 11, 2227. https://doi.org/10.3390/agronomy11112227
Olugbenle O, Pinto P, Picasso VD. Optimal Planting Date of Kernza Intermediate Wheatgrass Intercropped with Red Clover. Agronomy. 2021; 11(11):2227. https://doi.org/10.3390/agronomy11112227
Chicago/Turabian StyleOlugbenle, Oluwakorede, Priscila Pinto, and Valentin D. Picasso. 2021. "Optimal Planting Date of Kernza Intermediate Wheatgrass Intercropped with Red Clover" Agronomy 11, no. 11: 2227. https://doi.org/10.3390/agronomy11112227