Article

Wheat Density Alters but Does Not Repress the Expression of a Fluroxypyr-Resistant Kochia (Bassia scoparia) Phenotype

by
Charles M. Geddes
* and
Michael T. Kimmins
Agriculture and Agri-Food Canada, Lethbridge Research and Development Centre, 5403 1st Avenue South, Lethbridge, AB T1J 4B7, Canada
*
Author to whom correspondence should be addressed.
Agronomy 2021, 11(11), 2160; https://doi.org/10.3390/agronomy11112160
Submission received: 30 September 2021 / Revised: 24 October 2021 / Accepted: 25 October 2021 / Published: 27 October 2021
(This article belongs to the Special Issue Integrated Weed Management Approaches and Decision Support Systems)

Abstract

:
Dose-response experiments for confirmation of herbicide-resistant weeds are almost always conducted using weed monocultures, thereby ignoring the interaction of interspecific plant interference with herbicide efficacy. Controlled-environment dose-response bioassays were conducted using three kochia [Bassia scoparia (L.) A.J. Scott] populations with four spring wheat (Triticum aestivum L.) densities (0, 200, 400, and 600 plants m−2) to determine how increasing intensity of interspecific plant interference altered the fluroxypyr dose-response relationship of resistant and susceptible kochia. The resistant population exhibited 10.8-, 15.0-, 7.0-, and 8.1-fold resistance to fluroxypyr in the absence of crop interference based on plant survival, biomass fresh weight, and visible control at two and four weeks after application, respectively. Increased wheat densities suppressed fluroxypyr-resistant kochia the greatest, resulting in a linear reduction in the fluroxypyr rate causing 50% plant mortality (LD50) and visible control (ED50) for the resistant but not the susceptible populations. This reduced the expression of fluroxypyr resistance based on kochia plant survival (from 10.8- to 4.3-fold resistance) and visible control (from 8.1- to 4.6-fold resistance) as wheat density increased from 0 to 600 plants m−2. Therefore, enhanced interspecific plant interference caused by increased wheat densities altered but did not repress the expression of fluroxypyr resistance in kochia.

1. Introduction

Kochia [Bassia scoparia (L.) A.J. Scott] is an invasive C4 tumbleweed native to Eurasia and introduced to the Americas as an ornamental forb in the mid- to late-1800s [1]. It has grown to become one of the most problematic weed species in the North American Great Plains, resulting in significant yield losses in spring wheat (Triticum aestivum L.), oat (Avena sativa L.), soybean [Glycine max (L.) Merr.], sunflower (Helianthus annuus L.), and sugar beet (Beta vulgaris L.), among other crops [1,2,3]. Kochia was the 15th most abundant weed species midseason among 1232 surveyed fields in Alberta in 2017, and the most abundant species in the Mixed Grassland ecoregion [4]. Among crops in Alberta, kochia was most abundant in lentil (Lens culinaris Medik.) followed by durum (Triticum durum Desf.) and spring wheat [4].
Unique biological characteristics of kochia, including early spring emergence and prolonged emergence periodicity [5], high genetic diversity [6], abiotic-stress tolerance [1], high fecundity, tumbleweed seed dispersal [7], and low innate seed dormancy causing rapid population turnover [8], facilitate its spread and evolution in response to recurrent population stressors such as herbicides. Kochia populations are known to exhibit resistance to up to four herbicide sites-of-action, including photosystem II inhibitors [Weed Science Society of America (WSSA) Group 5], acetolactate synthase (ALS) inhibitors (WSSA group 2), synthetic auxins (WSSA Group 4), and the 5-enolpyruvylshikimate-3-phosphate synthase inhibitor glyphosate (WSSA Group 9) [9,10,11,12,13]. In Canada, ALS inhibitor-resistant kochia was reported first in 1988, and glyphosate-resistant kochia in 2011 [13]. Synthetic auxin-resistant kochia was reported first in Canada in 2015 despite its presence in the United States since 1993/1994 [13]. A 2017 survey of Alberta documented resistance to ALS inhibitors, glyphosate, and dicamba (a synthetic auxin herbicide; WSSA Group 4) in 100%, 50%, and 18% of the 305 kochia populations tested, respectively [9]. Further research identified that 13% of these populations were fluroxypyr-resistant (another synthetic auxin herbicide; WSSA Group 4), suggesting that, overall, 28% of the kochia populations tested in Alberta in 2017 were synthetic auxin-resistant, and 16% were triple herbicide-resistant to ALS inhibitors, glyphosate, and at least one synthetic auxin [10].
Resistance to multiple herbicide sites-of-action in kochia limits options for herbicidal control [3,14,15], creating a need for integrated weed management programs that exploit non-chemical weed control strategies. Cultural management tools used to increase crop competitive ability can interact with and augment herbicide efficacy [16,17,18,19]. One of the easiest, most effective, and consistent ways to improve crop competitive ability is to increase seeding rates [20,21]. The weed-suppressive effects of increased wheat plant densities have been well documented [17,18,22,23,24,25,26,27,28,29]. Increased crop seeding rates interact with herbicide performance resulting in improved weed management [17,18,19,30]. Thus, cultural weed management tools such as increased seeding rates, when implemented in combination with herbicides, could enhance management of herbicide-resistant kochia.
Targeting the soil seedbank is an efficient kochia management strategy due to short (1–2 year) seedbank persistence resulting in rapid population decline if kochia seed production and return to the soil seedbank are prevented for a few years consecutively [31]. One way to target the weed seedbank is to mitigate weed seed production through enhanced crop competition, thereby reducing seedbank additions. Kochia exhibits size-symmetric competition, and its relative growth rate is a direct function of neighboring plant size [32]. Thus, kochia growth declines rapidly under competitive environments. For example, the presence of an oat crop in North Dakota reduced kochia biomass by 97.5% and 87.2% on average at kochia densities of 6 and 30 plants m−2, respectively [2]. The presence of a wheat crop in Montana reduced kochia biomass by 99.4% [33]. Large reductions in kochia growth in response to crop interference suggest that kochia management could be enhanced further through increased crop seeding rates.
Dose-response experiments used to diagnose herbicide resistance are almost always conducted using weed monocultures, thereby ignoring the interaction of cultural management with herbicide efficacy. The impact of interspecific plant interference on the dose-response relationship among resistant and susceptible weed biotypes is poorly understood. Indeed, ecological fitness penalties associated with herbicide resistance traits could enhance susceptibility to plant interference, resulting in greater suppression of resistant vs. susceptible biotypes [34]. Under highly competitive environments, the interaction of interspecific plant interference with herbicide efficacy could reduce the level of resistance exhibited by herbicide-resistant weeds and potentially shift their phenotypic expression of resistance toward that of their susceptible counterparts. The current study was designed to determine whether interspecific plant interference caused by increasing wheat plant densities interacts with the fluroxypyr dose-response relationship of resistant and susceptible kochia, and to determine whether enhanced crop competitiveness could repress the phenotypic expression of fluroxypyr resistance.

2. Materials and Methods

2.1. Experimental Design and Treatment Structure

Whole-plant dose-response bioassays were conducted in the greenhouse at the Agriculture and Agri-Food Canada Lethbridge Research and Development Centre to determine how crop interference impacts the expression of two putative fluroxypyr-resistant kochia phenotypes compared with a fluroxypyr-susceptible control. The experiment was arranged in a randomized complete block design with a three-way factorial treatment structure and three experimental replications (blocks). The experiment was conducted twice over two runs that were separated spatially (in a different greenhouse) and temporally (at a different time). The three-way factorial treatment structure included three kochia populations [Lethbridge18(S), Vulcan17, and RockyView18; representing susceptible, low-level resistance, and high-level resistance to fluroxypyr, respectively], four spring wheat ‘AAC Brandon’ plant densities (equivalent to 0, 200, 400, 600 plants m−2) representing increasing levels of plant interference, and seven fluroxypyr (PrestigeTM XCA, Corteva Agriscience, Calgary, AB, Canada) rates (0, 17.5, 35, 70, 140, 280, and 560 g ae ha−1; with 140 g ae ha−1 representing the high field application rate).

2.2. Plant Material

The three kochia populations were selected because they showed variable levels of response to fluroxypyr characterized previously by Geddes et al. [11]. All three kochia populations were collected from fields in southern Alberta, Canada. RockyView18 was collected from a wheat field in Rocky View County in 2018 following a farmer report of suspected fluroxypyr resistance. Vulcan17 was collected from a field in Vulcan County during a 2017 survey of herbicide-resistant kochia in Alberta [9,10]. Lethbridge18(S) was a glyphosate- and synthetic auxin-susceptible but ALS inhibitor-resistant control population that was selected and maintained through recurrent population-level increases in the field in Lethbridge County. In each field, reproductive biomass was sampled from 10–20 mature plants and combined to create a composite sample representing the kochia population [10,11,12]. The samples were dried at room temperature and threshed by hand under isolated conditions to prevent cross contamination of the kochia seed accessions. The clean seed samples were stored at 4 °C until experimental initiation.

2.3. Experimental Logistics

Spring wheat was planted at 2.5 cm depth and a target density equivalent to 0, 200, 400, and 600 plants m−2 (i.e., 0, 2, 4, and 6 plants pot−1) in 1.2 L plastic pots. Each pot represented an experimental unit. The wheat plants were arranged in a pattern that allowed for equidistant spacing among plants in each pot, where the intraspecific plant spacing grew closer in treatments with increased wheat density, e.g., [34]. Before planting, the wheat seed was treated with Cruiser® Vibrance® Quattro (Syngenta Canada Inc., Guelph, ON, Canada), containing thiamethoxam, difenoconazole, sedaxane, metalaxyl-M, and fludioxonil, applied at 0.200, 0.120, 0.050, 0.030, and 0.025 g ai kg−1 seed, respectively. The pots were filled with a modification of the Cornell soilless potting mixture [35] and fertilized before planting with nitrogen, phosphorus, and potassium at 756, 958, and 505 mg L−1 mixture. At the same time as wheat planting, the three kochia populations were each seeded shallow in three separate 52 × 26 × 5 cm greenhouse flats (one flat of each population for each replication) containing an insert with 400 cells filled with the same potting mixture. When the seedlings reached 1 cm tall, they were thinned to a single plant per cell, and the soil/plant plugs were transplanted into each experimental unit (greenhouse pot) between wheat plants at a density of 6 kochia plants pot−1.
In the greenhouse, the experimental blocks were arranged to account for potential environmental gradients including temperature and airflow. Greenhouse conditions included a 20/18 °C day/night temperature regime and 16 h photoperiod supplemented with 100 µmol m−2 s−1 light from high-pressure sodium bulbs. Each experimental unit was watered daily. The fluroxypyr treatments were applied using a moving-nozzle cabinet sprayer when the kochia plants reached 5 to 7 cm in height [11]. The sprayer was fitted with a flat-fan TeeJet® 8002VS nozzle (Spraying Systems Co., Wheaton, IL, USA) calibrated to deliver 200 L ha−1 spray solution at 275 kPa in a single pass 50 cm above the foliage.

2.4. Data Collection

Kochia visible injury was assessed two and four weeks after herbicide application (WAA) using a rating scale from 0% to 100% relative to the zero-rate control for each population (0% being no effect, 100% being complete necrosis) [36]. Kochia plant survival was determined four WAA by visually rating each plant as live or dead following the visual indicators described by Geddes et al. [11], dividing the number of live kochia plants by the number of treated kochia plants in each experimental unit (six), and multiplying by 100. Wheat and kochia shoot biomass fresh weight (FW) were determined separately at four WAA. The shoot tissue was then dried at 60 °C until equilibrium and shoot dry weight (DW) determined.

2.5. Statistical Analyses

All data were analyzed using analysis of variance (ANOVA) and variance component analysis in the MIXED procedure in SAS 9.4 (SAS Institute Inc., Cary, NC, USA), which was used to guide subsequent analyses using nonlinear regression [37,38]. Response variables included kochia visible control at two and four WAA, kochia biomass FW and DW four WAA, kochia plant survival at four WAA, and wheat biomass FW and DW at four WAA. The main and interaction effects of experimental run, kochia population, wheat plant density, and fluroxypyr rate were considered fixed effects, while experimental replication nested within run was considered a random effect. The main effect of—and interaction effects with—experimental run accounted for <5% of the model sums of squares in the variance component analysis, and thus subsequent analyses pooled data across this factor. The UNIVARIATE procedure was used to assess normality of the residuals based on the Shapiro–Wilk test, while homoscedasticity was assessed visually by plotting the residuals against the predicted values [37]. The control treatments absent of wheat were removed from the analyses of wheat biomass data to avoid heteroscedasticity induced by consistent biomass values of zero.
The drc package in R version 3.6.0 [39] was used to analyze the dose-response relationships [40,41]. Based on the initial ANOVA, kochia population and crop density were merged to create a new composite variable designating the crop density by kochia population interaction effect, for which dose-response curves were fitted individually in a single model for each response variable. The kochia response variable data were fit to the three-parameter Weibull type 1 model (Equation (1)):
y = ( d ) exp ( exp ( b ( log ( x ) log ( e ) ) ) )
where y indicates the response variable; x indicates fluroxypyr rate; d indicates the upper asymptote in the same units as the response variable; b indicates the slope of the dose-response curve at rate e ; and e indicates the inflection point of the asymmetrical dose-response curve. Unlike the commonly used log–logistic dose-response model, where e corresponds to the estimated rate causing a decrease in the response variable by 50% (ED50), the asymmetrical nature of the Weibull type 1 model generally results in an inflection point that is larger than the ED50 value [42]. For visible control estimates, the upper asymptote, d , was fixed at 100, thereby reducing the model to its two-parameter form.
Model selection was based on the lack-of-fit test (p > 0.05), the Akaike Information Criterion, and visual assessment of model fit to the data and that of the model residuals. The residuals were assessed again for normality and homoscedasticity using a Q–Q plot and by plotting the residuals against the predicted values, respectively. The optimal Box–Cox transformation was used to adjust for heteroscedasticity of kochia shoot biomass FW data [41]. The estimated doses required to achieve 50% visible control (ED50), reduce kochia biomass by 50% (GR50), or reduce kochia plant survival by 50% (LD50) relative to the untreated control for each corresponding population and crop density, were extracted. The ED50 and LD50 values were regressed against wheat density using linear regression to assess the relationship between wheat density and phenotypic response to fluroxypyr treatment [19]. The relative differences (estimated ratios or R/S) in ED50, GR50, or LD50 among the putative resistant populations (RockyView18 and Vulcan17) and the susceptible control [Lethbridge18(S)], and among the crop densities, were determined and compared using a t-test at α = 0.05 [40]. Populations were considered resistant if the R/S was ≥4.0 and was significantly different from 1 [11,43].

3. Results and Discussion

3.1. Population Differences Absent of Crop Interference

In the absence of crop interference, RockyView18 exhibited high-level resistance to fluroxypyr, while Vulcan17 resulted in a similar ED50, LD50, and GR50 as the susceptible control, Lethbridge18(S) (Table 1 and Table 2; Figure S1). RockyView18 exhibited 10.8-, 15.0-, 7.0-, and 8.1-fold resistance in the absence of crop interference based on plant survival, biomass FW, and visible control at two and four WAA, respectively (Table 1 and Table 2; Figure S1). In contrast, Vulcan17 resulted in R/S < 4.0 for plant survival and visible control absent of crop interference, but was 12.5-fold more resistant than the susceptible control based on biomass FW; however, like RockyView18, the biomass FW R/S was not significantly different from 1 (Table 1 and Table 2; Figure S1). The visible control and plant survival R/S for RockyView18 and Vulcan17 absent of wheat interference were lower than those reported by Geddes et al. [11] for these same populations. This was likely because the susceptible control used in the current study (referred to as ‘Susceptible-2′ by Geddes et al. [11]) resulted in the highest ED50 and second-highest LD50 values among the four fluroxypyr-susceptible controls used by Geddes et al. [11], suggesting that the estimated ratios (R/S) reported in the current study were conservative estimates. This resulted in characterization of Vulcan17 as susceptible based on plant survival and visible control (Table 1 and Table 2). The observed R/S values for the fluroxypyr-resistant population RockyView18 absent of wheat interference were similar to—or higher than—those reported elsewhere [43,44].

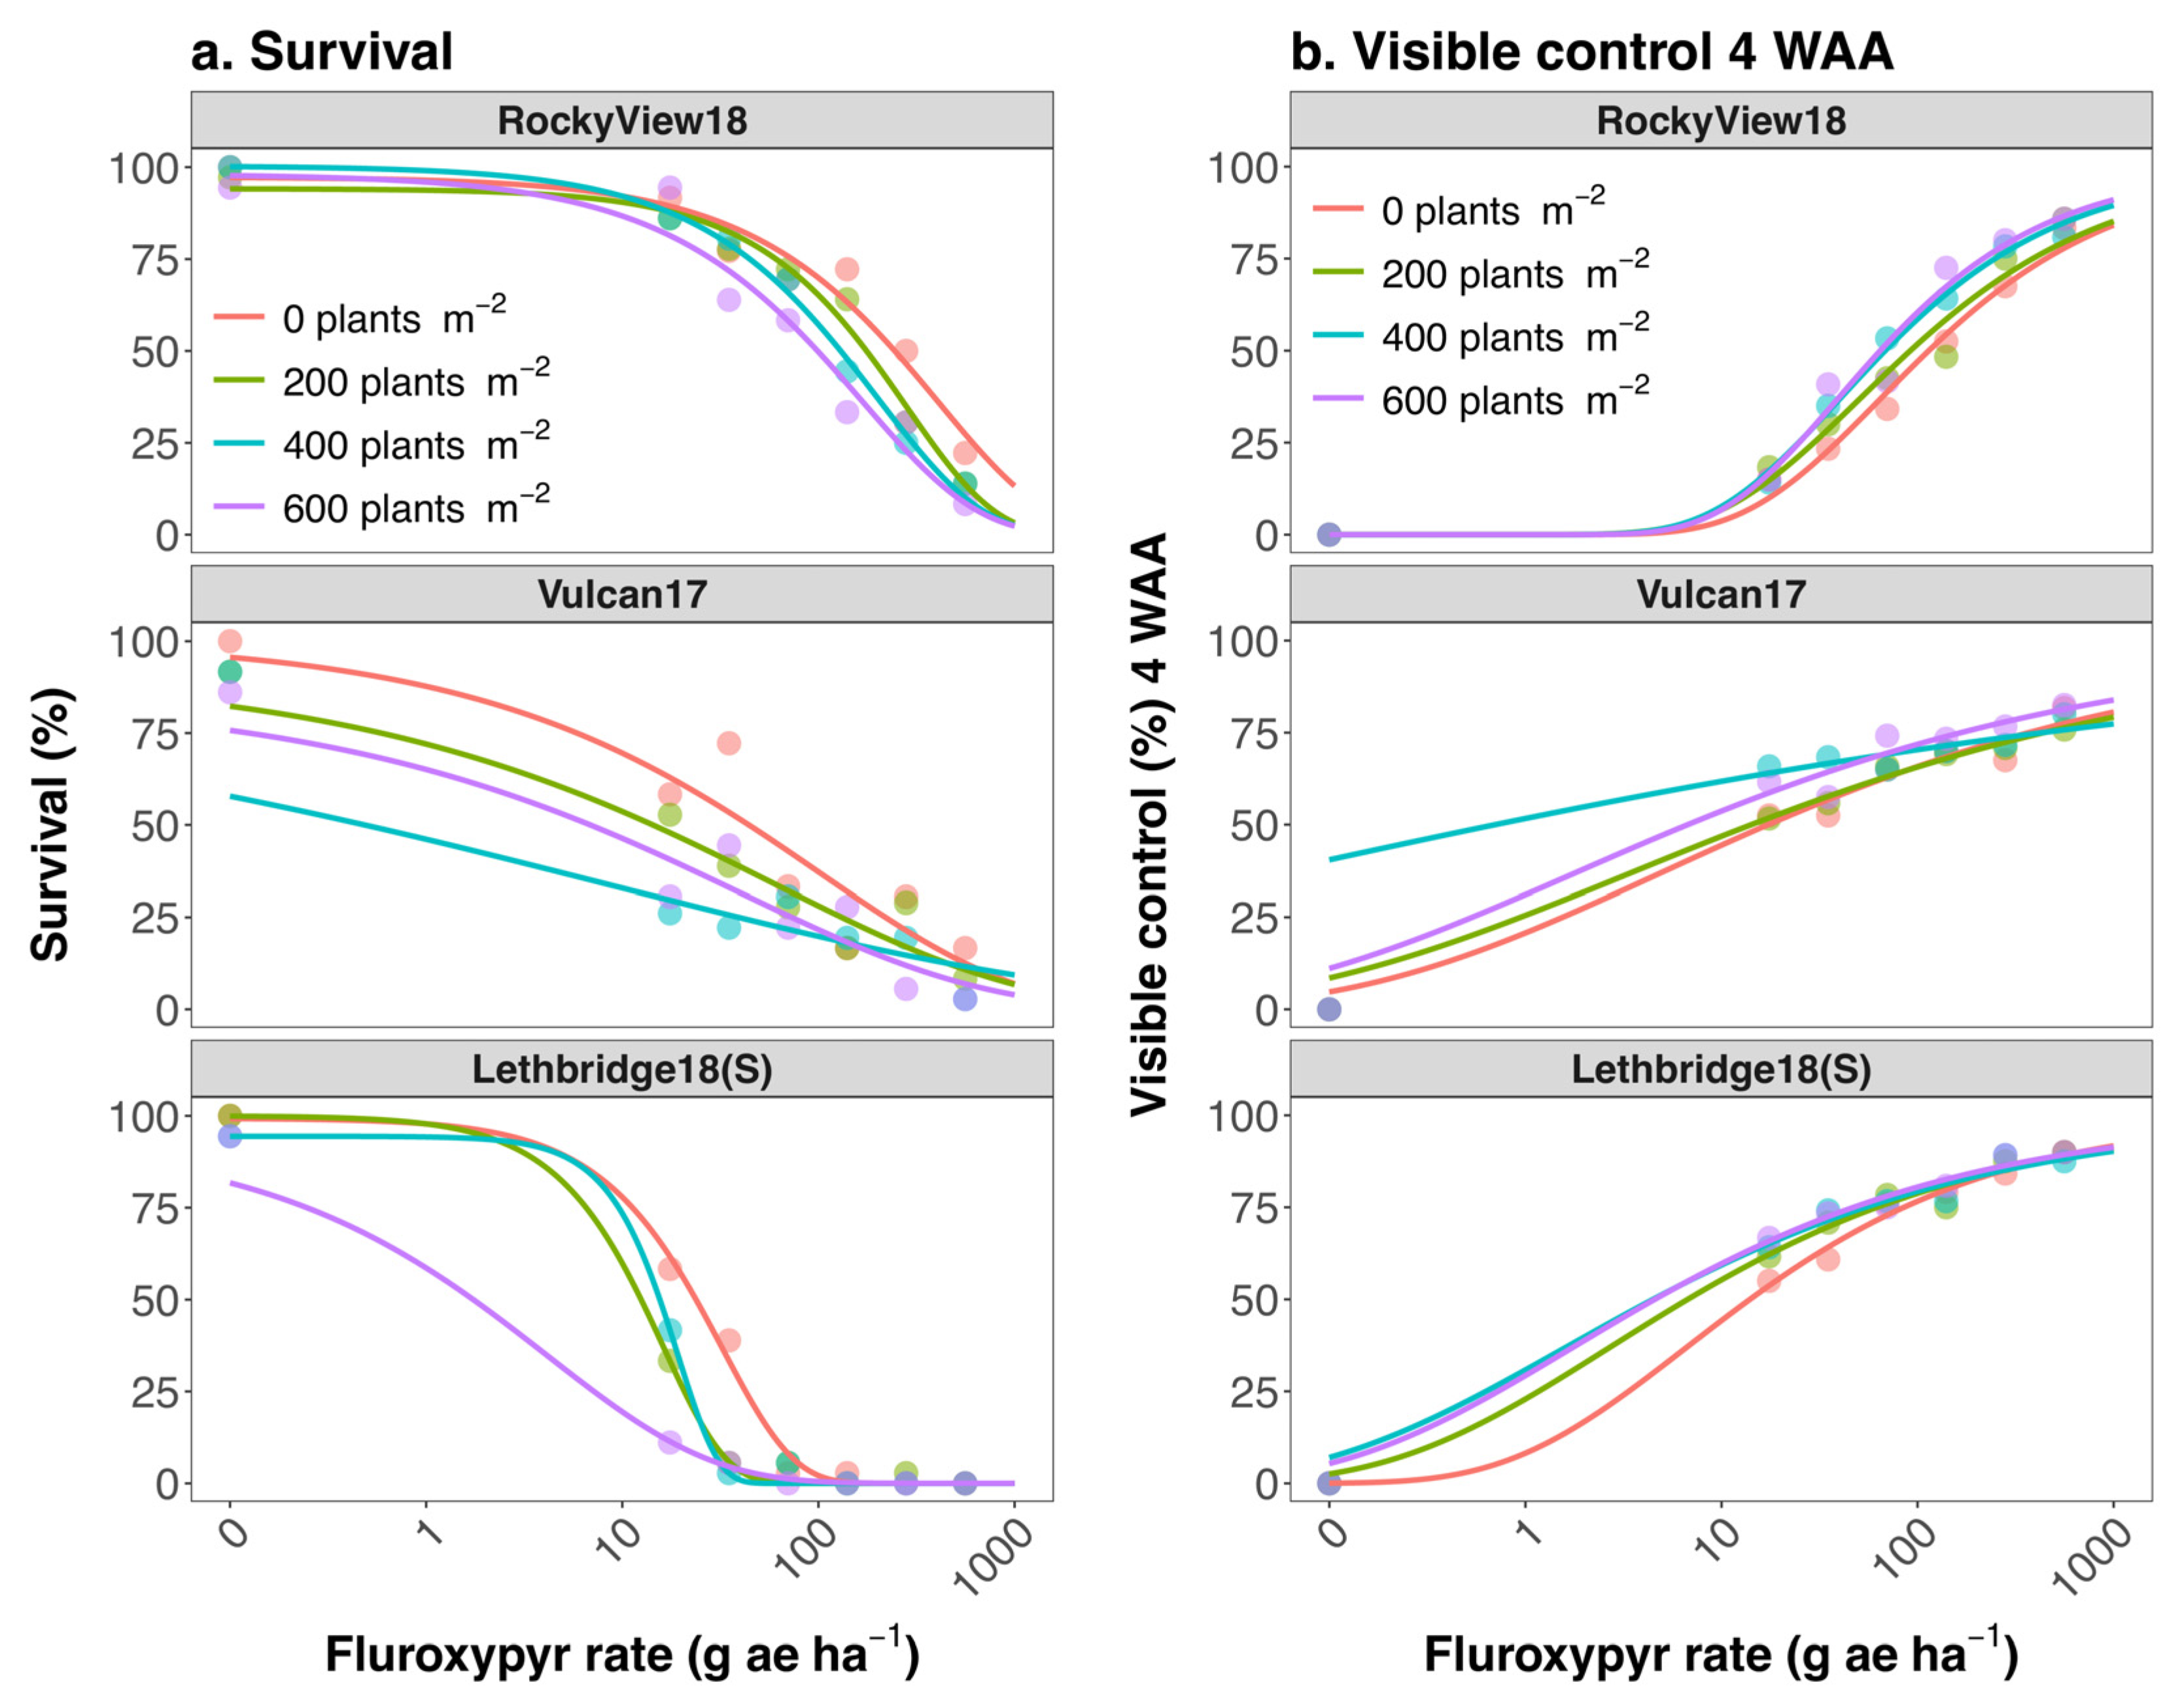
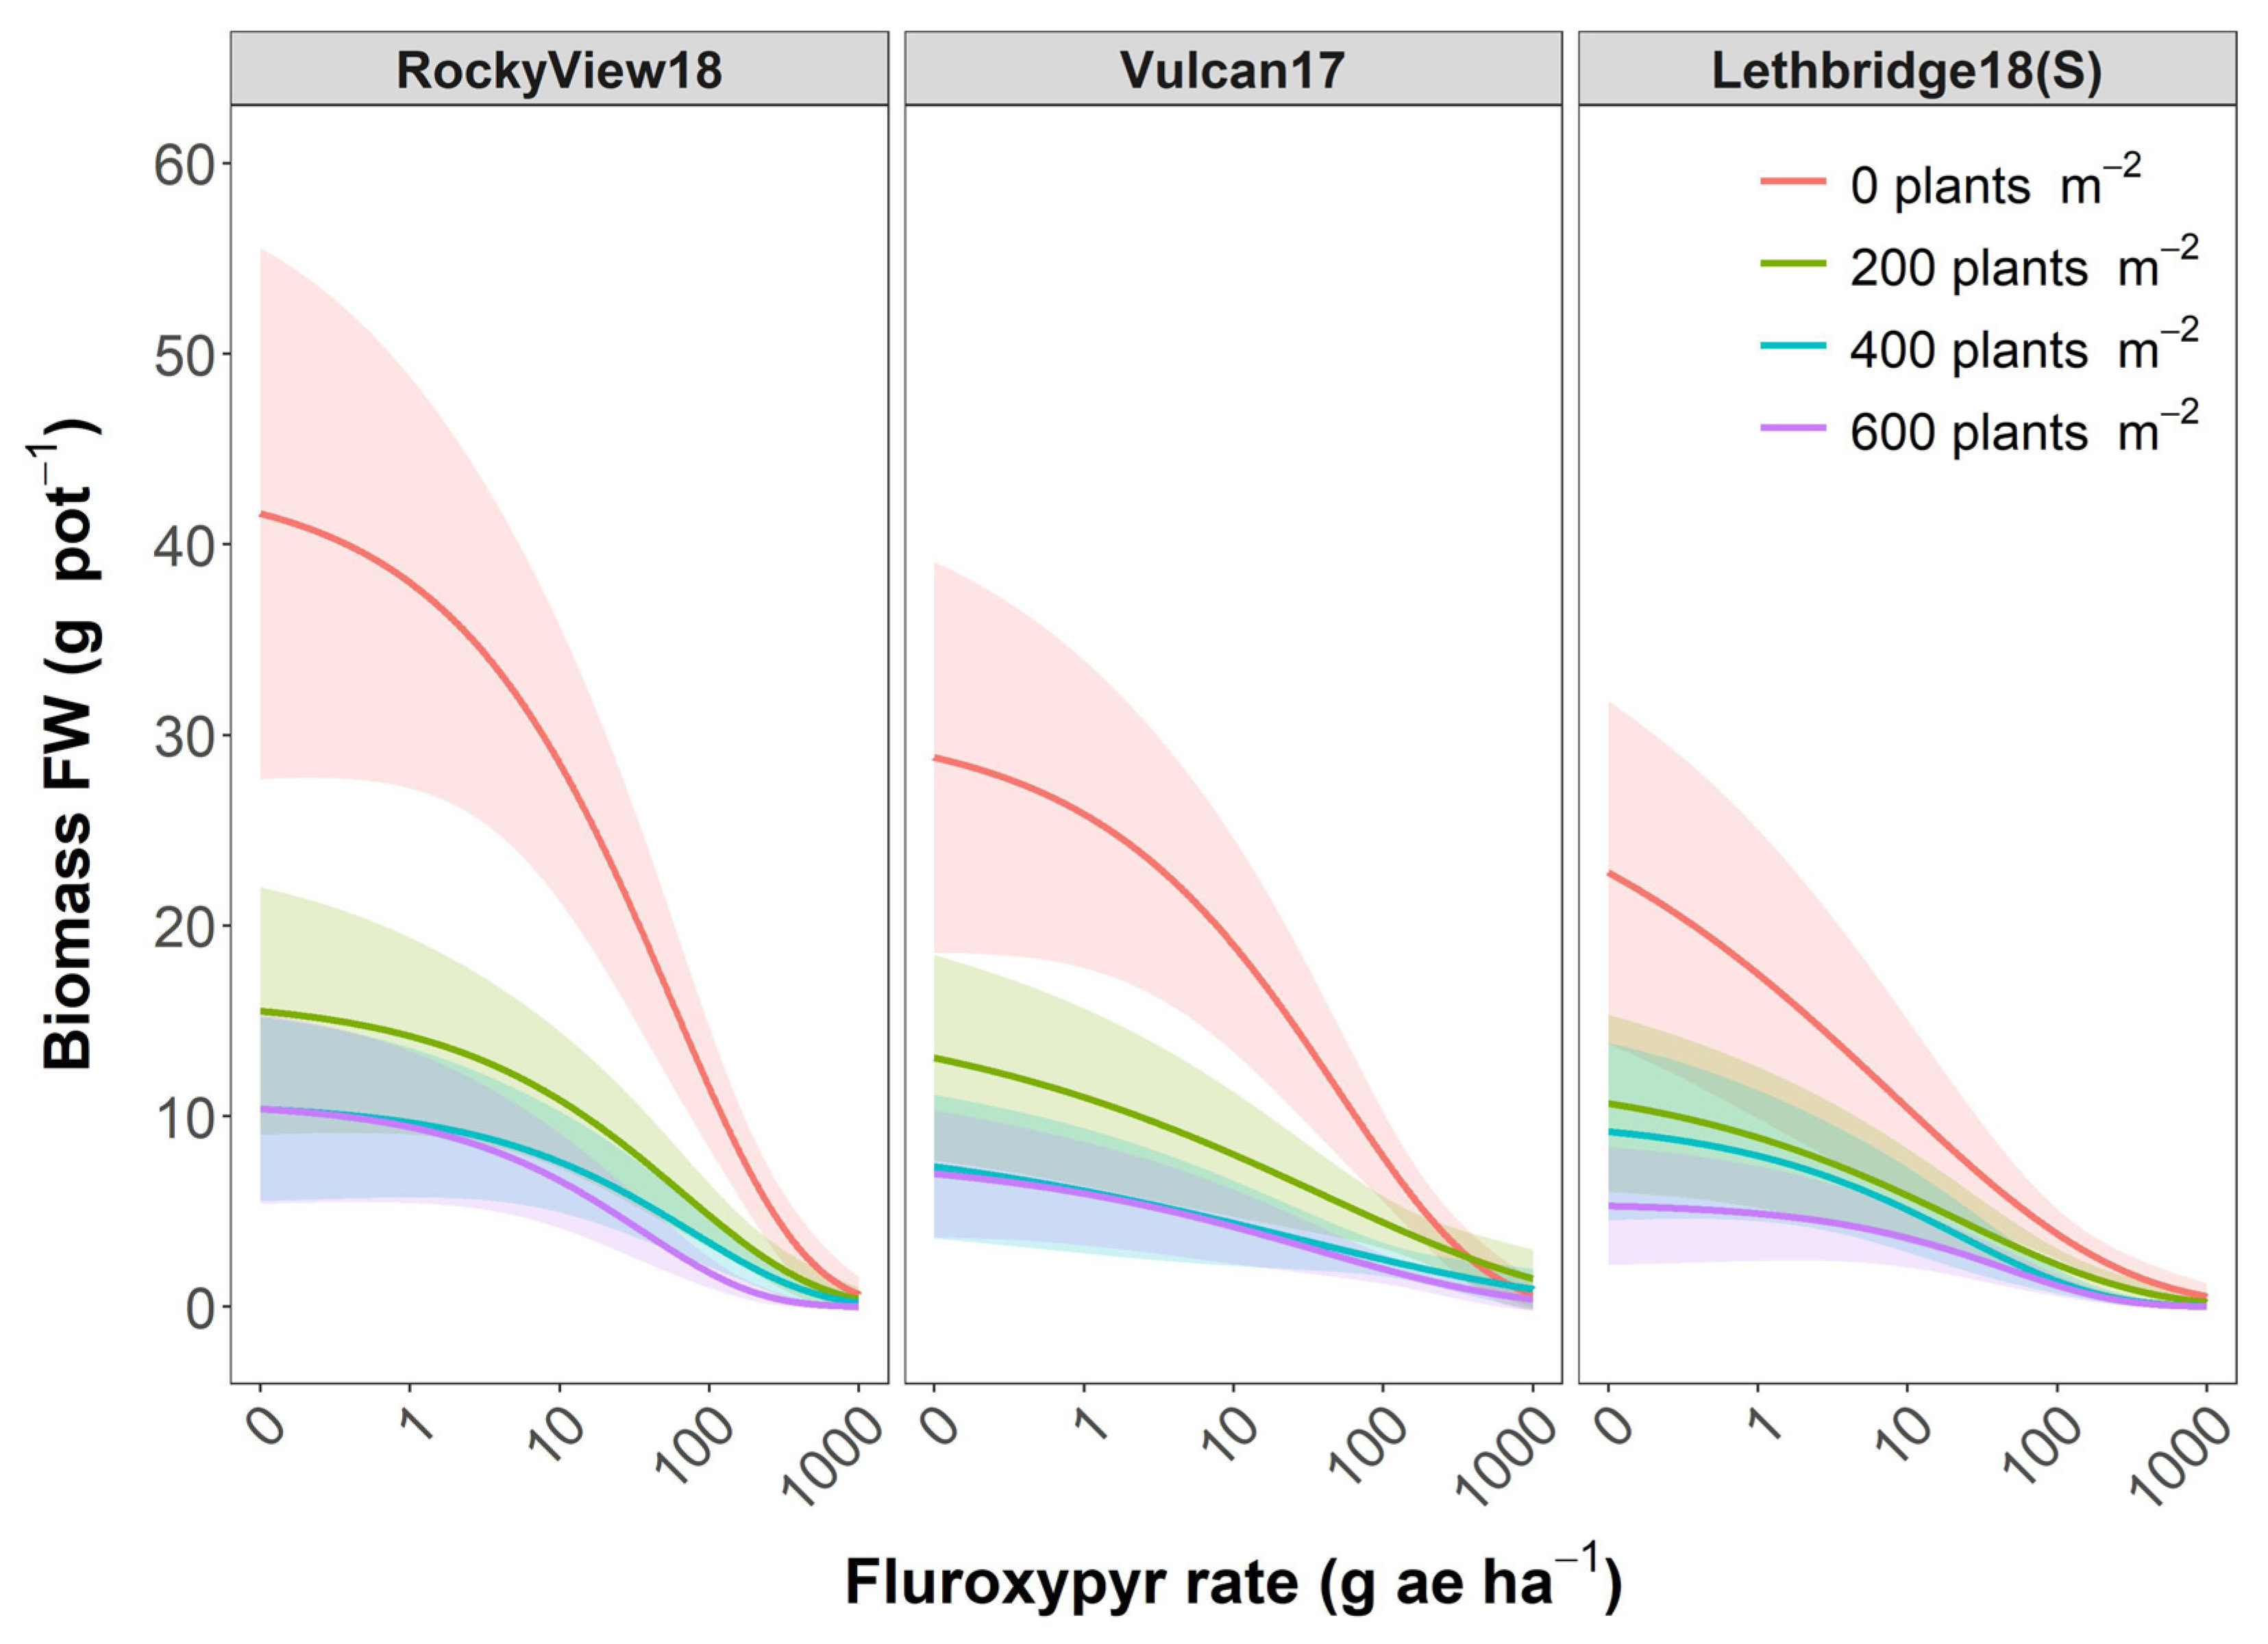
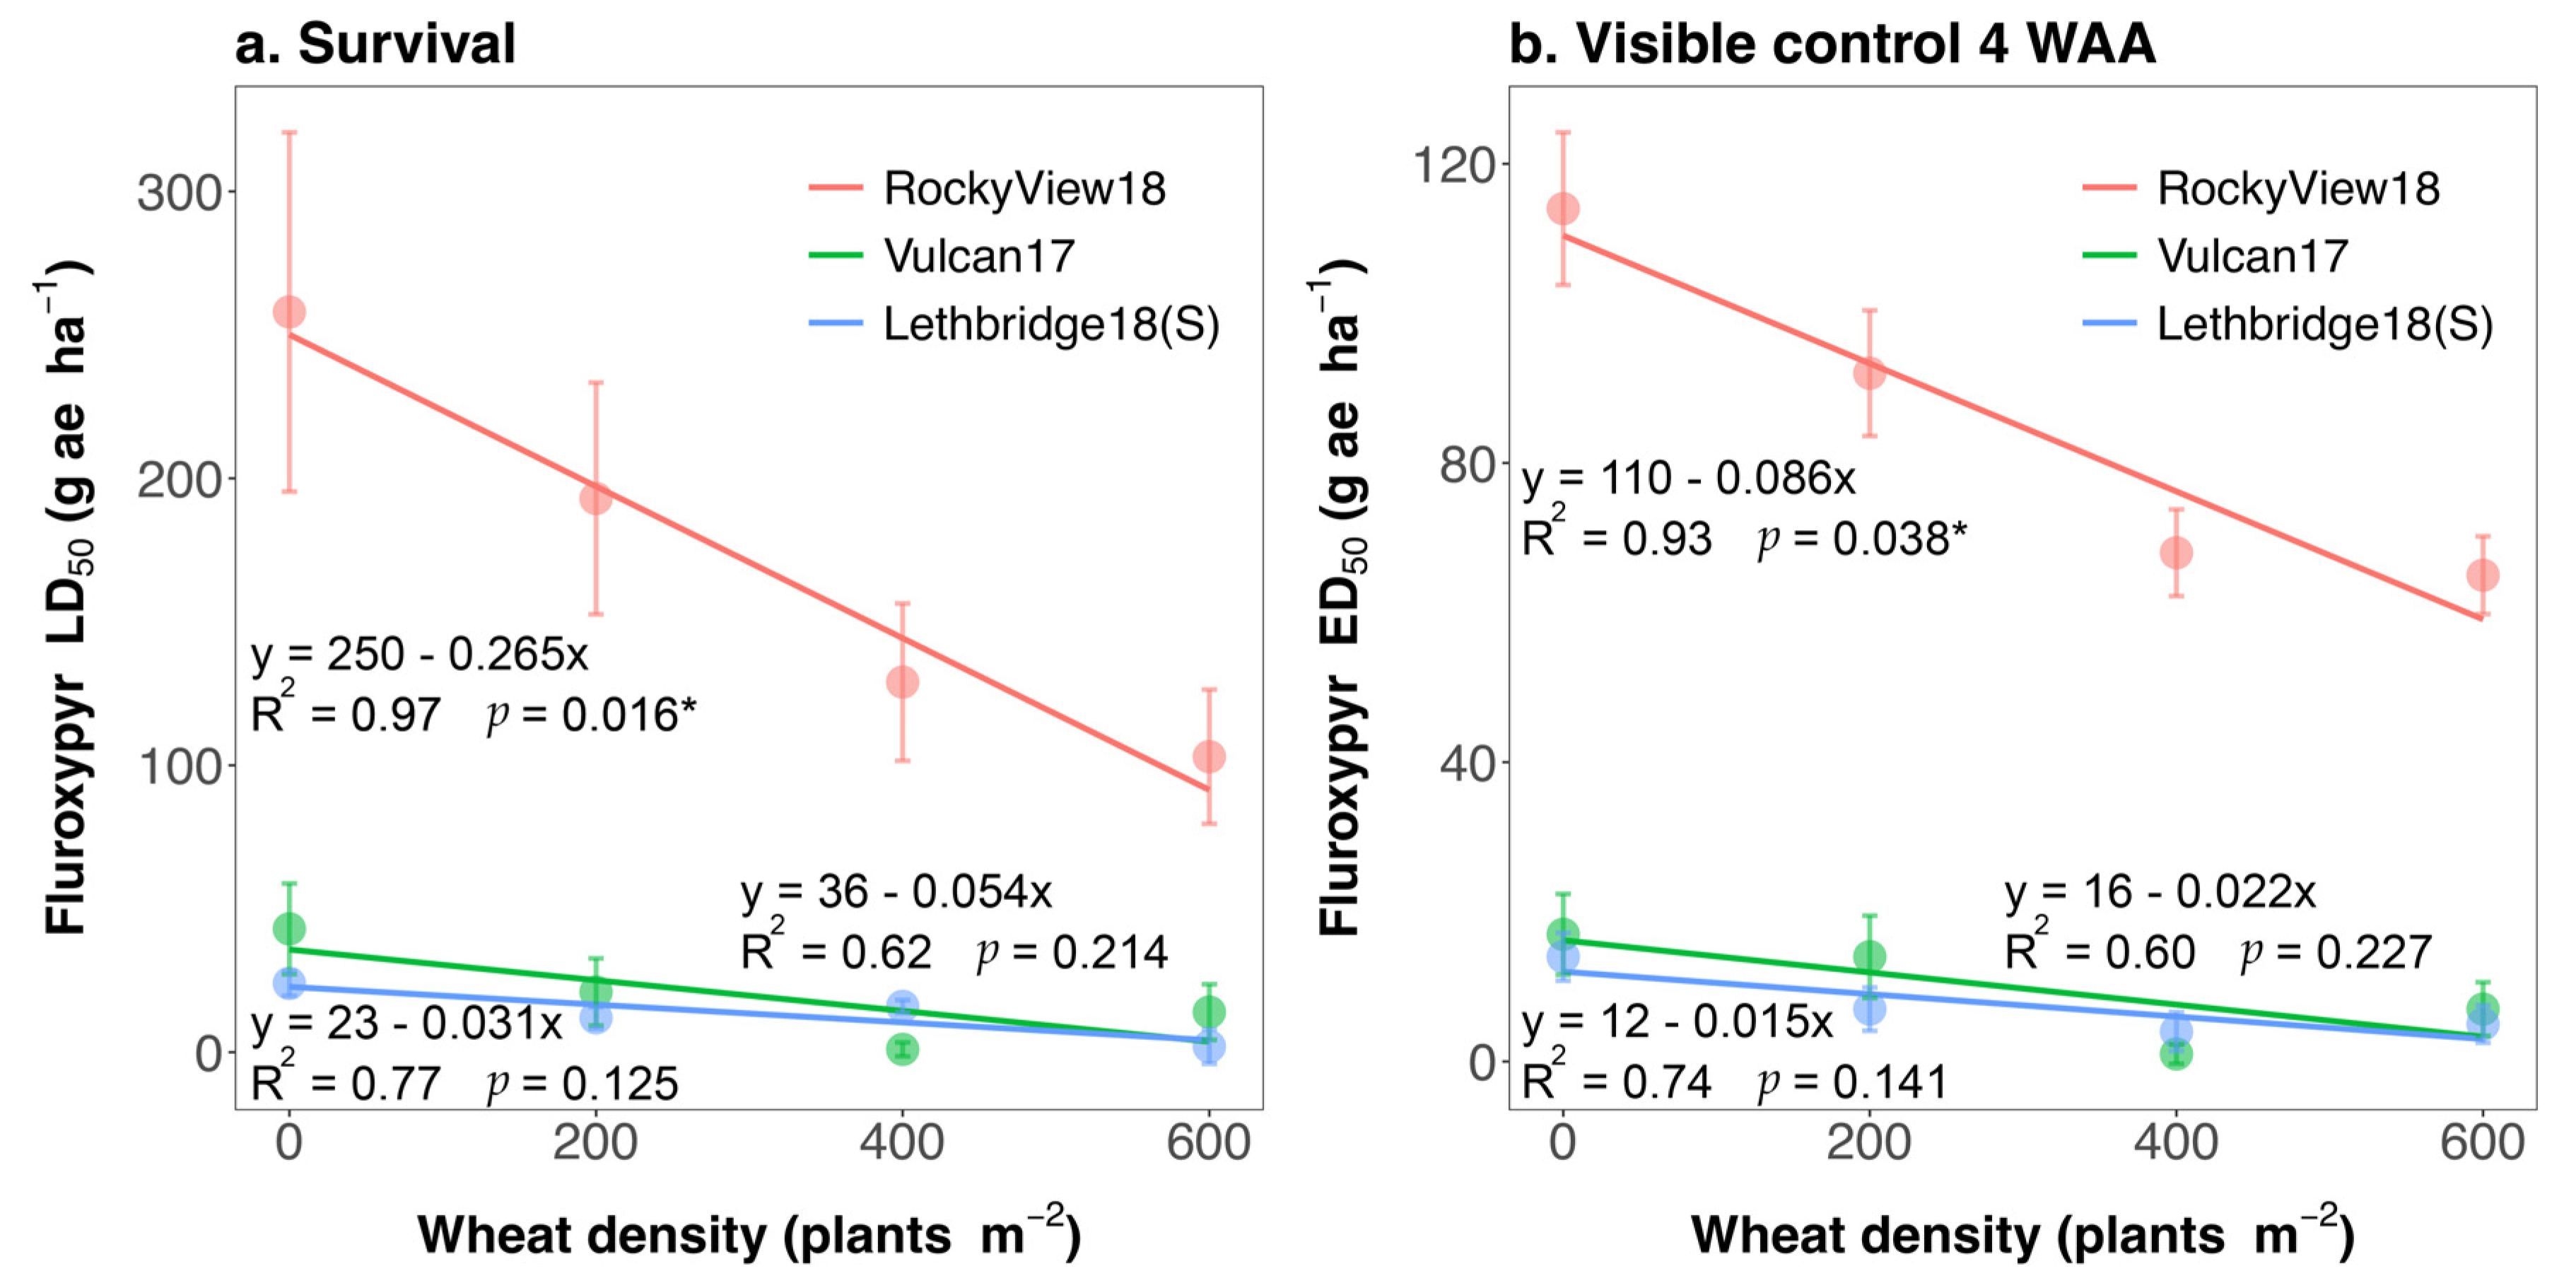
3.2. Impact of Crop Interference

The kochia population that was fluroxypyr-resistant in the absence of wheat interference was also characterized as resistant when comparing among populations within the same crop densities. Despite some variability in significant difference of R/S from 1 at higher crop densities, when comparing within crop densities RockyView18 exhibited 8.1- to 51.5-fold resistance based on plant survival under crop interference (densities ranging from 200 to 600 wheat plants m−2), while 10.5- to 82.0- and 13.0- to 17.0-fold resistance was observed based on visible control at two and four WAA, respectively (Table 1 and Table 2; Figure S1). This suggests that standard dose-response experiments, which are almost always conducted using weed monocultures, are also representative of resistance exhibited under interspecific plant interference in cropped fields. Thus, plants characterized as herbicide-resistant in standard dose-response experiments tend to also exhibit resistance in the presence of interspecific plant interference.
Increasing wheat density augmented herbicidal control of the kochia populations regardless of the fluroxypyr rate, where increasing wheat density decreased the fluroxypyr rate required to achieve the same level of kochia plant mortality, visible control, and reduction in biomass FW (Table 1 and Table 2; Figure 1 and Figure 2). For example, a reduction in the biomass FW model upper asymptote ( d ) was observed from 30 to 5 (p = 0.041), 30 to 8 (p = 0.056), and 43 to 11 (p = 0.025) g pot−1 for Lethbridge18(S), Vulcan17, and RockyView18, respectively, between wheat densities of 0 and 600 plants m−2, which indicates that increasing crop density decreased kochia biomass regardless of the fluroxypyr rate, albeit statistical differences were absent at very high fluroxypyr rates (Table 1; Figure 2). Similarly, Figure 1 shows a shift in the dose-response relationship where increasing crop densities decrease the rate of fluroxypyr required to achieve the same level of plant mortality (Figure 1a) or visible control (Figure 1b). An exception was when Vulcan17 was treated with lower rates of fluroxypyr, which resulted in slightly greater plant mortality and visible control four WAA when wheat was present at 400 compared with 600 plants m−2 (Figure 1). Wheat biomass FW and DW increased with wheat density (p < 0.001), but were unaffected by differences among fluroxypyr rates (p ≥ 0.745) or the kochia populations (p ≥ 0.694), resulting in 4.0, 5.6, and 6.7 (±0.43) g wheat DW pot−1 at densities equivalent to 200, 400, and 600 plants m−2 (data not shown). The presence versus absence of wheat in the dose-response bioassays resulted in the largest reduction in kochia biomass among populations, while the marginal benefit in biomass reduction (i.e., reduction in biomass for each increase in wheat density) decreased as wheat densities increased (Figure 2). The kochia biomass DW data did not pass the lack-of-fit test for nonlinear regression (i.e., p < 0.05), although visualization of these data shows greater variability in response of RockyView18 to fluroxypyr rate compared with Lethbridge18(S), and a consistent biomass reduction in response to increasing wheat interference when fluroxypyr rates were inadequate for complete control (Figure S2). Augmented herbicide performance in response to increased crop seeding rate has been well documented in wheat and other crops [17,18,19,30]. For example, a range of post-emergence herbicides were more effective at reducing wild oat (Avena fatua L.) biomass and seed in the soil seedbank when wheat was seeded at 150 kg ha−1 compared with 75 kg ha−1 [18]. Similarly, Walker et al. [30] observed a trade-off between wheat plant density and the rate of clodinafop-propargyl and tralkoxydim required to achieve the same level of control of hood canarygrass (Phalaris paradoxa L.) and sterile oat (Avena ludoviciana Durieu), respectively. Our results correspond with previous reports in that increased crop density can be an effective tool to improve herbicide performance, and that the marginal increase in weed management declines as crop densities increase (Figure 1 and Figure 2). In addition, our results extend these findings from herbicide-susceptible weeds to similar observations for herbicide-resistant weed management.
Enhanced interspecific plant interference in response to increased wheat densities resulted in the greatest improvement in management of the fluroxypyr-resistant kochia population. Increased wheat densities augmented herbicidal control of the fluroxypyr-resistant kochia population, resulting in a linear reduction in fluroxypyr LD50 and ED50 four WAA, equivalent to a decrease of 0.265 (p = 0.016) and 0.086 g ae ha−1 (p = 0.038), respectively, for every 1 plant m−2 increase in wheat density (Figure 3). In contrast, the LD50 and ED50 for the fluroxypyr-susceptible populations did not respond to wheat plant density (p = 0.125 to 0.227). Based on plant survival, RockyView18 exhibited 10.8-, 8.0-, 5.4-, and 4.3-fold resistance that declined as wheat densities increased from 0 to 600 plants m−2 compared with the susceptible control absent of wheat interference (Table 1). A similar reduction in R/S was observed for visible control four WAA in response to increased wheat plant density (Table 2). Thus, increasing wheat plant density contributed to a reduction in phenotypic expression of resistance by the fluroxypyr-resistant kochia population, but did not result in complete reversion to that exhibited by fluroxypyr-susceptible kochia. Differential impact of interspecific plant interference on the fluroxypyr-resistant and -susceptible kochia populations could be due to variation in ecological fitness of these populations as a pleiotropic effect of the fluroxypyr resistance trait, e.g., [45], or simply due to a shift in the management balance offered by this multi-tactic weed control program. In the latter scenario, poor herbicide efficacy on the fluroxypyr-resistant kochia population could have elicited a shift in the management balance toward greater reliance on the non-chemical method of increased crop seeding rate, while good herbicide efficacy for control of the susceptible populations masked the contribution of wheat seeding rate to overall kochia management. Alternatively, Kumar and Jha [45] reported significant vegetative and reproductive fitness penalties of dicamba/fluroxypyr resistance in kochia that manifest as delayed and lower cumulative germination, and reduced plant height, width, branches, leaf area, stem diameter, shoot biomass, seed production, seed size, and intraspecific competitive ability. These fitness penalties, if present in RockyView18, could have resulted in reduced competitiveness and greater management during interspecific plant interference, similar to that reported for annual ryegrass (Lolium rigidum L.), with multiple herbicide resistance conferred by enhanced herbicide metabolism [34]. However, it should be noted that RockyView18 was fluroxypyr-resistant but dicamba-susceptible [11], suggesting that resistance in this population is likely conferred by a different mechanism than the dicamba/fluroxypyr-resistant kochia studied by Kumar and Jha [45]. The resistance mechanism in RockyView18 is unknown and warrants further investigation.
As wheat density increased, so did the fluroxypyr rate required to decrease biomass FW of the susceptible kochia control by 50% (Table 1). The fluroxypyr GR50 for Lethbridge18(S) was 2, 8, 12, and 25 g ae ha−1 at wheat densities equivalent to 0, 200, 400, and 600 plants m−2, respectively (equivalent to a 4.0-, 6.0-, and 12.5-fold-greater fluroxypyr rate required for the same level of control in the absence of wheat) (Table 1). This could be caused by decreased herbicide coverage of the kochia due to increased obstruction of the foliar spray by the wheat canopy as wheat density increased. However, this same trend was not observed for any of the other kochia populations or response variables, and the range in GR50 for Lethbridge18(S) among wheat densities was well below that of the field application rate (Table 1 and Table 2). Despite potential obstruction of the fluroxypyr treatment by increasing wheat density, greater interspecific interference caused by increased wheat densities was clearly effective at augmenting fluroxypyr control of the resistant kochia population (Table 1 and Table 2; Figure 1, Figure 2 and Figure 3). In contrast, Redlick et al. [19] observed a decrease in herbicide-susceptible Indian mustard [Brassica juncea (L.) Czern.] biomass ED50 (referred to as GR50 herein) in response to fluthiacet-methyl as lentil target plant densities increased from 70 to 560 plants m−2, while our data suggest the opposite response of susceptible kochia to wheat plant density when treated with fluroxypyr (Table 1).
The current study demonstrates the utility of integrating cultural weed management with herbicides for mitigation and management of herbicide-resistant kochia. Increased wheat densities altered but did not repress the expression of fluroxypyr resistance in kochia. While our study was representative of a standard dose-response experiment for resistance diagnostics in that we used resistant and susceptible populations from similar locality, further validation of our hypotheses is warranted through the generation of kochia near-isogenic lines that differ only in the fluroxypyr resistance trait. This proposed future direction would build upon the current study and confirm whether the differences observed were in fact due to the presence vs. absence of the fluroxypyr resistance trait or simply due to variability in genetic background that manifests as differential ecological fitness. While we showed the utility of increasing wheat seeding rates to augment control of fluroxypyr-resistant kochia under controlled environment, further confirmation is also required in the field to understand the full potential of this tool and the consistency of performance under variable environmental conditions. Future research should also assess whether other cultural or mechanical weed management tools (for example, competitive crops and cultivars, or decreased row spacing and more-uniform crop spatial arrangement) augment herbicide performance in a similar way, and whether further improvements in herbicide-resistant weed control could be achieved when they are implemented together in a multi-tactic integrated weed management program.

3.3. Management Implications

Improved management of fluroxypyr-resistant kochia in response to enhanced interspecific plant interference at higher wheat plant densities can help mitigate the selection for fluroxypyr resistance in kochia, and manage fluroxypyr-resistant biotypes already present within the field. When implemented proactively, increased crop seeding rates could help mitigate selection for fluroxypyr-resistant kochia through augmented control, resulting in reduced seed production and return to the soil seedbank. Many farmers in semiarid environments where kochia populations flourish are hesitant to adopt increased crop seeding rates due to the perceived risk of vegetative biomass overproduction, and the concomitant depletion of soil moisture reserves prior grain filling, resulting in yield limitations [20]. However, this has rarely been documented in the Canadian prairies where wheat plant densities often range between 150 and 250 plants m−2, and only observed at wheat densities above 450 plants m−2 [20]. The current study showed improved control of fluroxypyr-resistant kochia as wheat densities increased from 0 to 600 plants m−2, however, statistical differences among the 400 and 600 plant m−2 densities were generally absent (Figure 2 and Figure 3). Thus, targeting wheat plant densities of 450 plants m−2 could result in an optimal balance of improved crop competitive ability and augmented weed control absent of the potential or perceived yield detriments of ultra-high wheat densities. Further confirmation of these results under variable field conditions is warranted since environmental conditions can be a key driver in the competitive balance among these species [46], and because their ecological niches only partially overlap [47], suggesting that availability of certain resources will drive the competitive balance more than others.
Increased wheat seeding rate alone—or when combined with fluroxypyr treatment—was not enough to achieve adequate control of fluroxypyr-resistant kochia despite its contribution to enhanced kochia management. Therefore, increased wheat seeding rates should be considered one tool to be implemented as part of a larger and more-comprehensive integrated weed management program. Short (1–2 year) longevity of kochia seed in the soil seedbank [8,48], and large reductions in kochia fecundity in response to plant interference [1,33], represent weak points in the kochia life cycle that should be exploited as targets for effective management. Timing management to target the kochia critical period for weed seed control [31], destruction or control of viable seeds at crop harvest [49], and implementing postharvest management to prevent kochia regrowth [50], will further mitigate seedbank replenishment and therefore kochia establishment in subsequent crops. However, management aimed at depleting the kochia seedbank will only be effective if reinfestation is prevented, suggesting a need for new methods and programs to reduce transportation of this tumbleweed among farms and fields.

Supplementary Materials

The following are available online at https://www.mdpi.com/article/10.3390/agronomy11112160/s1, Figure S1: Plant survival (a) and visible control four weeks after application (WAA) (b) for three kochia populations in response to fluroxypyr rate in four wheat plant density treatments; Figure S2: Shoot biomass dry weight (DW) of the three kochia populations [RockyView18, Vulcan17, and Lethbridge18(S)] in response to fluroxypyr rate and wheat plant density (0, 200, 400, and 600 plants m−2).

Author Contributions

Conceptualization, C.M.G.; methodology, C.M.G. and M.T.K.; software, C.M.G.; validation, C.M.G.; formal analysis, C.M.G.; investigation, M.T.K. and C.M.G.; resources, C.M.G.; data curation, C.M.G.; writing—original draft preparation, C.M.G. and M.T.K.; writing—review and editing, C.M.G.; visualization, C.M.G.; supervision, C.M.G.; funding acquisition, C.M.G. All authors have read and agreed to the published version of the manuscript.

Funding

This research was funded by the Saskatchewan Ministry of Agriculture–Agriculture Development Fund, project number ADF20200318, and cofounded by the Alberta Wheat Commission, Bayer CropScience Canada, BASF Canada, Corteva Agriscience, FMC of Canada, Nufarm Canada, Manitoba Crop Alliance, Saskatchewan Barley Development Commission, Saskatchewan Pulse Growers, and the Saskatchewan Wheat Development Commission.

Data Availability Statement

The data presented in this study are available on request from the corresponding author.

Acknowledgments

The authors acknowledge Morgan Dowling, McKenzie Franz, Torin Halvorson, Monica Johnson, Kennedy Lewis, and Oscar von Wahl for their technical support during their cooperative education terms at the Lethbridge Research and Development Centre.

Conflicts of Interest

The authors declare no conflict of interest.

References

  1. Friesen, L.F.; Beckie, H.J.; Warwick, S.I.; Van Acker, R.C. The biology of Canadian weeds. 138. Kochia scoparia (L.) Schrad. Can. J. Plant Sci. 2009, 89, 141–167. [Google Scholar] [CrossRef]
  2. Manthey, G.A.; Hareland, G.A.; Zollinger, R.K.; Huseby, D.J. Kochia (Kochia scoparia) interference with oat (Avena sativa). Weed Technol. 1996, 10, 522–525. [Google Scholar] [CrossRef]
  3. Yadav, T.; Kumar, V.; Jha, P. Herbicide programs to manage glyphosate/dicamba-resistant kochia (Bassia scoparia) in glyphosate/dicamba-resistant soybean. Weed Technol. 2020, 34, 568–574. [Google Scholar] [CrossRef]
  4. Leeson, J.Y.; Hall, L.M.; Neeser, C.; Tidemann, B.; Harker, K.N. Alberta weed survey of annual crops in 2017. In Weed Survey Series Publication 19-1; Agriculture and Agri-Food Canada: Saskatoon, SK, Canada, 2019; p. 275. [Google Scholar]
  5. Schwinghamer, T.D.; Van Acker, R.C. Emergence timing and persistence of kochia (Kochia scoparia). Weed Sci. 2008, 56, 37–41. [Google Scholar] [CrossRef]
  6. Martin, S.L.; Benedict, L.; Wei, W.; Sauder, C.A.; Beckie, H.J.; Hall, L.M. High gene flow maintains genetic diversity following selection for high EPSPS copy number in the weed kochia (Amaranthaceae). Sci. Rep. 2020, 10, 18864. [Google Scholar] [CrossRef] [PubMed]
  7. Beckie, H.J.; Blackshaw, R.E.; Hall, L.M.; Johnson, E.N. Pollen- and seed-mediated gene flow in kochia (Kochia scoparia). Weed Sci. 2016, 64, 624–633. [Google Scholar] [CrossRef]
  8. Beckie, H.J.; Blackshaw, R.E.; Leeson, J.Y.; Stahlman, P.W.; Gaines, T.A.; Johnson, E.N. Seedbank persistence, germination and early growth of glyphosate-resistant Kochia scoparia. Weed Res. 2018, 58, 177–187. [Google Scholar] [CrossRef]
  9. Beckie, H.J.; Hall, L.M.; Shirriff, S.W.; Martin, E.; Leeson, J.Y. Triple-resistant kochia [Kochia scoparia L. Schrad.] in Alberta. Can. J. Plant Sci. 2019, 99, 281–285. [Google Scholar] [CrossRef] [Green Version]
  10. Geddes, C.M.; Ostendorf, T.E.; Owen, M.L.; Leeson, J.Y.; Sharpe, S.M.; Shirriff, S.W.; Beckie, H.J. Fluroxypyr-resistant kochia [Bassia scoparia (L.) A.J. Scott] confirmed in Alberta. Can. J. Plant Sci. 2021, in press. [Google Scholar] [CrossRef]
  11. Geddes, C.M.; Owen, M.L.; Ostendorf, T.E.; Leeson, J.Y.; Sharpe, S.M.; Shirriff, S.W.; Beckie, H.J. Herbicide diagnostics reveal multiple patterns of synthetic auxin resistance in kochia (Bassia scoparia). Weed Technol. 2021, in press. [Google Scholar] [CrossRef]
  12. Geddes, C.M.; Pittman, M.M.; Gulden, R.H.; Jones, T.; Leeson, J.Y.; Sharpe, S.M.; Shirriff, S.W.; Beckie, H.J. Rapid increase in glyphosate resistance and confirmation of dicamba-resistant kochia (Bassia scoparia) in Manitoba. Can. J. Plant Sci. 2021, in press. [Google Scholar] [CrossRef]
  13. Heap, I.M. The International Herbicide Resistant Weed Database. Available online: http://www.weedscience.org (accessed on 14 August 2021).
  14. Torbiak, A.T.; Blackshaw, R.E.; Brandt, R.W.; Hall, L.M.; Hamman, B.; Geddes, C.M. Herbicide mixtures control glyphosate-resistant kochia (Bassia scoparia) in chemical fallow, but their longevity warrants careful stewardship. Can. J. Plant Sci. 2021, 101, 188–198. [Google Scholar] [CrossRef]
  15. Torbiak, A.T.; Blackshaw, R.E.; Brandt, R.W.; Hamman, B.; Geddes, C.M. Herbicide strategies for managing glyphosate-resistant and -susceptible kochia (Bassia scoparia) in spring wheat. Can. J. Plant Sci. 2021, 101, 607–621. [Google Scholar] [CrossRef]
  16. Blackshaw, R.E.; Beckie, H.J.; Molnar, L.J.; Entz, T.; Moyer, J.R. Combining agronomic practices and herbicides improves weed management in wheat-canola rotations within zero-tillage production systems. Weed Sci. 2005, 53, 528–535. [Google Scholar] [CrossRef]
  17. Lemerle, D.; Lockley, P.; Koetz, E.; Diffey, S. Herbicide efficacy for control of annual ryegrass (Lolium rigidum Gaud.) is influenced more by wheat seeding rate than row spacing. Crop Pasture Sci. 2013, 64, 708–715. [Google Scholar] [CrossRef]
  18. O’Donovan, J.T.; Blackshaw, R.E.; Harker, K.N.; Clayton, G.W. Wheat seeding rate influences herbicide performance in wild oat (Avena fatua L.). Agron. J. 2006, 98, 815–822. [Google Scholar] [CrossRef]
  19. Redlick, C.; Duddu, H.S.N.; Syrovy, L.D.; Willenborg, C.J.; Johnson, E.N.; Shirtliffe, S.J. Effect of seeding rate on dose-response of wild mustard (Sinapis arvensis) to fluthiacet-methyl. Weed Sci. 2017, 65, 525–533. [Google Scholar] [CrossRef]
  20. Blackshaw, R.E.; Harker, K.N.; O’Donovan, J.T.; Beckie, H.J.; Smith, E.G. Ongoing development of integrated weed management systems on the Canadian prairies. Weed Sci. 2008, 56, 146–150. [Google Scholar] [CrossRef]
  21. Mohler, C.L. Enhancing the competitive ability of crops. In Ecological Management of Agricultural Weeds; Liebman, M., Mohler, C.L., Staver, C.P., Eds.; Cambridge University Press: Cambridge, UK, 2001; pp. 269–322. [Google Scholar]
  22. Blackshaw, R.E.; Semach, G.; O’Donovan, J.T. Utilization of wheat seeding rate to manage redstem filaree (Erodium cicutarium) in a zero-till cropping system. Weed Technol. 2000, 14, 389–396. [Google Scholar] [CrossRef]
  23. Champion, G.T.; Froud-Williams, R.J.; Holland, J.M. Interactions between wheat (Triticum aestivum L.) cultivar, row spacing and density and the effect on weed suppression and crop yield. Ann. Appl. Biol. 1998, 133, 443–453. [Google Scholar] [CrossRef]
  24. Kristensen, L.; Olsen, J.; Weiner, J. Crop density, sowing pattern, and nitrogen fertilization effects on weed suppression and yield in spring wheat. Weed Sci. 2008, 56, 97–102. [Google Scholar] [CrossRef]
  25. Lemerle, D.; Cousens, R.D.; Gill, G.S.; Peltzer, S.J.; Moerkerk, M.; Murphy, C.W.; Collins, D.; Cullis, B.R. Reliability of higher seeding rates of wheat for increased competitiveness with weeds in low rainfall environments. J. Agric. Sci. 2004, 142, 395–409. [Google Scholar] [CrossRef] [Green Version]
  26. Olsen, J.; Kristensen, L.; Weiner, J.; Griepentrog, H.W. Increased density and spatial uniformity increase weed suppression by spring wheat. Weed Res. 2005, 45, 315–321. [Google Scholar] [CrossRef]
  27. Olsen, J.; Kristensen, L.; Weiner, J. Influence of sowing density and spatial pattern of spring wheat (Triticum aestivum) on the suppression of different weed species. Weed Biol. Manag. 2006, 6, 165–173. [Google Scholar] [CrossRef]
  28. Olsen, J.; Griepentrog, H.W.; Nielsen, J.; Weiner, J. How important are crop spatial pattern and density for weed suppression by spring wheat? Weed Sci. 2012, 60, 501–509. [Google Scholar] [CrossRef]
  29. Weiner, J.; Griepentrog, H.W.; Kristensen, L. Suppression of weeds by spring wheat (Triticum aestivum) increases with crop density and spatial uniformity. J. Appl. Ecol. 2001, 38, 784–790. [Google Scholar] [CrossRef]
  30. Walker, S.R.; Medd, R.W.; Robinson, G.R.; Cullis, B.R. Improved management of Avena ludoviciana and Phalaris paradoxa with more densely sown wheat and less herbicide. Weed Res. 2002, 42, 257–270. [Google Scholar] [CrossRef]
  31. Geddes, C.M.; Davis, A.S. The critical period for weed seed control: A proposed framework to limit weed seed return. Weed Res. 2021, 61, 282–287. [Google Scholar] [CrossRef]
  32. Ramseier, D.; Weiner, J. Competitive effect is a linear function of neighbor biomass in experimental populations of Kochia scoparia. J. Ecol. 2006, 94, 305–309. [Google Scholar] [CrossRef]
  33. Menalled, F.D.; Smith, R.G. Competitiveness of herbicide-resistant and herbicide-susceptible kochia (Kochia scoparia [L.] Schrad.) under contrasting management practices. Weed Biol. Manag. 2007, 7, 115–119. [Google Scholar] [CrossRef]
  34. Vila-Aiub, M.M.; Neve, P.; Powles, S.B. Evidence for an ecological cost of enhanced herbicide metabolism in Lolium rigidum. J. Ecol. 2009, 97, 772–780. [Google Scholar] [CrossRef] [Green Version]
  35. Sheldrake, R., Jr.; Boodley, J.W. Plant growing in lightweight artificial mixes. Acta Hortic. 1966, 4, 155–157. [Google Scholar] [CrossRef]
  36. Canadian Weed Science Society—Société Canadienne de Malherbologie. Description of 0–100 Rating Scale for Herbicide Efficacy and Crop Phytotoxicity. Available online: http://www.weedscience.ca/cwss-visual-ratings-scale/ (accessed on 14 August 2021).
  37. Littell, R.C.; Milken, G.A.; Stroup, W.W.; Wolfinger, R.R.; Schabenberger, O. SAS for Mixed Models, 2nd ed.; SAS Institute Inc.: Cary, NC, USA, 2006; p. 834. [Google Scholar]
  38. Seefeldt, S.S.; Jensen, J.E.; Fuerst, E.P. Log-logistic analysis of herbicide dose-response relationships. Weed Technol. 1995, 9, 218–227. [Google Scholar] [CrossRef]
  39. R Core Team. R: A Language and Environment for Statistical Computing; R Foundation for Statistical Computing: Vienna, Austria, 2019. [Google Scholar]
  40. Knezevic, S.Z.; Streibig, J.C.; Ritz, C. Utilizing R software package for dose-response studies: The concept and data analysis. Weed Technol. 2007, 21, 840–848. [Google Scholar] [CrossRef]
  41. Ritz, C.; Baty, F.; Streibig, J.C.; Gerhard, D. Dose-response analysis using R. PLoS ONE 2015, 10, e0146021. [Google Scholar] [CrossRef] [Green Version]
  42. Ritz, C. Toward a unified approach to dose-response modeling in ecotoxicology. Environ. Toxicol. Chem. 2010, 29, 220–229. [Google Scholar] [CrossRef]
  43. Jha, P.; Kumar, V.; Lim, C.A. Variable response of kochia [Kochia scoparia (L.) Schrad.] to auxinic herbicides dicamba and fluroxypyr in Montana. Can. J. Plant Sci. 2015, 95, 965–972. [Google Scholar] [CrossRef] [Green Version]
  44. Kumar, C.; Jha, P.; Jugulam, M.; Yadav, R.; Stahlman, P.W. Herbicide-resistant kochia (Bassia scoparia) in North America: A review. Weed Sci. 2019, 67, 4–15. [Google Scholar] [CrossRef] [Green Version]
  45. Kumar, V.; Jha, P. Differences in germination, growth, and fecundity characteristics of dicamba-fluroxypyr-resistant and susceptible Kochia scoparia. PLoS ONE 2016, 11, e0161533. [Google Scholar] [CrossRef] [PubMed]
  46. Fischer, A.J.; Messersmith, C.G.; Nalewaja, J.D.; Duysen, M.E. Interference between spring cereals and Kochia scoparia related to environment and photosynthetic pathways. Agron. J. 2000, 92, 173–181. [Google Scholar] [CrossRef]
  47. Christoffoleti, P.J.; Westra, P. Competition effects with mixed stands of wheat and kochia (Kochia scoparia) biotypes resistant and susceptible to acetolactase synthase inhibitor herbicides. Sci. Agric. Piracicaba 1994, 51, 245–251. [Google Scholar] [CrossRef] [Green Version]
  48. Geddes, C.M. Burial environment drives seed mortality of kochia (Bassia scoparia), wild oat (Avena fatua), and volunteer canola (Brassica napus) irrespective of crop species. Plants 2021, 10, 1961. [Google Scholar] [CrossRef] [PubMed]
  49. Tidemann, B.D.; Hall, L.M.; Harker, K.N.; Beckie, H.J. Factors affecting weed seed devitalization with the Harrington Seed Destructor. Weed Sci. 2017, 65, 650–658. [Google Scholar] [CrossRef]
  50. Kumar, V.; Jha, P. Influence of herbicides applied postharvest in wheat stubble on control, fecundity, and progeny fitness of Kochia scoparia in the US Great Plains. Crop Prot. 2015, 71, 144–149. [Google Scholar] [CrossRef] [Green Version]
Figure 1. Plant survival (a) and visible control four weeks after application (WAA) (b) for three kochia populations [RockyView18, Vulcan17, and Lethbridge18(S)] in response to fluroxypyr rate and wheat plant density (0, 200, 400, and 600 plants m−2). Kochia populations are displayed separately within each subfigure. Dots indicate means, while lines indicate the predicted values from the fitted three-parameter, and two-parameter Weibull type 1 models, respectively.
Agronomy 11 02160 g001
Figure 2. Shoot biomass fresh weight (FW) of the three kochia populations [RockyView18, Vulcan17, and Lethbridge18(S)] in response to fluroxypyr rate and wheat plant density (0, 200, 400, and 600 plants m−2). Lines indicate predicted values from the fitted three-parameter Weibull type 1 model, while bands indicate the 95% confidence intervals.
Agronomy 11 02160 g002
Figure 3. The lethal rate of fluroxypyr required to decrease kochia plant survival by 50% (LD50) (a), and the effective rate of fluroxypyr required to achieve 50% visible control (ED50) four weeks after application (WAA) (b), for the three kochia populations [RockyView18, Vulcan17, and Lethbridge18(S)] and four wheat plant densities (0, 200, 400, and 600 plants m−2). Dots indicate the predicted LD50 or ED50 values, while error bars indicate ± SE. * indicates a significant difference in slope of the line from 0 at p < 0.05.
Agronomy 11 02160 g003
Table 1. Parameter estimates for the three-parameter Weibull type 1 models used to describe plant survival and shoot biomass fresh weight (FW) for three kochia populations in response to fluroxypyr rate in four wheat plant density treatments.
PopulationWheat
Density
(Plants m−2)
b (± SE) a d (± SE) e (± SE)LD50/GR50 b
(± SE)
(g ae ha−1)
Population R/S cWheat Density R/S dPopulation by Wheat Density R/S e
Plant Survival (%)
Lethbridge18(S)01.2 (0.32)99 (7.6)33 (4.7)24 (4.3)
2001.4 (0.81)100 (7.5)16 (3.0)12 (3.8)0.50.5
4002.1 (1.16)94 (7.5)19 (2.1)16 (2.2)0.70.7
6000.5 (0.63)94 (7.5)4 (8.7)2 (6.0)0.10.1
Vulcan1700.4 (0.10)101 (7.4)102 (29.5)43 (15.8)1.81.8
2000.3 (0.09)92 (7.5)61 (23.7)21 (11.7)1.80.50.9
4000.2 (0.09)92 (7.2)9 (11.6)1 (2.4)0.1 ***<0.1<0.1 ***
6000.4 (0.11)86 (7.6)40 (18.5)14 (9.7)7.00.30.6
RockyView1800.8 (0.24)97 (7.5)413 (83.3)258 (62.6)10.8 **10.8 **
2001.0 (0.26)94 (6.9)283 (47.6)193 (40.4)16.1 *0.78.0 **
4000.8 (0.17)100 (6.9)202 (36.7)129 (27.4)8.1 ***0.55.4 **
6000.7 (0.14)98 (6.9)168 (33.9)103 (23.4)51.50.44.3 **
Biomass FW (g pot−1)
Lethbridge18(S)00.3 (0.07)30 (6.7)6 (6.9)2 (2.3)
2000.4 (0.11)12 (3.4)23 (20.5)8 (9.6)4.0 *4.0 *
4000.5 (0.14)10 (3.1)25 (19.5)12 (11.5)6.0 ***6.0 ***
6000.6 (0.18)5 (1.8)46 (31.6)25 (21.1)12.5 ***12.5 ***
Vulcan1700.4 (0.11)30 (6.5)56 (34.1)25 (19.5)12.512.5
2000.3 (0.11)16 (4.2)39 (46.5)10 (16.7)1.30.45.0
4000.2 (0.13)10 (2.9)29 (46.4)6 (14.4)0.50.23.0
6000.3 (0.14)8 (2.5)37 (42.5)12 (19.1)0.50.56.0
RockyView1800.5 (0.11)43 (8.6)64 (32.5)30 (20.0)15.015.0
2000.5 (0.13)16 (4.0)59 (39.1)26 (22.6)3.30.913.0
4000.4 (0.14)11 (2.9)61 (39.6)29 (24.1)2.41.014.5
6000.6 (0.13)11 (2.9)38 (20.6)20 (13.5)0.80.710.0
a Parenthetical values indicate the SE. b LD50 and GR50 indicate the fluroxypyr rate required to reduce kochia plant survival or shoot biomass fresh weight, respectively, by 50% relative to the untreated control for the corresponding kochia population and wheat plant density. c Resistance factor (resistant/susceptible) calculated among kochia populations within each wheat plant density. d Resistance factor (wheat density/no wheat control) calculated among wheat plant densities within each kochia population. e Resistance factor (resistant/susceptible) calculated relative to the susceptible kochia population absent of wheat interference. *, **, and *** indicate a significant difference in the resistance factor (R/S) from 1 at p < 0.05, p < 0.01, and p < 0.001, respectively.
Table 2. Parameter estimates for the two-parameter Weibull type 1 models used to describe visible control of three kochia populations at two and four weeks after application (WAA) of fluroxypyr rates in four wheat plant density treatments.
PopulationWheat
Density
(Plants m−2)
b (± SE) ae (± SE)ED50 b
(± SE)
(g ae ha−1)
Population
R/S c
Wheat
Density
R/S d
Population by Wheat Density R/S e
Visible Control (%) 2 WAA
Lethbridge18(S)0−0.4 (0.06)4 (2.0)11 (3.8)
200−0.3 (0.06)4 (2.0)11 (4.2)1.01.0
400−0.3 (0.06)2 (1.5)7 (3.6)0.60.6
600−0.2 (0.06)1 (0.3)1 (1.7)0.10.1
Vulcan170−0.3 (0.05)8 (2.9)23 (5.3)2.12.1
200−0.3 (0.05)5 (2.7)20 (6.4)1.80.91.8
400−0.1 (0.05)1 (0.4)2 (3.3)0.30.10.2 **
600−0.2 (0.05)1 (1.4)8 (4.7)8.00.30.7
RockyView180−0.6 (0.06)44 (4.0)77 (6.7)7.0 *7.0 *
200−0.5 (0.05)59 (6.1)116 (11.7)10.5 *1.5 ***10.5 **
400−0.5 (0.05)42 (4.8)87 (9.1)12.41.17.9 *
600−0.5 (0.05)42 (4.6)82 (8.1)82.01.17.5 *
Visible Control (%) 4 WAA
Lethbridge18(S)0−0.5 (0.07)7 (2.2)14 (3.2)
200−0.4 (0.08)3 (1.6)7 (2.9)0.50.5
400−0.4 (0.08)2 (1.3)4 (2.6)0.30.3
600−0.4 (0.08)2 (1.3)5 (2.5)0.40.4
Vulcan170−0.3 (0.05)5 (2.5)17 (5.4)1.21.2
200−0.3 (0.05)3 (2.2)14 (5.5)2.00.81.0
400−0.1 (0.05)0 (0.1)1 (1.3)0.3 **0.10.1 ***
600−0.3 (0.06)2 (1.4)7 (3.6)1.40.40.5
RockyView180−0.6 (0.06)64 (6.0)114 (10.2)8.1 ***8.1 ***
200−0.6 (0.05)50 (4.9)92 (8.4)13.1 *0.86.6 ***
400−0.7 (0.06)40 (3.6)68 (5.8)17.00.6 ***4.9 **
600−0.7 (0.06)39 (3.4)65 (5.2)13.00.6 ***4.6 **
a Parenthetical values indicate the SE. b ED50 indicates the effective rate of fluroxypyr required to achieve 50% visible control relative to the untreated control for the corresponding kochia population and wheat plant density. c Resistance factor (resistant/susceptible) calculated among kochia populations within each wheat plant density. d Resistance factor (wheat density/no wheat control) calculated among wheat plant densities within each kochia population. e Resistance factor (resistant/susceptible) calculated relative to the susceptible kochia population absent of wheat interference. *, **, and *** indicate a significant difference in the resistance factor (R/S) from 1 at p < 0.05, p < 0.01, and p < 0.001, respectively.
Publisher’s Note: MDPI stays neutral with regard to jurisdictional claims in published maps and institutional affiliations.

