Article

Yield and Economic Response of Modern Cotton Cultivars to Nitrogen Fertilizer

by
Irish Lorraine B. Pabuayon
1,*,
Donna Mitchell-McCallister
2,3,
Katie L. Lewis
1,3 and
Glen L. Ritchie
1
1
Department of Plant and Soil Science, Texas Tech University, P.O. Box 42122, Lubbock, TX 79409, USA
2
Department of Agricultural and Applied Economics, Texas Tech University, P.O. Box 42132, Lubbock, TX 79409, USA
3
Texas A&M AgriLife Research and Extension Center, 1102 East FM 1294, Lubbock, TX 79403, USA
*
Author to whom correspondence should be addressed.
Agronomy 2021, 11(11), 2149; https://doi.org/10.3390/agronomy11112149
Submission received: 19 September 2021 / Revised: 19 October 2021 / Accepted: 20 October 2021 / Published: 26 October 2021

Abstract

:
Non-optimal application of nitrogen (N) fertilizer in cotton (Gossypium hirsutum L.) production systems often results from a producer’s uncertainty in predicting the N rate that ensures maximum economic return. Residual soil nitrate-N (NO3-N) is also often unaccounted for in fertilizer management decisions. In this study, the lint yield and profitability of two cotton cultivars (FiberMax FM 958 and Deltapine DP 1646 B2XF) were compared across five N fertilizer treatments [0 kg ha−1 (control), 45 kg ha−1 (N-45), 90 kg ha−1 (N-90), 135 kg ha−1 (N-135), 180 kg ha−1 (N-180)] from 2018 to 2020. For both cultivars, additional N fertilizer on top of the control treatment did not increase the lint yield of cotton. For each year, both control and N-45 treatments resulted in the greatest revenue above variable costs (RAVC) values for all cultivars. The improved N partitioning efficiency in newer cultivars and the high levels of residual soil NO3-N allowed sustained plant growth and yield even with reduced N application. Overall, the results show the advantage of reducing N inputs in residual N-rich soils to maintain yield and increase profits. These findings are important in promoting more sustainable agricultural systems through reduced chemical inputs and maintained soil health.

1. Introduction

Changes in genetics, environment, and management practices are key drivers toward increased cotton (Gossypium hirsutum L.) yields. Cotton breeding has resulted in new cultivars with improved traits such as increased production of fibers per ovule [1,2], seeds per boll [3], bolls per plant [4], and boll weight [5]. In addition, selective breeding for reduced seed size and increased number of seeds per boll has contributed to the yield increase for the last 30 years [6,7]. In addition to the genotypic improvements, yield increases from the 1990s to the 2010s were also highly influenced by environmental factors (i.e., temperature, rainfall, soil texture) and management strategies. The adoption of new technologies and optimized management strategies including the implementation of stage-based timing of deficit irrigation applications through subsurface drip irrigation and 4R fertilizer stewardship (application of the right fertilizer source at the right rate, right time, and right place) resulted in increased yields [8,9,10,11,12,13,14,15]. With these changes, it is likely that the improved yield potential may be associated with increased efficiency of nutrient accumulation and partitioning by newer cotton cultivars, particularly for nitrogen (N) [16].
Among the essential nutrients, N is required in the largest amounts and is most often the limiting factor in crop growth as it is required for photosynthesis and canopy development in cotton [17,18,19]. As a result, it is the most critical component of fertilizer that is being added to cotton in order to elicit a positive yield response [18]. Application of N fertilizer less than the amount required for optimum growth could lead to early senescence and reduced photosynthetic rate and canopy development [20]. Typically, cotton yield increases with the application rate of N fertilizer until it reaches a plateau (optimum level), beyond which additional N fertilizer does not affect yield [21]. If N is applied at a greater than optimal rate, excessive production of vegetative tissues may be favored over reproductive tissues [22,23]. Even though it is necessary to support reproductive growth, excessive vegetative growth consumes the assimilates required for fruiting structure development, leading to delayed maturity and reduced yield potential and quality of cotton [16]. In addition, superoptimal application of N in cotton may decrease lint turnout at maturity [24]. Boquet and Breitenbeck [25] reported that in addition to the residual soil nitrate-N (NO3-N), a fertilizer rate of 84 kg N ha−1 was optimal for sustained cotton growth and development, and additional N fertilizer application did not significantly improve the yield. Dong, Li, Eneji and Zhang [20] reported that excess N fertilizer application on top of 264 kg N ha−1 at high planting density reduced boll load. These studies indicate that N from fertilizer sources is often not efficiently used by cotton, especially when residual soil NO3-N levels are high [26,27]. This observed plateau for N application benefit is also observed in other crops such as alfalfa (Medicago sativa L.) and maize (Zea mays L.), wherein being grown in soil with high levels of residual NO3-N did not require additional N fertilizer in order to optimize the economic return [28,29]. Availability of information about residual soil NO3-N before the start of the growing season could help farmers avoid underestimating or overestimating the recommended fertilizer rates.
The existing recommended N fertilizer rates that are being used in cotton production are based on nutrient uptake information from previous reports in the early 1990s [30,31]. Mullins and Burmester [30] reported that a cotton crop requires an average of 19.9 kg N per 100 kg of lint produced. A more recent study re-evaluating nutrient requirements of cotton grown in the Southern High Plains reported that newer cotton cultivars require an average of 12.3 kg N per 100 kg of lint [16]. This updated value suggests that newer cultivars take up and remobilize N more efficiently than was previously observed. Comparing the existing recommended rates and the new information on uptake and nutrient use data, it is possible that fertilizers are being applied in amounts that are different from the optimum requirements of newer cotton cultivars. Application of fertilizer rates lower than optimal may result in suboptimal yield, but excessive fertilizer application may result in wasted variable expenses and negatively impact soil health [25]. Dhakal, et al. [32] reported 18.1 kg N per bale of cotton as the optimum N recommendation in the Southern High Plains based on a crop yield model that accounts for residual N from 2004 to 2015. However, cotton has an indeterminate growth habit and is considered to be very responsive to changes in both management practices and environmental conditions. In addition, newer cultivars have better nutrient uptake and partitioning efficiency, and optimal yield potential can be achieved with N rates lower than the existing recommendations for cotton production [16]. This study has the following objectives: (1) compare the yield response of two cotton cultivars to five rates of N fertilizer in a high residual soil N environment, (2) identify the optimal N fertilizer rate that will maximize profitability based on market value projections for cotton, and (3) compare the two cultivars based on the probability of positive profitability.

2. Materials and Methods

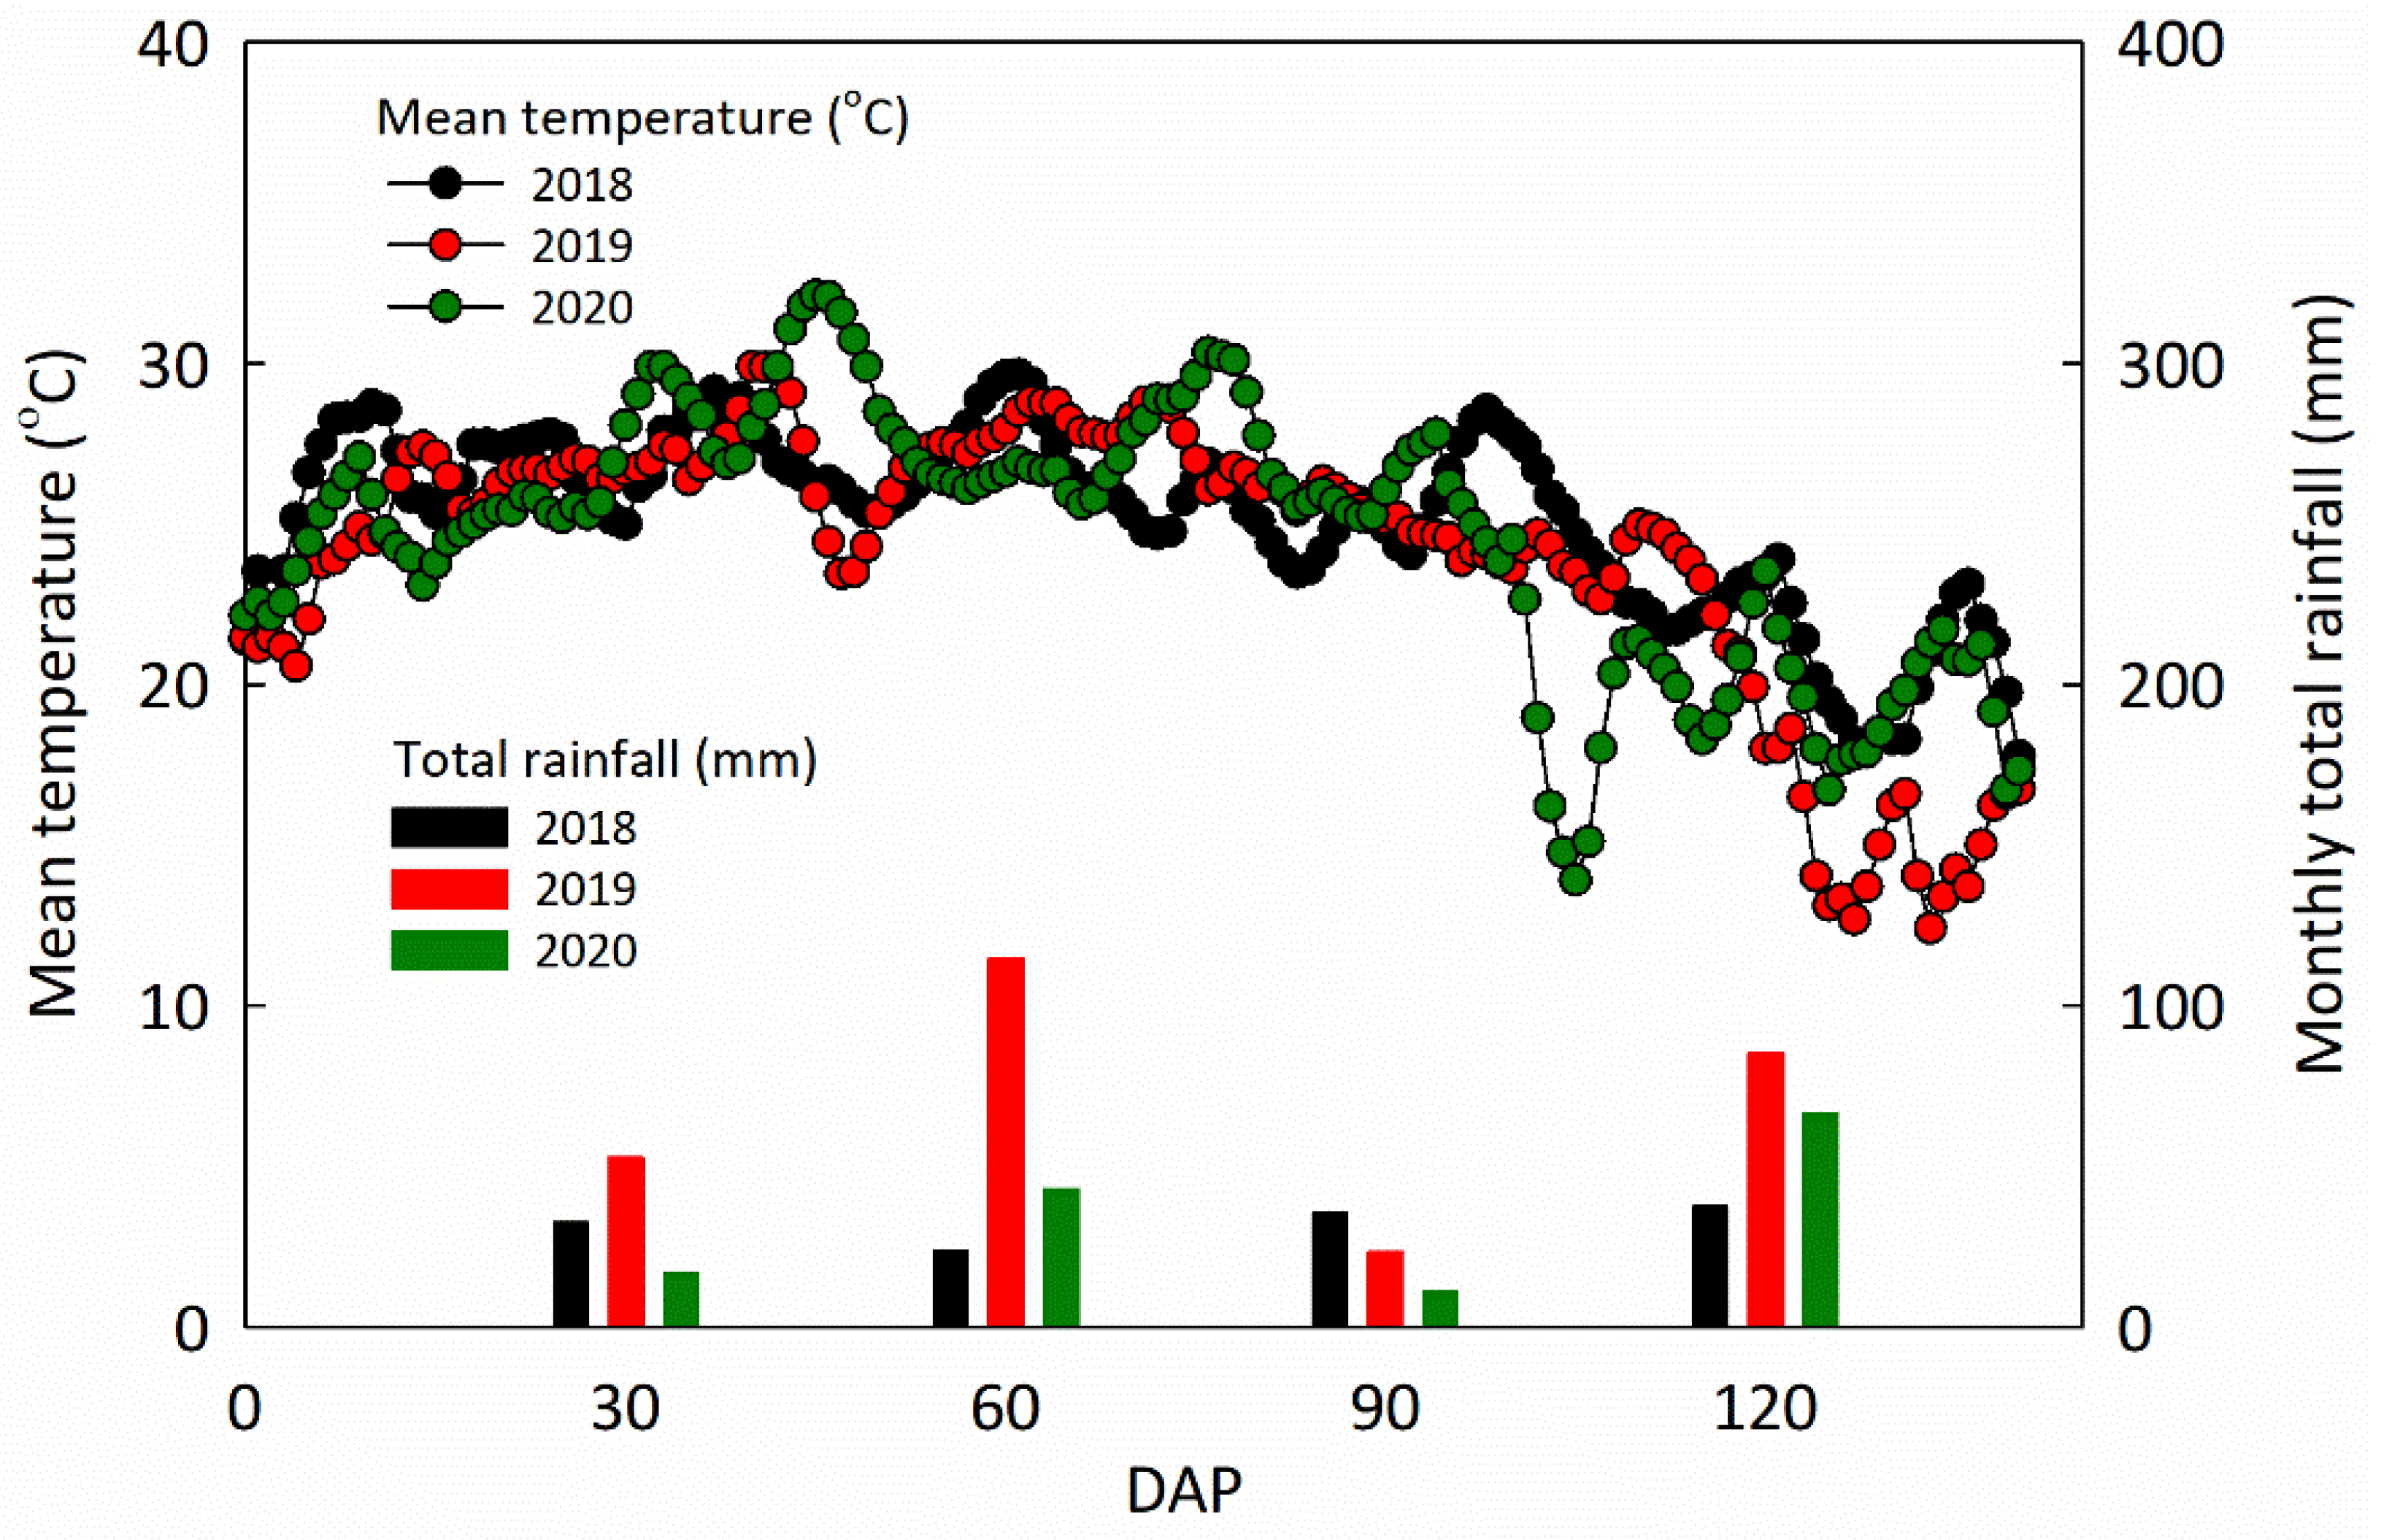
2.1. Experiment Site and Management

Studies were conducted in 2018, 2019, and 2020 at the Texas Tech University Research Farm in New Deal, TX, USA (33° 44’ 13.76” N, 101° 43’ 58.04” W, 994 m above sea level). The location has a semi-arid climate with a mean annual precipitation of 483 mm for the last seven years based on the data obtained from an on-site weather station (Campbell Scientific, Logan, UT, USA). The mean temperatures (°C) and monthly total rainfall amounts (mm) for each growing season are presented in Figure 1. The soil is a Pullman clay loam (fine, mixed, superactive, thermic, Torrertic Paleustolls) [33], with pH ranging from 7.9 to 8.1 across 0 to 60 cm depth.
For each year, the experiment was laid out in a split plot randomized complete block design with cultivars as main plots and N fertilizer rates as subplots, with four replicates. Each plot has eight 7.62 m long rows and rows were spaced 1.02 m apart. Cotton cultivars FiberMax 958 LL (FM 958; PI 642049) and Deltapine 1646 B2XF (DP 1646) were planted on 21 May 2018, 31 May 2019, and 29 May 2020 at an average density of 13.0 plants m−2. Five rates of N fertilizer were applied at 0 kg ha−1 (control), 45 kg ha−1 (N-45), 90 kg ha−1 (N-90), 135 kg ha−1 (N-135), and 180 kg ha−1 (N-180) in each year. The liquid N fertilizer was split-applied as urea-ammonium nitrate (UAN, 32-0-0) at 40% pre-plant and 60% side-dressed at 51 days after planting (DAP), using a coulter applicator. Phosphorus (90 kg P2O5 ha−1) and potassium (30 kg K2O ha−1) fertilizers were applied 100% at pre-plant.

2.2. Sample and Data Collection

Soil samples were collected 30 days before planting each year at 0–15 cm, 15–30 cm, and 30–60 cm depth intervals on a per plot basis. These soil samples were dried in an oven at 60 °C for 7 days, ground to pass through a 2-mm mesh screen and submitted for pH and NO3-N analyses to the Texas A&M AgriLife Extension Soil, Water, and Forage Testing Laboratory (College Station, TX, USA). Soil pH of a 1:2 soil to water ratio extract was determined using a hydrogen selective electrode [34]. Soil NO3-N was determined using the cadmium reduction method followed by spectrophotometric measurement [35]. Results of analysis are reported in Table 1. Mature cotton bolls were harvested within a 25 m2 area on 10 November 2018 and on 4 November in 2019 and 2020.

2.3. Economic Analysis

Partial budgets were created using management data collected from the experiments. All input prices used in the economic analysis were based on the average of the three study years (Table 2). Total revenue was calculated as the product of lint yield (kg ha−1) and average lint price ($1.40 kg−1) based on the 2018–2020 Texas A&M AgriLife Extension Service cotton budget estimation. It was assumed that the seed was used as payment for ginning costs; therefore, revenue from the seed was not estimated. Fixed costs were not considered, based on the assumption that they did not change among treatments. Prices of the management practices are based on the 2018–2020 Texas Agricultural Custom Rates Survey (Texas A&M AgriLife Extension Service, 2018–2020). Variable costs comprised of costs of land preparation, seed, planting, chemical applications, irrigation, maintenance, and harvest-related operations. Revenue above variable costs (RAVC) was calculated as the difference between total revenue and variable costs, and this represented our measure of profitability.
Since the location of the experimental plots within a field changed from year to year, the profit-maximizing N fertilization rates using a yield response to N with a N carryover function were not calculated. Instead, a Monte Carlo simulation was performed on the RAVC for each N fertilizer treatment to assess the probability of positive profitability for both cotton cultivars. The simulations were performed using Simetar©, an Excel add-in developed by Richardson [36]. Due to the limited number of yield observations, RAVC was simulated using 500 iterations with an empirical probability distribution, which prevents having to force the data to fit into a specific distribution [37]. Cumulative Distribution Functions (CDFs) were charted to compare the simulated values for each treatment. Each treatment was ranked using second degree stochastic dominance. The ranking procedure was performed in Simetar© using Stochastic Dominance with Respect to a Function (SDRF). Stoplight charts were created to show the probabilities of generating between $100 and $1000 ha−1 for each N fertilizer treatment and cultivar. The probabilities of achieving favorable, unfavorable, and questionable outcomes are represented by green, red, and yellow color, respectively.

2.4. Statistical Analysis

Statistical analyses were performed on crop yield and RAVC using the Generalized Linear Mixed Model (GLIMMIX) procedure in SAS 9.4 (SAS Institute, 2013). The method of determining statistical significance followed Fisher’s protected test: the significance of the overall test was determined first, and least-squares mean separation was conducted in cases where the overall test significance met a critical P-value of 0.05. Cultivar and N rates were considered as fixed effect factors. Based on recommendations by Littell, et al. [38], within a split-plot design, replicates were treated as random effects as were the combinations of replicates and main plots and combinations of replicates and year. Where appropriate, interactions between cultivar and year and between N rates and year were tested for significant interaction effects to determine whether to pool information by year.

3. Results and Discussion

3.1. Stability of Lint Yield across Different N Fertilizer Rates

Significant interaction effects were observed between year and cultivar treatments on lint yield (Table 3; p < 0.001). As a result, differences in lint yield were analyzed separately for each year and cultivar (Table 4). There was no significant interaction between year and N treatments on lint yield (Table 3; p = 0.41), indicating that lint yield obtained for each growing season were not dependent on the rates of N supplied. Lint yield among the different N treatments were not significantly different for each cultivar and each growing season (Table 3 and Table 4). In 2019, lint yield ranged from 825 to 969 kg ha−1 and from 731 to 843 kg ha−1, for DP 1646 and FM 958, respectively (Table 4). These values corresponded to a reduction of 47–53% (DP 1646) and 50–53% (FM 958) in final yield relative to 2018. The 2019 growing season was challenging for cotton production in the Southern High Plains of Texas, due to extended rains at the start of the season (Figure 1) followed by drought and high temperatures in the middle of the season [16], which stressed the plants at the blooming/boll production stage. Hence, it is not surprising to observe a substantially lower lint yield in 2019 compared to 2018. In 2020, lint yield ranged from 860 to 905 kg ha−1 and from 1006 to 1189 kg ha−1, for DP 1646 and FM 958, respectively (Table 4). These values corresponded to a reduction of 47–50% (DP 1646) and 26–43% (FM 958) in final yield relative to 2018. The yield reduction in the 2020 growing season was attributed to the early first cold snap in early September (104 DAP) followed by several days with mean temperatures less than 20 °C (105–120 DAP) (Figure 1). Abrupt cold weather at this stage interrupted the carbohydrate accumulation in the later-developing bolls and prevented them from reaching maturity, leading to fewer numbers of open bolls and consequently lower yield. Higher residual soil N level in 2020 did not compensate for the yield loss as cotton plants are more sensitive to temperature during boll maturity.
For each year, there was no significant interaction between N rate and cultivar treatments on lint yield (Table 3). As a result, differences between cultivars were compared in terms of yields averaged across N rates (Table 4). In 2018, average yields between DP 1646 and FM 958 were not significantly different (Table 4; p = 0.841). In 2019, the lint yield of DP 1646 averaged across N treatments was significantly greater than that of FM 958 (Table 4; p = 0.003). In 2020, lint yield of FM 958 averaged across N treatments was greater than DP 1646 (Table 4; p < 0.001). Under suboptimal conditions in the middle of the season, a longer season cultivar such as DP 1646 can efficiently partition resources towards yield production [16]. However, suboptimal conditions at the end of the reproductive stage prevented the immature bolls of DP 1646 from completely maturing and may have contributed to yield reductions.
The lack of a significant yield response to increasing rates of N can be attributed to the level of soil residual NO3-N. The residual NO3-N in the soil serves a vital N resource especially when concentrated in the root zones where maximum nutrient absorption occurs early in the season. In this study, the total amount of residual soil NO3-N across 0 to 60 cm soil depth for each growing season may have been sufficient to sustain plant growth and maintain yield even without additional N fertilizer (Table 1). Results indicated that N input does not always translate to yield, primarily due to cultivar dependence of response and to the differences in upper limit of uptake. It can be further concluded that the cultivars tested in the study reached the limit of the beneficial effect of supplemental fertilizer on top the available residual soil N.

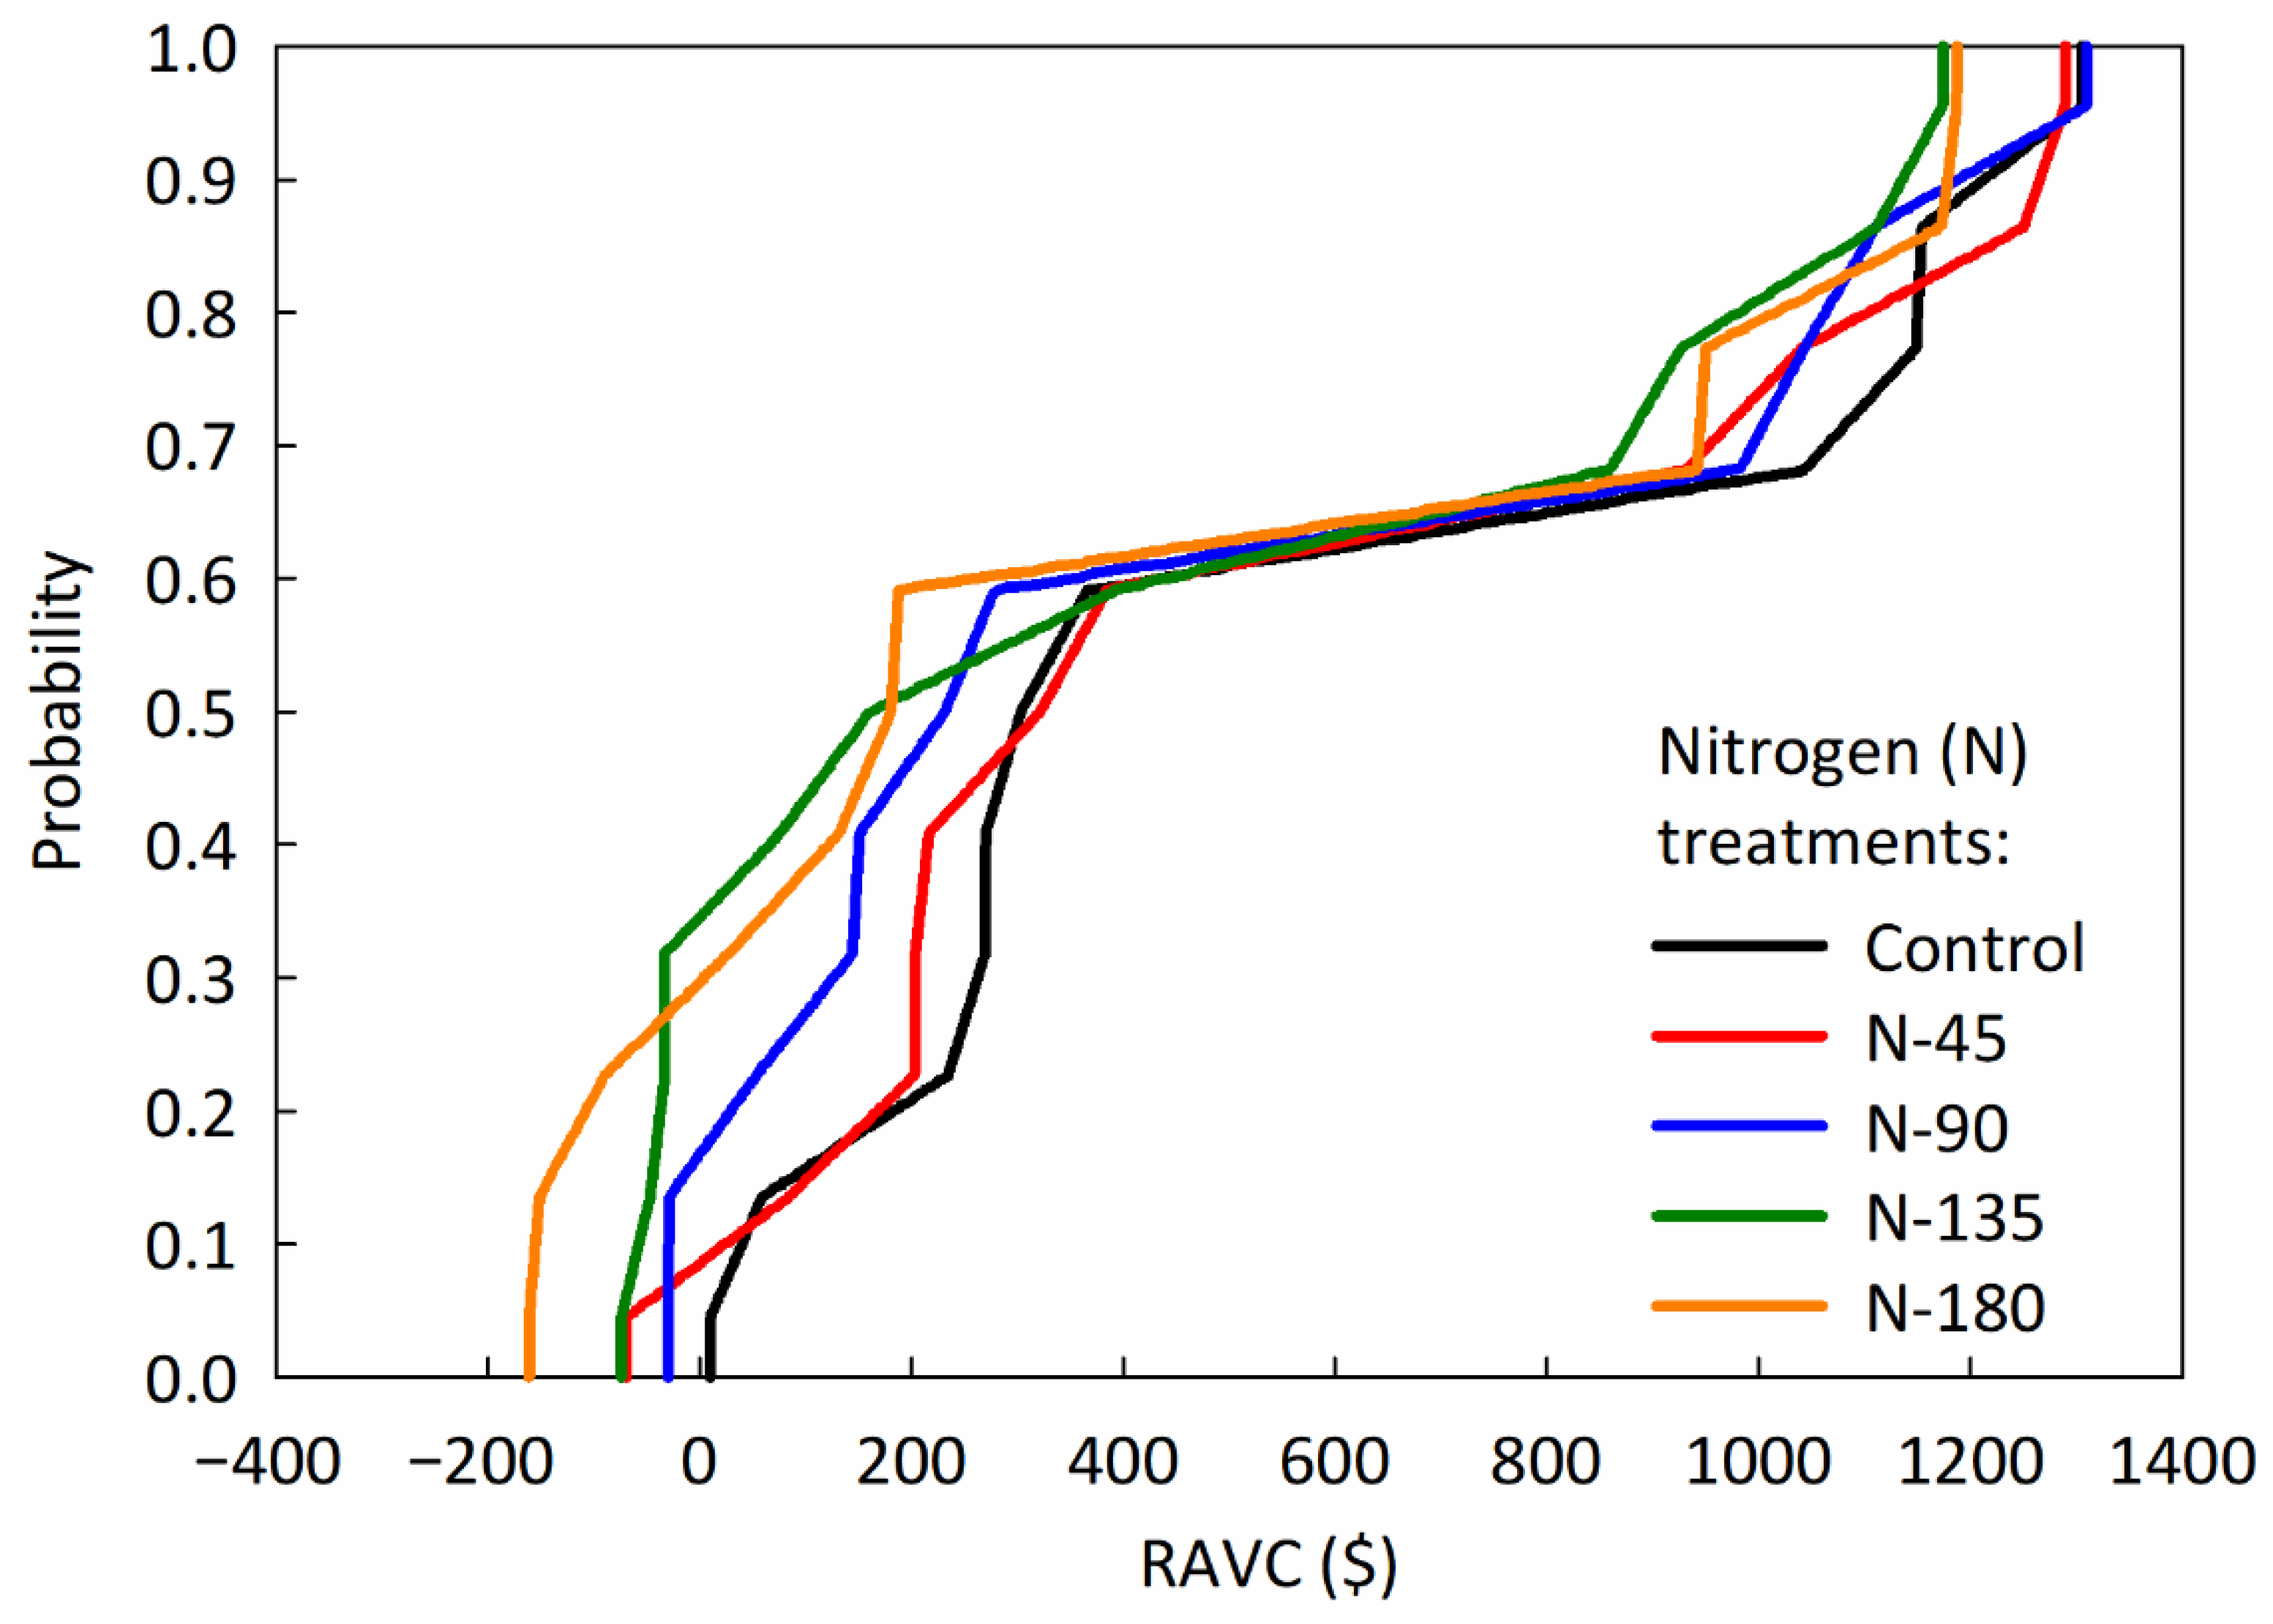
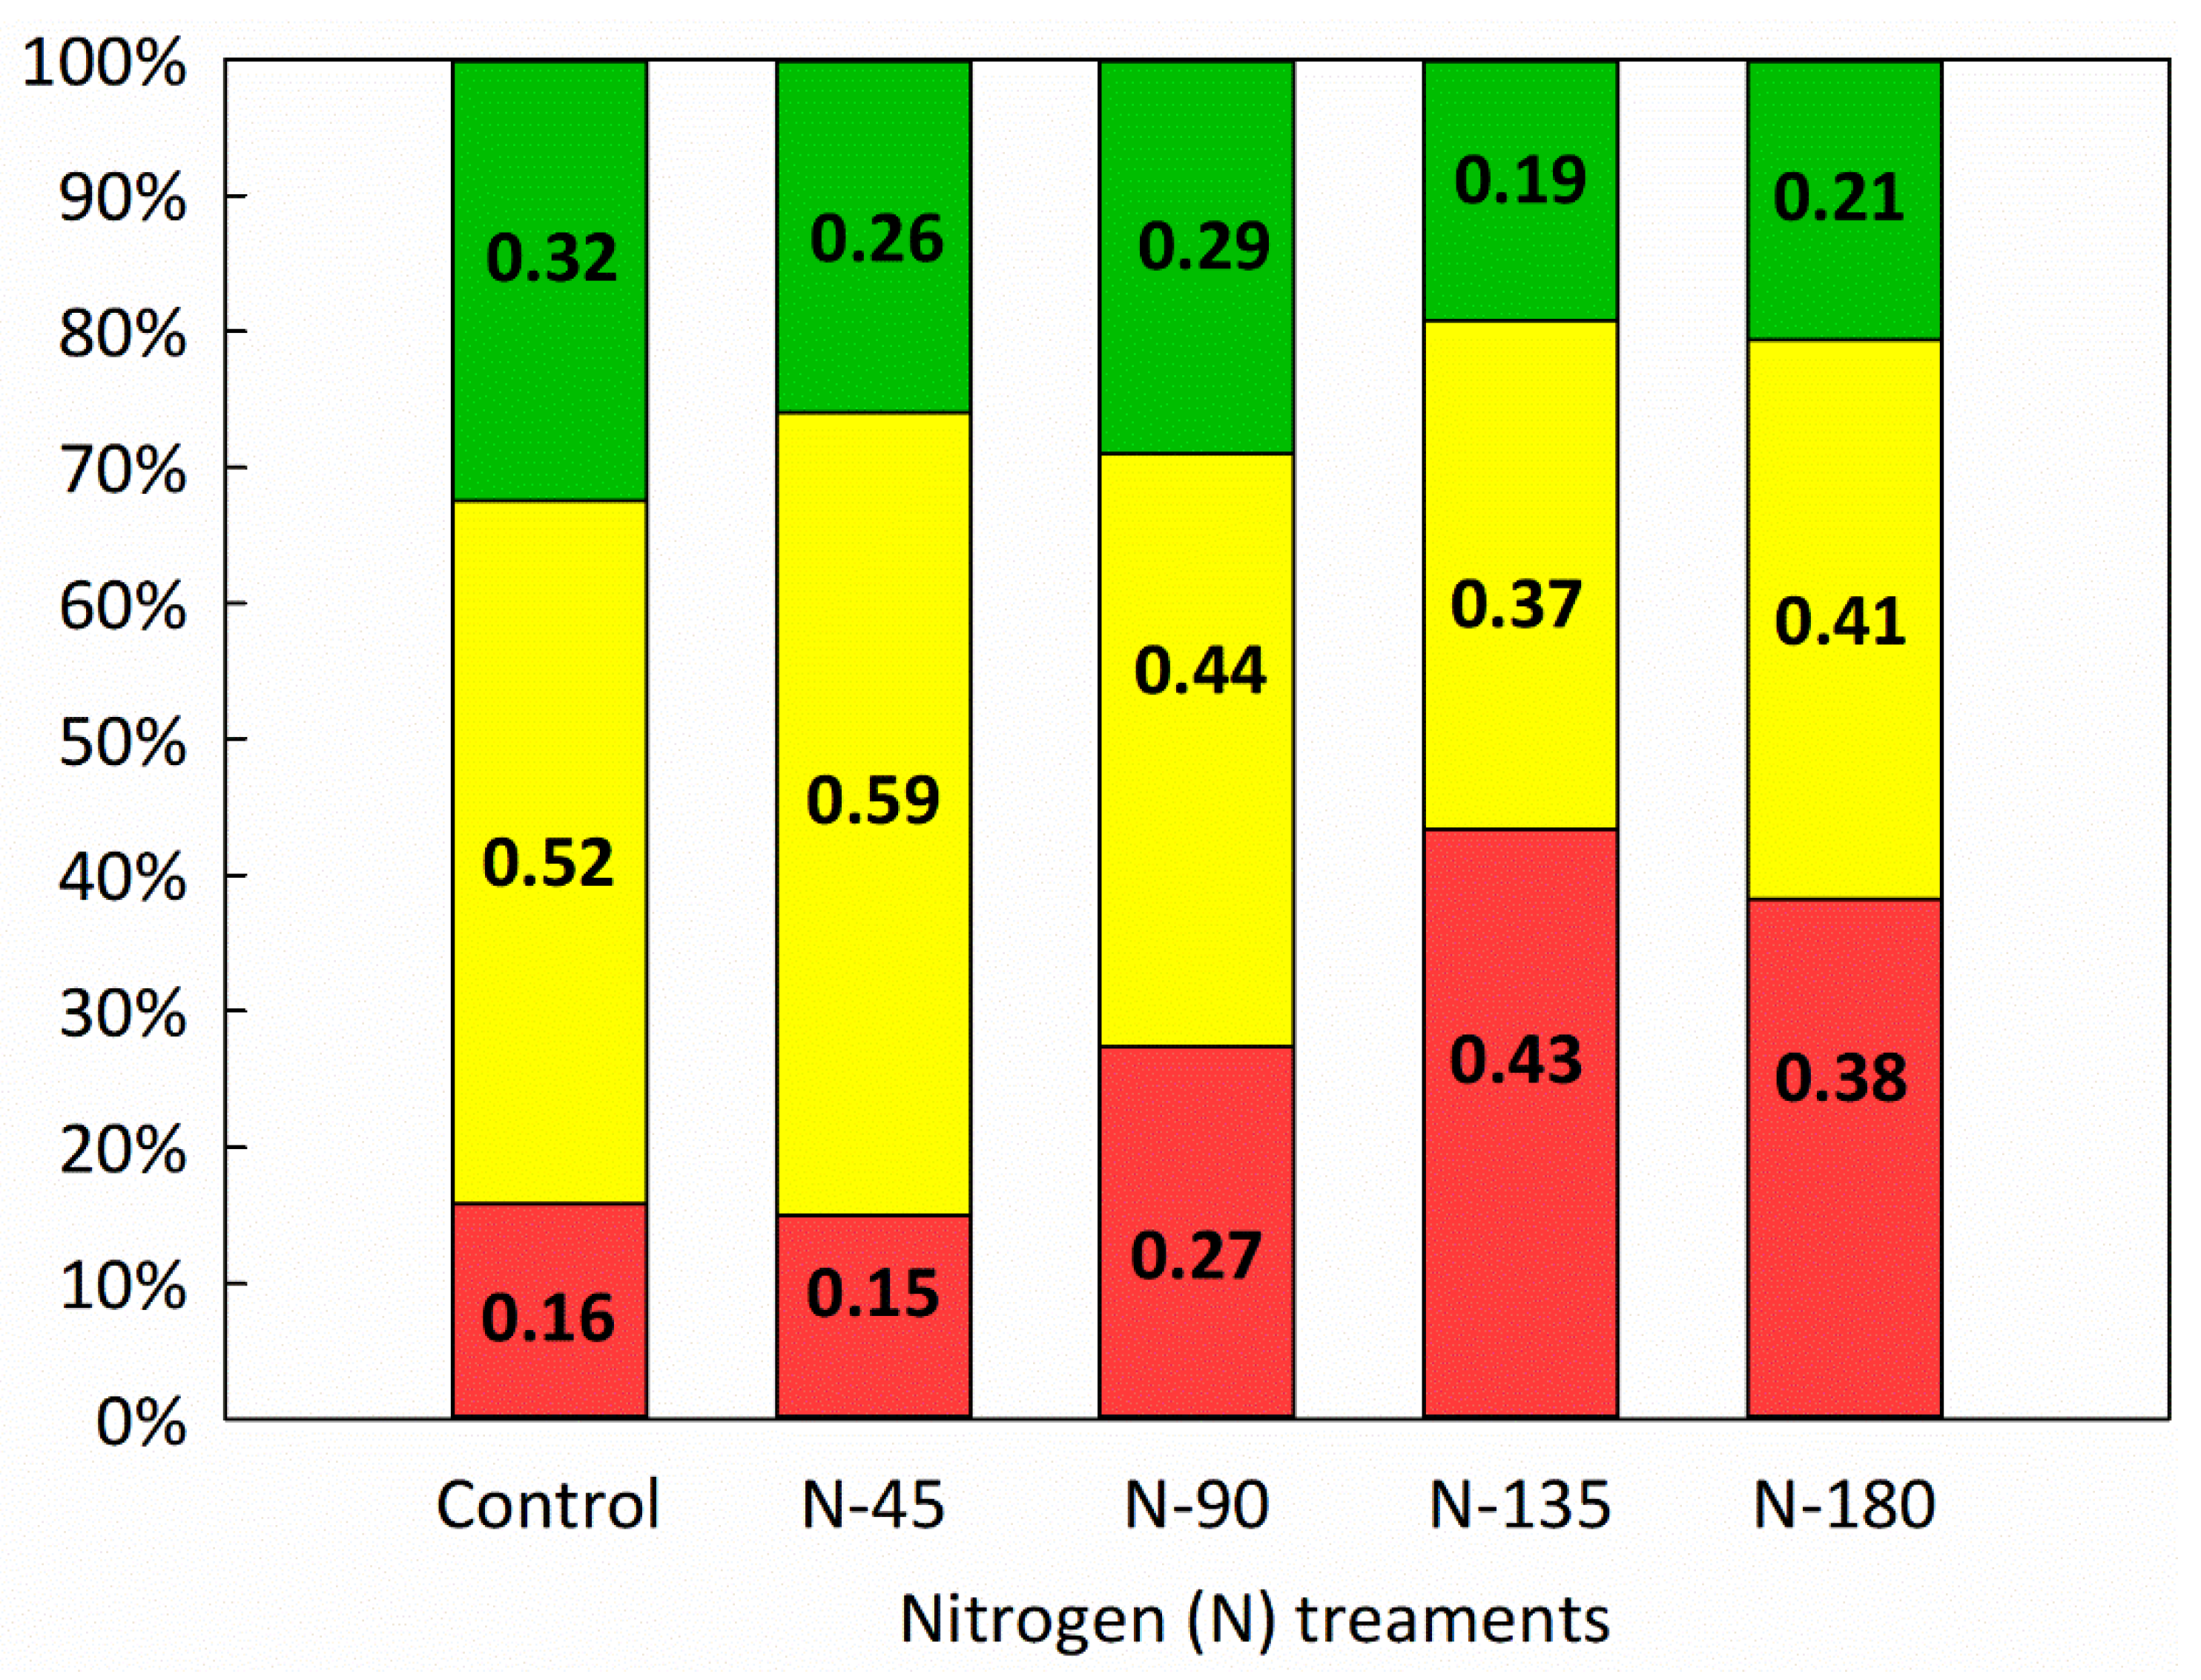
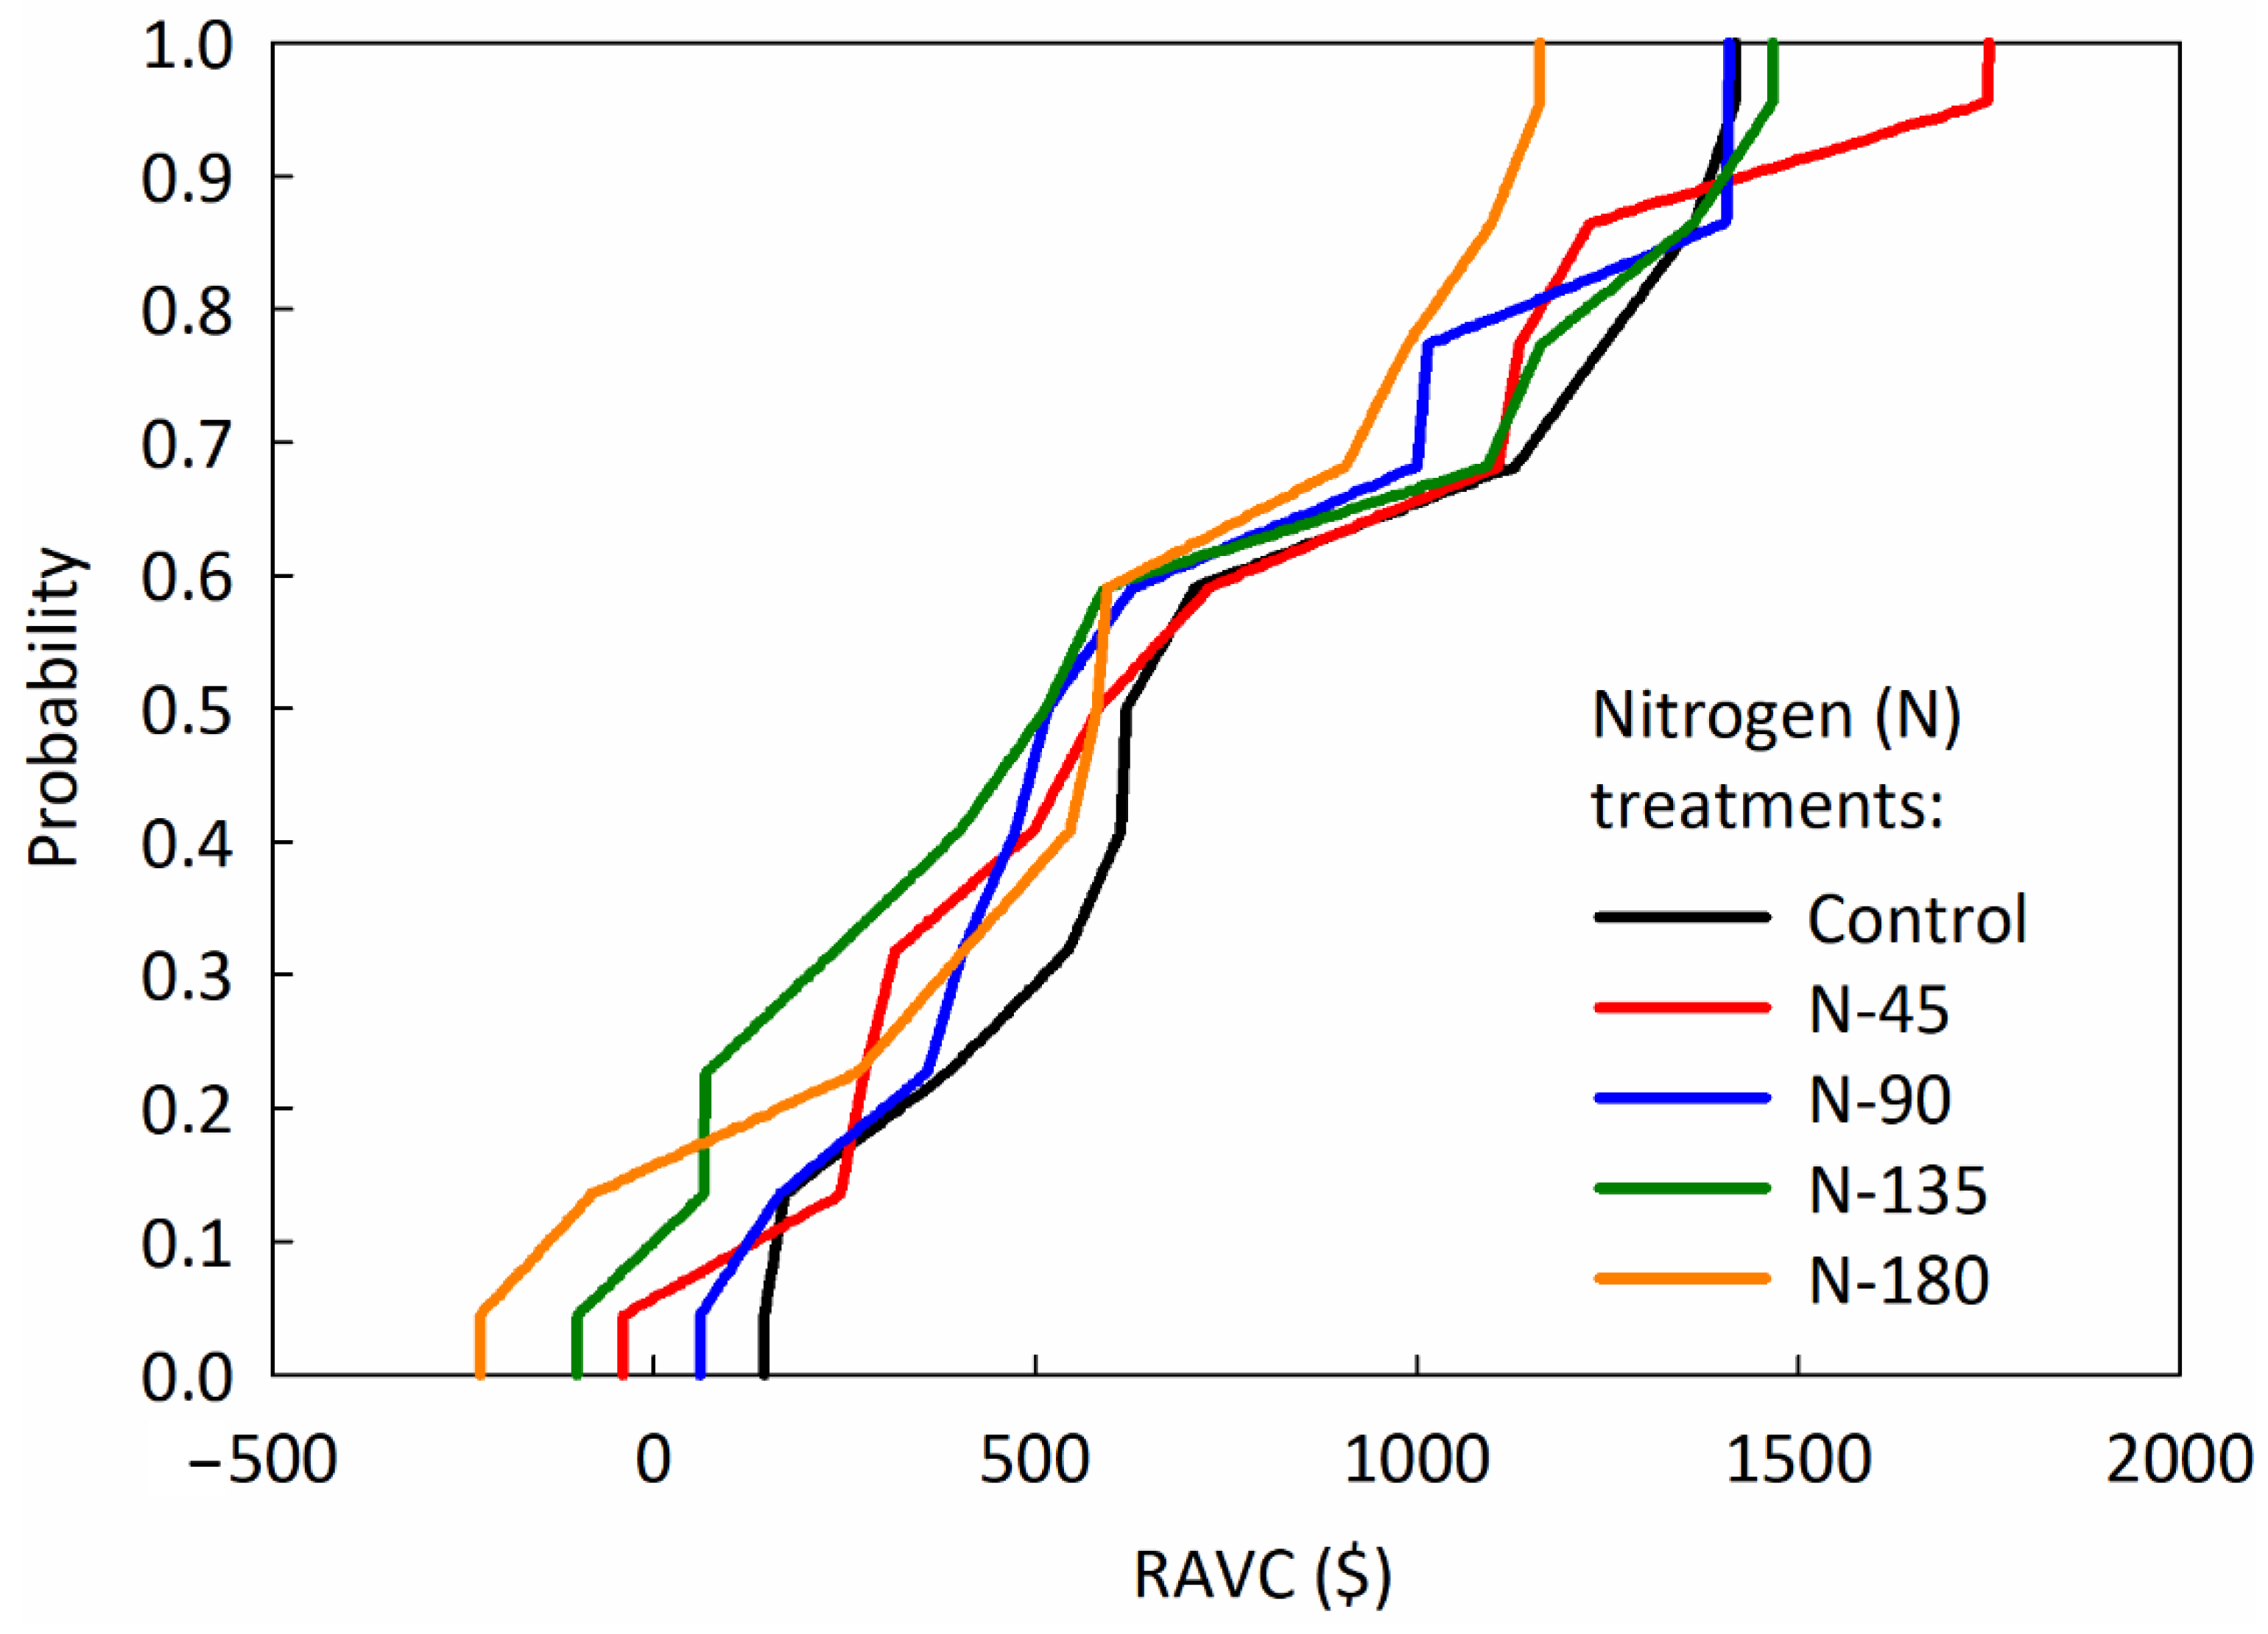
3.2. Decreased Profitability above Optimal N Fertilizer Rates

Nitrogen is the macronutrient applied in greatest quantity to support cotton growth and development [17,18,39]. Nitrogen applied as fertilizer to the soil is often used inefficiently by the crop [40,41]. In addition to losses due to runoff, volatilization, and leaching, losses due to the application of surplus N represent unrecovered input costs for growers and potentially detrimental effects to the environment. In recent years, prices of N fertilizers have increased and have been more unpredictable. Lemon, et al. [42] reported a 211% increase in UAN (32-0-0) from 2003 ($180 ton−1) to 2008 ($560 ton−1). As of September 2021, the average price of UAN is $422 ton−1, which represents a 67% increase from the September 2020 average price ($253 ton−1). Therefore, the yield return per unit of N applied will only be as good as the overall efficiency of the production system. The best value for additional N application can only be attained if there is a corresponding increase in yield and profitability.
The revenues, variable costs, and RAVCs for each growing season, cultivar, and N fertilizer rate are presented in Table 5. Significant interaction effect was observed between year and cultivar treatments on RAVC (Table 3; p < 0.001). As a result, differences in RAVC were analyzed separately for each year and cultivar (Table 5). There was no significant interaction between year and N treatments on RAVC (Table 3; p = 0.410). The yield reductions observed between 2018 and 2019 and between 2018 and 2020 resulted in a substantial mean decrease of 78–103% and 49–94% in RAVC, respectively (Table 5). From 2018 to 2020, the highest value of RAVC was consistently observed under the control and N-45 treatments, and as the amount of fertilizer applied increased, the RAVC decreased for both cultivars (Table 5). Based on the analysis from 2018 to 2020, highest RAVC was achieved at N fertilizer input ranging from 0 to 45 kg N ha−1 in combination with 46 kg N ha−1 of residual soil NO3-N, for both cultivars.
Cumulative Distribution Functions (CDFs) comparing the simulated N treatments for DP 1646 are shown in Figure 2. Since the CDFs for each N treatment cross, there was no first-degree stochastic dominance among the treatments. The control was the most preferred treatment and exhibited second-degree stochastic dominance over the other treatments. The N-45 treatment was ranked as the second most preferred, while N-180 treatment was the least preferred. The stoplight chart in Figure 3 indicates the probability of achieving RAVC between $100 ha−1 and $1000 ha−1 across treatments. The control treatment had the highest probability of achieving positive returns at 32% compared to a 26%, 29%, 19%, and 21% chance with the N-45, N-90, N-135, and N-180 treatments, respectively (Figure 3). The control and N-45 treatments had a 16% and 15% probability of realizing returns less than $100 ha−1, respectively, compared to a 27%, 43%, and 38% chance for N-90, N-135, and N-180 treatments, respectively (Figure 3).
The CDFs comparing simulated N treatments for FM 958 are shown in Figure 4. Using second-degree stochastic dominance, the control and N-45 treatments were the most and second-most preferred, respectively, while N-160 treatment was the least preferred. The stoplight chart for FM 958 cultivar is shown in Figure 5. FM 958 had a lower probability of an unfavorable outcome compared to the DP 1646. The control treatment showed a 0% chance of achieving returns less than $100 ha−1 compared to a 9%, 8%, 24%, and 18% for the N-45, N-90, N-135 and N-180 treatments, respectively (Figure 5). The control treatment had a 35% probability of achieving positive net returns compared to a 34%, 32%, 34%, and 22% for the N-45, N-90, N-135 and N-180 treatments, respectively (Figure 5). A pairwise comparison of the different N treatments between DP 1646 and FM 958 indicated that the FM 958 was the less risky cultivar (Figure 3 and Figure 5).
Even though the Monte Carlo simulation analysis may have some inaccuracies because the experiments were conducted on different plots within a field for each year, the results provide a fair assessment of the profit advantage when N fertilizer is reduced. This study highlights the importance of measuring the residual soil NO3–N before planting as a critical component of efficient nutrient management. While the control (0 kg N ha−1) was one of the most preferred treatments in the analysis, it is still necessary to replenish the N in the soil through the addition of fertilizer; thus, supplemental application of N at 45 kg ha−1 is recommended.

4. Conclusions

The improved efficiency of newer cultivars due to genetic improvement and crop management optimization has likely changed the N requirement rates of these cultivars over the past years. Results from this study reinforce the finding that crop productivity is highly dependent on a cultivar’s genetic and growth potential. High residual soil NO3-N was enough to sustain yield productivity under the growing conditions set in the study. This study highlights that N fertilizer application rates could be reduced based on updated crop requirements and the credits for residual soil NO3–N, without yield penalty.
The probability analysis for the profitability of different N treatments and cultivars is an important tool for decision-making towards increasing overall efficiency of production. In this study, lower N rates offered higher chances of success in terms of profit. At the same time, given the growing conditions of the study, it can be said that FM 958 offers higher chances of increased profitability compared to DP 1646.
Overall, this study provides researchers and producers with information about the negative effects when the application of N is greater than the crop requirements. Reducing N application based on credits for residual soil NO3–N highlights the importance of soil testing particularly at pre-planting. If information from soil testing for residual N is available, farmers can optimize the management of N fertilizer split applications within the season.

Author Contributions

Conceptualization, I.L.B.P., K.L.L. and G.L.R.; Formal analysis, I.L.B.P. and D.M.-M.; Funding acquisition, K.L.L. and G.L.R.; Investigation, I.L.B.P., K.L.L. and G.L.R.; Methodology, I.L.B.P., K.L.L. and G.L.R.; Project administration, K.L.L. and G.L.R.; Resources, K.L.L. and G.L.R.; Writing—original draft, I.L.B.P. and D.M.-M.; Writing—review & editing, I.L.B.P., D.M.-M., K.L.L. and G.L.R. All authors have read and agreed to the published version of the manuscript.

Funding

This research was funded by the Cotton Incorporated Texas State Support Committee, grant number 18-124TX.

Data Availability Statement

The data presented in this study are available on request from the corresponding author.

Acknowledgments

The authors would like to thank the research group members of Crop Physiology Laboratory-Texas Tech University, Soil Chemistry and Fertility Laboratory-Texas A&M AgriLife Research, TTU farm crew, and undergraduate student assistants for providing technical assistance.

Conflicts of Interest

The authors declare no conflict of interest.

References

  1. Gialvalis, S.; Seagull, R.W. Plant hormones alter fiber initiation in unfertilized, cultured ovules of Gossypium hirsutum. J. Cotton Sci. 2001, 5, 252–258. [Google Scholar]
  2. Seagull, R.W.; Giavalis, S. Pre-and post-anthesis application of exogenous hormones alters fiber production in Gossypium hirsutum L. cultivar Maxxa GTO. J. Cotton Sci. 2004, 8, 105–111. [Google Scholar]
  3. Ragsdale, P.I.; Smith, C.W. Germplasm potential for trait improvement in upland cotton: Diallel analysis of within-boll seed yield components. Crop Sci. 2007, 47, 1013–1017. [Google Scholar] [CrossRef]
  4. Wells, R.; Meredith, W.R., Jr. Comparative growth of obsolete and modern cotton cultivars. III. Relationship of yield to observed growth characteristics. Crop Sci. 1984, 24, 868–872. [Google Scholar] [CrossRef]
  5. Tang, B.; Jenkins, J.N.; McCarty, J.; Watson, C. F2 hybrids of host plant germplasm and cotton cultivars: I. Heterosis and combining ability for lint yield and yield components. Crop Sci. 1993, 33, 700–705. [Google Scholar] [CrossRef]
  6. Bridge, R.; Meredith, W., Jr.; Chism, J. Comparative performance of obsolete varieties and current varieties of upload cotton. Crop Sci. 1971, 11, 29–32. [Google Scholar] [CrossRef]
  7. Bednarz, C.W.; Nichols, R.L.; Brown, S.M. Within-boll yield components of high yielding cotton cultivars. Crop Sci. 2007, 47, 2108–2112. [Google Scholar] [CrossRef]
  8. Bednarz, C.W.; Nichols, R.L.; Brown, S.M. Plant density modifications of cotton within-boll yield components. Crop Sci. 2006, 46, 2076–2080. [Google Scholar] [CrossRef] [Green Version]
  9. Boquet, D.J. Cotton in ultra-narrow row spacing: Plant density and nitrogen fertilizer rates. Agron. J. 2005, 97, 279–287. [Google Scholar] [CrossRef]
  10. Brecke, B.J.; Banks, J.; Cothren, J.T. Harvest-aid treatments: Products and application timing. In Cotton Harvest Management: Use and Influence of Harvest Aids; The Cotton Foundation: Memphis, TN, USA, 2001; pp. 119–142. [Google Scholar]
  11. Bronson, K.F. Nitrogen use efficiency of cotton varies with irrigation system. Better Crops Plant Food 2008, 92, 20–22. [Google Scholar]
  12. Cathey, G.W.; Meredith, W.R., Jr. Cotton response to planting date and mepiquat chloride. Agron. J. 1988, 80, 463–466. [Google Scholar] [CrossRef]
  13. Loka, D.A.; Oosterhuis, D.M.; Ritchie, G.L. Water-deficit stress in cotton. Stress Physiol. Cotton 2011, 7, 37–72. [Google Scholar]
  14. Ritchie, G.L.; Whitaker, J.R.; Bednarz, C.W.; Hook, J.E. Subsurface drip and overhead irrigation: A comparison of plant boll distribution in upland cotton. Agron. J. 2009, 101, 1336–1344. [Google Scholar] [CrossRef]
  15. Schaefer, C.R.; Ritchie, G.L.; Bordovsky, J.P.; Lewis, K.; Kelly, B. Irrigation timing and rate affect cotton boll distribution and fiber quality. Agron. J. 2018, 110, 922–931. [Google Scholar] [CrossRef] [Green Version]
  16. Pabuayon, I.L.B.; Lewis, K.L.; Ritchie, G.L. Dry matter and nutrient partitioning changes for the past 30 years of cotton production. Agron. J. 2020, 112, 4373–4385. [Google Scholar] [CrossRef]
  17. Sinclair, T.R.; Rufty, T.W. Nitrogen and water resources commonly limit crop yield increases, not necessarily plant genetics. Glob. Food Secur. 2012, 1, 94–98. [Google Scholar] [CrossRef]
  18. Bondada, B.R.; Osterhuis, D.M. Canopy photosynthesis, specific leaf weight, and yield components of cotton under varying nitrogen supply. J. Plant Nutr. 2001, 24, 469–477. [Google Scholar] [CrossRef]
  19. Bondada, B.; Oosterhuis, D.; Norman, R.; Baker, W. Canopy photosynthesis, growth, yield, and boll 15N accumulation under nitrogen stress in cotton. Crop Sci. 1996, 36, 127–133. [Google Scholar] [CrossRef]
  20. Dong, H.; Li, W.; Eneji, A.E.; Zhang, D. Nitrogen rate and plant density effects on yield and late-season leaf senescence of cotton raised on a saline field. Field Crops Res. 2012, 126, 137–144. [Google Scholar] [CrossRef]
  21. Bronson, K.; Onken, A.; Keeling, J.; Booker, J.; Torbert, H. Nitrogen response in cotton as affected by tillage system and irrigation level. Soil Sci. Soc. Am. J. 2001, 65, 1153–1163. [Google Scholar] [CrossRef]
  22. Boquet, D.J.; Moser, E.B.; Breitenbeck, G.A. Boll weight and within-plant yield distribution in field-grown cotton given different levels of nitrogen. Agron. J. 1994, 86, 20–26. [Google Scholar] [CrossRef]
  23. Main, C.L.; Barber, L.T.; Boman, R.K.; Chapman, K.; Dodds, D.M.; Duncan, S.; Edmisten, K.L.; Horn, P.; Jones, M.A.; Morgan, G.D. Effects of nitrogen and planting seed size on cotton growth, development, and yield. Agron. J. 2013, 105, 1853–1859. [Google Scholar] [CrossRef] [Green Version]
  24. Egelkraut, T.; Kissel, D.; Cabrera, M.; Gascho, G.; Adkins, W. Nitrogen concentration in cottonseed as an indicator of N availability. Nutr. Cycl. Agroecosyst. 2004, 68, 235–242. [Google Scholar] [CrossRef]
  25. Boquet, D.J.; Breitenbeck, G.A. Nitrogen rate effect on partitioning of nitrogen and dry matter by cotton. Crop Sci. 2000, 40, 1685–1693. [Google Scholar] [CrossRef]
  26. Hunt, P.; Bauer, P.; Camp, C.; Matheny, T. Nitrogen accumulation in cotton grown continuously or in rotation with peanut using subsurface microirrigation and GOSSYM/COMAX management. Crop Sci. 1998, 38, 410–415. [Google Scholar] [CrossRef]
  27. Hutmacher, R.; Travis, R.; Rains, D.; Vargas, R.; Roberts, B.; Weir, B.; Wright, S.; Munk, D.; Marsh, B.; Keeley, M. Response of recent Acala cotton varieties to variable nitrogen rates in the San Joaquin Valley of California. Agron. J. 2004, 96, 48–62. [Google Scholar] [CrossRef]
  28. Morris, T.; Blackmer, A.; El-Hout, N. Optimal rates of nitrogen fertilization for first-year corn after alfalfa. J. Prod. Agric. 1993, 6, 344–350. [Google Scholar] [CrossRef]
  29. Halvorson, A.D.; Schweissing, F.C.; Bartolo, M.E.; Reule, C.A. Corn response to nitrogen fertilization in a soil with high residual nitrogen. Agron. J. 2005, 97, 1222–1229. [Google Scholar] [CrossRef] [Green Version]
  30. Mullins, G.; Burmester, C. Dry matter, nitrogen, phosphorus, and potassium accumulation by four cotton varieties. Agron. J. 1990, 82, 729–736. [Google Scholar] [CrossRef]
  31. Mullins, G.; Burmester, C. Relation of growth and development to mineral nutrition. In Physiology of Cotton; Springer: Dordrecht, The Netherlands; Berlin/Heidelberg, Germany; London, UK; New York, NY, USA, 2010; pp. 97–105. [Google Scholar]
  32. Dhakal, C.; Lange, K.; Parajulee, M.N.; Segarra, E. Dynamic optimization of nitrogen in plateau cotton yield functions with nitrogen carryover considerations. J. Agric. Appl. Econ. 2019, 51, 385–401. [Google Scholar] [CrossRef] [Green Version]
  33. National Cooperative Soil Survey. National Cooperative Soil Survey Characterization Database. 2014. Available online: http://ncsslabdatamart.sc.egov.usda.gov/ (accessed on 27 February 2019).
  34. Schofield, R.; Taylor, A.W. The measurement of soil pH. Soil Sci. Soc. Am. J. 1955, 19, 164–167. [Google Scholar] [CrossRef]
  35. Kachurina, O.; Zhang, H.; Raun, W.; Krenzer, E. Simultaneous determination of soil aluminum, ammonium-and nitrate-nitrogen using 1 M potassium chloride extraction. Commun. Soil Sci. Plant Anal. 2000, 31, 893–903. [Google Scholar] [CrossRef]
  36. Richardson, J.W. Simitar Simulation for Excel to Analyze Risk; Texas A&M University: College Station, TX, USA, 2005. [Google Scholar]
  37. Richardson, J.W.; Klose, S.L.; Gray, A.W. An applied procedure for estimating and simulating multivariate empirical (MVE) probability distributions in farm-level risk assessment and policy analysis. J. Agric. Appl. Econ. 2000, 32, 299–315. [Google Scholar] [CrossRef] [Green Version]
  38. Littell, R.C.; Milliken, G.A.; Stroup, W.W.; Wolfinger, R.D.; Oliver, S. SAS for Mixed Models; SAS Publishing: Assam, India, 2006. [Google Scholar]
  39. Oosterhuis, D. Physiology and nutrition of high yielding cotton in the USA. Inf. Agron. 2001, 95, 18–24. [Google Scholar]
  40. Sylvester-Bradley, R. Scope for more efficient use of fertilizer nitrogen. Soil Use Manag. 1993, 9, 112–117. [Google Scholar] [CrossRef]
  41. Ladha, J.K.; Pathak, H.; Krupnik, T.J.; Six, J.; van Kessel, C. Efficiency of fertilizer nitrogen in cereal production: Retrospects and prospects. Advan. Agron. 2005, 87, 85–156. [Google Scholar]
  42. Lemon, R.; Boman, R.; McFarland, M.; Bean, B.; Provin, T.; Hons, F. Nitrogen management in cotton. AgriLife Extension 2009, 1, 1–9. [Google Scholar]
Figure 1. Mean temperatures by days after planting (DAP) and monthly total rainfall during the 2018, 2019, and 2020 growing seasons at Texas Tech University Research Farm, New Deal, TX, USA.
Agronomy 11 02149 g001
Figure 2. A Cumulative Distribution Function (CDF) comparing returns above variable cost (RAVC) across various N rates for DP 1646.
Agronomy 11 02149 g002
Figure 3. Stoplight chart for profit probabilities of less than $100 ha−1 and greater than $1000 ha−1 for DP 1646. The probabilities of achieving favorable, unfavorable, and questionable outcomes are represented by green, red, and yellow color, respectively.
Agronomy 11 02149 g003
Figure 4. A Cumulative Distribution Function (CDF) comparing returns above variable cost across various N rates for FM 958.
Agronomy 11 02149 g004
Figure 5. Stoplight chart for profit probabilities of less than $100 ha−1 and greater than $1,000 ha−1 for FM 958. The probabilities of achieving favorable, unfavorable, and questionable outcomes are represented by green, red, and yellow color, respectively.
Agronomy 11 02149 g005
Table 1. Residual soil nitrate-nitrogen (NO3-N) across soil depths from 2018 to 2020.
Residual Soil NO3-N (kg N ha−1)
Soil Depth (cm)201820192020
0–1521.517.731.6
15–3011.214.820.0
30–6023.313.933.2
Total (0–60)56.046.484.7
Table 2. Management and input costs of cotton production under five rates of nitrogen (N) fertilizer from 2018–2020 at the Texas Tech University Research Farm, New Deal, TX, USA.
201820192020
ManagementCultivarFM 958FM 958FM 958
DP 1646DP 1646DP 1646
Seeding rate (ha−1)130,000130,000130,000
Planting dateMay 21May 31May 29
Harvest dateNov 10Nov 4Nov 4
Input CostsOffset disc-------------------$24.71-------------------------
(ha−1 basis)Listing beds-------------------$32.62-------------------------
Rotary hoe-------------------$23.05-------------------------
Planting-------------------$24.71-------------------------
Irrigation energy------------------$345.95------------------------
Seed
DP 1646------------------$232.87------------------------
FM 958--------------------$98.15------------------------
Herbicide
Trifluralin--------------------$17.17------------------------
Promethryn--------------------$30.89------------------------
Harvest Aid
Carfentrazone-ethyl and Ethepon-------------------$177.77-----------------------
N Fertilizer
Control----------------------$0.00-----------------------
N-45---------------------$92.81-----------------------
N-90--------------------$185.63----------------------
N-135--------------------$278.44----------------------
N-180--------------------$371.25----------------------
P Fertilizer----------------------$63.26----------------------
Stripping cotton/module building--------------------$413.80----------------------
Table 3. Statistical significance of differences in lint yield and revenue above variable cost (RAVC) due to treatments, among cultivars and N rates, and interactions by year.
YearEffectLint YieldRAVC
Year × N ratensns
Year × Cultivar******
2018N rate × Cultivarnsns
N ratensns
Cultivarns*
2019N rate × Cultivarnsns
N ratens**
Cultivar**ns
2020N rate × Cultivarnsns
N ratens*
Cultivar******
* Significant at the 0.05 probability level; ** Significant at the 0.01 probability level; *** Significant at the 0.001 probability level; ns, not significant at the 0.05 probability level.
Table 4. Lint yield of cotton cultivars grown under five rates of nitrogen (N) at the Texas Tech University Research Farm, New Deal, TX, USA in 2018–2020.
N Treatment Lint Yield (kg ha−1)
201820192020
DP 1646FM 958DP 1646FM 958DP 1646FM 958
Control170616999468138851138
N-45170917449697838881094
N-90172616949288438601104
N-135167917798708158831006
N-180174916158257319051189
Average Across N Rates 17141706 908 a 797 b 884 b 1106 a
For each year, average yields across N rates followed by different letters between cultivars are significantly different at p < 0.05.
Table 5. Summary of revenues, total variable costs, and revenue above variable costs (RAVCs) of cotton cultivars grown under five rates of nitrogen (N) fertilizer in 2018 to 2020 at the Texas Tech University Research Farm, New Deal, TX, USA.
CultivarN Fertilizer
Treatment
201820192020
Revenue ($ ha−1)Total Variable Costs ($ ha−1)RAVC
($ ha−1)
Revenue ($ ha−1)Total Variable Costs ($ ha−1)RAVC
($ ha−1)
Revenue ($ ha−1)Total Variable Costs
($ ha−1)
RAVC
($ ha−1)
DP 1646Control24451283116313561098258 a12681083184
N-4524491321112813881141247 a12721122150
N-9024741363111113291169160 ab1232115280
N-1352407138910181247119254 bc1266119670
N-18025061443106311831219(−36) c1297123959
LSD 154 162 211
FM 958Control243511461289116593123416311010621
N-45249911951304112196116015681037531
N-902427122012071208101419515831077506
N-1352549127812711168104412314421091351
N-18023151276103810481062(−14)17041173532
LSD 260 254 196
For each cultivar and year, RAVC means within a column annotated by different letters are significantly different at p < 0.05.
Publisher’s Note: MDPI stays neutral with regard to jurisdictional claims in published maps and institutional affiliations.

