Article

Sensory Analyses and Nutritional Qualities of Wheat Population Varieties Developed by Participatory Breeding

by
Camille Vindras-Fouillet
1,*,
Isabelle Goldringer
2,
Gaëlle van Frank
3,
Marc Dewalque
4,
Axel Colin
5,
Hélène Montaz
4,
Jean-François Berthellot
4,
Raphaël Baltassat
4 and
Christian Dalmasso
4
1
French Research Institute of Organic Food and Farming (ITAB), 149 Rue de Bercy, CEDEX 12, 75595 Paris, France
2
GQE-Le Moulon, AgroParisTech, CNRS, INRAE, Université Paris-Saclay, 91190 Gif-sur-Yvette, France
3
UMR DYNAFOR, INP Toulouse, INRAE, 31320 Auzeville Tolosane, France
4
Réseau Semences Paysannes, 3 Avenue de la Gare, 47190 Aiguillon, France
5
Independent Bakers, 4960 Manhay, Belgium
*
Author to whom correspondence should be addressed.
Agronomy 2021, 11(11), 2117; https://doi.org/10.3390/agronomy11112117
Submission received: 9 September 2021 / Revised: 18 October 2021 / Accepted: 20 October 2021 / Published: 22 October 2021
(This article belongs to the Special Issue Organic Agriculture at the Heart of Agroecological Transition)

Abstract

:
Wheat is a staple food in many diets and is currently cultivated worldwide. It provides a large proportion of the daily energy intake and contributes to food balance. Changes in agro-industrial practices in the bread sector, from the field to bread-making, have led to an increase in chronic diseases and nutritional deficits, emphasizing the link between food and health. Several levers could be used to improve the nutritional quality of bread wheat. Organic farming, by avoiding the use of pesticides, might allow for greater consumption of wholegrain products. Breeding wheat cultivars with an enhanced mineral content may serve as another lever. In this context, the on-farm participatory plant-breeding of highly diversified varieties could provide promising resources. This study investigated the sensory and nutritional quality of nine population varieties resulting from a ten-year participatory plant-breeding process compared to two commercial pure-line varieties. Analysis of variance showed genotype effects for Mg and Zn concentration, so breeding for a high Mg and Zn concentration can reasonably be envisaged. Moreover, a positive correlation was found between plant height, peduncle height (distance between the Last Leaf and Spike (LLSD)) and nutrient content. Finally, as population varieties express more differences in their profile when grown in less fertile soils, these results emphasize the benefits of genetic diversity for diverse nutritional intake and sensory properties.

1. Introduction

Wheat is the major staple food in most occidental diets, and is currently cultivated worldwide [1]. Wheat provides a large proportion of the daily energy intake and contributes to food balance. The increase in the prevalence and progression of chronic (non-communicable) diseases associated with the modern human diet is the consequence of a complex interplay between genetic and environmental factors, in which diet plays an important role [2]. At the consumption level, white-wheat bread, largely consumed in France, made from highly refined flour, results in a low nutrient content [3]. The relationship between diet and human health has gained in attention among consumers and scientists and is increasingly highlighted [4].
Cereal grain plays a protective role in human health due to its bioactive compounds content. The “antioxidant hypothesis” was that vitamin E, carotenoids, and other antioxidant micronutrients (including polyphenols) afford protection against chronic diseases by decreasing oxidative damage [5,6,7]. The mechanism by which wheat confers a protective effect on human health is attributed to the physical properties and structure of grain (amount and type of fiber, quantity and quality of phytochemicals, amylose, and amylopectin content) [1]. Fiber- and lignan-rich wholegrain cereals are among the main protective foods. Given the increased worldwide mortality attributed to a lack of nutrients in recent years, there is currently great interest in improving bread wheat to ameliorate health concerns [8]. The World Health Organization (WHO) recognizes three micronutrients as limiting: Fe, Zn, and provitamin A.
Bread is a complex product, in which multiple factors lead to a unique final quality. The influence of the farming system, milling and baking techniques (including flour type, fermentation, and genetic structure) have all been investigated [9,10,11,12].
Indeed, several levers could be used to improve the nutritional quality of bread [13]. The first one is organically growing wheat, permitting the promotion of wholegrain product consumption.
However, homogeneous varieties have been bred for generations to provide a high yield under high-input agricultural conditions, and thus they might lack the robustness and quality characteristics that are required for organic farming [14]. Pure-line varieties adapted to organic agriculture have been released, and show good qualities, but their genetic homogeneity does not allow them to evolve in response to environmental changes [12]. The low genetic variation in the selected modern cultivars suggests that these varieties may lack traits that are of crucial interest for the organic sector, even if they are able to guarantee a top-yield production in both conventional and organic agriculture. Moreover, breeding programs mainly focus on the yield and protein content of wheat cultivars, without considering nutritional quality [14,15,16]. As a result, modern plant-breeding contributes to the decline in the nutritional density of wheat, also known as the “dilution effect” [17,18,19,20,21]. The available data show that ancient wheat cultivars are generally lower in some components, such as dietary fiber, and higher in other components, such as polyphenols. Nevertheless, studies on the bioactive components of wheat (including minerals, trace elements, vitamins, carotenoids and polyphenols) reported wide variability in content, which was dependent on genetic factors, growing season environments and location [1]. Modern breeding has also aimed for high-molecular-weight proteins to adapt wheat varieties to industrial bread-making practices [18]. The flour of ancient wheats yields softer dough with low elasticity and high extensibility because of its gluten composition. Gluten proteins are one of the most important factors determining the baking quality of wheat flours. Gluten proteins are storage proteins and classified into gliadins and glutenins. Both the amount and the ratio of gliadins and glutenins have been shown to be responsible for good baking quality (high gas-holding capacity of dough).
The availability of suitable wheat varieties is critical to the development of organic farming that is able to meet these demands, and constitutes the second lever to improving the nutritional quality of wheat bread: the genetic one [22]. Breeding for organic farming should take several criteria into account: adaptation to the local soil and climatic conditions and to pest and pathogen pressures, weed competition, conformity to the organic specification and, specifically, growing without chemical inputs and pesticides, no genetic modification, acceptable economic profitability, and a high level of nutritional and gustatory quality.
One organic farming strategy is to diversify intra-specific genetic diversity to stabilize yield by reintroducing landraces and genetically heterogeneous varieties [23] and by growing variety mixtures. Indeed, population varieties are characterized by their high genetic diversity. This intra-specific diversity allows wheat to adapt to changing environmental land and weather conditions and cope with variation in diseases and weeds. Complementarity between varieties favors ecosystem stability due to the multiple resistance mechanism. Moreover, it is a source of genes when breeding for diseases resistance or nutritional improvements. The varieties that were released and/or grown before industrial farming have attracted increasing attention since several studies have suggested that they could present a healthier and better nutritional profile than modern wheats, by providing more vitamins, minerals, and nutraceutical compounds [24,25]. A higher diversity and content of carotenoids has been found in ancient wheat varieties [26,27]. Other studies support the interest in breeding for improved nutritional density [8]. Oury et al. showed a highly significant genetic variability and a low genotype by environment interaction on the magnesium (Mg) content off a large set of varieties. In a recent review, Smith et al. [28] confirmed the specific and genetic variability of grain nutrient composition and confirmed the interest in breeding for high nutrient content varieties, while maintaining a good yield to ensure farm sustainability. Nevertheless, the bread’s mineral availability depends on phytate contents, which has a decalcifying effect. This could be limited by using sourdough during the bread-making process.
Indeed, the process lever is likely to improve the nutritional quality of bread [3,13]. The use of sourdough is particularly suited to wheat populations that require limited kneading and long fermentation times. This process offers health benefits and enhances the quality of wheat population varieties, as minerals should be available from the extended fermentation and high hydration rate [29,30,31]. A wide range of aromas have been found to result from sourdough’s diversity. Moreover, the bread-making process reduced a glycemic reaction. Finally, the use of less refined flour or the reduction in salt are other parameters that could be optimized to improve the nutritional quality of bread wheat.
In this context, many pioneering farmers are already engaged in alternative and sustainable farming practices in several countries. They are increasingly interested in varieties that are more adapted to their specific conditions and seem to have a greater nutritional and sensory quality than the commercial varieties available on the market [32].
Multicriteria on-form evaluation leads to methodological challenges, especially for sensory evaluations. Indeed, the great diversity of varieties and the experimental conditions limit the conclusions that can be drawn. Even if the phytochemical and micronutrient content of wheat seems to be strongly influenced by its genetics, the environment and interactions between genetics and the environment profoundly influence this content. Results are now available on agronomic variety trials across the world [23,33,34,35,36]. These confirm the wide adaptive potential of populations but few results have been released on the nutritional and sensory characteristics of genetically diverse varieties in different growing environments.
A Participatory Plant Breeding (PPB) approach, set up as a collective organization among farmers, facilitators and researchers [37], has been applied to bread wheat in France since 2006, in a partnership with the INRAE research team Diversity, Evolution, and Adaptation of Population (DEAP), the farmer organization group Réseau Semences Paysannes, and the French research institute for Organic Food and Farming (ITAB).
Through several years of on-farm participatory breeding, the program led to the development of farmer-bred population varieties. A two-year field trial was carried out to assess the first ten population varieties developed from this program and compare them to two pure-line commercial varieties. The agronomic behavior of the varieties, as well as their temporal and spatial stability and genetic diversity, are reported elsewhere [23,36]. To complete the agronomic evaluation and explore the sensory and nutritional potential of these varieties, sensory evaluations and nutritional analyses were implemented on nine of this PPBs’ wheat population varieties, and two commercial varieties currently grown in organic agriculture. Here, we present the results of the technological, nutritional, and sensory evaluations of these varieties and look for possible links with agronomic and morphological traits.

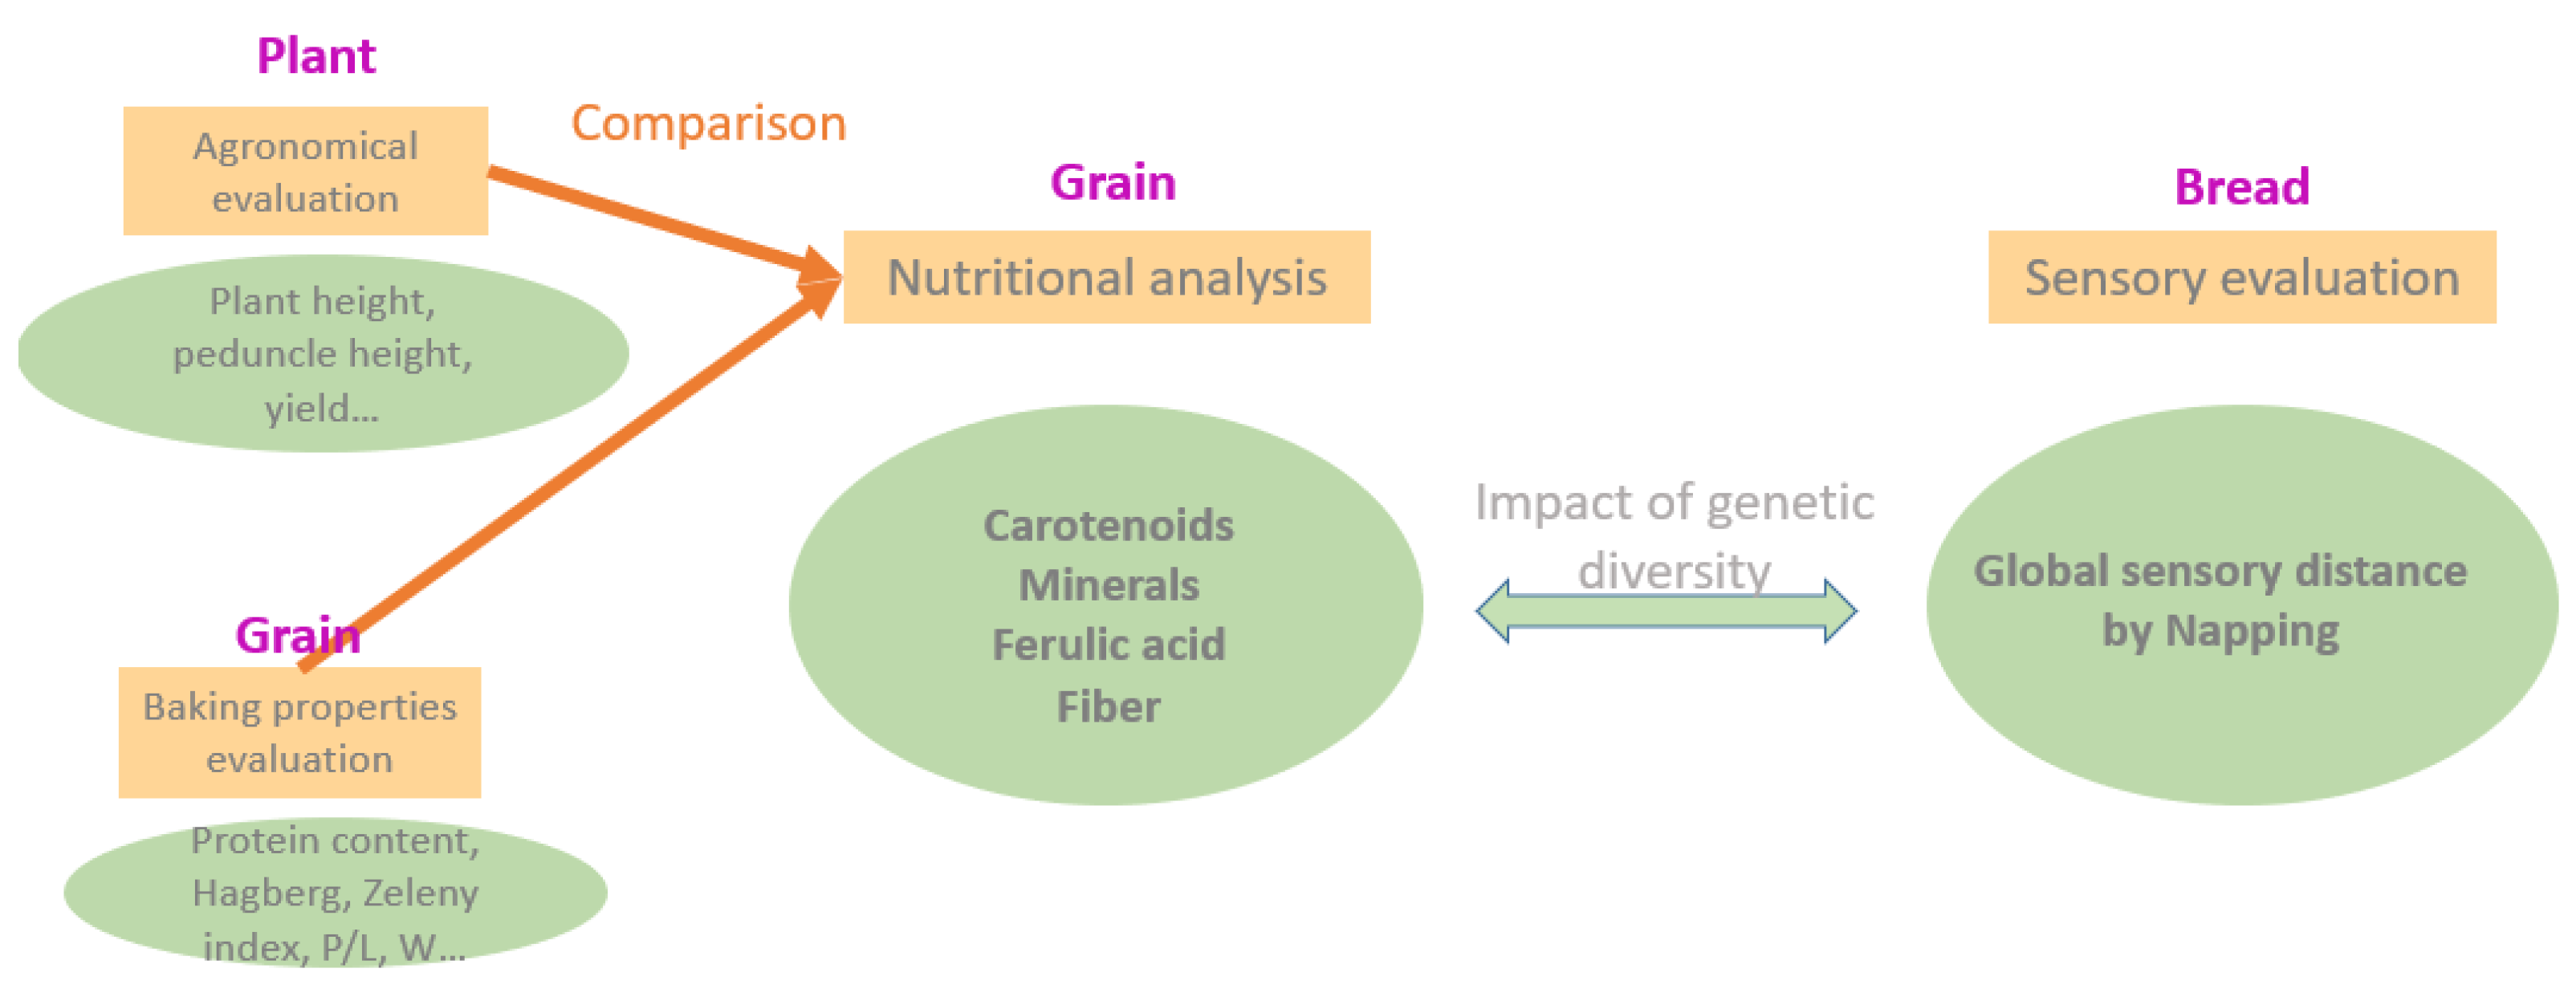
2. Materials and Methods

To evaluate the population varieties developed within the French wheat PPB program, compared with two commercial pure-line varieties, a multi-criteria evaluation was conducted on agronomic, technologic, nutritional, and sensory characteristics (Figure 1).

2.1. Wheat PPB Populations and Commercial Varieties Studied

Nine population varieties, developed within the French bread wheat PPB program (hereafter called PPB varieties), were proposed by five farmers involved in the project. They cover a wide range of the possible types of population varieties that can be derived from PPB. Two commercial French varieties (Renan, widely used in France by organic farmers and Hendrix, more recently released and bred for organic agriculture) were used as references to represent commercial pure-line varieties. In the following, both PPB populations and commercial varieties will be referred to as varieties; therefore, the UPOV definition is not used.
Nutritional and sensory analyses were carried out on samples of these varieties grown on two farms in France, which we refer to as JFB and RAB. As highlighted in the associated publication [18,31], the two farms presented very different pedo-climatic conditions. The RAB farm has deep and fertile soils, with a rainy and quite cold temperature during winter (cumulative rainfall from February to July: 482 mm, minimum temperature in winter: −1.4 °C), whereas the JFB farm has clay-limestone soils and is in a dry and hot area (cumulative rainfall from February to July: 304 mm, maximum temperature in June–July: 27.6 °C). In each farm, grains from the two replications were pooled before being cleaned and stored in a dry room. After one-year storage of each pooled grain, samples were sent to the laboratory for nutritional and technological analyses. The varieties assessed in the different tests are summarized in Table 1.

2.2. Dough and Baking Properties Evaluation

The dough and baking properties of these varieties were evaluated by an independent laboratory, LIVRAC, La Louée (44), France. A sample of 1.5 kg of grain was sent to measure a broad range of technical quality parameters. Grains were ground into flour using a Laboratory Mill. The ground material was then analyzed.
Protein content, moisture rate, ash content and Zeleny sedimentation index were measured by infrared method using a Perten Inframatic 8600 Flour Analyzer. Ash content is relative to wheat total mineral content, whereas Zeleny index relies on the protein’s ability to swell.
Falling number and gluten index (GI) were measured following NF EN ISO 3093 and NF EN ISO 21415-2 methods, respectively. The falling number is related to the level of sprout damage that occurred in the grain due to enzymatic activity. GI was measured using the glutomatic method to determine gluten strength. Finally, dough rheological properties were evaluated using the Chopin alveograph, according to the NF EN ISO 27971 method. This consists of producing a test piece of dough, which, under air pressure, turns into a bubble and allows for measurement of the tenacity (P), extensibility (L), elasticity (I.e) and baking strength (W).

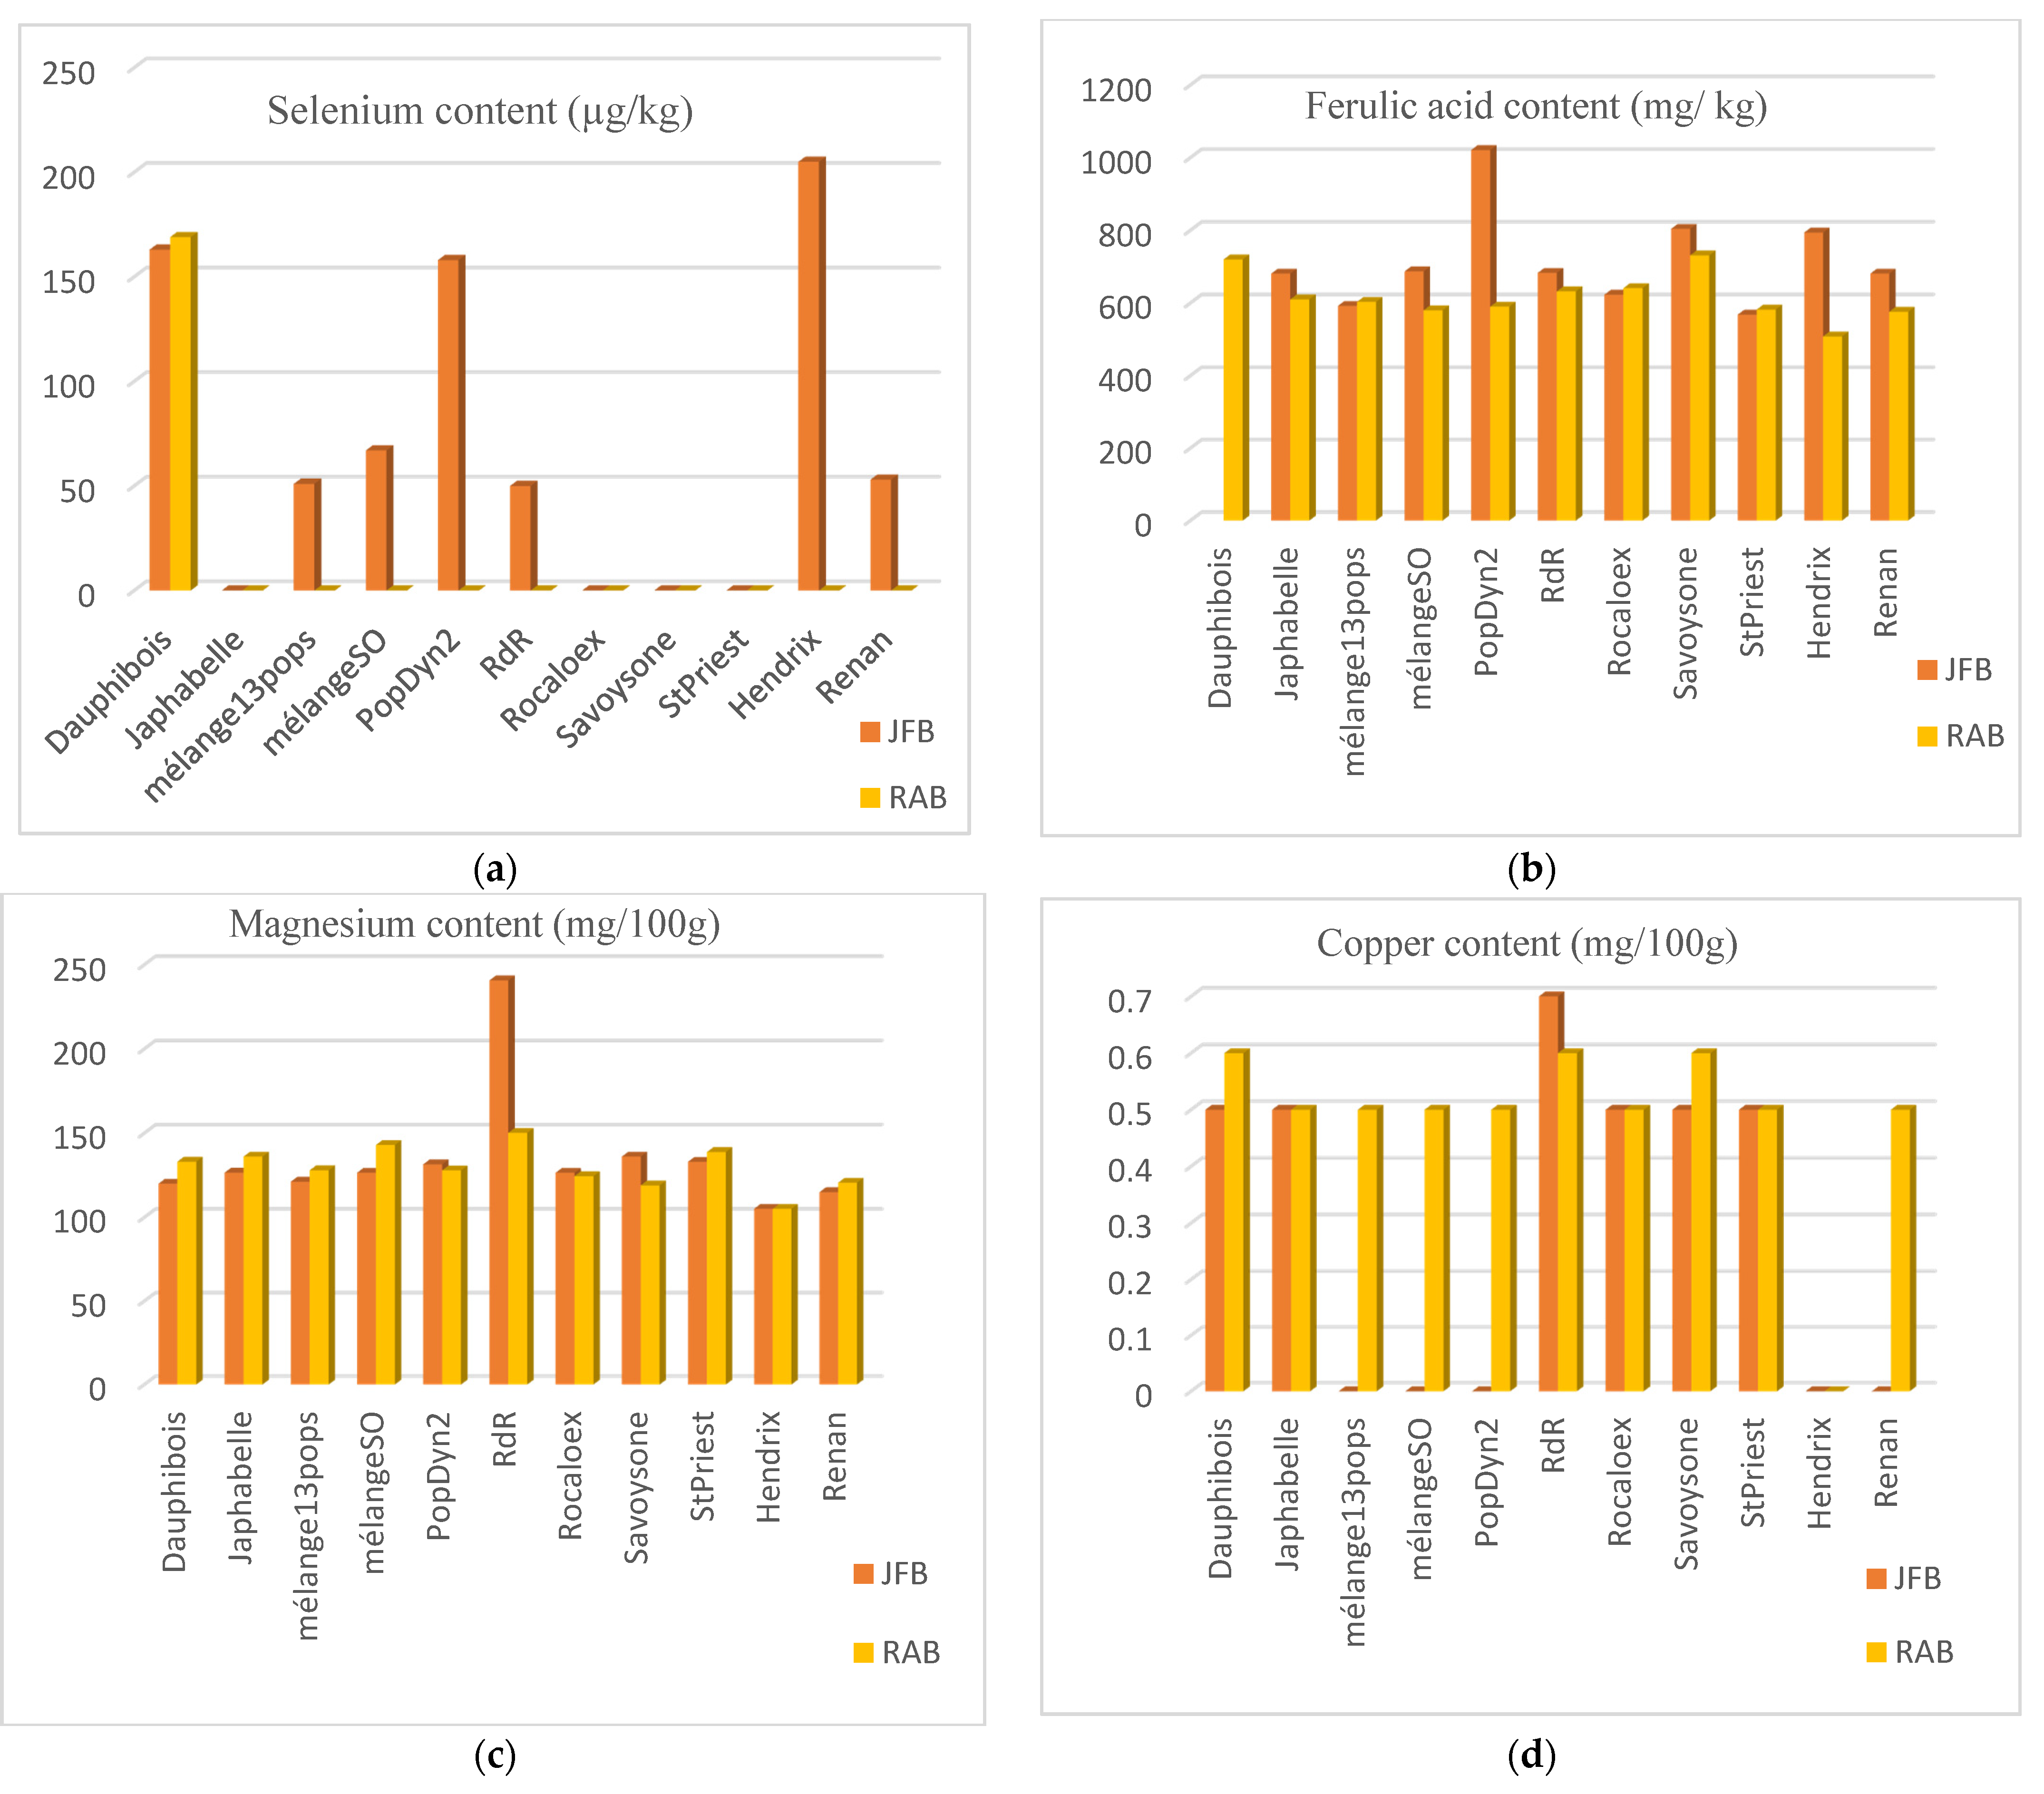
2.3. Nutritional Analyses

The analyses were conducted at the InVivo Labs, Chateau-Thierry (2), France, following standard procedures for calibration and blanks. All samples were milled in a ball mill just before analyses.
The 22 (nine population + two commercial varieties grown in two farms) wheat grain samples were analyzed for nutrient content. The choice of nutrient measurements was based on their relevance to health as well as their technological properties.
Concentrations of iron (Fe), zinc (Zn), copper (Cu), calcium (Ca) and magnesium (Mg) in the samples were determined in duplicate by Inductively Coupled Plasma Atomic Emission Spectrometry (ICP-AES; commercial manufacturing information: Jobin Yvon brand, ultima model). ICP-AES is a multi-element method with very good detection power, offering a reliable and rapid determination of the analytes. Measurement uncertainty was evaluated at 10% by the laboratory. Lutein content was measured in laboratory according to intern method N0725/02 using High-Performance Liquid Chromatography (HPLC; commercial manufacturing information: UPLC Waters, HSS T3 100 mm × 2.1 mm column and acid acetic gradient in 2.5% water/acetonitrile).
Ferulic acid and pentosan content (soluble and insoluble fiber content) were sub-contracted. Pentosan, implicated in textural properties and health benefits (lipolytic activities), was measured using the enzymatic-gravimetric method with a phosphate buffer and three enzymes (heat-stable a-amylase, protease, and amyloglucosidase, commercial manufacturing information: ileal digestibility). The results are the means of ten repeated measurements.

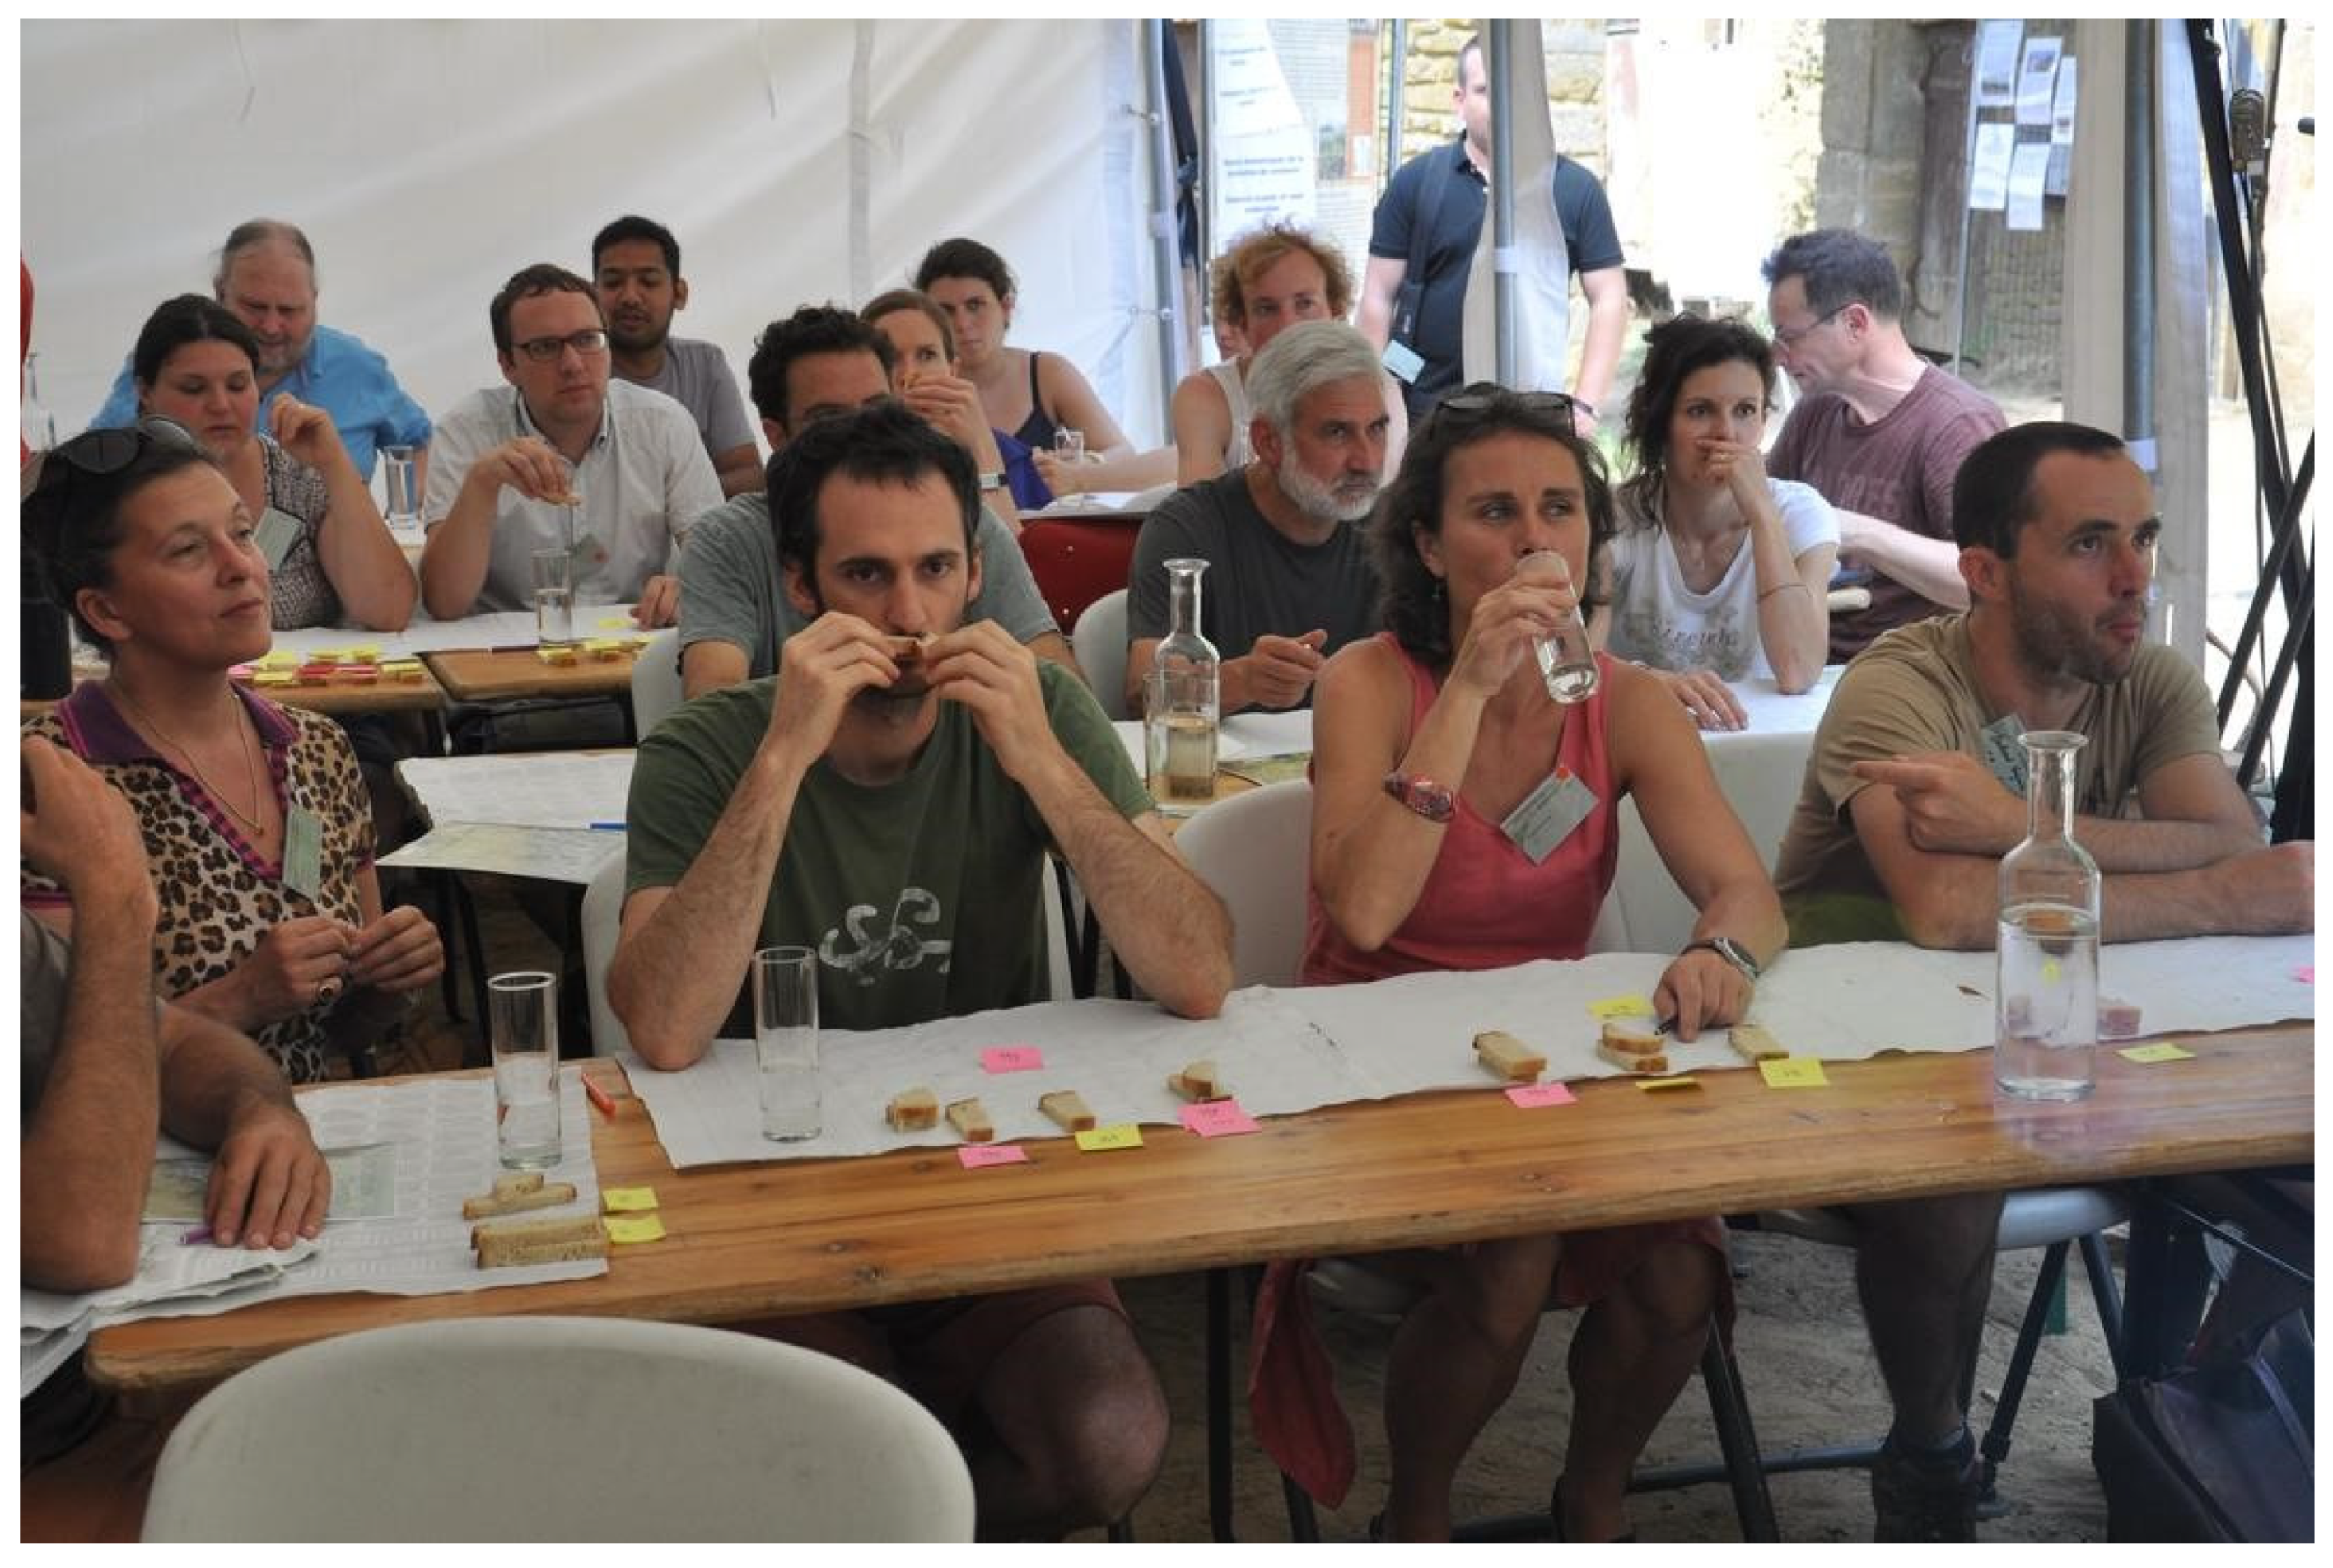
2.4. Sensory Evaluation

2.4.1. Bread Making

Wheat flour samples were obtained from the stone milling (T80 flour type) of grain samples by an Astrié mill model, which is commonly used by farmersartisan millers in France. The unsifted flour rested at room temperature for 20 days before baking. Wheat flour was sent to the bakers two weeks before the sensory evaluation, which took place in the “Lets liberate diversity” event, on the 21 and 23 of June, 2017, at Meix Devant Virton, Hayon’s farm, Belgium (Figure 2).
Bread was baked by Marc Dewalque and Axel Colin, two experienced Belgian bakers, one and two days before the sensory evaluation. The same bread dough formula was adopted, and the same two-day process was followed. A sourdough fermentation with three backsloppings was carried out using each tested flour, to limit the impact of the “levain chef” (the baker’s sourdough). Bakers varied levels of hydration, rest time, and mix time to allow each varietal flour to reach its full potential in bread-making. A cold room was used to ensure slow fermentation when needed.

2.4.2. Napping Method

The Napping method was chosen to compare the sensory quality of breads from different varieties. The Napping, a discrimination test, consists of collecting the sensory distance perceived between product by positioning the product on a sheet of blank paper (a tablecloth of 40 by 60 cm). Judges simultaneously lay out the products on the tablecloth in such a way that two breads are very near if they are to be perceived similar and distant if they are perceived to be different. This offers a good compromise when comparing objective quality parameters, without the need of a trained panel. Differences comprise global sensory characteristics and should be complemented with a verbalization task to explain these differences. This method is usually fairly intuitive and easy for consumers and untrained assessors to understand, and has been used quite effectively to understand the relationship between flavor attributes and drivers of liking [38]. It also seems to be fairly repeatable for grouping products [39,40,41,42,43,44].
Bread was sliced (slices 13 mm thick) ten minutes before tasting. Each slice was cut into 5 pieces, with each piece including both crust and crumb to evaluate the overall sensory characteristics.
The panel was composed of 32 naïve people who were interested in the issue of crop diversity and participatory plant breeding. They were asked during a professional event. The subjects carried out the napping test described below once at their chosen time.

2.5. Statistical Analyses

All the analyses were carried out using the R software and derived package [42].

2.5.1. Technological and Nutritional Characterization

Principal component analysis (PCA) has become common in plant-breeding analyses of genetic and phenotypic diversity. A PCA will show the positions of the samples in a new space and was created to capture the maximum amount of variation in the original dataset in the fewest possible dimensions. This can be very helpful in simultaneously visualizing the relationship between samples for multiple variables, as well as for visualizing correlations among variables and the importance of different attributes in determining differences between samples.
Principal Component Analysis was first performed to visualize the differences between samples on technological and nutritional data and identify correlated variables. Variables that significantly accounted for the first principal components were identified and analysis of variance (ANOVA) was applied on those nutritional variables to understand the impact of the varieties and environments on the variability.
When data met a test of normality, one-way analyses of variance was performed using the following model:
Xij = µ + αi + eij
where µ is the overall mean, αi the effect of factor i (environment or variety), and eij an error term.

2.5.2. Napping Test

Data constituted the coordinates (X and Y) of the breads on the tablecloths of each judge. A multiple-factor analysis (MFA) was performed on the data. MFA applies to tables in which a set of individuals are described by several sets of variables. Each judge constituted a group of two unstandardized variables (X and Y) to respect the disparities between horizontal and vertical variances. Descriptors (from verbalization task) were added as supplementary variables. They did not contribute to the construction of the axes [41,42].
Hence, a representation of bread commonality was obtained from Napping co-ordinates, whereas breads were described by sensory descriptors.

2.5.3. Correlation between Nutritional, Technologic, and Agronomic Properties

Twenty-two samples were assessed from a technological and nutritional perspective. In a second step, an MFA was run on the agronomic and nutritional variables as groups to explore the link between agronomic and nutritional properties.

3. Results

3.1. Technological Characterization

The results of PCA on technological variables are presented in Figure 3.
The first two dimensions express 54.21% of the total dataset inertia; this means that 54.21% of the individuals’ (or variables’) total variability is explained by the plane. This percentage is relatively high, and thus the first plane represents the data variability well. The best qualitative variable to illustrate the distance between individuals on this plane is the factor of Farm.
Dimension 1 explains almost 33% of the variability and compares individuals such as ‘Hendrix_RAB’, ‘Savoysone_JFB’ and ‘StPriest_RAB’ (to the right of the graph) to individuals such as ‘Savoysone_RAB’, ‘PopDyn2_RAB’, ‘Renan_JFB’, ‘mélange13pops_RAB’ and ‘PopDyn2_JFB’ (to the left of the graph).
The first group (‘Hendrix_RAB’, ‘Savoysone_JFB’ and ‘StPriest_RAB’) is characterized by a high ash content, swelling index and W (variables are sorted from the strongest) and low values for falling number and elasticity index (variables are sorted from the weakest). The group on the left (‘Savoysone_RAB’, ‘PopDyn2_RAB’, ‘Renan_JFB’, ‘mélange13pops_RAB’ and ‘PopDyn2_JFB’) shows a high elasticity index, falling number and Zeleny index (variables are sorted from the strongest) and low values for swelling index, ash content, P, W and gluten index (variables are sorted from the weakest).
The ash content variable is highly correlated with this first axis and may explain this dimension. The best qualitative variables that illustrated the distance between varieties on this plane is the farm’s variable, as ash content was rather more specific to the farm. It could be noted that varieties grown in the JFB farm presented a more diverse profile than those grown in the RAB farm, as shown by the confidence ellipse.
Dimension 2 opposes ‘mélangeSO_JFB’ (to the top of the graph) to ‘Savoysone_RAB’, ‘PopDyn2_RAB’, ‘Renan_JFB’, ‘mélange13pops_RAB’, ‘PopDyn2_JFB (to the bottom of the graph). The sample ‘MélangeSO_JFB’ is characterized by high values for Wet_gluten, L and P (variables are sorted from the strongest). However, ‘Savoysone_RAB’, ‘PopDyn2_RAB’, ‘Renan_JFB, ‘mélange13pops_RAB’ and ‘PopDyn2_JFB’ are characterized by a high elasticity index, falling number and Zeleny index (variables are sorted from the strongest) and low values for the swelling index, ash content, P, W and gluten index (variables are sorted from the weakest).
Strong wheats are generally characterized by a high GI value, wet gluten and W [36], and are usually positively correlated. Here, the first dimension differentiated the sample on the W, whereas the wet gluten was highly correlated with the second dimension. W and GI, which used to be positively correlated, are not correlated in these data. The non-suitability of the alveograph test to predict the baking properties of population wheat is perceived by farmers. This could be explained by W being influenced by parameters such as granulometry, albumen hardness, damaged starch and pentosan content [44].

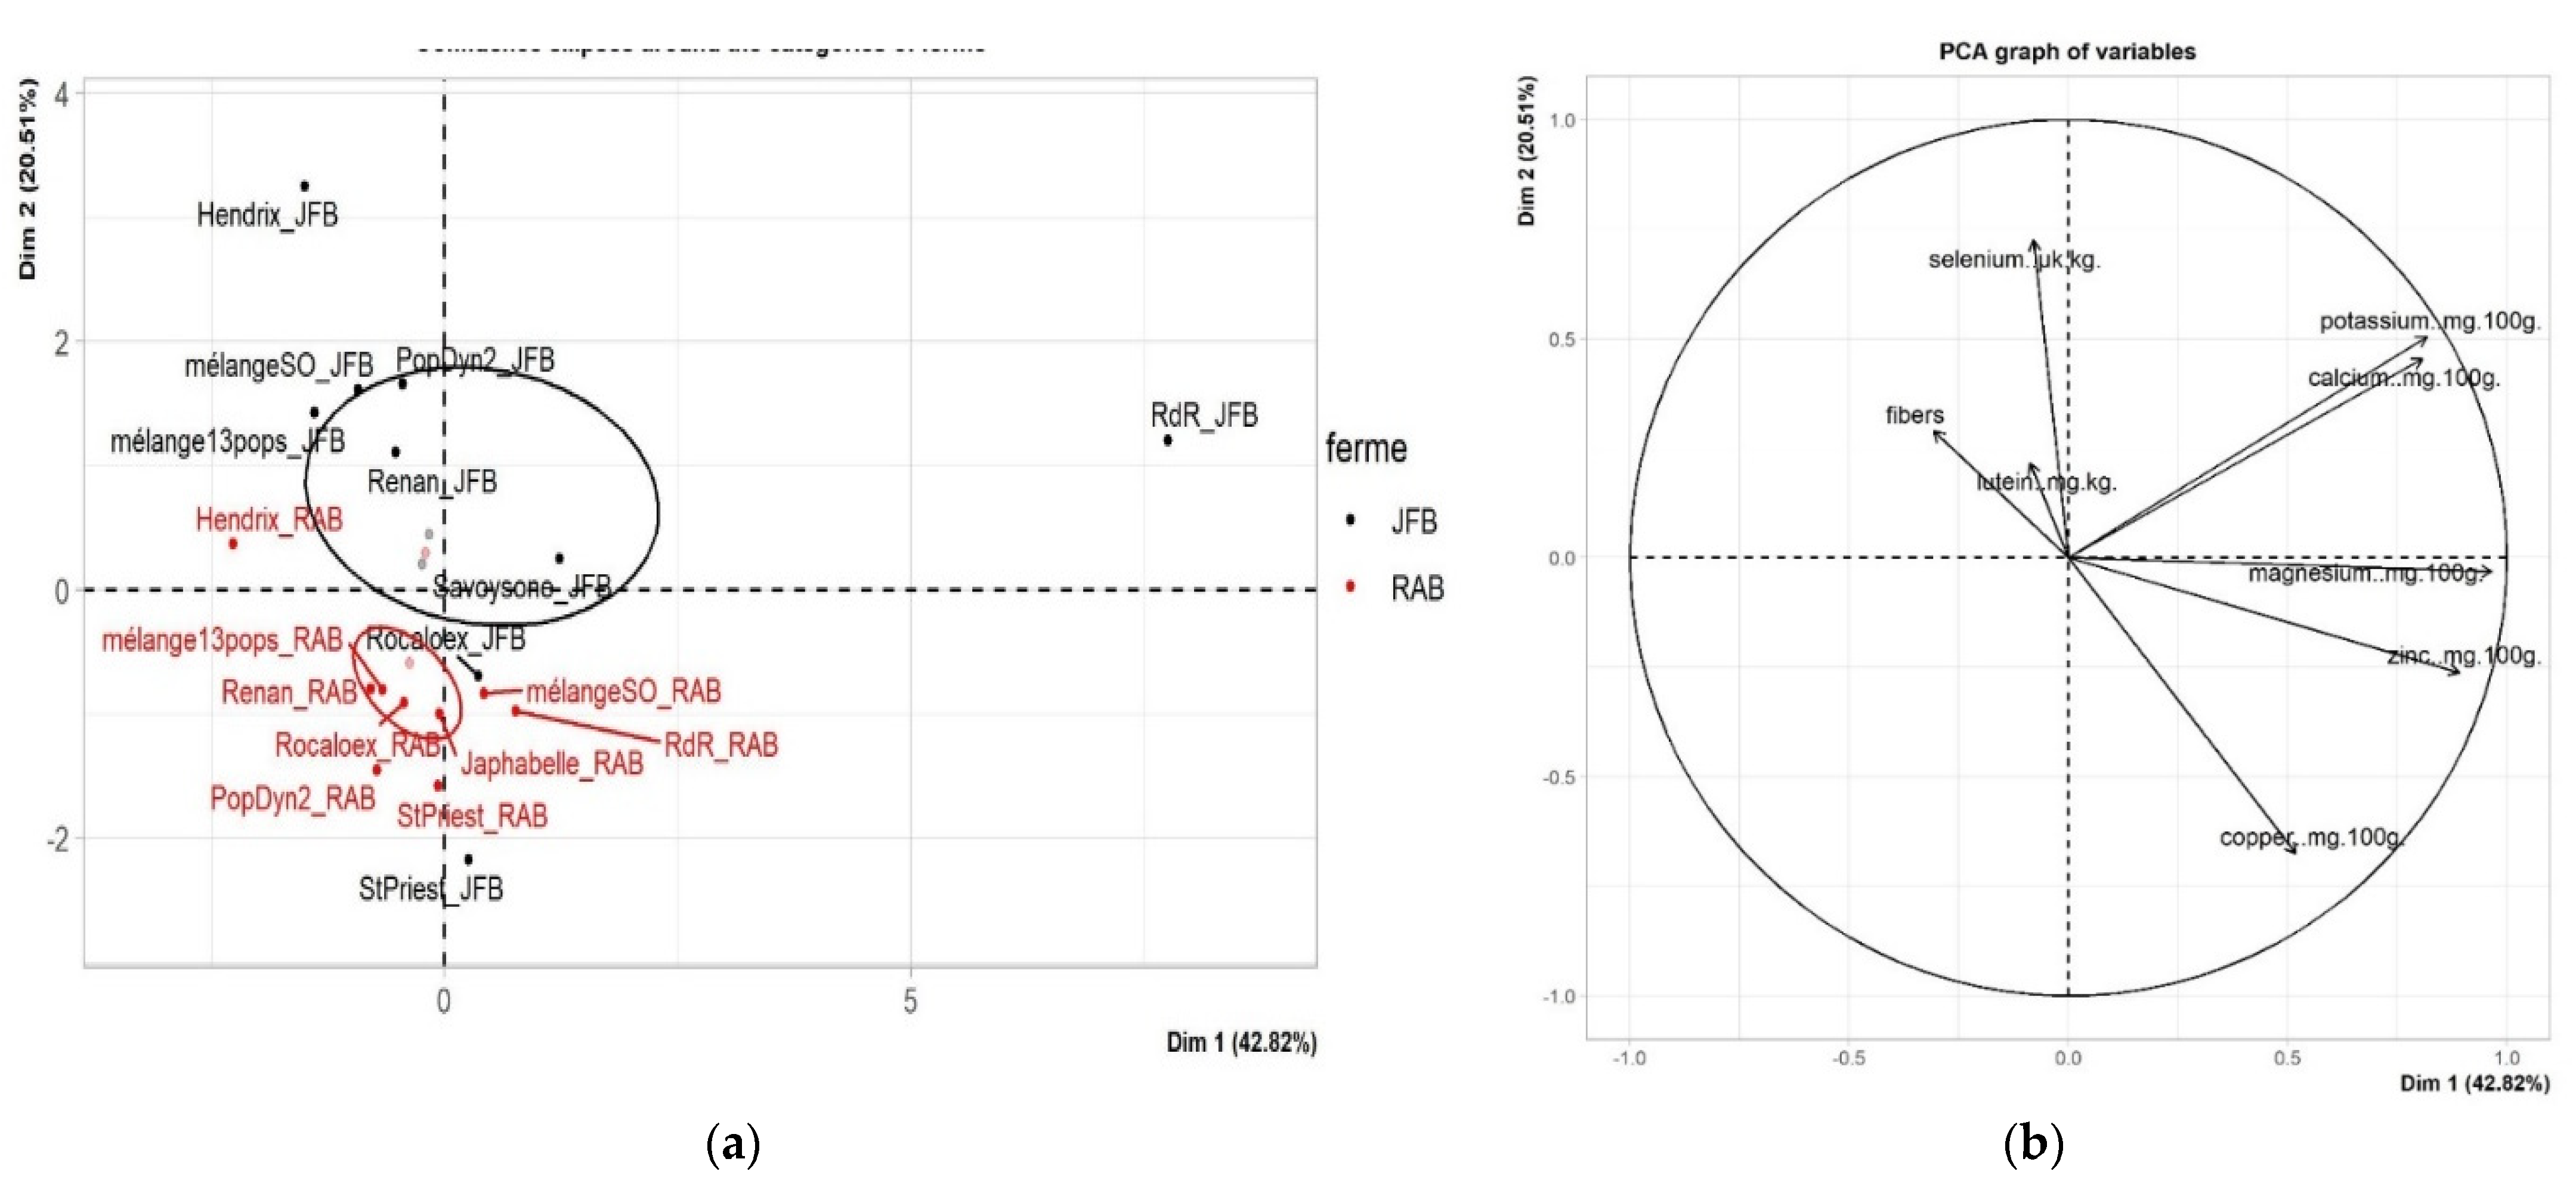
3.2. Nutritional Analyses
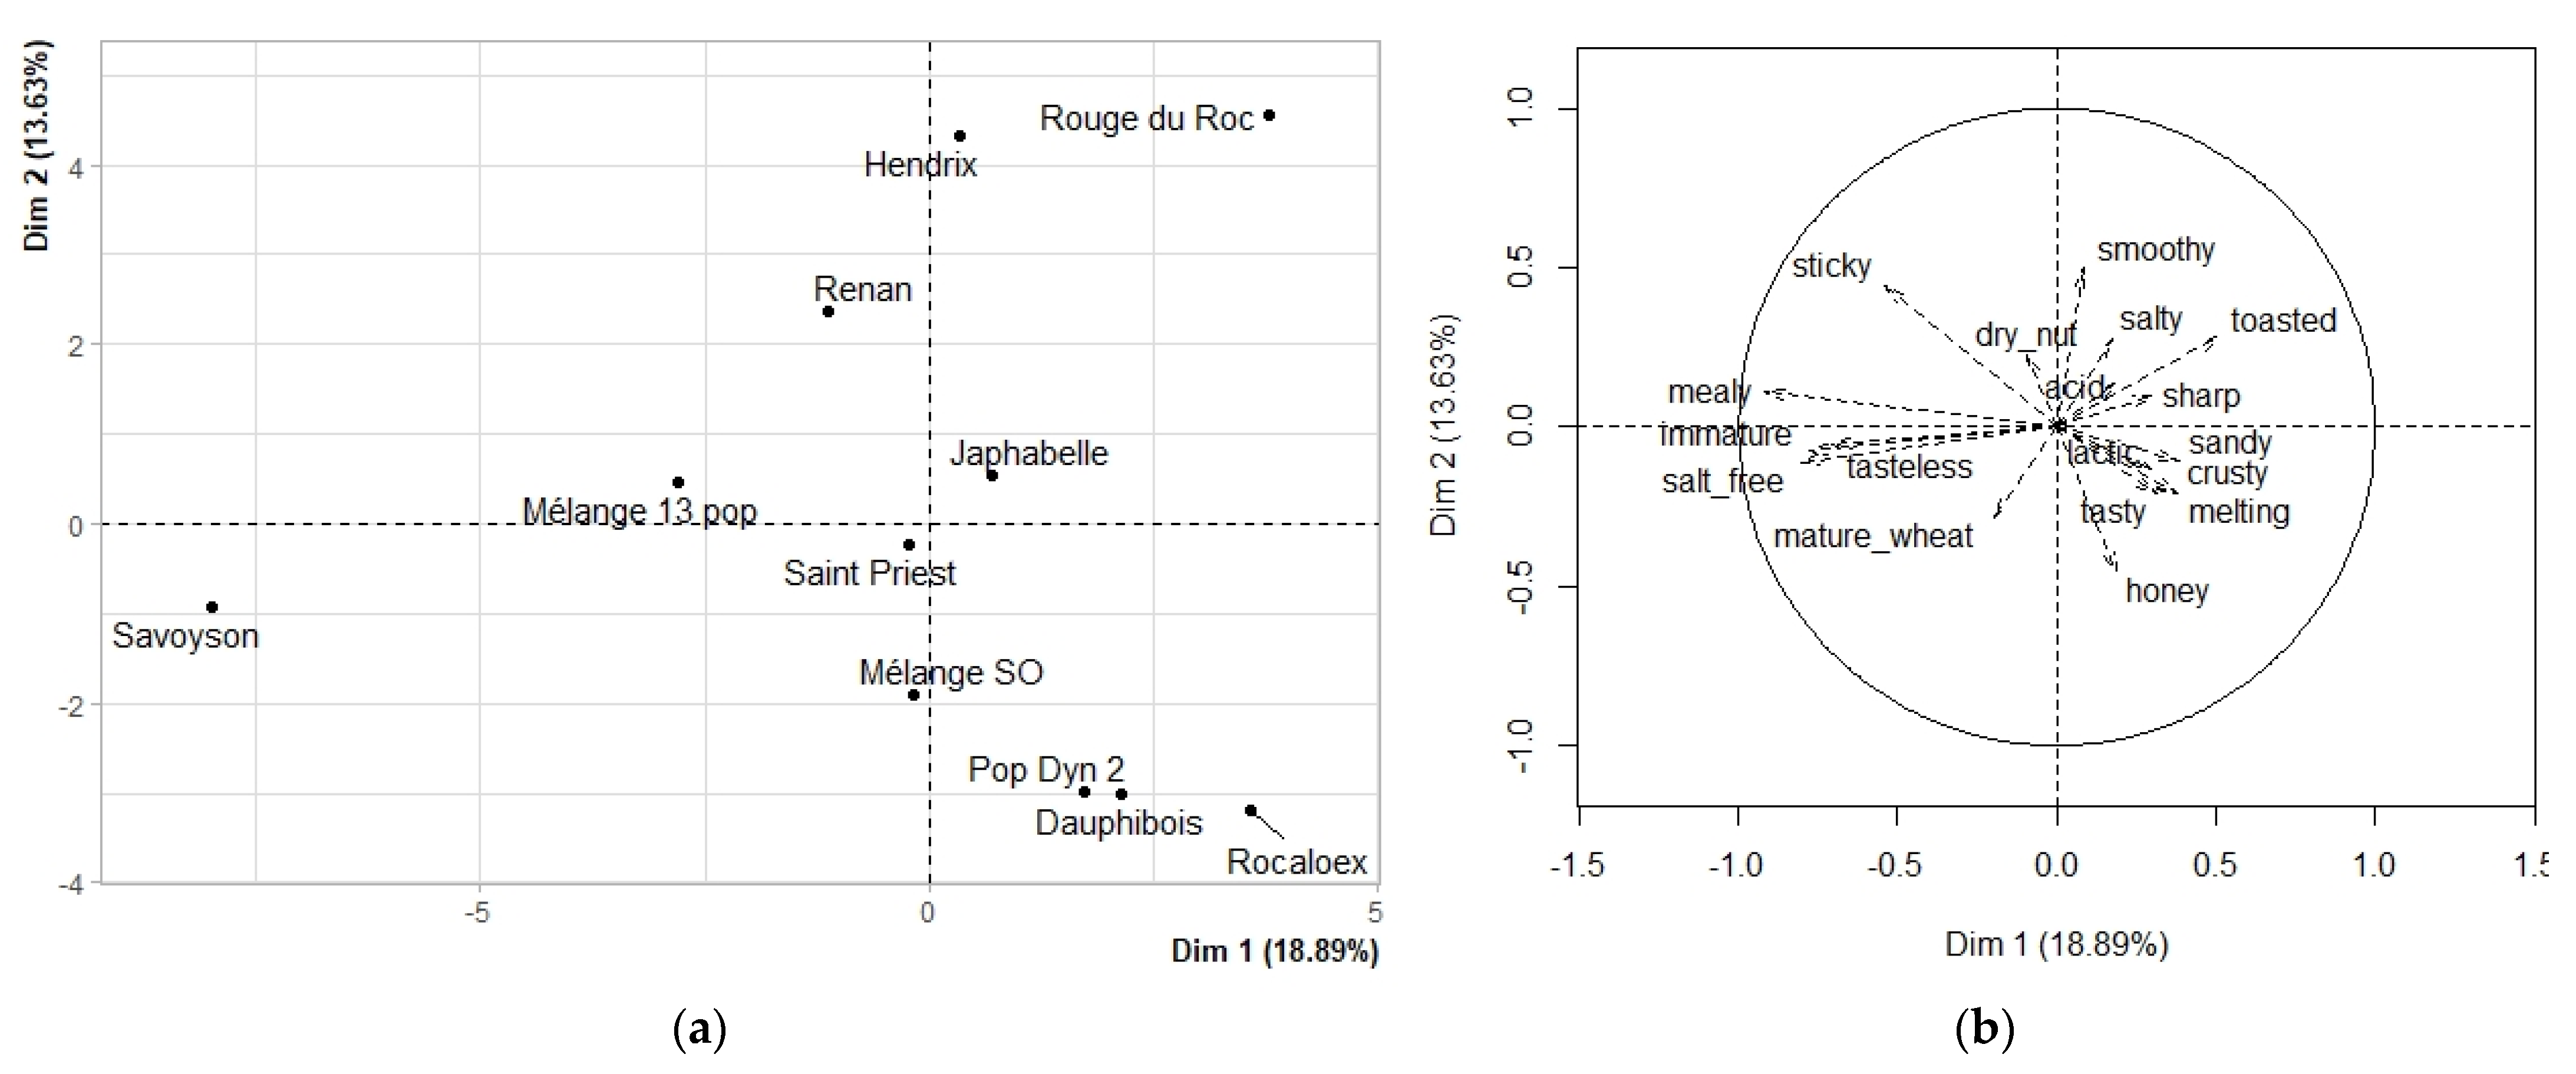
The nutritional composition was examined on all wheat samples. Figure 4 presents the values for Se, ferulic acid, Mg and Cu content. A dataset for all the studied traits is available in the Appendix A, Table A1.
The ‘RdR_JFB’ sample appeared as an outlier on most nutritional variables and a PCA including all data resulted in a space where ‘RdR_JFB’ was opposed to all other varieties and farms (Figure A1 in Appendix A). ‘Rouge du Roc’ also differed greatly in expression in the two growing environments compared to other varieties. Similar observations were made in a previous study [45], where ‘Rouge du Roc’ was an outlier for the same variables: selenium and magnesium. From the agronomic perspective, it can be noted that ‘Rouge du Roc’ showed some signs of local adaptation and was the population had been been cultivated and selected for the longest time in its farm of origin [23].
For a more in-depth understanding of the effect of the environment on the nutritional profile of wheat varieties, ‘RdR_JFB’ was removed from the dataset and all the other samples were analyzed (Figure 5).
The inertia axes analyses suggest limiting the analyses to the two first axis. This suggested that this first dimension contained real information. The best qualitative variable that illustrated the distance between varieties on this plane is the Farm factor.
The first dimension separated ‘PopDyn2_RAB’, ‘StPriest_RAB and ‘RdR_RAB’ (on the left) to ‘Hendrix_JFB’ and ‘Renan_JFB’ (on the right). The group of varieties grown in the RAB farm (colored in red) is characterized by a high value of Zn, Cu and Mg and low value of K. However, varieties grown in the JFB farm (colored in black) presented high values of Ca, ferulic acid, K and Se.
Individual repartition on the graph showed a higher dispersion of nutritional profile for wheat varieties grown in the JFB farm compared to those grown in the more fertile RAB farm.
To test the significance of the overall variation observed in the multidimensional analysis, one-factor ANOVA was applied for each measured variable (Table 2).
Six variables differed significantly between the two environments: K, Ca, Cu, lutein, Ferulic acid and Se. This confirms the great impact of the environment on the nutritional profile of wheat grain. Growing wheat in JFB’s farm seems to improve the content of Ca, K and Ferulic acid. In the RAB’s farm, wheat varieties show higher contents of Cu and lutein.
Two variables appeared to be dependent on the variety: Mg and Zn. The group composed of ‘Saint-Priest’ and ‘MélangeSO’ showed higher content of these two nutrients and were significantly different from ‘Hendrix’. ‘Renan’ is the second variety that presented the lowest values of Mg and Zn. The two pure-line varieties present relatively low Mg and Zn contents, which supports the hypotheses of the dilution effect. A correlation with yield should strengthen this hypothesis.
Even if the environment deeply impacts the nutritional content of most measured elements, Zn and Mg content seem to be greatly influenced by the varieties, and positively correlated. ‘StPriest’ and ‘Rocaloex’ showed a high content for these two elements in the two environments. Zn concentration in wheat grain was studied as a biofortification target [44]. Positive correlations and inheritance characteristics will allow for potential improvements in Mg and Zn content if breeding efforts choose these two varieties. A breeding effort may offer new tools for producing nutritious food under low-input agriculture condition, as supported by other studies [8,46,47]. Nevertheless, the stability of nutritional yields cannot be considered in this study, and it is important to breed for stability of yield and nutrient content. For these two nutrients, it is noted that the two pure lines present the lowest content in both growing environments.

3.3. Napping Test

Thirty-two semi-naïve consumers tasted the eleven breads made from eleven varieties grown in one location (RAB). The panel was composed of 12 females and 20 males.
The first two axes of the MFA account for more than 32% (Figure 5). The third axis accounted for more than 13% of the variability; therefore, it is included in the analyses.
The first axis compared ‘Savoysone’ with the others. Its main characteristics were salt-free, mealy. Bakers forgot to add salt when baking. This may have erased the differences between all other breads. Nevertheless, differences were perceived between other breads by the panel, as they were divided along the second axes.
The second axis compared the pure lines, ‘Hendrix’, ‘Renan’, and ‘Rouge du Roc’ to ‘Mélange SO’, ‘PopDyn2’, ‘Dauphibois’ and ‘Rocaloex’, with these being a mix of populations. The first group was characterized by their smoothly texture and their toasty taste. This may be due to the nature of their proteins, which are more tenacious and influence the Maillard reaction as the bread dough rises. The second group was characterized by a honey aroma and melting texture. ‘Mélange 13 pop’, ‘Saint Priest’ and ‘Japhabelle’ did not show any specific pattern on the set of measurements and were not well-differentiated on the two first axes of the PCA.
The third dimension accounted for 13% of the variability and compared ‘Mélange 13 pop’ and ‘Saint Priest’ to ‘Melange SO’, ‘Savoysone’, ‘Japhabelle’ and ‘Dauphibois’, characterized here by mature wheat flavor and crusty texture, in terms of acidity. The two pure lines, ‘Renan’ and ‘Hendrix’, were very close on this axis and showed similar characteristics.
Another Napping test was carried out (Figure A2 in Appendix B), one month after the first, on seven of the 11 samples. The panel was composed of 23 tasters who were more in agreement, as more than 50% of the variability was accounted for by the two first axes. The results confirmed the textural differences perceived between breads from pure-line varieties, with a light crumb, and bread from population varieties, with a pasty texture.

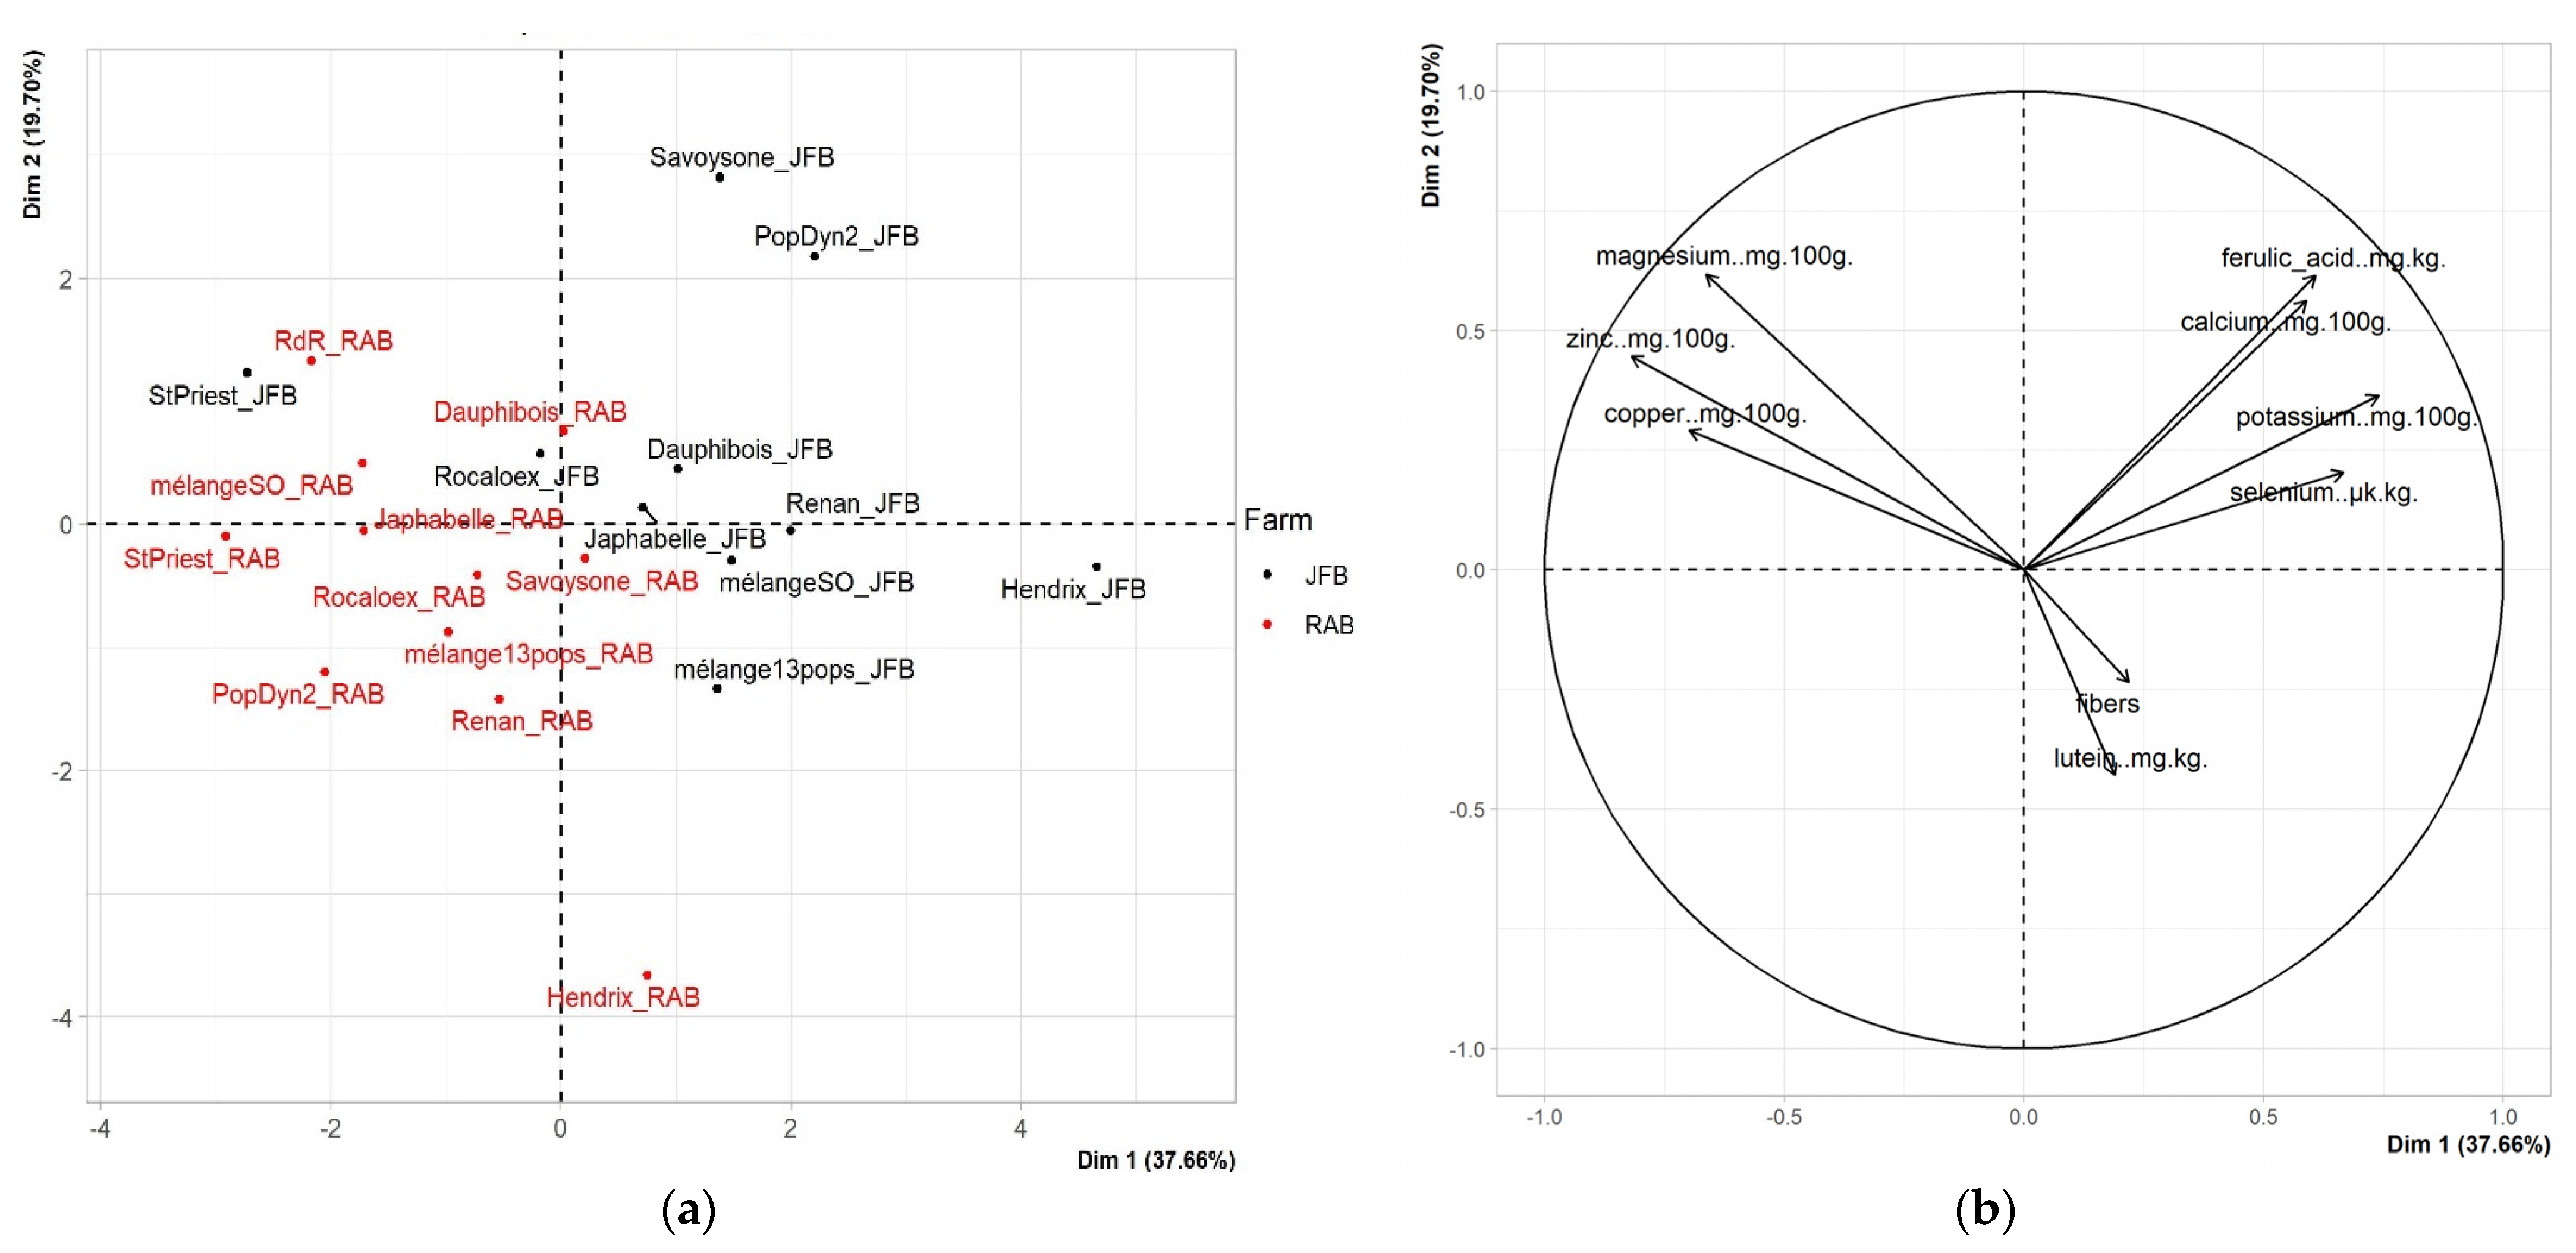
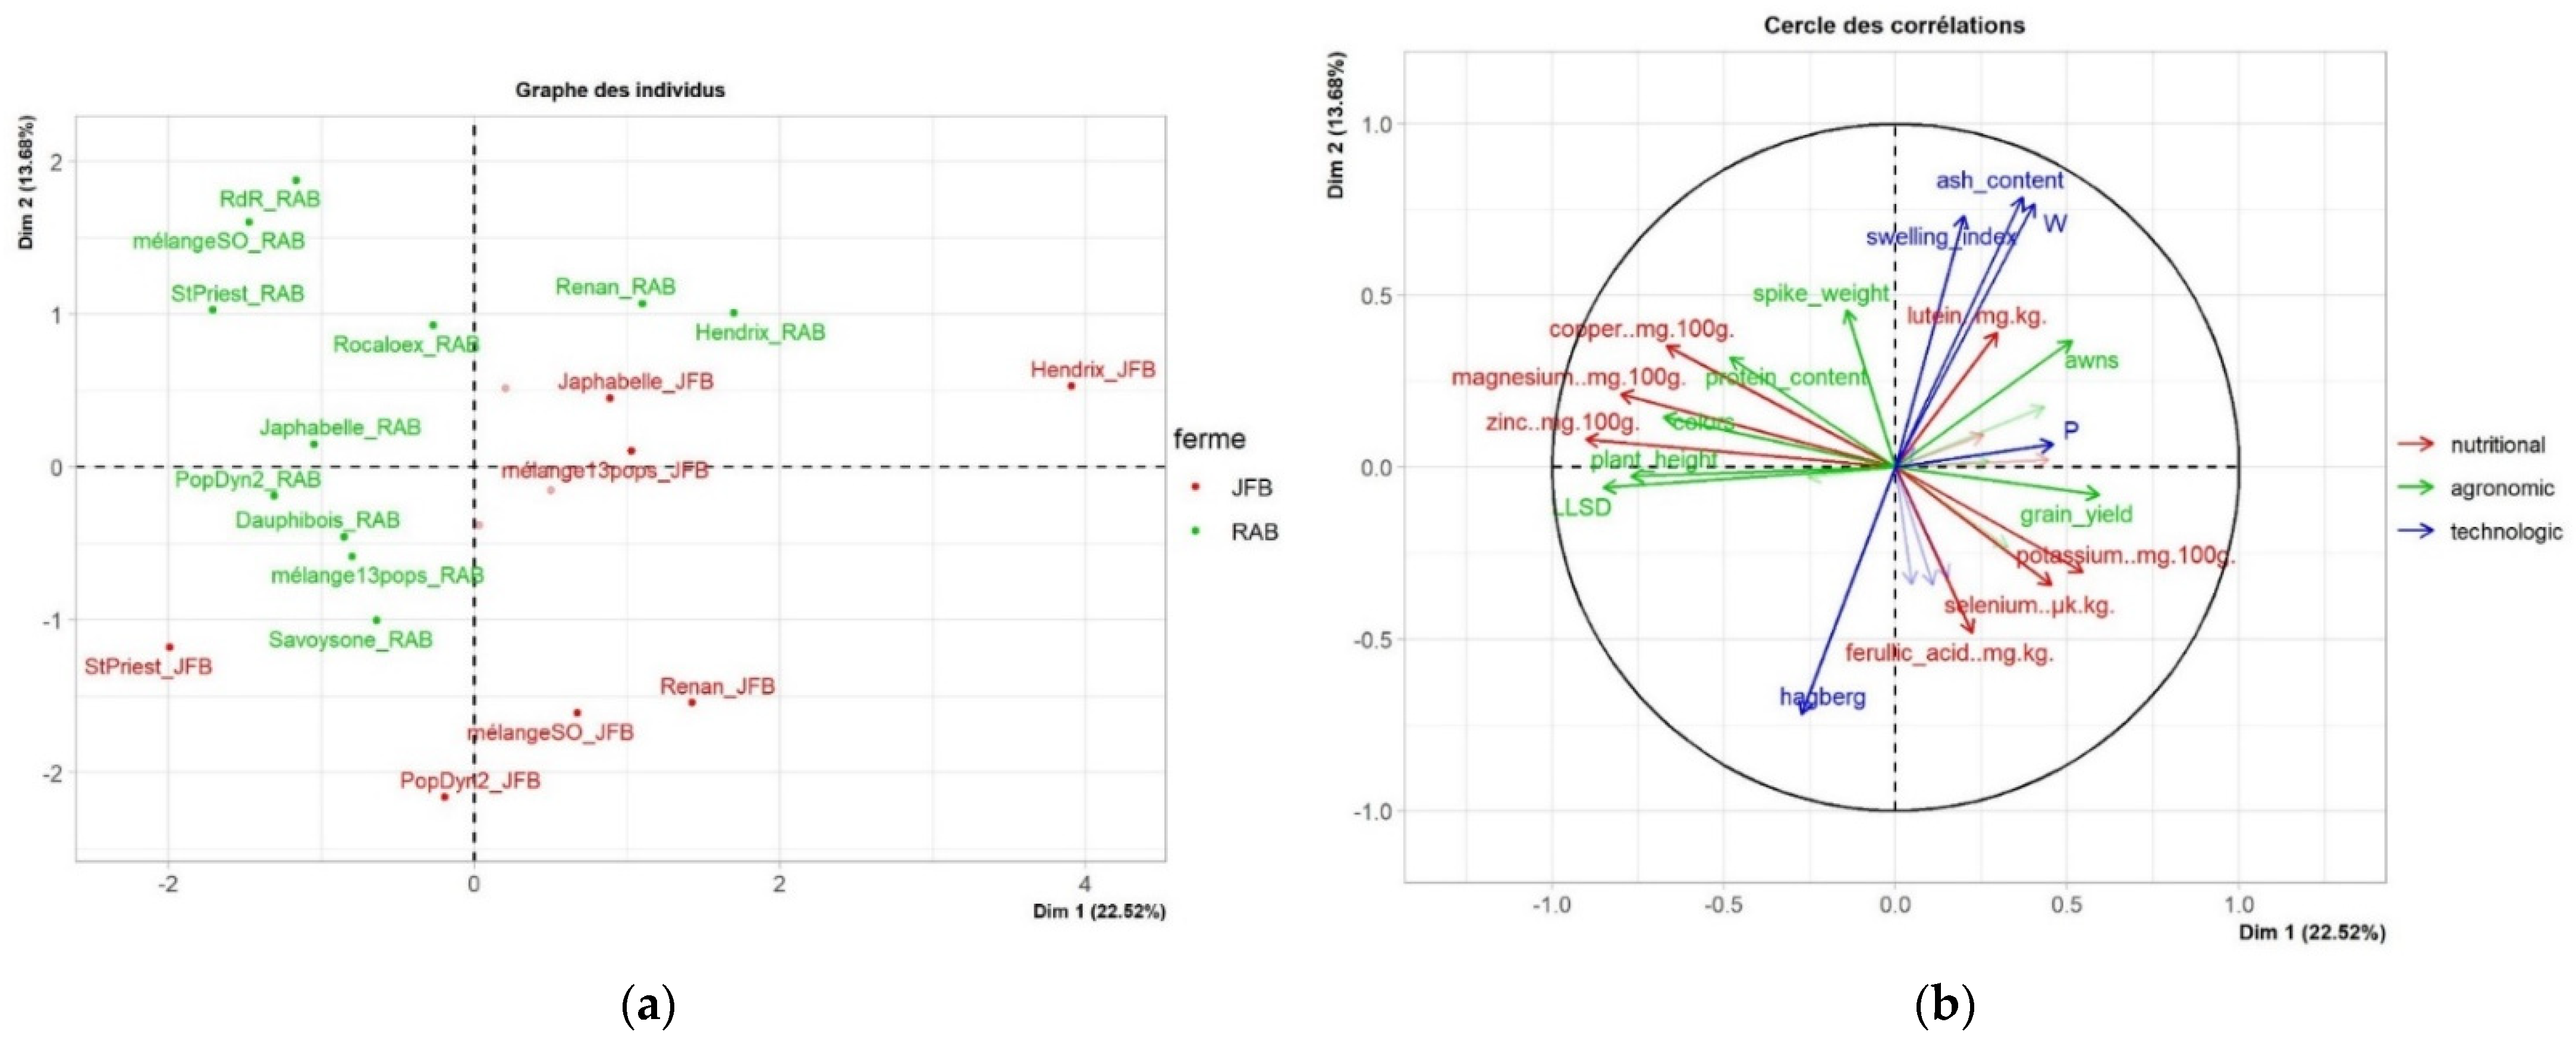
3.4. Correlation between Nutritional, Technologic, and Agronomic Properties

To explore the potential links between agronomics, dough’s rheological properties and the nutritional characteristics of varieties, an MFA was run on agronomic, technological, and nutritional data as groups.
Thirty-four variables were collected for the 22 wheat varieties sample. The correlation circle describes the nature and the reliability of the correlations between variables.
Only the 20 most correlated variables, those showing significative correlations, were represented on the MFA (Figure 6b).
The graph of the individual MFA showed an interesting differentiation between population varieties (on the left) and pure-line varieties (on the right) (Figure 7). Population varieties showed a lower yield but higher Cu, Mg, and Zn contents. Conversely, pure-line varieties were characterized by a higher yield. Table A2 in the Appendix B shows the reliability of the observed correlations.
Among the eight nutritional variables, six were positively and significantly correlated with the first dimension: K, Se, Ca, Cu, Mg and Zn.
Plant height and LLSD significantly correlated to this first dimension, which means that the taller the plant is, the richer it is in Mg, Zn and Cu. It can be noted that pure-line varieties are on the right of the graph, a differentiation that seems to be linked with their higher grain yield and shorter plant height. The best qualitative variables illustrating the distance between varieties on this plane is the Farm variable, so the nutritional profile seems to be greatly determined by environmental factors. This dimension separated ‘Hendrix_JFB’ (on the right) characterized by a high K content and grain yield, from ‘St Priest_JFB’, which is taller and richer in Mg, Zn and Cu.
Dimension 2 separates wheat genotypes in terms of their nutritional and rheological characteristics. On the upper side, varieties are characterized by a high ash content (minerals) and high W value (varieties grown in the RAB farm); conversely, varieties with a high hagberg index and ferulic acid content were grown at the JFB farm.
The third dimension is correlated with six variables, most of them concerning agronomical traits. This dimension separated ‘Renan’ from the other varieties, which is characterized by a low P value, a higher number of spikelets per spike, and a lower wet gluten content.

4. Discussion

4.1. Nutritional and Sensory Quality of PPB Varieties

Variability in mineral concentrations has already been described for different cereals such as bread wheat and showed high inheritance in terms of Mg and Zn content. However, few have studied the GxE interactions, so the respective contributions of genotype and environment to the control of Mg and Zn concentrations is not well known [8]. Nevertheless, the results confirm the source of diversity with respect to population varieties and the inheritance for Zn and Mg. The improvement in wheat’s nutritional density must consider the genotype’s environmental interactions and use the genetic potential of populations.
From the sensory perspective, people used to oppose acetic and lactic breads and separate bread according to the acidity of the sourdough. This indicates that variations in fermentation occurred between varieties and/or that the bread-making process was not adjusted for each sample.
Tasters first perceived textural differences. This seems to be linked to the protein profile of pure-line varieties richer in glutenin, which favored the dough rising during baking at the onset of the Maillard reaction and the release of aroma. The results show that tasters perceived aroma differences before acidity differences. This suggests that the bread process must have an optimized fermentation time in a cold room.

4.2. Correlation between Agronomic and Nutritionnal Traits

A positive correlation was found between nutrient density, spike height, and LLSD. This is in line with farmers’ breeding strategies. Farmers select tall plants with long peduncles (LLSD) because they feel that these phenotypes promote better storage and the late transfer of carbohydrate to spikes under drought conditions [35]. Nevertheless, farmers had to compromise to avoid lodging.
The variability in the nutritional profiles observed in less fertile soil is potentially linked to genetic diversity. Cultivating genetic diversity may affect plants’ diverse nutritional intake and sensory properties, particularly in soil less favorable to the cultivation of wheats.

4.3. Fine Tuning of Bread Making Process to Compare Diverse Varieties

PPB varieties show great variability in several criteria, as do the bread-making properties. Intrinsic differences, such as damaged starch and enzymatic activity, influence dough rheology and the bread-making process, and some parameters must be adjusted to obtain similar bread with an optimized hydration and fermentation rate. Comparing breads is a technical challenge, and more than one baker is needed to undertake the screening of sensory qualities of bread wheat. Through experiments, several adjustments lead to an optimized bread process that allows for a comparison of a variety of effects on the bread. Endogen sourdough, sourdough nourished two weeks before using the tested flour, was used to optimize the expression of variety in the bread. The hydration rate was adjusted to obtain a similar dough texture and fermentation time was shortened by placing dough in a cold room. This allowed us to avoid textural differences (hydration) and over-fermentation.

5. Conclusions

In France, organic agriculture lacks adapted varieties, due to a lack of breeding investment in this sector. Population varieties constitute a promising gene pool to improve nutritional and sensory qualities. Even if nutrient content is influenced by the growing environment, Mg and Zn appear to be genotype-dependent. Population varieties’ agronomic and genetic characteristics are adapted to an organic agriculture, where conditions are diverse and often have low-grain potential. They are flexible enough to behave well in contrasting environments. Nevertheless, an adapted bread-making process is needed to enhance the qualities of those varieties, as they are softer than the pure-line varieties.
Even though only two commercial varieties were studied, these are very commonly used by organic farmers and constitute good references. However, it is not possible to derive general conclusions on this basis. Nevertheless, the results showed great variability in nutritional profiles, with greater profile differences in the less fertile environment. Wheat grown on RAB’s farm was characterized by high contents of Mg, Zn and Cu, wheat grown on JFB’s farm was characterized by high contents of Ferulic acid, Ca, K and Se.
We are aware that comparing 10 varieties derived from PPB with only two commercial varieties does not make it possible to derive general conclusions on the commercial varieties. Nevertheless, differences in gluten tenacity clearly led to differences in the dough-rising and impacted the Maillard reaction, the origin of the bread’s aroma. Another French study [48] characterized the sugar profile of population varieties and showed significant differences (to be published). This could explain the aroma differences perceived by the panel, such as the mature wheat aroma. More research is needed on comprehensive aroma production mechanisms and the specificity to population varieties.
This information is expected to support the development of a greater diversity of wheat, relevant to organic wheat production within the agronomic and social context, at a local scale.

Author Contributions

Conceptualization, methodology, C.V.-F., I.G.; validation, I.G., G.v.F., M.D., H.M., A.C., C.D.; writing: review and editing, C.V.-F., resources (populations and on-farm trials), R.B., J.-F.B.; supervision and project administration, I.G.; funding acquisition, I.G. All authors have read and agreed to the published version of the manuscript.

Funding

This work was supported by Fondation de France (EcoAgri) and the European Union’s Horizon 2020 research and innovation program under grant agreement No 633571 (DIVERSIFOOD).

Institutional Review Board Statement

Not applicable.

Informed Consent Statement

Not applicable.

Acknowledgments

We thank Carolina Dawson for the English language proofreading.

Conflicts of Interest

The authors declare no conflict of interest.

Appendix A. Nutritional Content of the 22 Wheat Samples

Table A1. Content of Lutein, Selenium (Se, µg/kg), Copper (Cu, mg/100 g), Calcium (Ca, mg/100 g), Magnesium (Mg, mg/100 g), Potassium (K, mg/100 g), Zinc (Zn, mg/100 g)) and Fiber (g/100 g) of 11 varieties grown in two environments.
SampleVarietiesFarmCaMgKCuZnSeFibersLutein
Dauphibois_JFBDauphiboisJFB41.8120434.30.53.61631.31.2
Japhabelle_JFBJaphabelleJFB45.5126.64470.53.803.11.3
mélange13pops_JFBmélange13popsJFB40.4121.2434.503.6513.11.2
mélangeSO_JFBmélangeSOJFB42.2126.5444.6046731.3
PopDyn2_JFBPopDyn2JFB42.2131.5431.404.215821.1
RdR_JFBRdRJFB71240.7745.60.77.7501.81.3
Rocaloex_JFBRocaloexJFB43.6126.5450.30.54.101.71.2
Savoysone_JFBSavoysoneJFB55.8136.1487.80.5402.11.2
StPriest_JFBStPriestJFB37.37133369.60.54.901.80
Hendrix_JFBHendrixJFB49.4105.1453.302.72052.61.3
Renan_JFBRenanJFB42.8115484.603.8531.81.2
Dauphibois_RABDauphiboisRAB39.7133.1393.60.6416921.3
Japhabelle_RABJaphabelleRAB39.5136.1374.80.54.602.21.4
mélange13pops_RABmélange13popsRAB37.2128388.60.5402.51.3
mélangeSO_RABmélangeSORAB38.5143427.50.54.802.21.4
PopDyn2_RABPopDyn2RAB33.5127.93480.54.4021.4
RdR_RABRdRRAB44.7150.2376.50.6502.41.4
Rocaloex_RABRocaloexRAB43.3124.5357.90.53.9021.3
Savoysone_RABSavoysoneRAB42119413.50.63.902.41.5
StPriest_RABStPriestRAB33.6138.83610.55.202.21.2
Hendrix_RABHendrixRAB34.9105.1380.203.102.21.6
Renan-RABRenanRAB39.3120.6380.40.53.6021.5
Figure A1. Results of MFA for the 22 varieties*environments samples on nutritional variables, dim 1 and 2: (a) graph of the individuals; (b) correlation circle.
Agronomy 11 02117 g0a1

Appendix B

Table A2. Correlation and p-value for quantitative variables and Supplementary Group for the MFA in terms of agronomic, technologic, and nutrient content variables.
Dimension 1Dimension 2Dimension 3
VariableCorrelationp-ValueVariableCorrelationp-ValueVariableCorrelationp-Value
Grain yield5.91 × 10−14.75 × 10⁻³Ash content7.85 × 10−12.46 × 10⁻⁵Curve7.33 × 10−11.56 × 10⁻⁴
Potassium5.44 × 10−11.07 × 10⁻²W7.66 × 10−15.08 × 10⁻⁵% Sterile kernels6.51 × 10−11.38 × 10⁻³
Awns5.12 × 10−11.75 × 10⁻²Swelling index7.31 × 10−11.66 × 10⁻⁴P6.44 × 10−11.64 × 10⁻³
P4.59 × 10−13.63 × 10⁻²Spike weight4.57 × 10−13.71 × 10⁻²Colors5.24 × 10−11.47 × 10⁻²
Selenium4.54 × 10−13.87 × 10⁻²Ferulic acid−4.81 × 10−12.74 × 10−2Nb of spikelet per spike5.21 × 10−11.56 × 10⁻²
Calcium4.45 × 10−14.29 × 10⁻²Hagberg−7.17 × 10−12.51 × 10−4Wet gluten4.51 × 10−14.00 × 10⁻²
Protein content−4.82 × 10−12.68 × 10−2
Copper−6.67 × 10−19.64 × 10−4
Colors−6.75 × 10−17.81 × 10−4
Plant height−7.7 × 10−14.46 × 10−5
Magnesium−8.00 × 10−11.33 × 10−5
LLSD−8.50 × 10−11.08 × 10−6
zinc−9.02 × 10−12.40 × 10−6
VariableR2p-valueVariableR2p-valueVariableR2p-value
Farm2.05 × 10−13.95 × 10⁻²Farm2.36 × 10−12.53 × 10⁻²
JFB farm6.18 × 10−13.95 × 10⁻³RAB farm5.18 × 10−1 2.53 × 10⁻²
Hendrix2.859.72 × 10−4
St Priest−1.794.58 × 10−2
Figure A2. Common representation of 7 bread wheat populations perceived by 22 tasters: Results of MFA, dim 1 and 2: graph of the individuals.
Agronomy 11 02117 g0a2

References

  1. Dinu, M.; Whittaker, A.; Pagliai, G.; Benedettelli, S.; Sofi, F. Ancient wheat species and human health: Biochemical and clinical implications. J. Nutr. Biochem. 2018, 52, 1–9. [Google Scholar] [CrossRef] [PubMed]
  2. Dwivedi, S.L.; van Bueren, E.T.L.; Ceccarelli, S.; Grando, S.; Upadhyaya, H.D.; Ortiz, R. Diversifying Food Systems in the Pursuit of Sustainable Food Production and Healthy Diets. Trends Plant Sci. 2017, 22, 842–856. [Google Scholar] [CrossRef] [Green Version]
  3. Fardet, A.; Leenhardt, F.; Lioger, D.; Scalbert, A.; Rémésy, C. Parameters controlling the glycaemic response to breads. Nutr. Res. Rev. 2006, 19, 18–25. [Google Scholar] [CrossRef]
  4. Kasarda, D.D. Can an Increase in Celiac Disease Be Attributed to an Increase in the Gluten Content of Wheat as a Consequence of Wheat Breeding? J. Agric. Food Chem. 2013, 61, 1155–1159. [Google Scholar] [CrossRef]
  5. Leenhardt, F.; Lyan, B.; Rock, E.; Boussard, A.; Potus, J.; Chanliaud, E.; Remesy, C. Genetic variability of carotenoid concentration, and lipoxygenase and peroxidase activities among cultivated wheat species and bread wheat varieties. Eur. J. Agron. 2006, 25, 170–176. [Google Scholar] [CrossRef]
  6. Durazzo, A.; Zaccaria, M.; Polito, A.; Maiani, G.; Carcea, M. Lignan Content in Cereals, Buckwheat and Derived Foods. Foods 2013, 2, 53–63. [Google Scholar] [CrossRef]
  7. Tian, S.; Sun, Y.; Chen, Z.; Yang, Y.; Wang, Y. Functional Properties of Polyphenols in Grains and effects of Physiochemical Processing on Polyphenols. J. Food Qual. 2019, 2019, 8. [Google Scholar] [CrossRef]
  8. Oury, F.-X.; Leenhardt, F.; Rémésy, C.; Chanliaud, E.; Duperrier, B.; Balfourier, F.; Charmet, G. Genetic variability and stability of grain magnesium, zinc and iron concentrations in bread wheat. Eur. J. Agron. 2006, 25, 177–185. [Google Scholar] [CrossRef]
  9. Luo, C.; Branlard, G.; Griffin, W.; McNeil, D. The Effect of Nitrogen and Sulphur Fertilisation and their Interaction with Genotype on Wheat Glutenins and Quality Parameters. J. Cereal Sci. 2000, 31, 185–194. [Google Scholar] [CrossRef]
  10. Ames, N.P.; Clarke, J.M.; Marchylo, B.A.; Dexter, J.E.; Woods, S.M. Effect of Environment and Genotype on Durum Wheat Gluten Strength and Pasta Viscoelasticity. Cereal Chem. J. 1999, 76, 582–586. [Google Scholar] [CrossRef]
  11. Katina, K.; Heiniö, R.-L.; Autio, K.; Poutanen, K. Optimization of sourdough process for improved sensory profile and texture of wheat bread. LWT Food Sci. Technol. 2006, 39, 1189–1202. [Google Scholar] [CrossRef]
  12. Khilberg, I.; Johansson, L.; Kohler, A.; Risvik, E. Sensory qualities of whole wheat pan bread—Influence of farming system, milling and baking technique. J. Cereal Sci. 2004, 39, 67–84. [Google Scholar] [CrossRef]
  13. Rémésy, C.; Leenhardt, F.; Fardet, A. Donner un nouvel avenir au pain dans le cadre d’une alimentation durable et préventive. Cah. De Nutr. Et De Diététique 2015, 50, 39–46. [Google Scholar] [CrossRef]
  14. van Bueren, E.T.L.; Jones, S.S.; Tamm, L.; Murphy, K.M.; Myers, J.R.; Leifert, C.; Messmer, M.M. The need to breed crop varieties suitable for organic farming, using wheat, tomato and broccoli as examples: A review. NJAS Wagening. J. Life Sci. 2011, 58, 193–205. [Google Scholar] [CrossRef]
  15. de Vallavieille-Pope, C.; Belhai Fraj, M.; Mille, B.; Meynard, J.M. Les associations de variétés: Accroître la biodiversité pour mieux maîtriser les maladies. Les Doss. De L’environnement De L’inra 2006, 30, 101–109. [Google Scholar]
  16. Di Silvestro, R.; Marotti, I.; Bosi, S.; Bregola, V.; Carretero, A.S.; Sedej, I.; Mandic, A.; Sakac, M.; Benedettelli, S.; Dinelli, G. Health-promoting phytochemicals of Italian common wheat varieties grown under low-input agricultural management: Bioactive compounds of different common wheat varieties. J. Sci. Food Agric. 2012, 92, 2800–2810. [Google Scholar] [CrossRef] [PubMed]
  17. Call, L.; Kapeller, M.; Grausgruber, H.; Reiter, E.; Schoenlechner, R.; D’Amico, S. Effects of species and breeding on wheat protein composition. J. Cereal Sci. 2020, 93, 102974. [Google Scholar] [CrossRef]
  18. Roussel, V.; Leisova, L.; Exbrayat, F.; Stehno, Z.; Balfourier, F. SSR allelic diversity changes in 480 European bread wheat varieties released from 1840 to 2000. Theor. Appl. Genet. 2005, 111, 162–170. [Google Scholar] [CrossRef] [Green Version]
  19. Bencze, S.; Makádi, M.; Aranyos, T.J.; Földi, M.; Hertelendy, P.; Mikó, P.; Bosi, S.; Negri, L.; Drexler, D. Re-Introduction of Ancient Wheat Cultivars into Organic Agriculture—Emmer and Einkorn Cultivation Experiences under Marginal Conditions. Sustainability 2020, 12, 1584. [Google Scholar] [CrossRef] [Green Version]
  20. Murphy, K.M.; Reeves, P.G.; Jones, S.S. Relationship between yield and mineral nutrient concentrations in historical and modern spring wheat cultivars. Euphytica 2008, 163, 381–390. [Google Scholar] [CrossRef]
  21. Fan, M.-S.; Zhao, F.-J.; Fairweather-Tait, S.J.; Poulton, P.R.; Dunham, S.J.; McGrath, S.P. Evidence of decreasing mineral density in wheat grain over the last 160 years. J. Trace Elem. Med. Biol. 2008, 22, 315–324. [Google Scholar] [CrossRef] [PubMed]
  22. Chable, V.; Dawson, J.; Bocci, R.; Goldringer, I. Seeds for Organic Agriculture: Development of Participatory Plant Breeding and Farmers’ Networks in France. In Organic Farming, Prototype for Sustainable Agricultures; Bellon, S., Penvern, S., Eds.; Springer: Dordrecht, The Netherlands, 2014; pp. 383–400. [Google Scholar]
  23. van Frank, G.; Rivière, P.; Pin, S.; Baltassat, R.; Berthellot, J.F.; Caizergues, F.; Dalmasso, C.; Gascuel, J.S.; Hyacinthe, A.; Mercier, F.; et al. Genetic Diversity and Stability of Performance of Wheat Population Varieties Developed by Participatory Breeding. Sustainability 2020, 12, 384. [Google Scholar] [CrossRef] [Green Version]
  24. Cooper, R. Re-discovering ancient wheat varieties as functional foods. J. Tradit. Complement. Med. 2015, 5, 138–143. [Google Scholar] [CrossRef] [Green Version]
  25. Kohajdova, Z.; Karovicova, J. Nutritional value and baking applications of spelt wheat. Acta Sci. Pol. Technol. Aliment. 2008, 7, 5–14. [Google Scholar]
  26. Abdel-Aal, E.S.M.; Young, J.C.; Rabalski, I.; Hucl, P.; Fregeau-Reid, J. Identification and Quantification of Seed Carotenoids in Selected Wheat Species. J. Agric. Food Chem. 2007, 55, 787–794. [Google Scholar] [CrossRef] [PubMed]
  27. Smith, E.; Benbrook, C.; Davis, D.R. With the Grain, a Closer Look at the Nutrient Quality of Grain, Grained-Based Products, and the Role of Organic Agriculture; The Organic Center: Washington, DC, USA, 2012. [Google Scholar]
  28. Hammes, W.P.; Brandt, M.J.; Francis, K.L.; Rosenheim, J.; Seitter, M.F.H.; Vogelmann, S.A. Microbial ecology of cereal fermentations. Trends Food Sci. Technol. 2005, 16, 4–11. [Google Scholar] [CrossRef]
  29. Schnürer, J.; Magnusson, J. Antifungal lactic acid bacteria as biopreservatives. Trends Food Sci. Technol. 2005, 16, 70–78. [Google Scholar] [CrossRef]
  30. Chavan, R.S.; Chavan, S.R. Sourdough Technology—A Traditional Way for Wholesome Foods: A Review. Compr. Rev. Food Sci. Food Saf. 2011, 10, 169–182. [Google Scholar] [CrossRef]
  31. Sacchi, G.; Cei, L.; Stefani, G.; Lombardi, G.V.; Rocchi, B.; Belletti, G.; Padel, S.; Sellars, A.; Gagliardi, E.; Nocella, G.; et al. A Multi-Actor Literature Review on Alternative and Sustainable Food Systems for the Promotion of Cereal Biodiversity. Agriculture 2018, 8, 173. [Google Scholar] [CrossRef] [Green Version]
  32. Moreira, P.M.R.M.; Pêgo, S.E.; Vaz Patto, C.; Hallauer, A.R. Comparison of selection methods on ‘Pigarro’, a Portuguese improved maize population with fasciation expression. Euphytica 2008, 163, 481–499. [Google Scholar] [CrossRef]
  33. Wolfe, M.S.; Baresel, J.P.; Desclaux, D.; Goldringer, I.; Hoad, S.; Kovacs, G.; Löschenberger, F.; Miedaner, T.; Østergård, H.; van Bueren, E.T.L. Developments in breeding cereals for organic agriculture. Euphytica 2008, 163, 323–346. [Google Scholar] [CrossRef] [Green Version]
  34. Murphy, K.; Lammer, D.; Lyon, S.; Carter, B.; Jones, S.S. Breeding for organic and low-input farming systems: An evolutionary–participatory breeding method for inbred cereal grains. Renew. Agric. Food Syst. 2005, 20, 48–55. [Google Scholar] [CrossRef]
  35. Goldringer, I.; van Frank, G.; d’Yvoire, C.B.; Forst, E.; Galic, N.; Garnault, M.; Locqueville, J.; Pin, S.; Bailly, J.; Baltassat, R.; et al. Agronomic Evaluation of Bread Wheat Varieties from Participatory Breeding: A Combination of Performance and Robustness. Sustainability 2019, 12, 128. [Google Scholar] [CrossRef] [Green Version]
  36. Kucek, L.K.; Dyck, E.; Russell, J.; Clark, L.; Hamelman, J.; Burns-Leader, S.; Senders, S.; Jones, J.; Benscher, D.; Davis, M.; et al. Evaluation of wheat and emmer varieties for artisanal baking, pasta making, and sensory quality. J. Cereal Sci. 2017, 74, 19–27. [Google Scholar] [CrossRef] [Green Version]
  37. Rivière, P.; Pin, S.; Galic, N.; De Oliviera, Y.; Davis, O.; Dawson, J.; Wanner, A.; Heckmann, R.; Obbeliane, S.; Ronnot, B.; et al. Mise en place d’une méthodologie de sélection participative sur le blé en France. Innov. Agron. 2013, 32, 427–441. [Google Scholar]
  38. Pagès, J. Recueil direct de distances sensorielles: Application à l’évaluation de dix vins blancs du Val-de-Loire. Sci. Aliment. 2003, 23, 679–688. [Google Scholar] [CrossRef]
  39. Ares, G.; Bruzzone, F.; Giménez, A. Is a consumer panel able to reliably evaluate the texture of dairy desserts using unstructured intensity scales? Evaluation of global and individual performance: Is a consumer panel reiable? J. Sens. Stud. 2011, 26, 363–370. [Google Scholar] [CrossRef]
  40. Risvik, E.; McEwan, J.A.; Colwill, J.S.; Rogers, R.; Lyon, D.H. Projective mapping: A tool for sensory analysis and consumer research. Food Qual. Prefer. 1994, 5, 263–269. [Google Scholar] [CrossRef]
  41. Kennedy, J. Evaluation of Replicated Projective Mapping of Granola Bars: Replicated Projective Mapping. J. Sens. Stud. 2010, 25, 672–684. [Google Scholar] [CrossRef]
  42. Lê, S.; Josse, J.; Husson, F. FactomineR: An R Package for Multivariate Analysis. J. Stat. Softw. 2008, 25, 1–18. [Google Scholar] [CrossRef] [Green Version]
  43. Pagès, J. Collection and analysis of perceived product inter-distances using multiple factor analysis: Application to the study of 10 white wines from the Loire Valley. Food Qual. Prefer. 2005, 16, 642–649. [Google Scholar] [CrossRef]
  44. Lê, S.; Lê, T.M.; Cadoret, M. Napping and sorted Napping as a sensory profiling technique. In Rapid Sensory Profiling Techniques; Woodhead Publishing: Sawston, UK, 2015; pp. 197–213. [Google Scholar]
  45. Vindras-Fouillet, C.; Ranke, O.; Anglade, J.P.; Taupier-Letage, B.; Chable, V.; Goldringer, I. Sensory Analyses and Nutritional Qualities of Hand-Made Breads with Organic Grown Wheat Bread Populations. Food Nutr. Sci. 2014, 5, 1860–1874. [Google Scholar] [CrossRef] [Green Version]
  46. Ortiz-Monasterio, J.I.; Palacios-Rojas, N.; Meng, E.; Pixley, K.; Trethowan, R.; Peña, R.J. Enhancing the mineral and vitamin content of wheat and maize through plant breeding. J. Cereal Sci. 2007, 46, 293–307. [Google Scholar] [CrossRef]
  47. Moreira-Ascarrunz, S.; Larsson, H.; Prieto-Linde, M.; Johansson, E. Mineral Nutritional Yield and Nutrient Density of Locally Adapted Wheat Genotypes under Organic Production. Foods 2016, 5, 89. [Google Scholar] [CrossRef] [PubMed] [Green Version]
  48. Michel, E.; Monfort, C.; Deffrasnes, M.; Guezenec, S.; Lhomme, E.; Barret, M.; Sicard, D.; Dousset, X.; Onno, B. Characterization of relative abundance of lactic acid bacteria species in French organic sourdough by cultural, qPCR and MiSeq high-throughput sequencing methods. Int. J. Food Microbiol. 2016, 239, 35–43. [Google Scholar] [CrossRef] [PubMed] [Green Version]
Figure 1. Graphical scheme of study approach.
Agronomy 11 02117 g001
Figure 2. Napping test on 11 bread wheats at the ‘Let’s Liberate Diversity’ at Meix devant Virton, Belgium, June 2017.
Agronomy 11 02117 g002
Figure 3. Results of the PCA on technological variables: (a) graph of individual and (b) correlation circle.
Agronomy 11 02117 g003
Figure 4. Content in (a) Se (µk/kg), (b) ferulic acid (mg/kg), (c) Mg (mg/100 g) and (d) Cu (mg/100 g) for 11 wheat varieties grown in two environments (JFB and RAB).
Agronomy 11 02117 g004
Figure 5. Results of the PCA on eight nutritional variables for the 21 wheat varieties*farm: (a) individual graph and (b) correlation circle.
Agronomy 11 02117 g005
Figure 6. Common representation of the 11 breads perceived by 32 tasters, results of the MFA on the 32-coordinate issued from napping test dimension 1 and 2: (a) individual graph and (b) correlation circle. Words quoted more than four times were maintained in the dataset.
Agronomy 11 02117 g006
Figure 7. Results of the MFA on the nutritional, agronomic and technologic variables as group: (a) individual graph, (b) correlation circle.
Agronomy 11 02117 g007
Table 1. Description of the origin and development process of the participatory plant-breeding (PPB) populations and commercial varieties studied.
Variety NameOrigin (Farmer, Location)Development Process
Saint-Priest FLM, Maine-et-LoireDerived from a Swedish variety registered in 1942 (Progress)
Rouge du Roc JFB, Lot-et-GaronnePopulation derives from a mass selection within a landrace
Pop Dynamique 2FLM, Maine-et-LoireMixture of 3 landraces and 2 recent varieties
Mélange du Sud-OuestJFB, Lot-et-GaronneMixture of about 18 landraces
SavoysoneRAB, Haute-SavoiePopulation derived from a cross between two landraces
RocaloexRAB, Haute-SavoieMixture of 11 crosses
Mélanges1 13 PopsBER, Côte d’OrMixture of 13 populations derived from crosses
DauphiboisCHD, IsèreMixtures of 26 landraces and crosses
JaphabelleJFB, Lot-et-GaronneMixture of around 25 populations derived from crosses and selected on farm
RenanINRAEPure-line commercial variety, registered in 1989
HendrixINRAEPure-line commercial variety for organic agriculture, registered in 2013
Table 2. Mean values and ANOVA Significance for lutein, selenium (Se), copper (Cu), ferulic acid, calcium (Ca), magnesium (Mg), potassium (K), zinc (Zn) and fibers. Signifiance codes: 0 ‘***’ 0.001 ‘**’ 0.01 ‘*’ 0.05 ‘.’ 0.1 ‘ ’ 1 ‘a,b,c’ letter indicates significant differences between samples.
LuteinSeCuFerulic AcidCaMgKZnFibers
JFB1.1 *69.7.0.25 *716.78.44.11 **124.15443.74 ***3.872.25
RAB1.39 *16.9.0.47 *614.1.38.15 **127.61382.55 ***4.152.17
Dauphibois1.251660.5572040.75126.55 *(ab)413.953.8 **(ab)1.65
Japhabelle1.3500.5645.542.5131.35 *(ab)410.94.2 **(bc)2.65
Mélange13pops1.2525.50.25597.538.8124.6 *(ab)411.553.8 **(ab)2.8
MélangeSO1.3533.50.25633.540.35134.75 *(b)436.054.4 **(bc)2.6
PopDyn21.25790.25805.537.85129.7 *(ab)389.74.3 **(bc)2
Rocaloex1.2500.563243.45125.5 *(ab)404.14 **(ac)1.85
Savoysone1.3500.55767.548.9127.55 *(ab)450.654 **(ac)2.25
StPriest0.600.557535.485135.9 *(b)365.35.1 **(c)2
Hendrix1.45102.5065142.15105.1 *(a)416.752.9 **(a)2.4
Renan1.3526.50.25628.541.05117.8 *(ab)432.53.7 **(ab)1.9
Publisher’s Note: MDPI stays neutral with regard to jurisdictional claims in published maps and institutional affiliations.

