Article

Physicochemical Changes in Loam Soils Amended with Bamboo Biochar and Their Influence in Tomato Production Yield

by
Karolina Villagra-Mendoza
1,*,
Federico Masís-Meléndez
2,3,
Jaime Quesada-Kimsey
2,3,
Carlos A. García-González
4 and
Rainer Horn
5
1
School of Agricultural Engineering, Instituto Tecnológico de Costa Rica, Cartago 159-7050, Costa Rica
2
School of Chemistry, Instituto Tecnológico de Costa Rica, Cartago 159-7050, Costa Rica
3
Centro de Investigación y de Servicios Químicos y Microbiológicos (CEQIATEC), Instituto Tecnológico de Costa Rica, Cartago 159-7050, Costa Rica
4
Departamento de Farmacología, Farmacia y Tecnología Farmacéutica, I+D Farma Group (GI-1645), Facultad de Farmacia and Health Research, Institute of Santiago de Compostela (IDIS), Universidad de Santiago de Compostela, E-15782 Santiago de Compostela, Spain
5
Institute for Plant Nutrition and Soil Science, Christian-Albrechts University Kiel, Hermann Rodewaldstr. 2, 24118 Kiel, Germany
*
Author to whom correspondence should be addressed.
Agronomy 2021, 11(10), 2052; https://doi.org/10.3390/agronomy11102052
Submission received: 7 August 2021 / Revised: 6 October 2021 / Accepted: 7 October 2021 / Published: 13 October 2021

Abstract

:
Soil degradation and water stress in Costa Rica challenge the production of highly sensitive crops. This work is aimed at evaluating the physical and chemical changes in sandy loam (SL) and a silt loam (SiL) soil when amended with bamboo biochar while estimating the enhancement of tomato productivity. Biochar, obtained from Guadua Angustifolia bamboo feedstock, was mixed into sieved bulk soil substrate from the topsoil, from Andosol and Umbrisol groups, at application rates of 1, 2.5, and 5% (dry mass). Physicochemical and morphological properties of biochar such as pH, hydrophobicity, scanning electron microscopy images, helium picnometry, specific surface area by the Brunauer–Emmett–Teller (BET) method, CHNS, and ash content were determined. Soil hydrophobicity, acidity, electrical conductivity, cation exchange capacity and water retention, available water content, and air capacity were analyzed for the amended soils. Tomato yield was quantified after a harvest period of two months. The admixture of biochar did not significantly increase soil cation exchange capacity but increased water retention in the range of available water content. Class A (>200 g) tomato yield increased 350% in the SL and 151% in the SiL. Class B (100–200 g) tomato yields increased 27% in the SL but decreased about 30% in the SiL. Tomato yield response seems attributable to variation of water retention capacity, available water content, and air capacity. These results support the use of adapted water management strategies for tomato production based on soil physical changes of biochar.

1. Introduction

Mankind is facing the challenge of feeding an increasing population by producing more food with optimal use of natural resources. The preservation of the quality of soils used for agricultural production is fundamental for this purpose, but climate change, water scarcity, and soil degradation have emerged as limiting factors for crop productivity [1]. Soil degradation in agricultural land is highly related to the depletion of its physical, chemical, and hydrological properties.
Tomato is one of the crops with the highest greenhouse production in Costa Rica. It is cultivated throughout the year; often in soils of the group Andosols [2] of volcanic origin, with textures ranging from sandy loam to silt loam. High soil degradation affects many cultivated areas worldwide [3] and changes in the water regime, especially due to longer drought periods [4], have caused this crop to be under great production stress. Biochar has shown to favor tomato crop performance with an increased yield production and weight under controlled deficit irrigation [5,6,7,8]. Particularly, bamboo biochar pyrolyzed at 300 °C has had a significant positive effect on tomato quality and plant growth [9]. So far, studies like these have associated observed changes in fruit quality, yield to plant, and nutrient dynamics responses, but without investigating deeply the underlying soil physical mechanisms [5,6,7,8].
In general, biochar is associated with reduced salinity [10], raising cation exchange capacity (CEC), [11,12] and changing nutrient availability in soils [3,11,13]. It also changes soil pore size distribution, soil water retention [6,14,15,16,17], water and gas transport [18,19], colloid and phosphorus leaching [20], and bulk density [3,5]. However, the varying effects of biochar addition to the crop yield are highly related to the climate region [21,22,23], feedstock source, production technology [9,14,24], soil type and its actual fertility [25,26], as well as biochar application rate [5,14], and type of crop [27]. The effect of biochar in crop productivity has been positive in nutrient-poor and degraded soils [14,21], and some of the greatest benefits have been observed in acidic soils in the tropics [5,23]. Nevertheless, there is still a knowledge gap regarding the mechanisms that quantitatively relate the effects of biochar amendments in soils to tomato production.
This study aims to provide insights into the physical and chemical mechanisms by which biochar amendments impact the yield of tomato fruits in degraded tropical soils. The main contributions of this work are: (1) it provides quantitative information on the interaction between air capacity and water holding capacity in tomato crops growing on tropical volcanic soils, and (2) it correlates biochar application rates to soil quality indexes and tomato fruit yield.

2. Materials and Methods

The research was conducted in a greenhouse from September 2018 to February 2019 at the School of Agricultural Engineering at the Costa Rican Institute of Technology (ITCR) in Cartago, Costa Rica (9°51′26.09″ N, 83°54′44.33″ W). The study area was located 1470 m above sea level, with a humid tropical climate. During the year, temperature oscillates between 16 and 25 °C. The average annual precipitation is 1561 mm and the average temperature inside the greenhouse was 20 °C, with maximum recording temperatures of 30 °C during the sunny hours of the day and minimum temperatures of 12 °C at night.

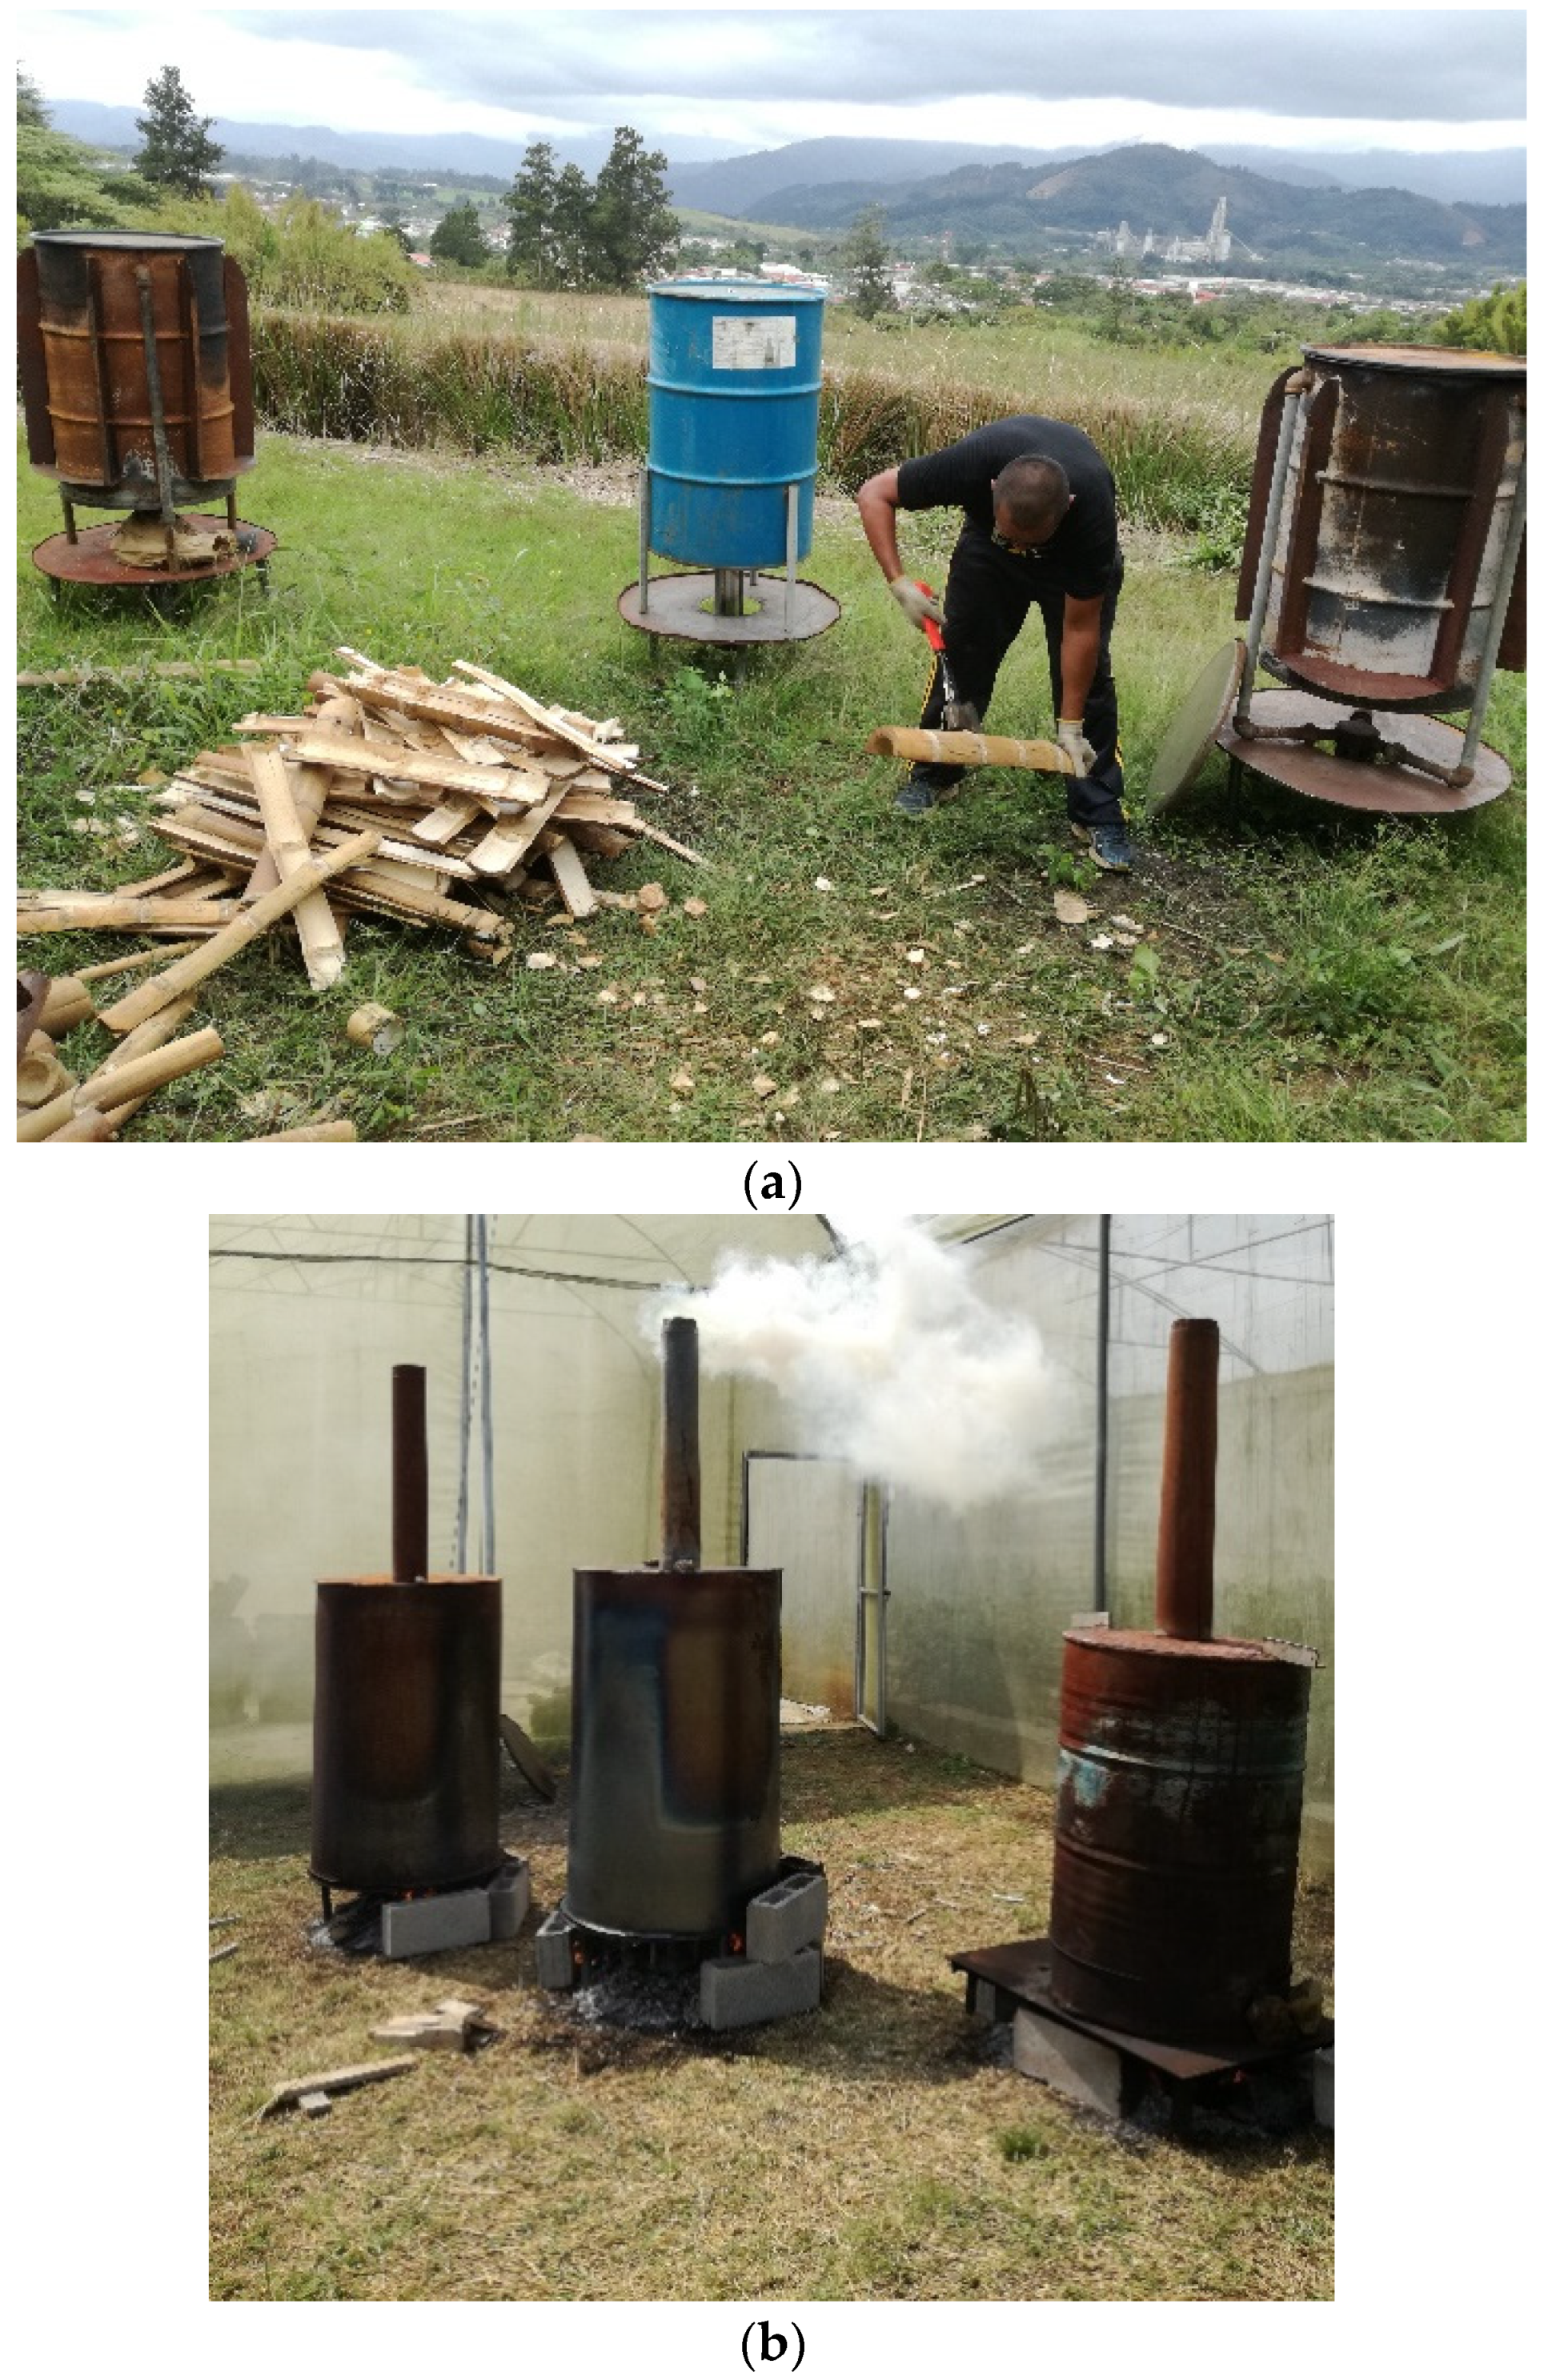
2.1. Soil and Biochar Production

Two soil materials were collected from the topsoil (0–30 cm) in localities of the Central Valley in Costa Rica. We used soils from the groups Umbrisol and Andosol [2] with silt loam (SiL) and sandy loam (SL) textures, respectively. They were air dried, passed through a 2-mm sieve, and thoroughly mixed, to achieve homogeneity.
Biochar was obtained from bamboo stems (culms) of Guadua Angustifolia Kunth. The bamboo was collected from a plantation on the north-western side of Lake Arenal, Costa Rica. The bamboo culms were split by half (Figure 1a) and air-dried in a greenhouse for over 30 days. The bamboo was pyrolyzed in absence of air, in sealed metallic kilns, utilizing the pyrolytic gases as fuel (Figure 1b) by conducting them via steel piping to a burner beneath the biomass compartment. These kilns were developed at the Costa Rica Institute of Technology (ITCR), and are described by Pérez Martínez [28]. The yield of biochar was generally 28% to 35%, relative to weight of air-dried material; if the weight of the firewood is considered, the yield was about 18% to 25%. The temperature inside the pyrolysis chamber of the kilns was measured using K-type thermocouples. During pyrolysis, the system reached temperatures over 400 °C and remained constant for 15 to 30 min, after which the kilns and their contents were left to cool for at least 3 h before opening. The cool biochar was stored in airtight containers for several weeks to prevent spontaneous ignition, and later crushed and passed through a 3.5-mm sieve.

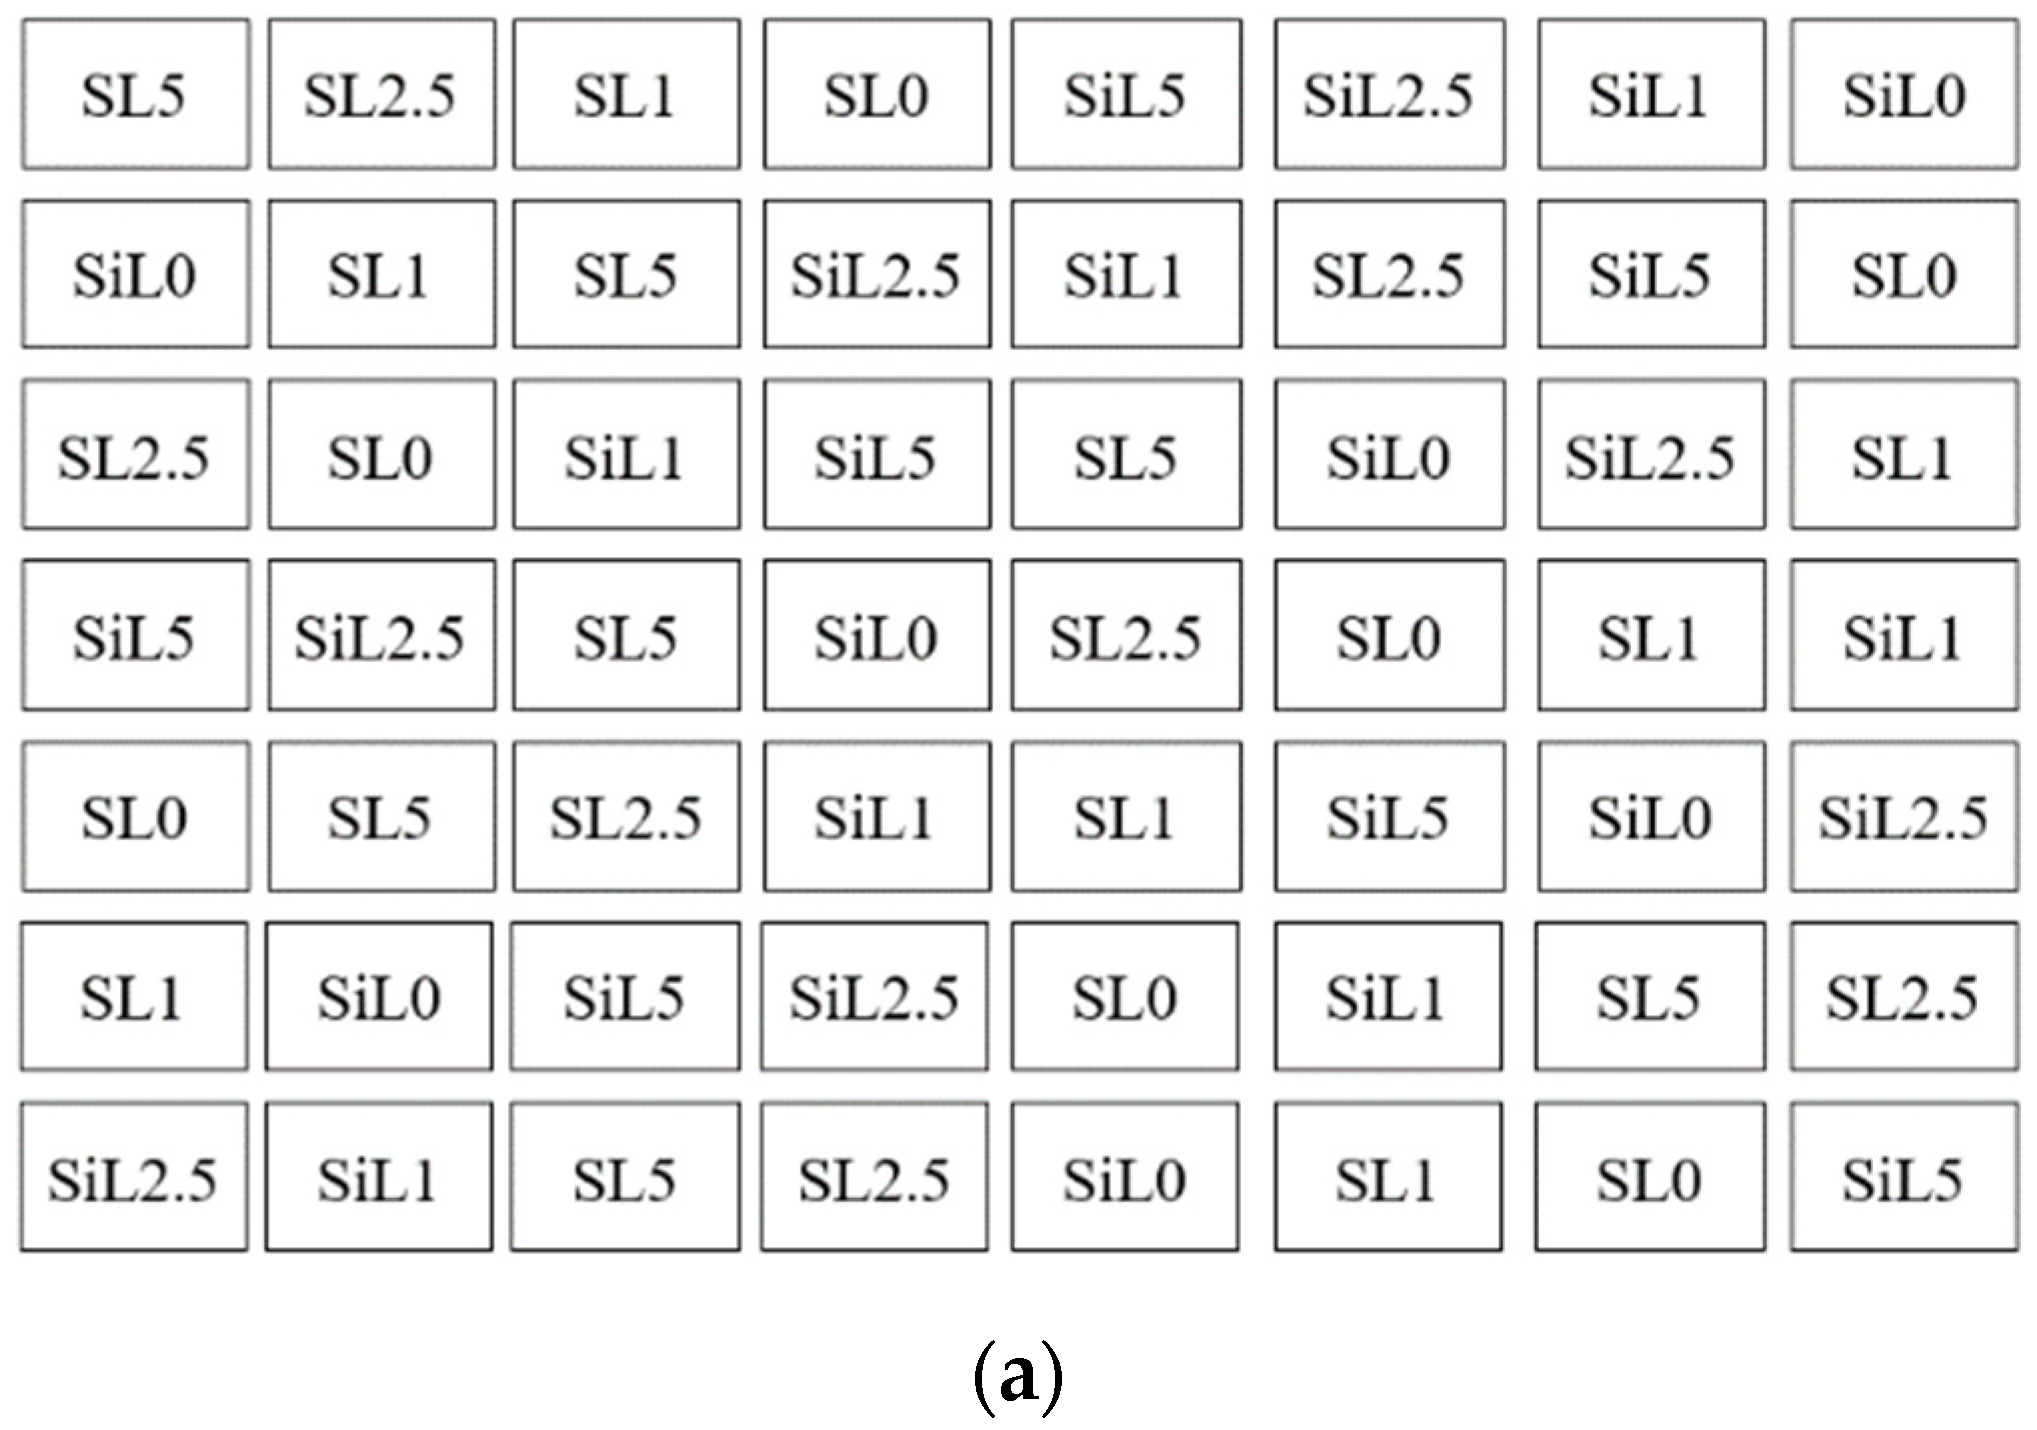
2.2. Soil-Biochar Mixture Preparation

Soil-biochar mixtures were prepared by adding biochar at three application rates of 1, 2.5, and 5% (mass percent) to the two dry sieved soil materials, corresponding to equivalents of 10, 26, and 52 ton/ha, respectively, based on assumptions and application rates similar to those made in other studies [5,27,29,30]. Application rates were calculated considering a depth of 15 cm. These mixing rates were chosen to obtain significant results at the lowest possible cost for a farm; higher biochar contents tend to be dismissed by farmers as too costly. The treatments were set as: SL0 (control-unamended sandy loam), SL1 (sandy loam + 1% biochar), SL2.5 (sandy loam + 2.5% biochar), SL5 (sandy loam + 5% biochar), SiL0 (control-unamended silt loam), SiL1 (silt loam + 1% biochar), SiL2.5 (silt loam + 2.5% biochar), and SiL5 (silt loam + 5% biochar).
Each treatment combination was replicated seven times, packed in truncated cone pots with 27.6 cm diameter at the bottom, 32.0 cm diameter at the top, with 15 cm height, and allocated in a completely random design in a greenhouse as shown in Figure 2. Each pot was filled with 8.4 kg of an air-dried soil mixture and packed to an initial soil density of 0.7 g/cm3. All pots were watered by drip irrigation for one week; then, one tomato seedling of the variety Mountain Fresh Plus was transplanted in each pot.
Initially, the sandy loam (SL) was acidic (pH 4.3). To avoid the interference of this factor on tomato productivity, liming was performed by using quick lime (CaO) to level the pH to 5.0. SL was showing 6.6 cmol(+)/L acidity, from which 3.1 cmol(+)/L corresponded to exchangeable aluminum. After pH correction of SL with quick lime (CaO 105.5% calcium carbonate equivalent), the acidity was 0.74 cmol(+)/L, which is marginally above 0.5 cmol(+)/L, the threshold value where aluminum toxicity effects in plants are negligible [31]. Contrarily, SiL was not corrected with CaO, since the exchangeable aluminum was <0.16 cmol(+)/L, and the acidity reported was between 0.13 to 0.16 cmol(+)/L.
The same nutrient schedule was applied to all pots during a period of 16 weeks. Based on the tomato absorption curve and 56 plants, we applied two water soluble compound fertilizers NPK 12:42:12 and 10:5:25 with total doses of 0.08 and 7.88 kg, respectively. Furthermore, we added water soluble magnesium sulfate, potassium sulfate, and calcium nitrate with total doses of 2.70, 1.48, and 6.13 kg, respectively. Fertilizer doses were adjusted every 4 weeks depending on the plant requirements (Table 1).
Equal drip irrigation (2 L/h) was applied to all treatments three times a week. On irrigation days, each pot was watered for 10 min at 6 am, 3 pm, and 10 pm, in order to minimize evaporation and filtration losses.

2.3. Physicochemical Analysis of the Materials

Soil texture was determined using a modified Bouyoucos hydrometer method, by a combined sieve (>0.063 mm) [32] and the automated particle size analyzer (PARIO) from METER Group (Pullman, WA, USA) [33]. Soil organic matter was removed previous to texture analysis [34]. Soil classification was based on the FAO guidelines [2]. Particle size distribution of the bamboo biochar was determined from a representative sample of 55 g by wet sieve analysis using 4, 2, 1, 0.500, 0.250, 0.125, and 0.063 mm mesh size. The pH was measured in water using a 1:2 ratio (soil: water). Cation exchange capacity (CEC) was determined by the unbuffered salt extraction method [35]. Effective cation exchange capacity (ECEC) was assessed by the sum of bases, (SB = Ca2+ + Mg2+ + K+) and acidity using ammonium acetate pH 7.0 [35]. Sodium (Na+) analysis was not included in the ECEC, since it is negligible in Costa Rican soils due to high precipitation rates. Electrical conductivity (EC) was measured with a water conductivity meter (Hanna Instruments HI98312, Smithfield, RI, USA) by adding 50 mL of deionized water to 10 g of soil sample, followed by thorough agitation for 5 min and rest for 30 min. Then, the mixture was filtered, and EC was measured in the extracted solution. Acidity was determined as the subtraction of ECEC—SB. Acid saturation percentage (AS%) was determined from the ratio of acidity to ECEC. Soil organic matter was quantified with the Dumas dry combustion method [36].
Elemental analysis of C, N, H, and S was carried out in biochar with a Vario MACRO cube analyzer, Elementar Americas Inc (Langenselbold, Germany). Oxygen content was determined by the mass balance of the previous elements, including ash content. Highly volatile, medium volatile matter, combustible material, and ash content of the biochar were determined according to the ASTM E1131–08 standard, by thermogravimetric analysis (TGA) with a TA SDT Q600, TA Instruments (New Castle, DE, USA).
Biochar pore structure was characterized by the scanning electron microscopy (SEM), electron microscope, TM 3000, Hitachi Tabletop Microscope (Tokyo, Japan). Specific surface area of the biochar was analyzed by the Brunauer–Emmett–Teller (BET) method, that uses a low-temperature N2 adsorption-desorption analysis ASAP 2000 equipment, Micromeritics Inc. (Norcross, GA, USA) [37]. The skeletal density was determined by gas pycnometry using helium (Quantachrome Inc., Boynton Beach, FL, USA) at room temperature (25 °C) and 1.01 bar. Skeletal density values were obtained from five replicates and expressed as mean ± standard deviation. Biochar bulk density was determined from seven replicates, using a 100 mL container. Water repellency of the biochar was determined by the sessile drop method described by Masís-Meléndez et al. [37], and the molarity of ethanol droplet (MED) method was used for the soil and biochar mixtures.

2.4. Soil Water Holding Capacity Measurements

Core samples of ca. 30 cm3 were taken from each pot, saturated from the bottom by capillary rise for 24 h and thereafter drained to matric potentials of −0.3, −1.0, −3.0, and −6.0 kPa by the hanging water column method, while samples for −130 kPa were desiccated in a Richards pressure plate apparatus. The weight of each sample was recorded after each matric potential to obtain the gravimetric water content. After the last matric potential, samples were oven-dried at 105 °C for 16 h. Volumetric water content was determined by multiplying the gravimetric water content by the bulk density of each sample. The gravimetric water content at the matric potential of −1500 kPa was determined in duplicates of bulk soil using a soil water potential meter (WP4C) from METER Group (Pullman, WA, USA), following the ASTM D6836 standard. Water retention curves were fitted with the closed-form Equation (1) [38]:
ϑ = ϑ r + ( ϑ s ϑ r ) [ 1 + ( α ψ ) n ] m
where ϑ s and ϑ r are the saturated and residual water content (cm3/cm3), respectively; ψ is the matric potential (kPa); α is the inverse of the air-entry value (1/cm); n   and   m are independent empirical parameters.
Available water capacity (AWC) was calculated as a difference of the water content at a matric potential of −6 kPa (i.e., field capacity, FC, cm3/cm3) minus the water content at a matric potential of −1500 kPa (i.e., permanent wilting point, PWP, cm3/cm3) [39]. Air capacity (AC) was determined as the difference between the water content at saturation and the water content at a matric potential of −6 kPa. Pore size was defined as macropores (>−6 kPa) based on the cylindrical capillaries with an equivalent diameter greater than 50 µm, capillary pores comprising narrow coarse pores (−6 kPa to −30 kPa) with diameters between 50 and 10 µm, medium pores (−30 kPa to −1500 kPa) with diameters between 10 and 0.2 µm, and micropores (<−1500 kPa) with diameters <0.2 µm [40].
Hydraulic conductivity was determined with a minidisk infiltrometer model S from METER (Pullman, USA) by measuring infiltration with a suction of 1 cm H2O = 1 hPa.

2.5. Soil Water Storage and Air Capacity Indexes

To assess soil physical quality, we used the soil water storage capacity index (SWSCI) and air capacity index (ACI), proposed by [41], as shown in Equations (2) and (3):
SWSCI = FC TP
ACI = AC TP
where TP corresponded to the total porosity, equivalent to the saturated water content obtained from the fitted soil water retention curve. The study from [41] suggested that optimal soil aeration occurs when 66% of the pore space is filled with water. Thus, the soil physical quality criteria to improve root growth was set as SWSCI = 0.66 and ACI = 0.34.

2.6. Fruit Yield and Classification

During two months (from 24 December 2018 to 22 February 2019), fruits were weekly harvested to determine fresh fruit weight, the number of fruits per plant, and average fruit diameter and height. This harvesting period was considered the best production time for this variety of tomato. Fruit shape was measured with a Vernier caliper. Fruits were graded into three classes: Class A tomatoes weighing more than 200 g; Class B tomatoes weighing between 100–200 g; Class C tomatoes weighing less than 100 g. These classes approximate to the market classes used in Costa Rica for tomatoes. Yield components were reported as average fruit weight per plant per class and average number of fruits per plant per class, from the tomatoes harvested in two months.

2.7. Statistical Analysis

For all parameters, mean and standard deviation were calculated. The one-factor analysis of variance (ANOVA) with p < 0.05 was used to assess differences in soil water storage and air capacity indexes, soil chemical properties, and tomato productivity per treatment. The differences between means were assessed using the HSD Tukey′s test (p < 0.05). The Shapiro–Wilk test (p < 0.05) was used to determine the normality of the data. All the statistical analyses were performed with the freeware R version 3.6.1 using the Rcmdr package [42].

3. Results

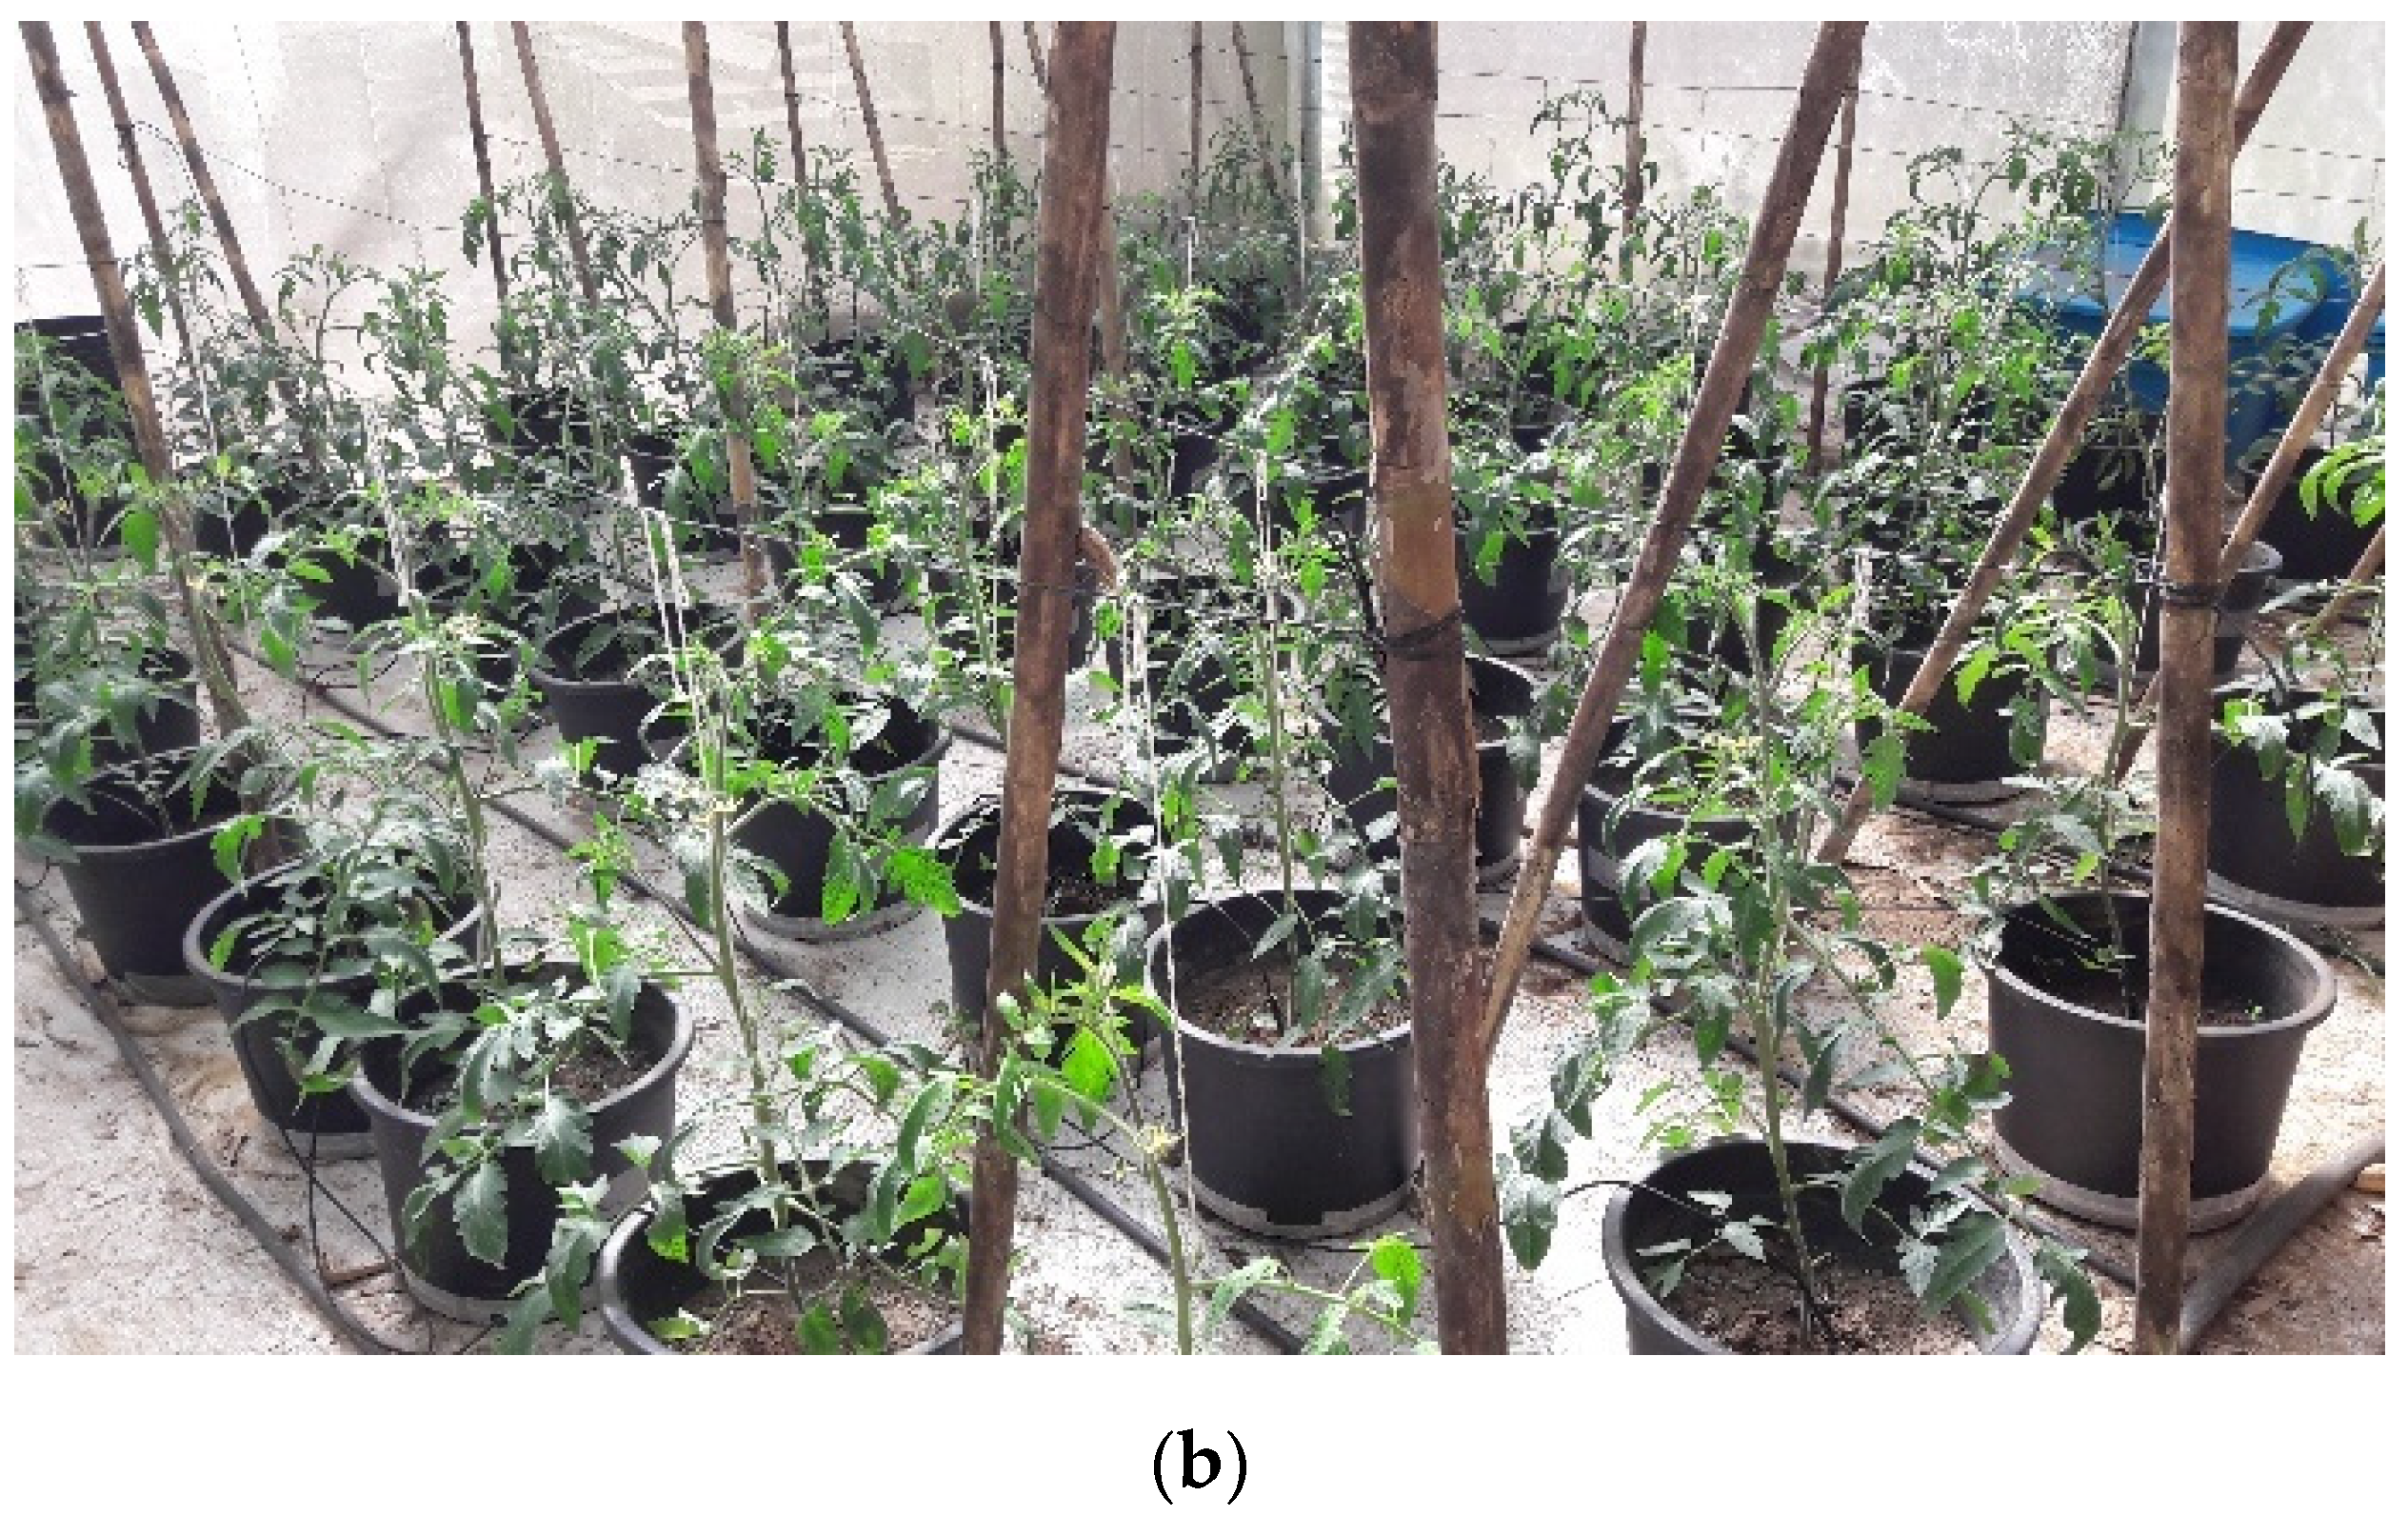
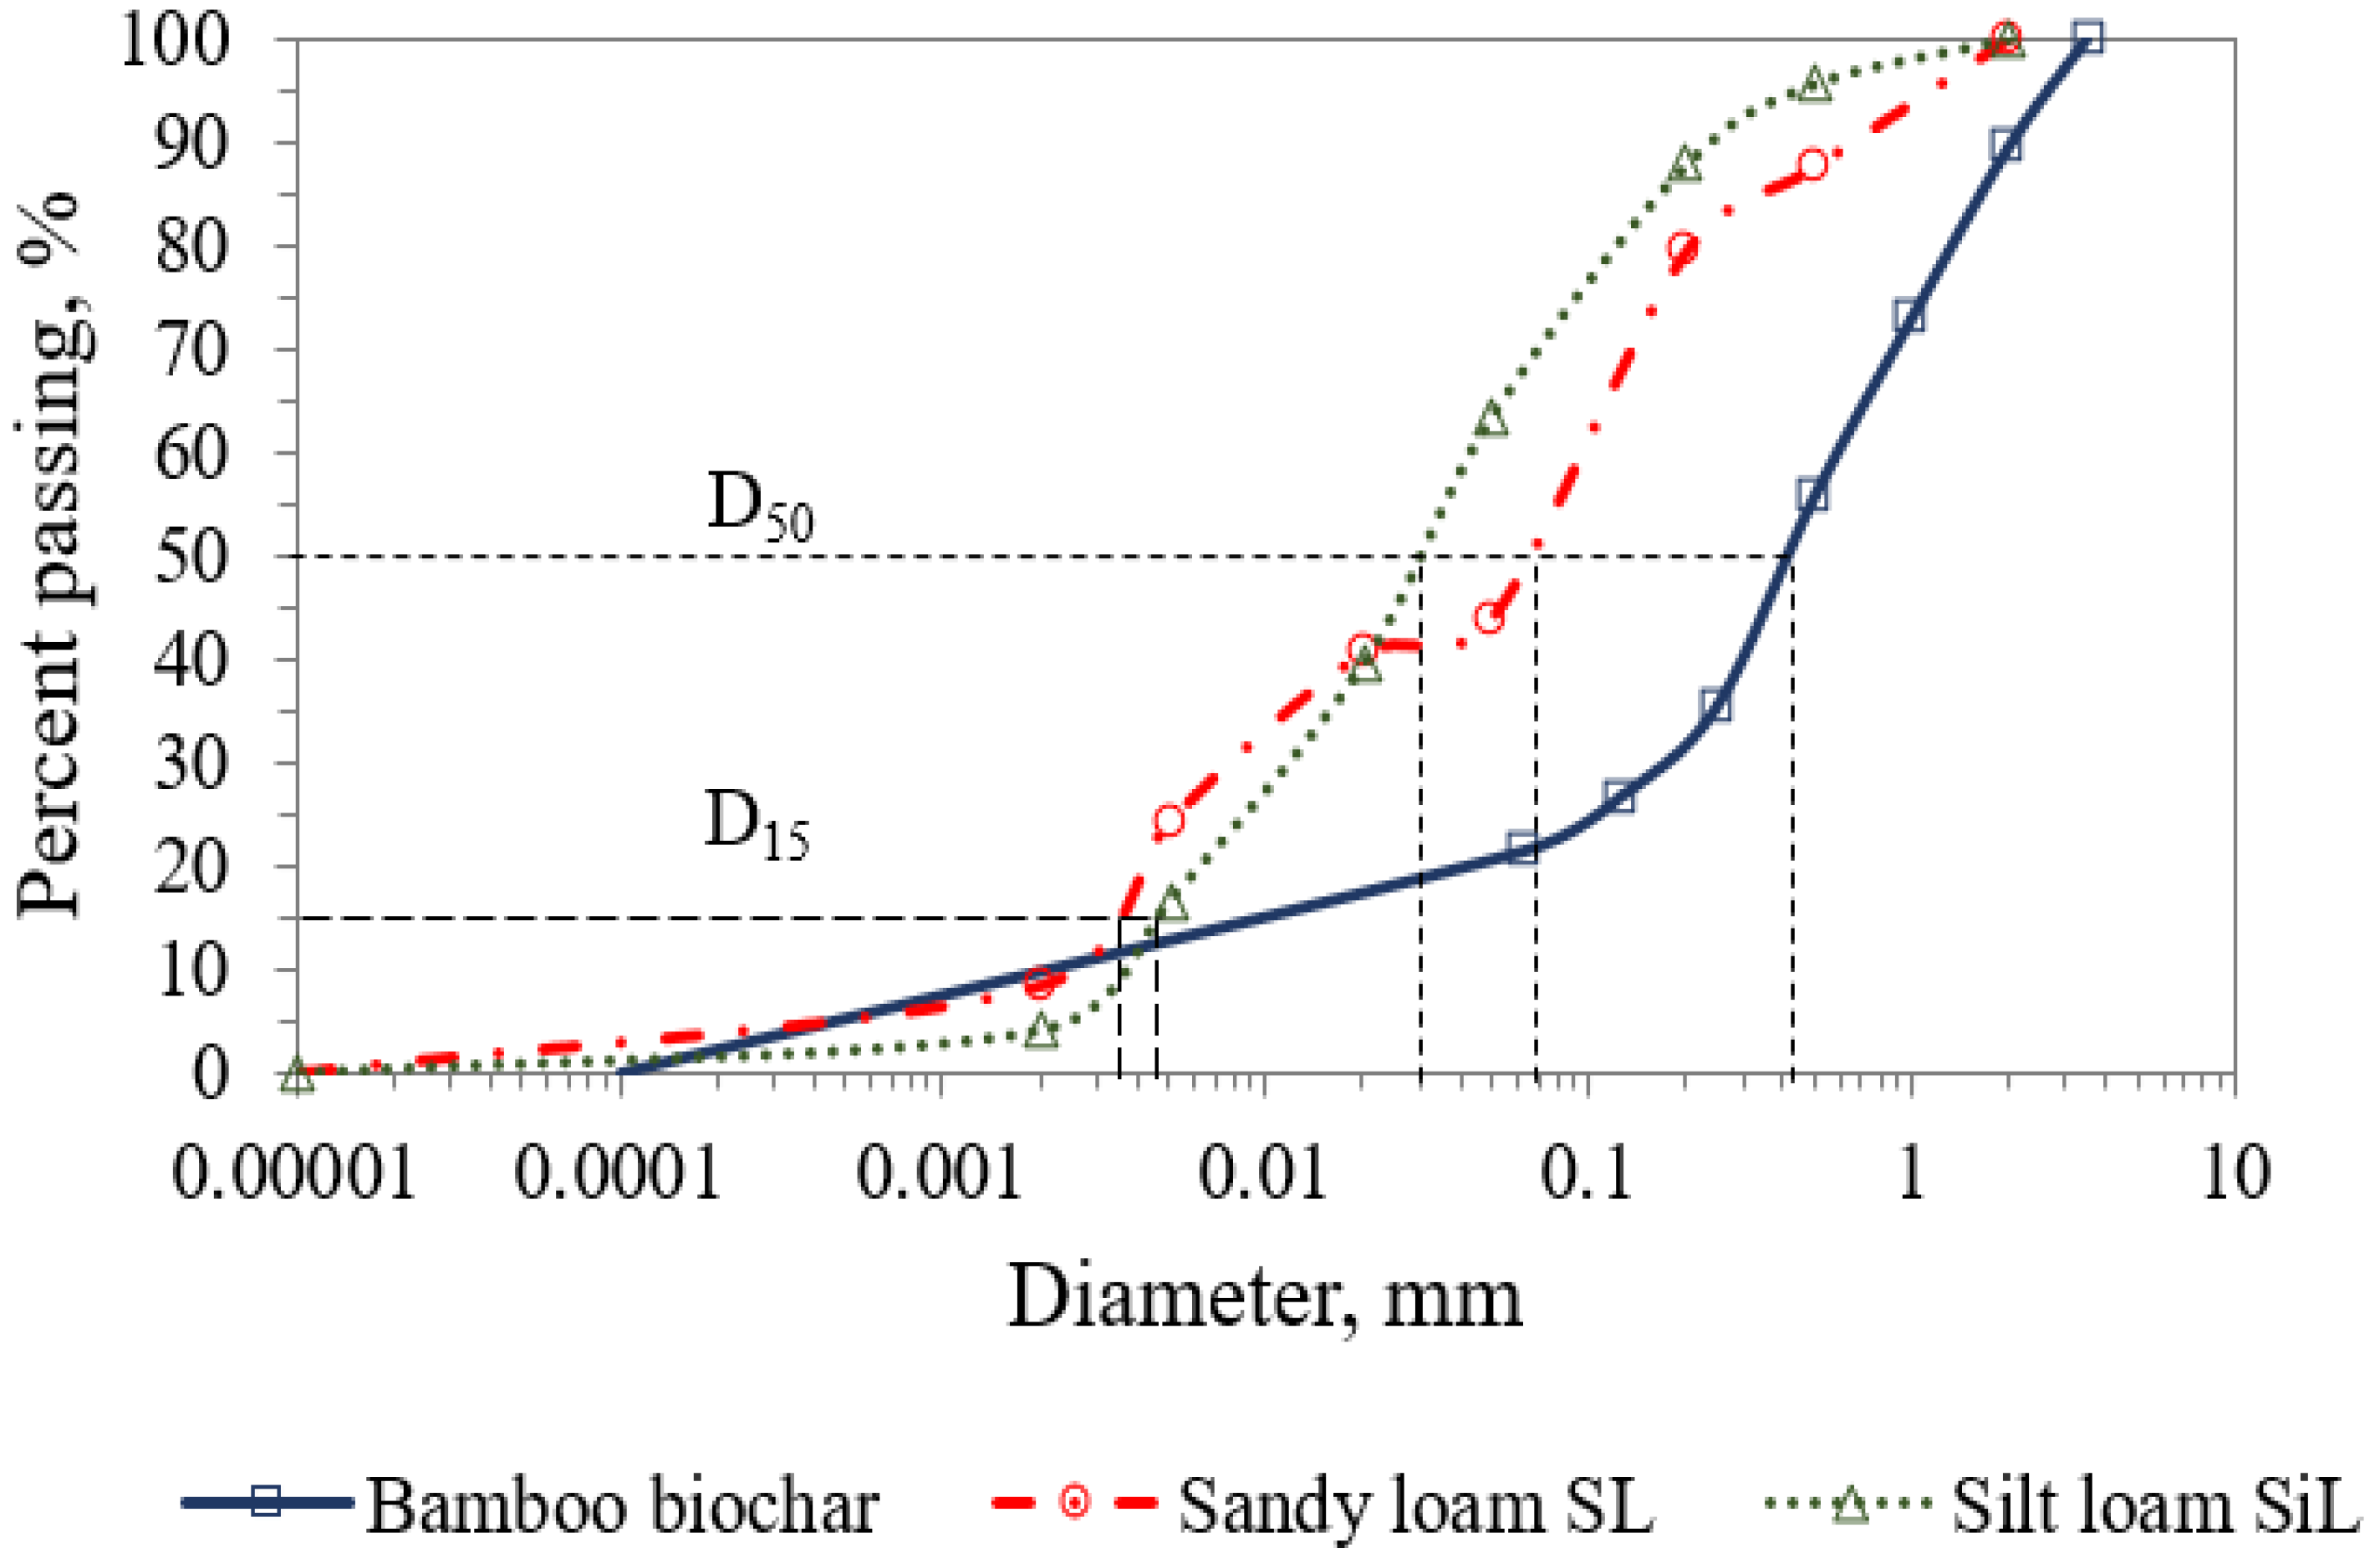
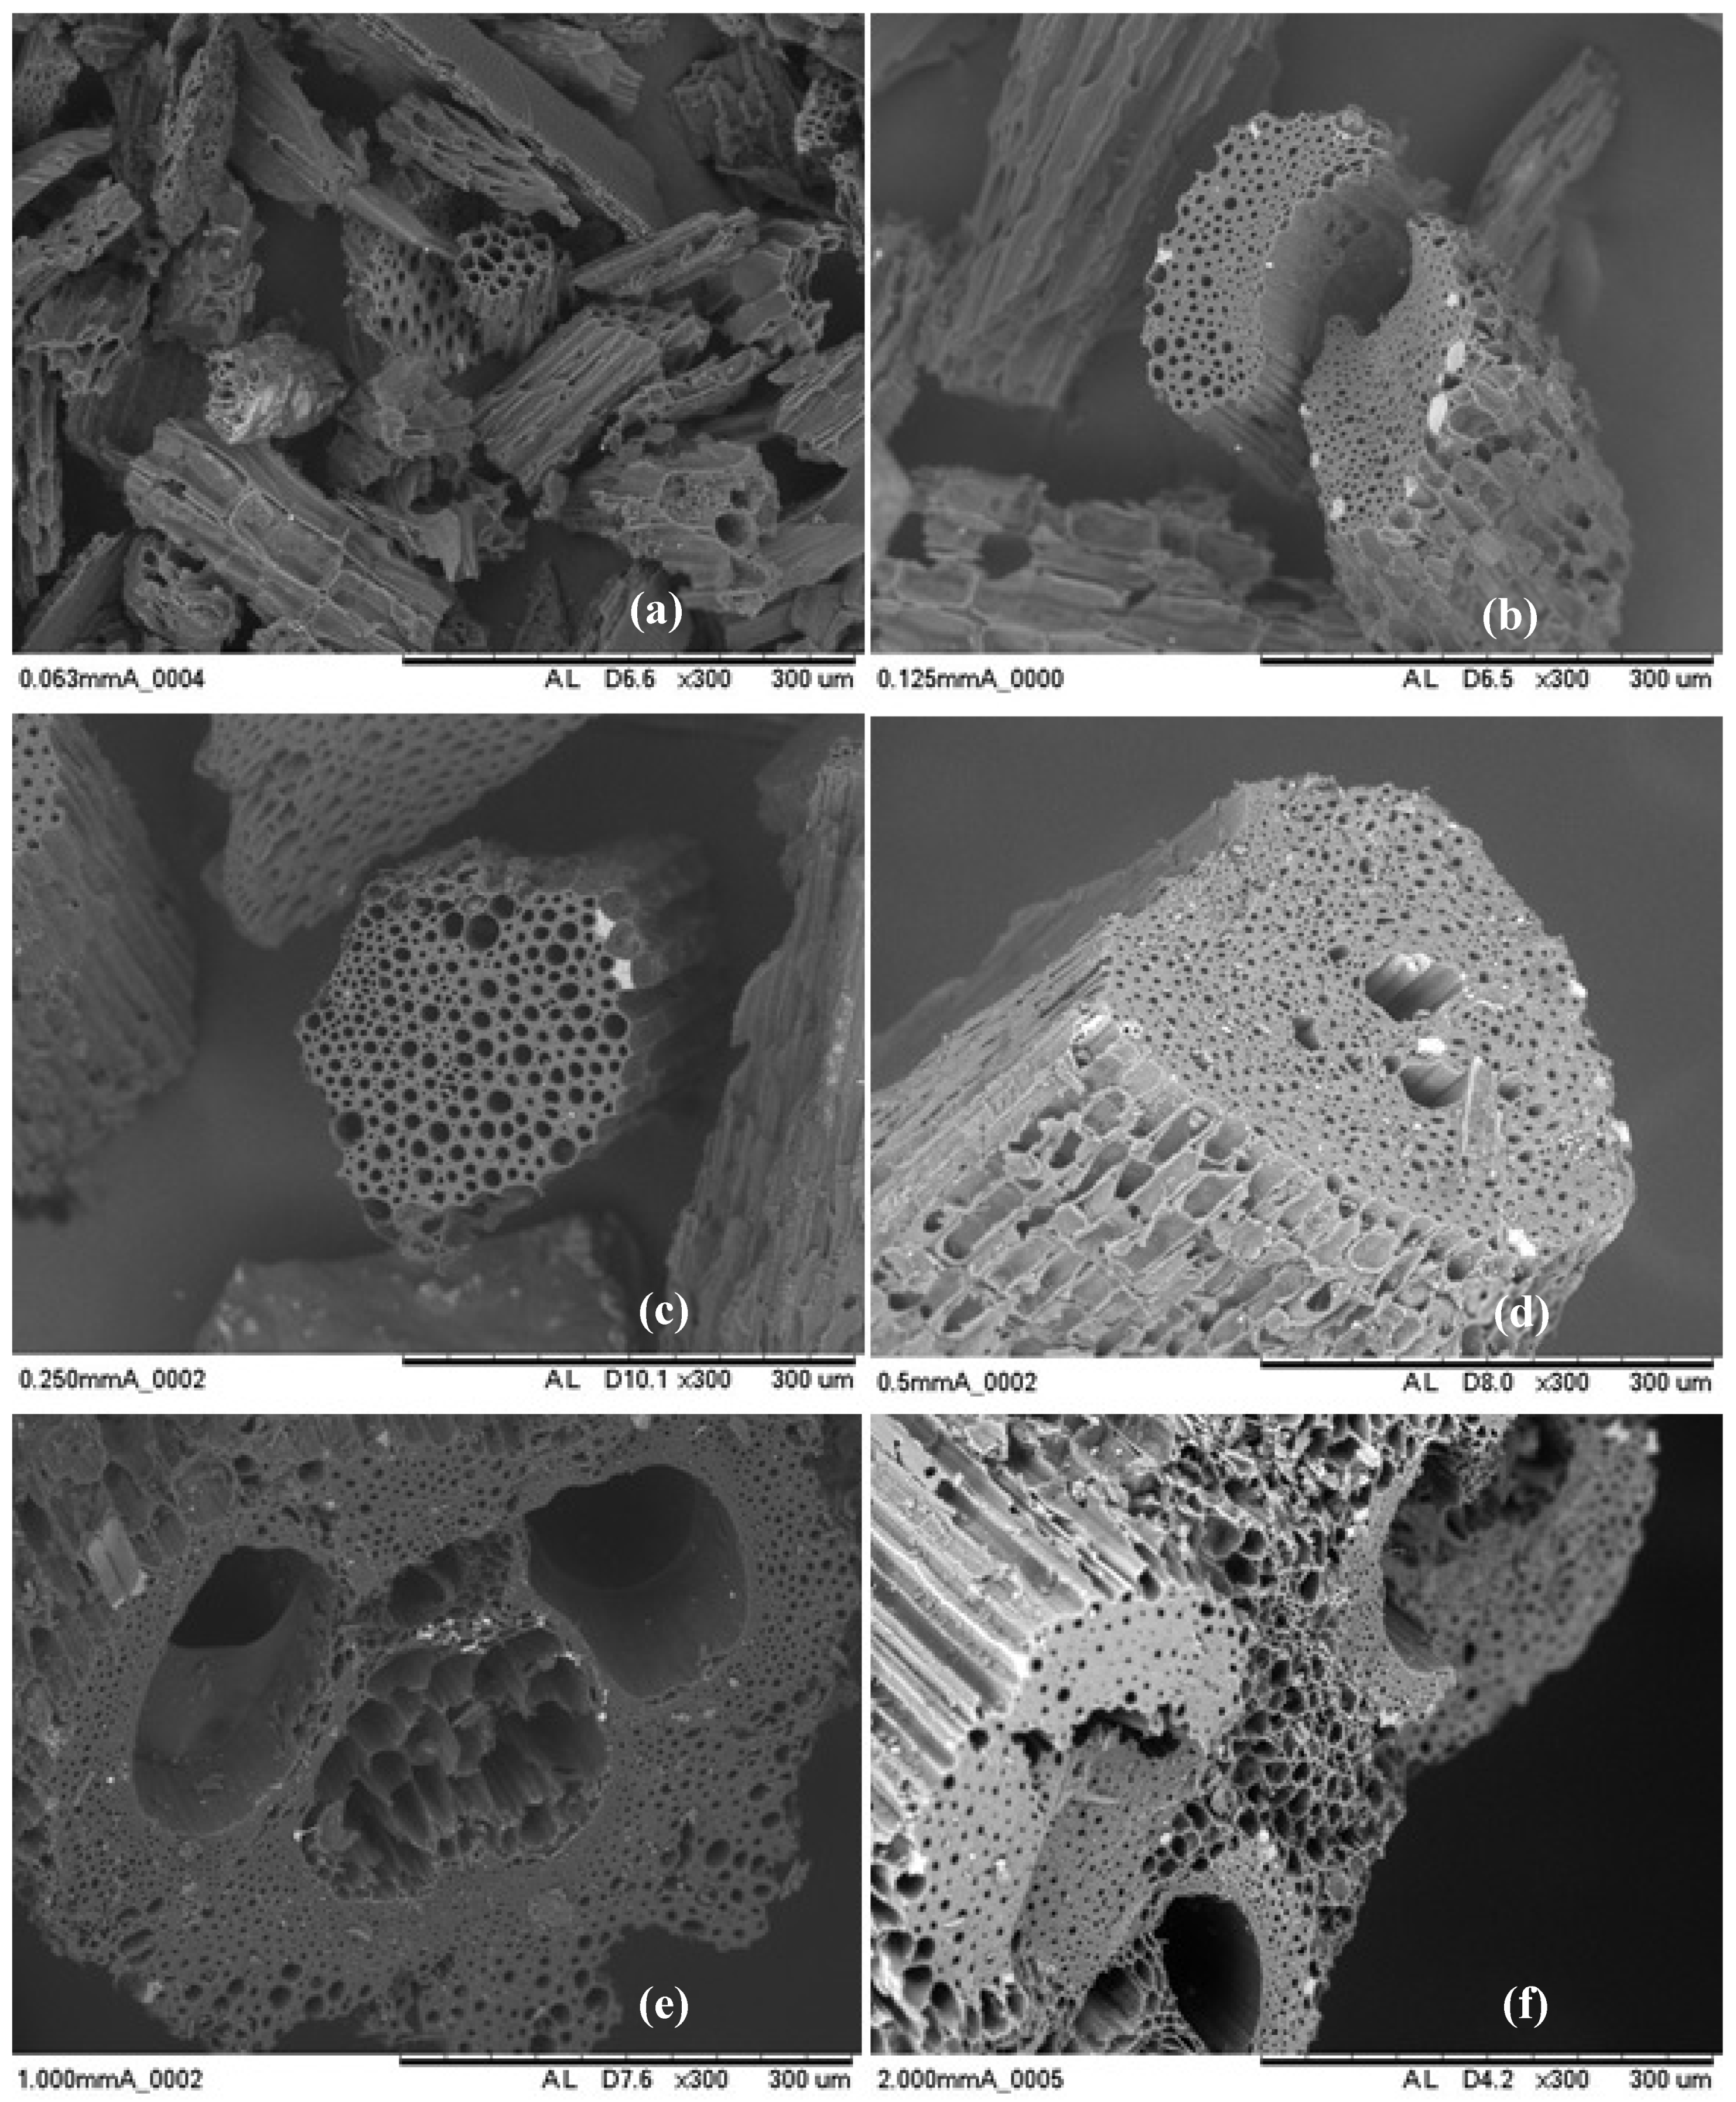
3.1. Characterization of the Biochar and Soil Amendments

Elemental analysis, specific surface area, skeletal density, and pH of the biochar used, with and without sieving, are listed in Table 2. It was found that total carbon (C) and nitrogen (N) content were mostly homogeneous in most particle sizes, except for 1.00 and 0.125 mm for C and 0.125 and 0.063 mm for N. Nevertheless, most of the particle sizes for C, H, O, N, and S did not show any significant difference. As expected, ash content was significantly higher at 0.063 mm biochar particle size (BPS). C:N ratio was mostly higher at bigger BPS, ranging from 0.5 to >2 mm. Likewise, O:C and H:C ratios remained homogeneous along with all BPS. Skeletal density (SD) values in the BPS range were homogeneous, suggesting that any porosity changes were due to the biochar internal porosity.
The BPS distribution in Figure 3 shows that 85% (>D15) of the biochar particles were greater than those of the soil materials, thus increasing the fraction of larger particles in the treatments with biochar. On average, the BPS was seven times greater than that of SL (>D15) and ten times larger than that of SiL. Below D15 (i.e., 15% particles smaller than 0.0035 mm), corresponding to the range of silt and sand fractions, the BPS was smaller than that of the soil materials. The average diameter (D50) in biochar was 0.41 mm, whereas in SL and SiL the average diameter was 0.07 and 0.03 mm, respectively.
Figure 4 shows SEM images of the particle fractions of 0.063, 0.125, 0.250, 0.500, 1.0, and >2 mm (up to 3.5 mm). All particle sizes show a similar pore structure, with mainly tubular, parallel pores. The array of pores seen in Figure 4d–f is associated to fiber sclerenchyma material surrounding bundles of xylem and phloem vessels [43], with pores of about 10 µm and smaller (medium and fine pores) loosely distributed throughout an otherwise solid material surrounding the largest pores (see cross-sections in Figure 4b,c). The largest pores (>50 µm) are associated with the xylem, while smaller pores may be associated with phloem sieve vessels (Figure 4c,e), and parenchymal tissue, as seen in Figure 4a [44,45]. Xylem pores are continuous; phloem pores may be continuous or semi-continuous, and those in parenchymal tissue are discontinuous (Figure 4a,d). All size fractions contain nearly identical amounts of parallelly oriented pores, mostly about 30 µm to about 1 µm wide. The biochar originating from parenchymal tissue (Figure 4a,d) clearly shows thinner walls between its discontinuous pores, and thus could have lower mechanical resistance and be the main source of very fine particles. The specific surface areas (SSA) of the biochar fractions were low (Table 2), indicating low microporosity (pore sizes below 50 nm). As seen in Figure 3, about 85% of this biochar was in a range over 3 µm; thus, its predominant contribution to porosity was between 1 µm and 30 µm diameters. Biochar maximum particle size of 3.5 mm was preferred to smaller sizes to minimize channel blockage by small biochar particles, promote water infiltration and solute transport, and preserve the effects of added macroporosity. Overall, the skeletal density values obtained were in the 1.4 to 1.6 g/cm3 range, which is characteristic of biochar produced at low temperature. Likewise, bulk density of the biochar was between 0.20 and 0.34 g/cm3, which is typical of softwood biomass.
Chemical and physical properties of the silt loam (SiL) and the sandy loam (SL) treatmets, shown in Table 3, were analyzed after harvesting. It was found that the addition of biochar produced maximum increases of 0.2 pH units in the silt loam (SiL) and 0.6 pH units in the sandy loam (SL) treatments. SL mixtures showed a medium level of acidity. Acid saturation percentage (AS%), which is referred to as the availability of the exchangeable extractable aluminum concerning the exchangeable base cations, suggests a higher presence of soluble aluminum in SL mixtures than in SiL, which decreased with rising contents of biochar, although all values were within the optimum range below 10%.
In the amended sandy loam, the addition of biochar reduced salinity, although all EC values were below 2 mS/cm. We also found no significant changes (p > 0.05) in CEC as biochar content increased.
AWC decreased significantly, as biochar application rate increased, in SiL2.5 (25%) and SiL5 (21%) concerning the control (SiL0), whereas in the SL mixtures AWC increased but not significantly as the biochar dose increased (9% in SL2.5 and 14% in SL5 with respect to the SL0 control). AC did not register any significant change in the SiL mixtures, whereas biochar produced a significant increase in SL mixtures. Soil water retention at FC (−6 kPa) increased 11% in SiL5 and 9% in SL5 with respect to their corresponding control treatments. Although, initial bulk density was set to 0.7 g/cm3, final bulk density increased 14% for all treatments, independently from the biochar application rate. The impact on bulk density was negligible, since the differences between treatments were not statistically significant.

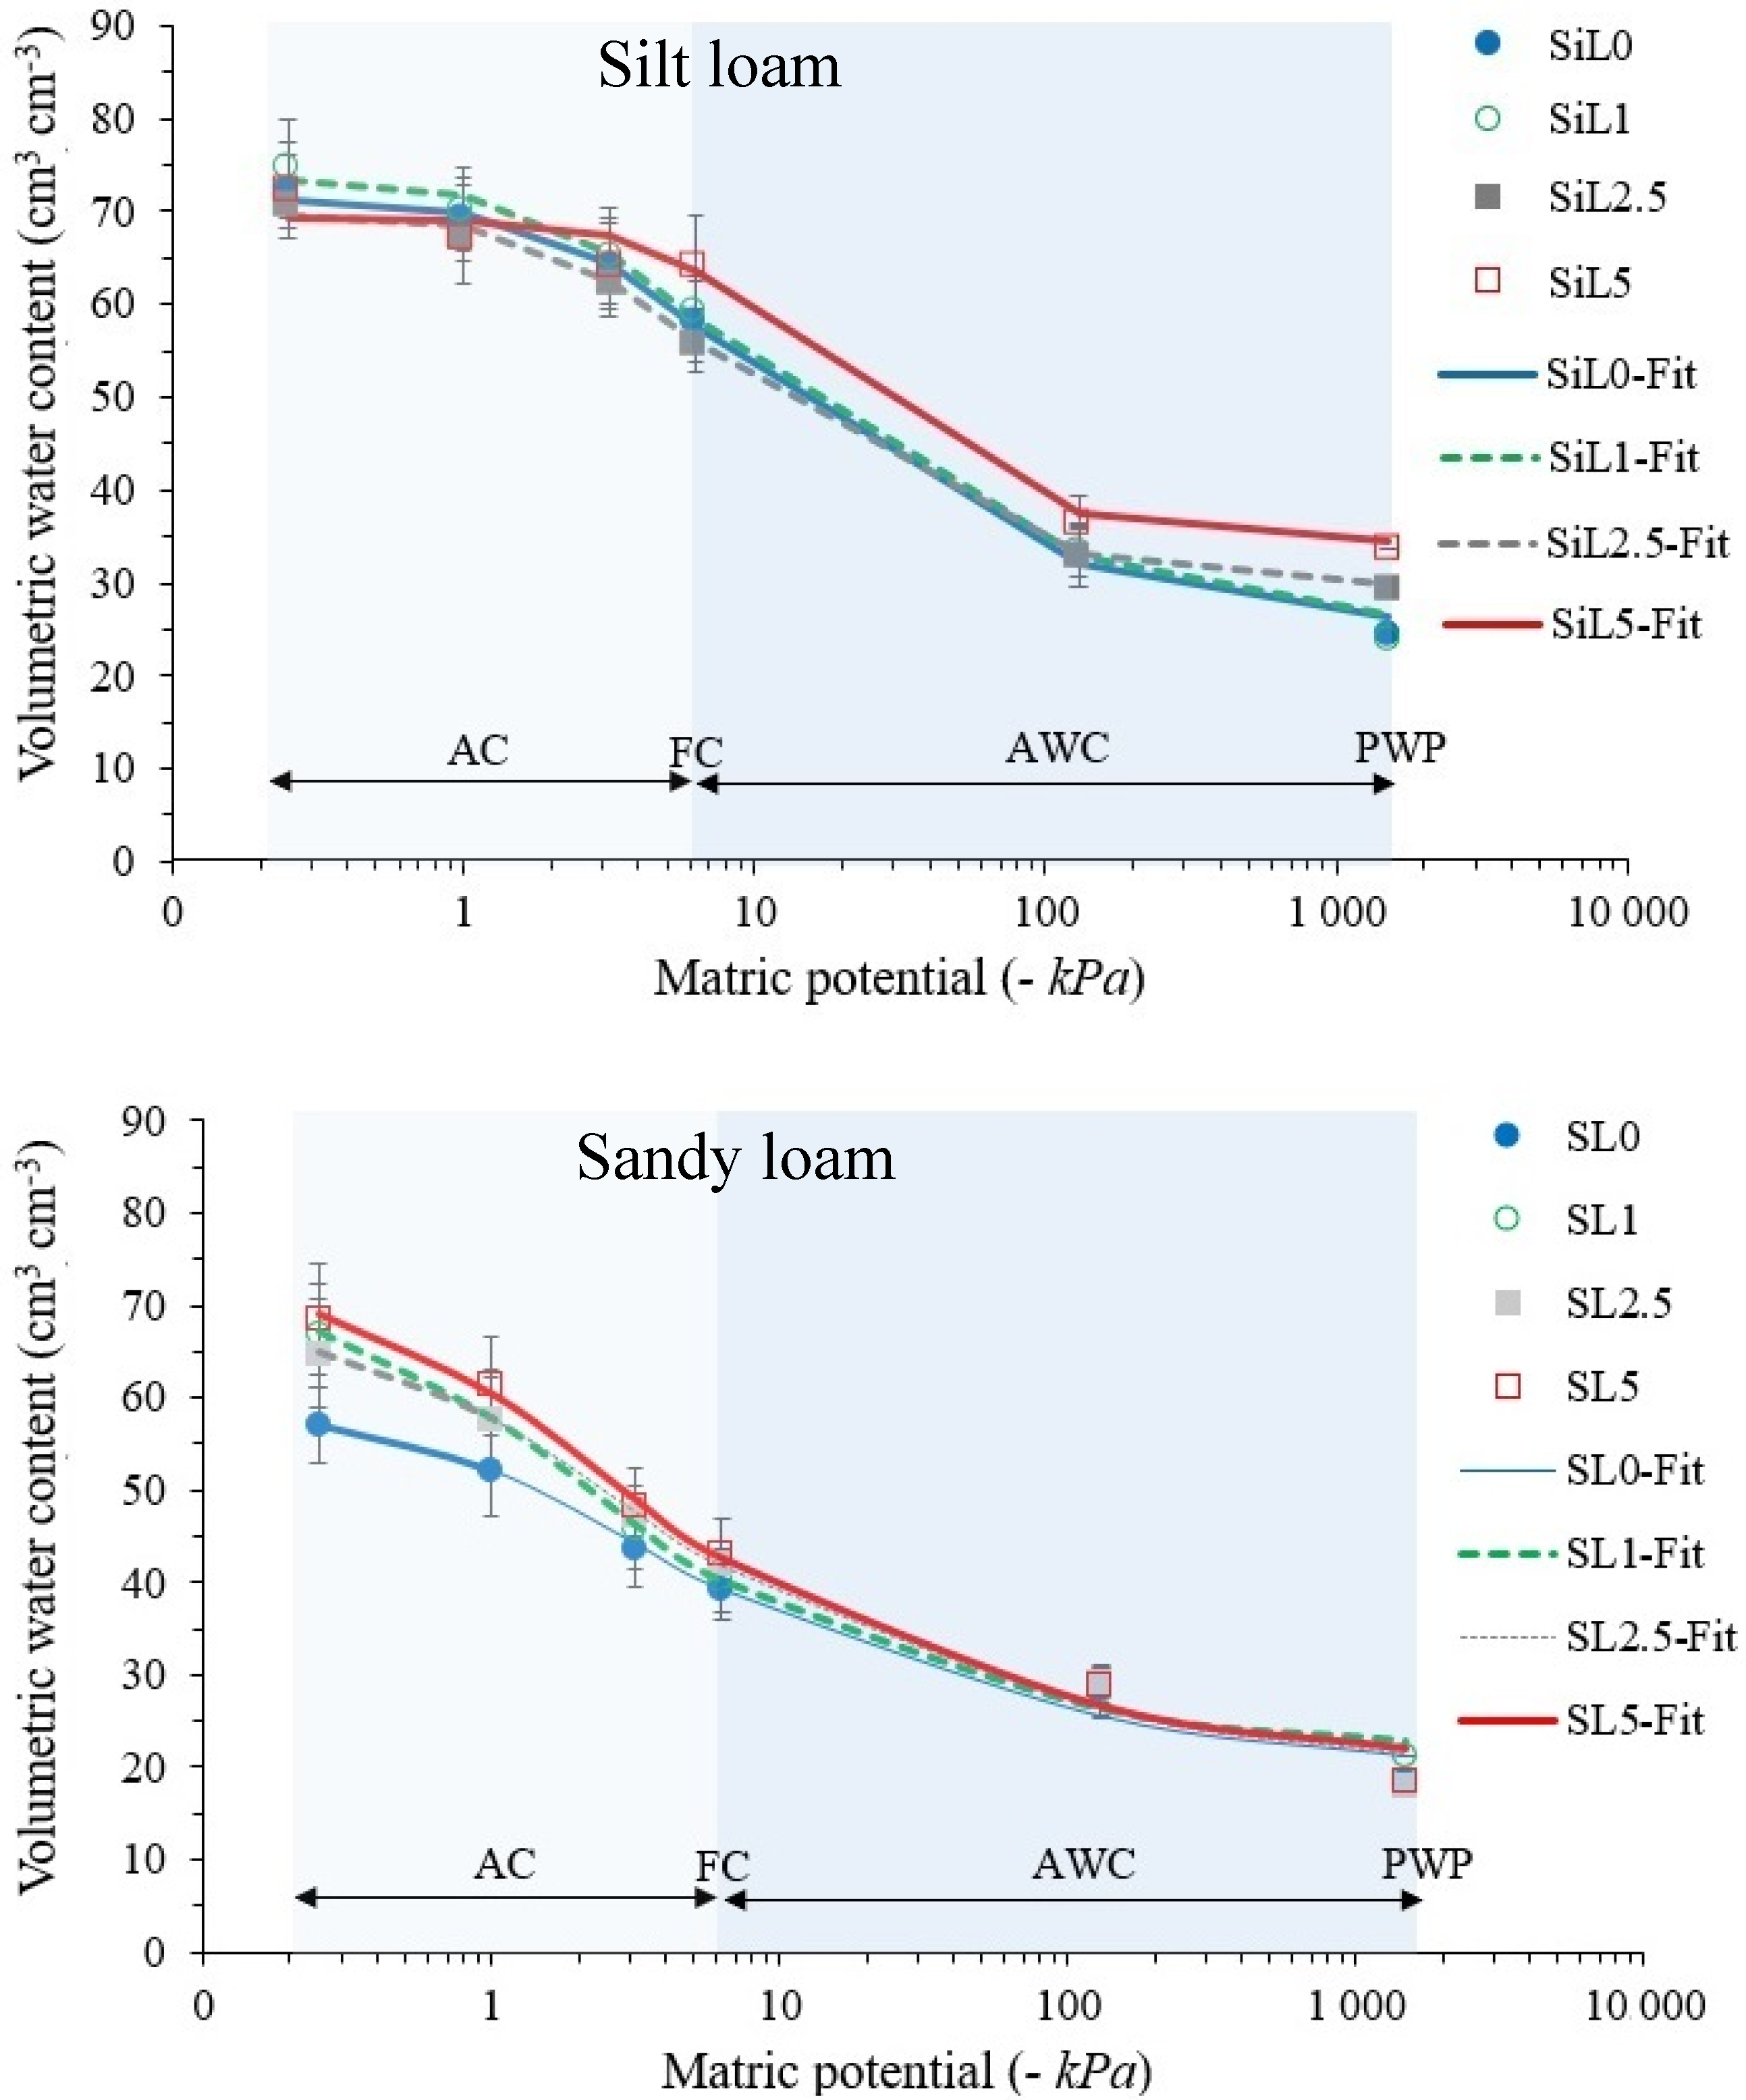
3.2. Effect of Biochar on the Hydraulic Properties

The sessile droplet method and the MED test showed no evidence of hydrophobicity in the bamboo biochar, in the soils without biochar, nor in their mixtures. Therefore, water repellency was excluded from the analysis as a possible mechanism influencing the wettability of the amended soils. The addition of biochar produced opposite effects on water retention, AWC, AC, and pore size distribution, in the two soil types. Soil water retention increased with increasing biochar contents in both soils; however, this did not necessarily lead to an increase in AWC (Figure 5). In the SiL treatments, a biochar application rate of 5% produced a significant increase in soil water retention, whereas AC decreased. Additionally, AWC decreased with higher biochar fractions, i.e., 25% and 21% for SiL2.5 and SiL5, respectively; compared to the unamended treatment. Contrarily, in the SL treatments, AC increased notoriously, probably due to the addition of biochar with a larger particle size than the soil. The increase of capillary pores led to higher water retention values at matric potentials between −6 kPa and −10 kPa (9% and 26% in SL2.5 and SL5, respectively). In addition, no significant water retention changes were observed at a matric potential close to −1500 kPa, consequently producing AWC increments of 15% in SL2.5 and 17% in SL5.
The parameters used to fit the soil water retention curves of the soil materials with the van Genuchten–Mualem model are shown in Table 4. The saturated hydraulic conductivity (Ks) increased in most of the soil mixtures, with the addition of biochar. However, we observed a higher increase of Ks in the sandy loam, which coincides with larger pore formation at less negative matric potentials (Figure 5).

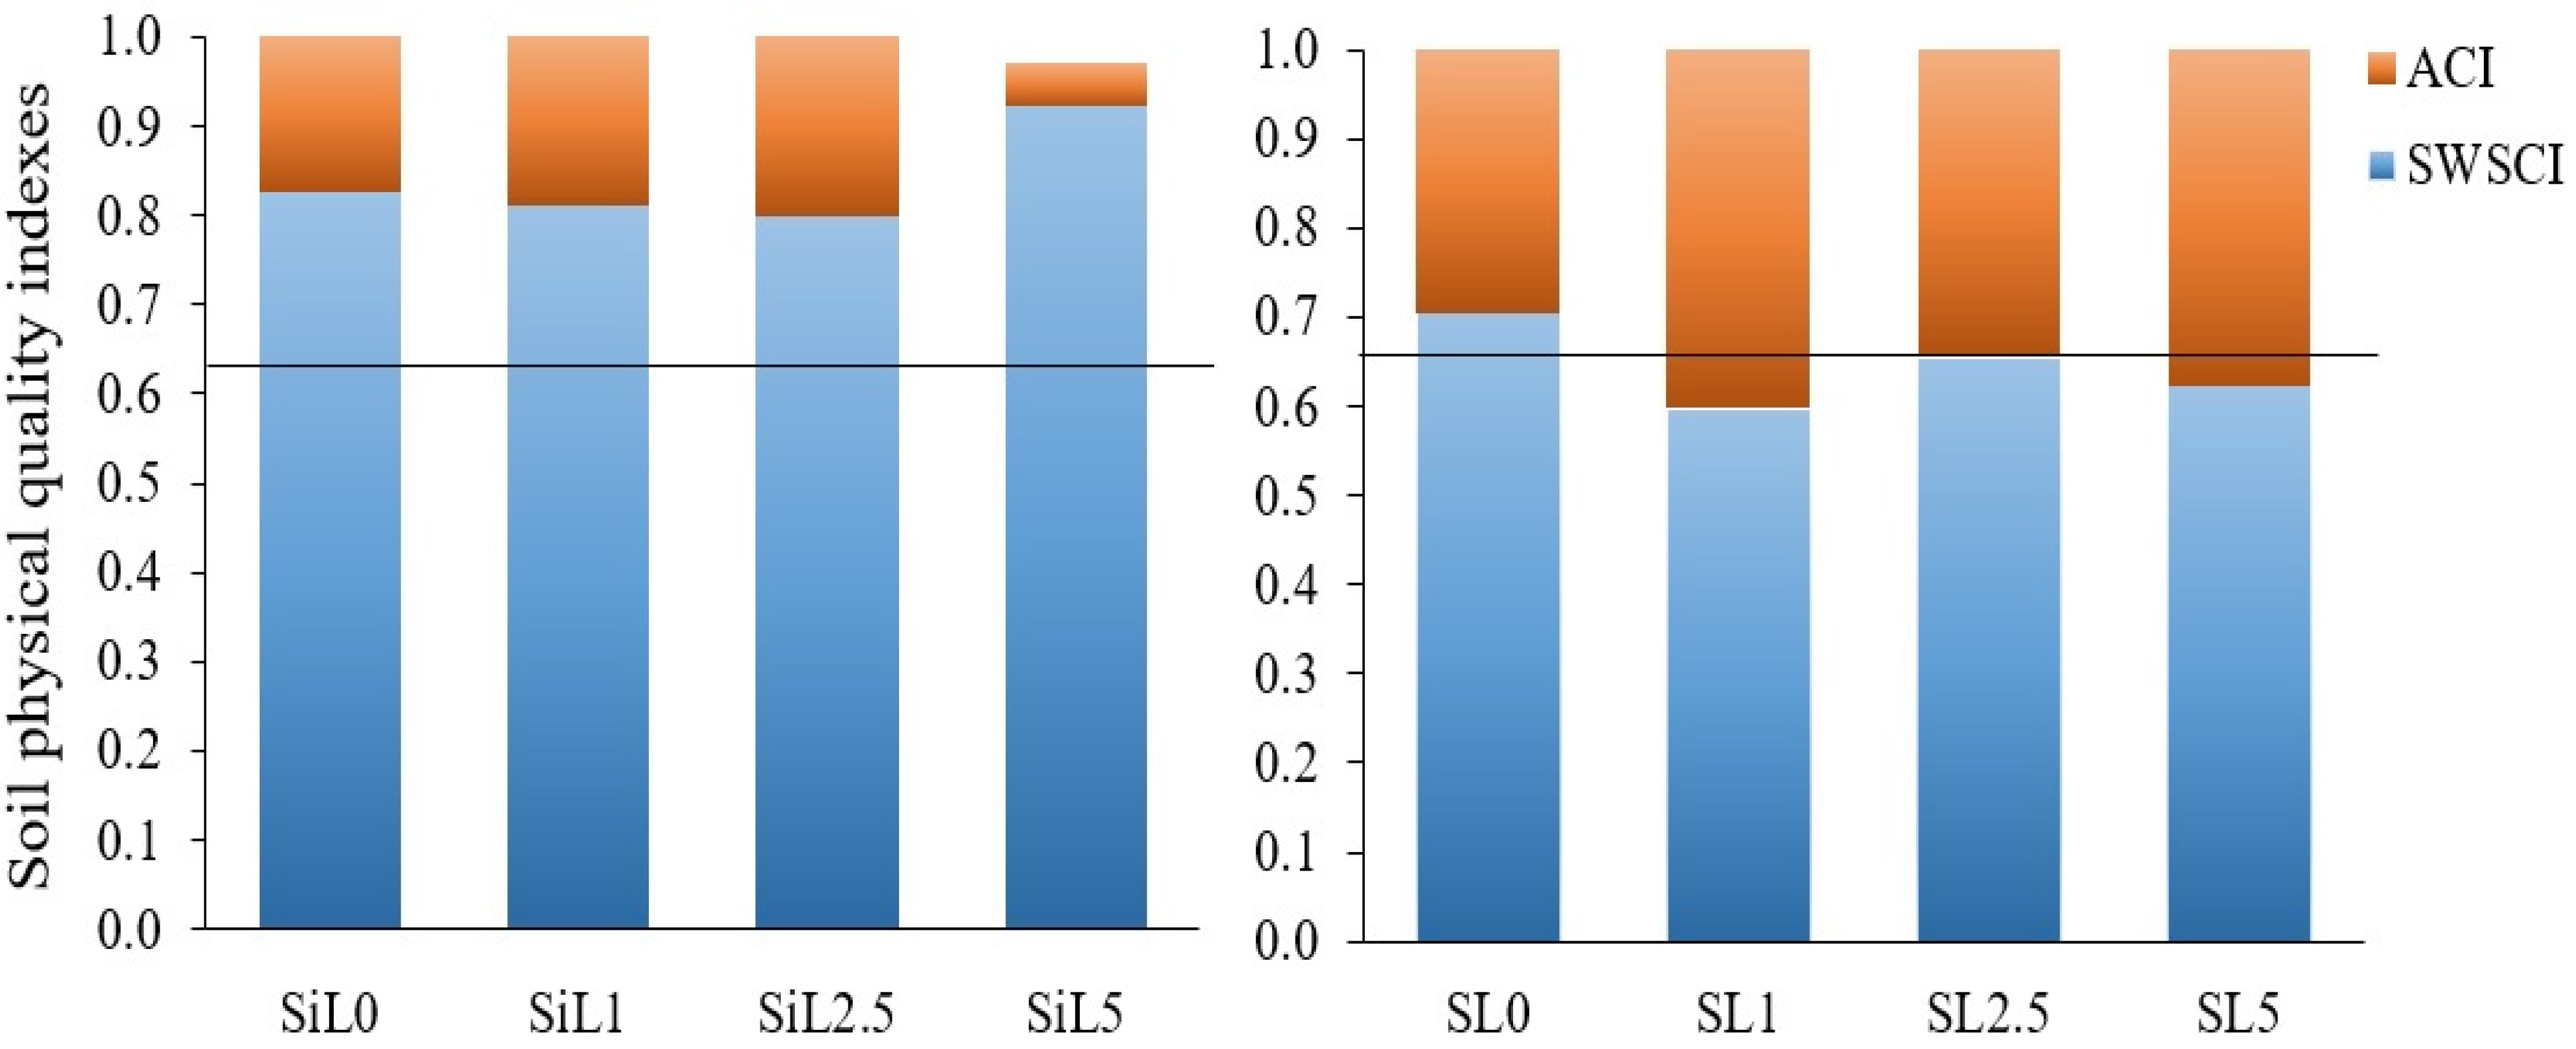
3.3. Soil Physical Quality Indicators

The Soil Water Storage Index (SWSCI) and Air Capacity Index (ACI) based on [41] are shown in Figure 6. The SWSCI index defines the water-filled pore space compared to the total porosity while the ACI index indicates the aeration capacity of the soil. It was found that the unamended silt loam had a SWCI index over the recommended optimal value of 0.66, and none of the biochar application rates enhanced the SWCI or ACI indexes. Contrarily, the unamended sandy loam was close to the optimum SWCI index and biochar fractions of 1% and 5% increased the ACI index, corresponding to the formation of macropores.

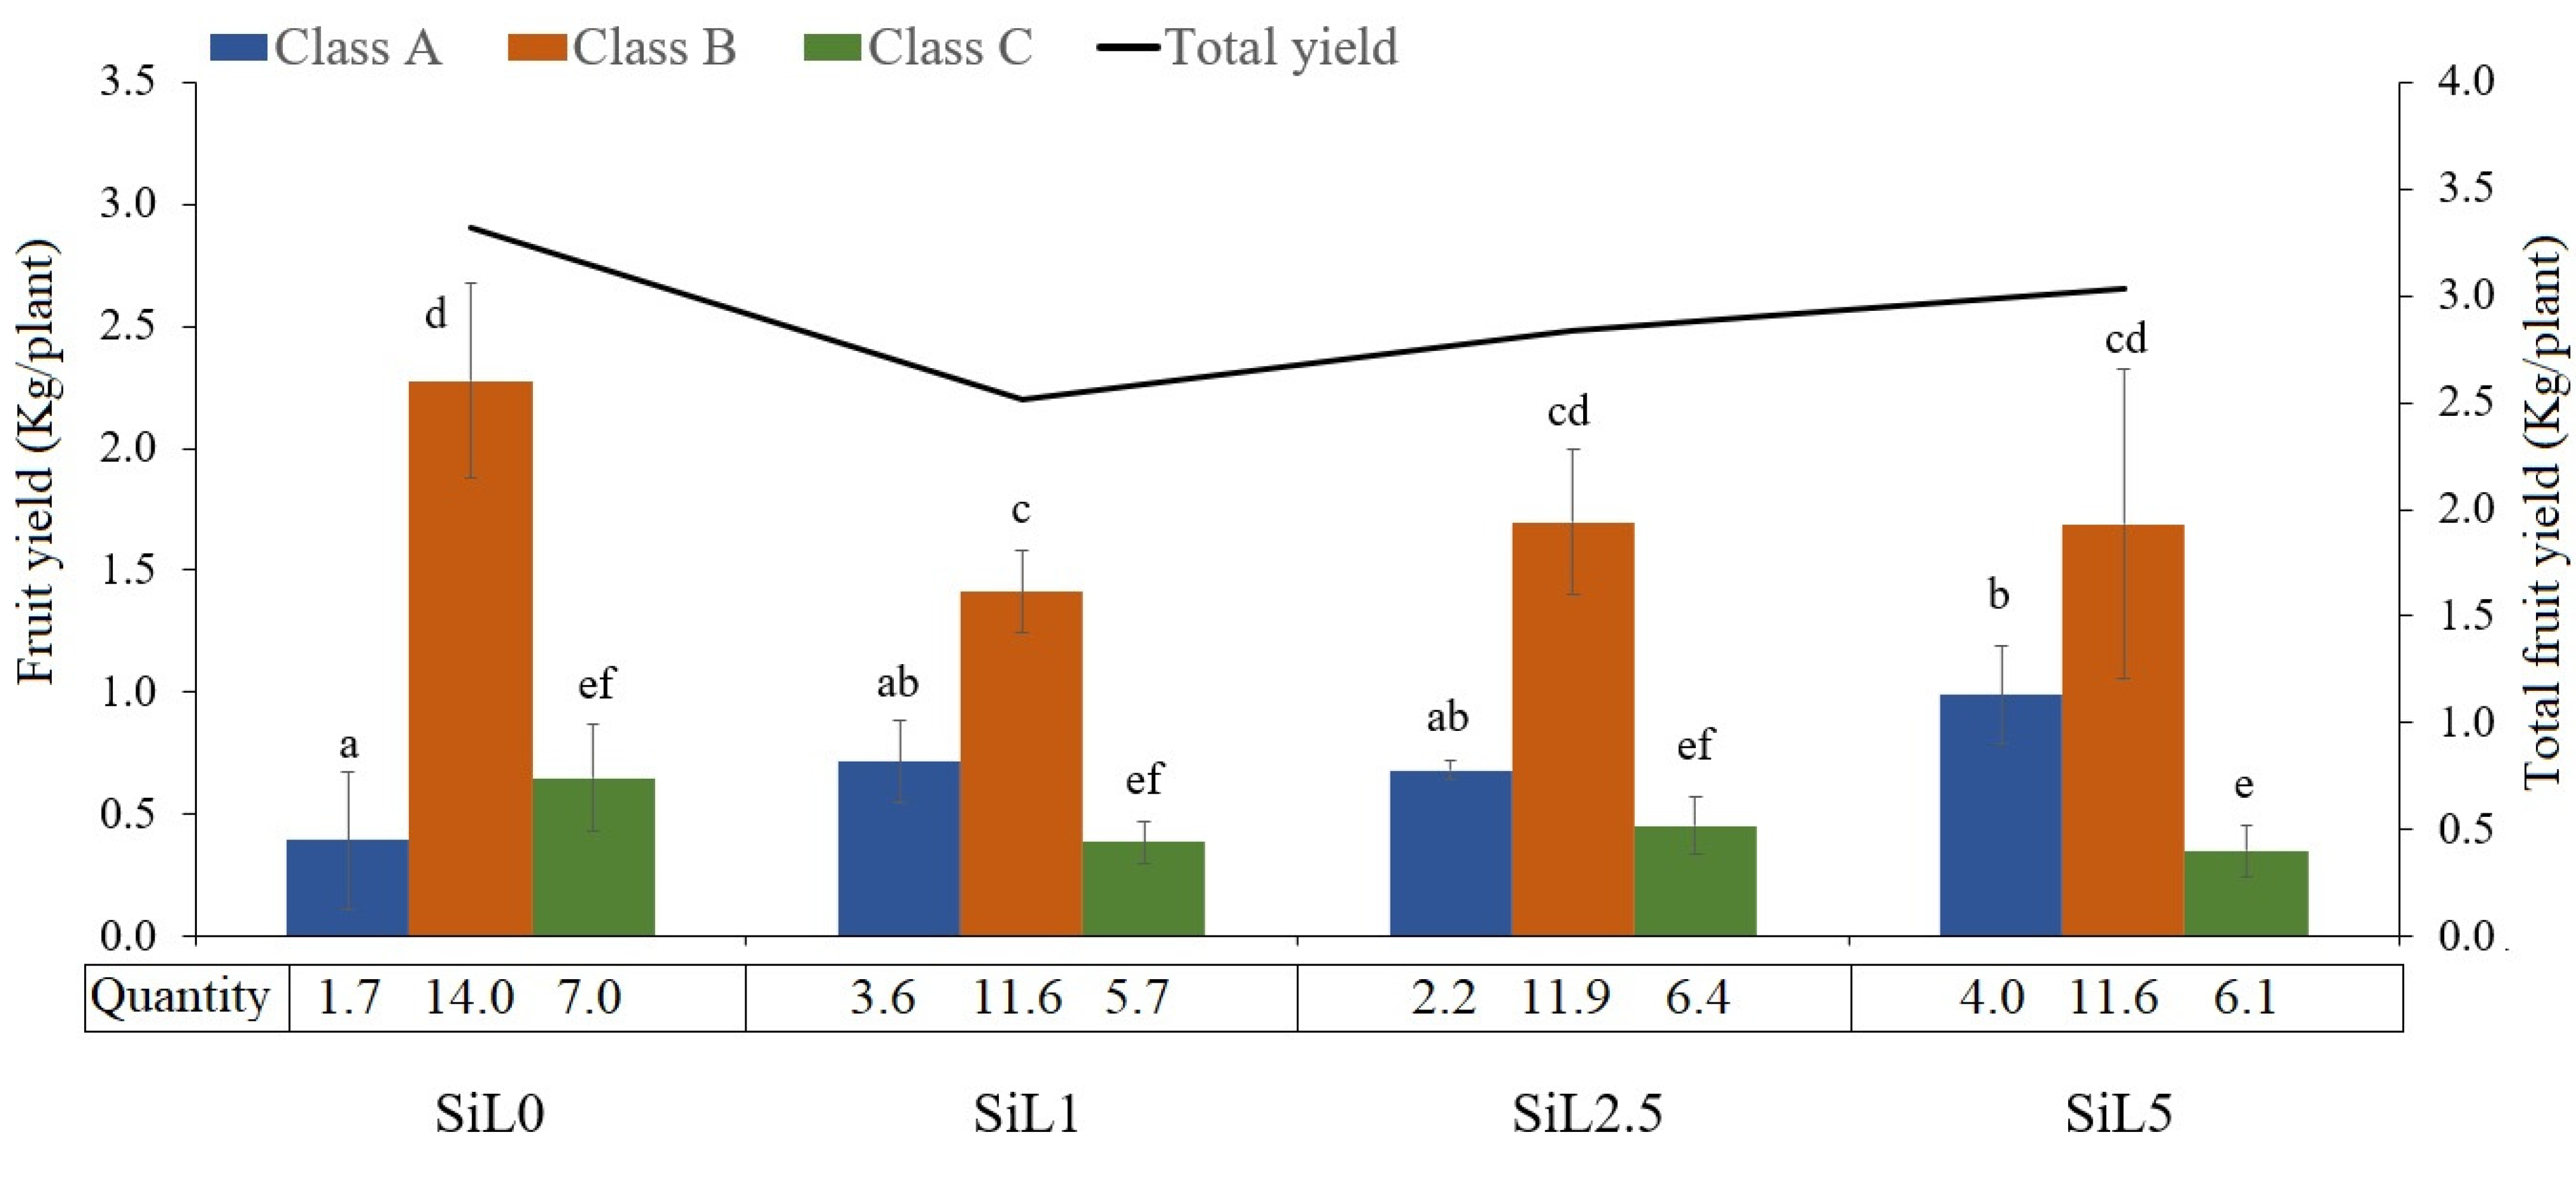
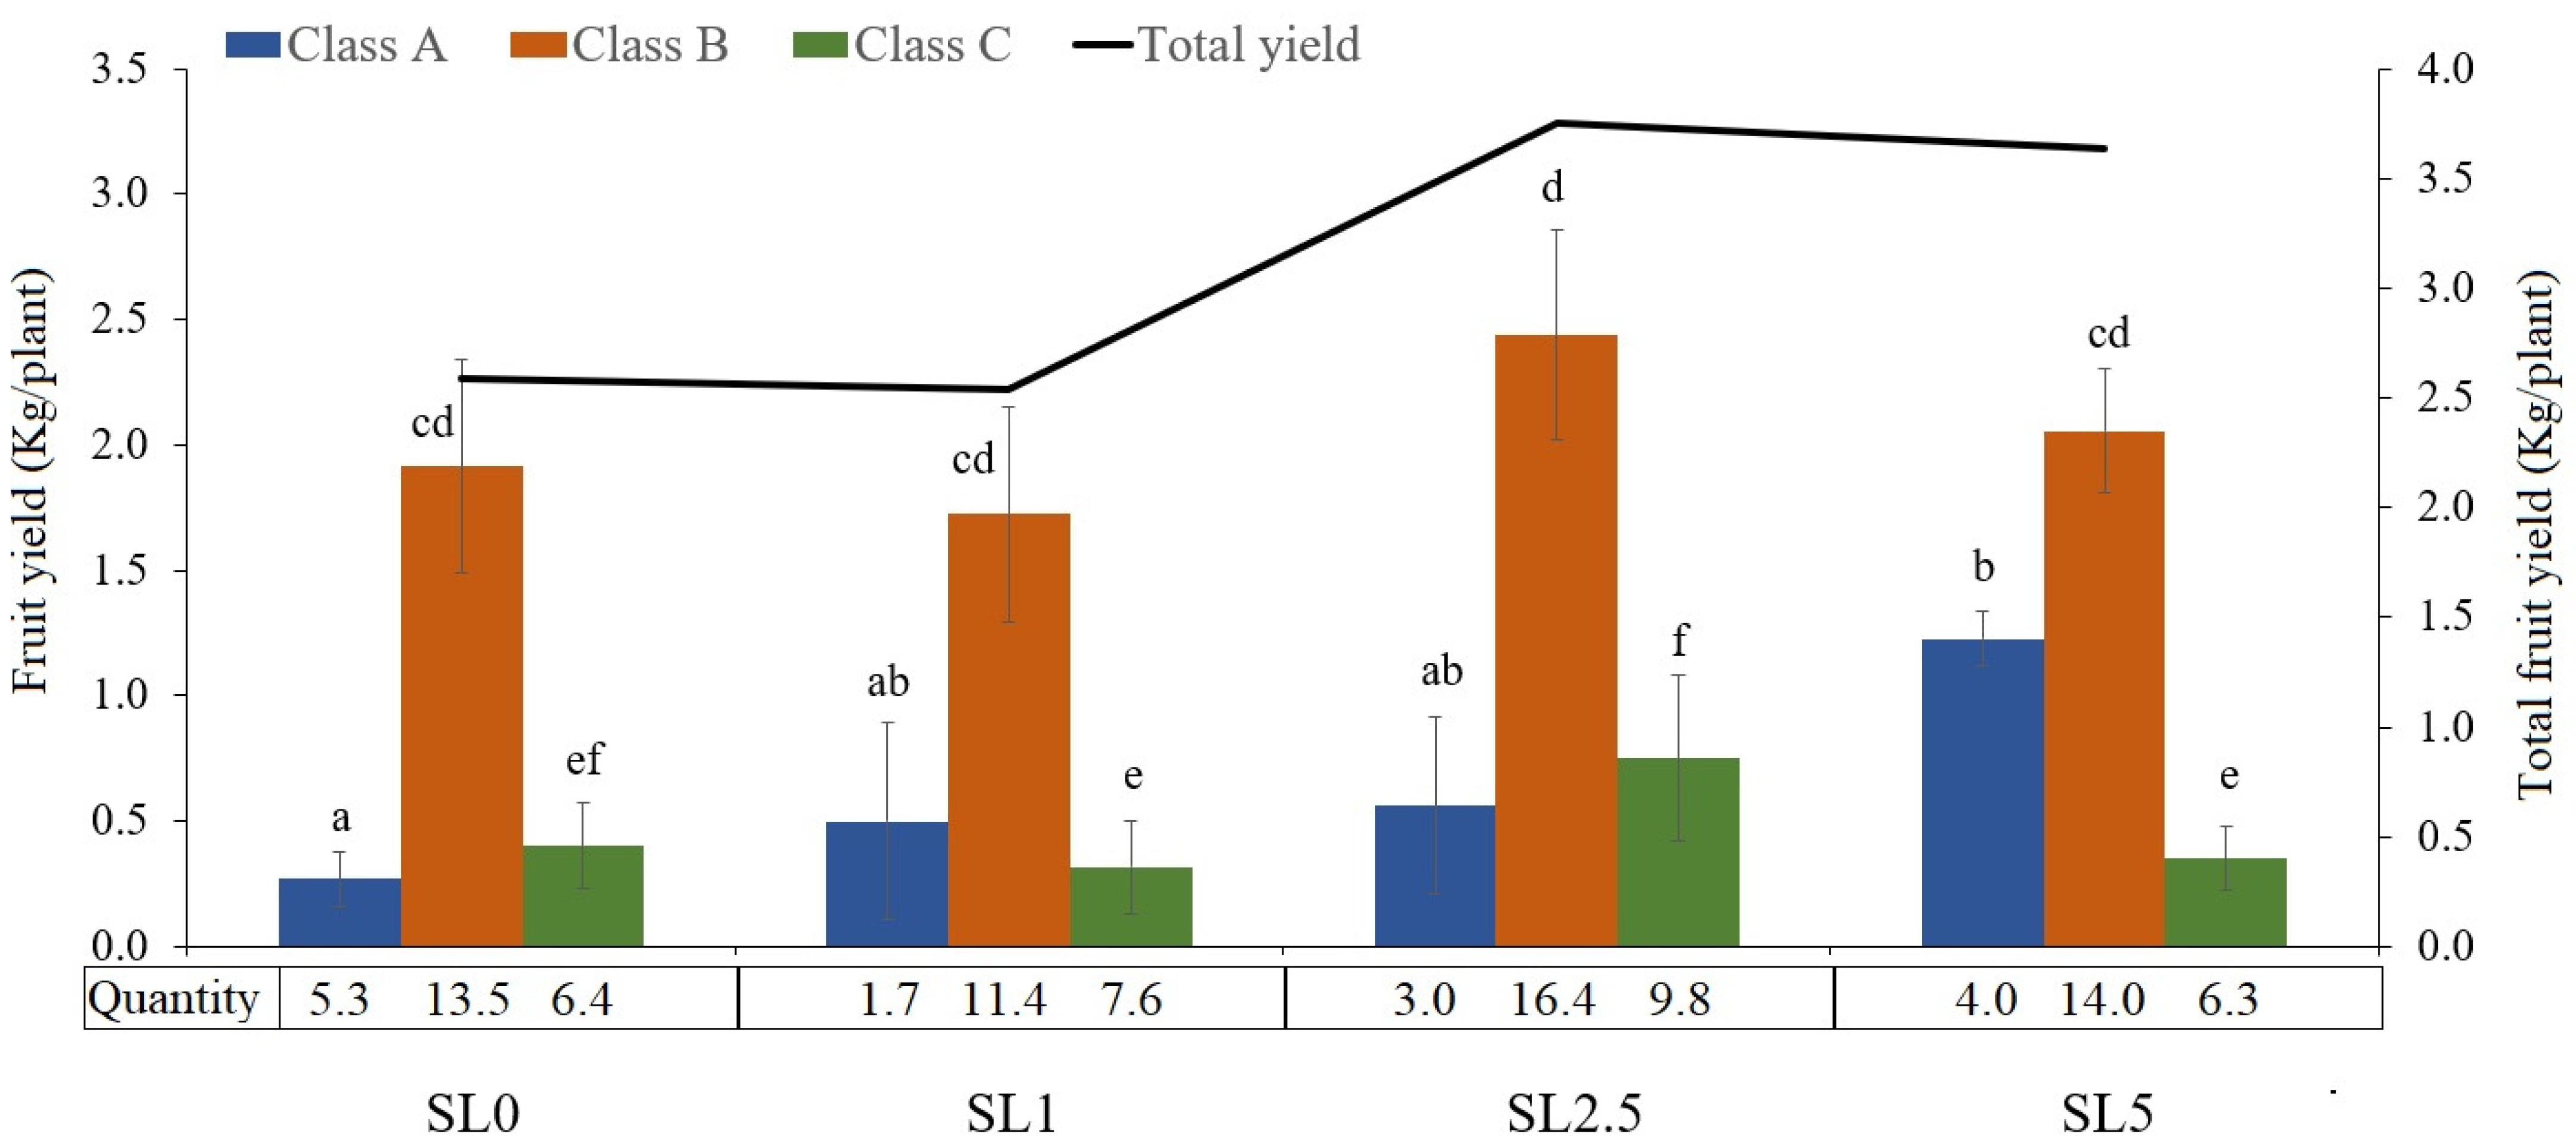
3.4. Variation of the Crop Productivity with the Biochar Fraction

Tomatoes were harvested for two months; a common practice among local producers of this specific variety. Figure 7 shows the average tomato yield by weight per plant, classified as class A, B, or C (bars), and the total fruit yield per plant is represented as a black continuous line. Additionally, the average number of fruits per plant by class, during the harvesting period, can be seen below the x-axis. This study was focused on classes A and B, due to their economic relevance to producers. In the silt loam treatments (SiL), class A tomato yields increased significantly with the 5% biochar addition (150% compared to the control), but class B yield decreased in average 25% at 2.5 and 5% biochar application rates. Overall, class B yield decreases were compensated by class A yield increments in the silt loam treatments. However, the total fruit yields of the SiL treatments were below the control. The sandy loam treatment with 5% biochar produced the highest fruit yield in class A, with less fruits per plant (352% compared to control). The 2.5% biochar fraction yielded the highest class; B tomatoes (27% compared to control). Overall, the sandy loam treatments produced a higher total fruit yield (3.8 kg/plant) than the silt loam treatments (3.0 kg/plant).

4. Discussion

This investigation revealed that the addition of biochar enhanced crop production by improving soil physical and chemical properties [47], with positive and negative effects depending on soil texture, which agrees with Sohi et al. [15]. Other studies, carried out in tomato crops, have also reported a relationship of crop yield to water and nutrient retention capabilities [5,6], soil aeration [8], and pH enhancement [48].
In our study, the addition of the bamboo biochar increased the pH less than one unit in the highest mixing rate (5%). Such small increments could be due to high levels of alkalis as Ca2+ [49,50], carbonates, inorganic alkalis as silicates [51], and free hydroxyl (OH) ions due to the biochar ash content (>10%). The high concentration of Ca2+ may have produced a cation imbalance, which is considered an indicator of low fertility [31,52]. According to the results, we think that lime potentialized the effect of the liming capacity of the biochar. Lime CaO physically occupies the sites in the soil matrix normally occupied by ex-changeable aluminum while diminishing the solubility of aluminum (Al3+) in the soil solution. Biochar alkalis, which according to Fidel et al. [51] include carbonates, inorganic alkalis, soluble alkalis, and structural alkalinity, may be more likely to neutralize the acidity of the soil solution. Our results did not reveal a significant CEC increase, hence there was no enhancement of nutrient retention capacity [15]. Similarly, the Ca/Mg/K ratios were not in their optimal ranges, therefore there was no improvement in the fertility of the soil [31]. Consequently, these properties did not provide any strong insight into our crop yield results. Nonetheless, these results contrast with other studies that reported a positive effect of biochar on CEC values of different soil amendments [53,54,55]. Low CEC values in our bamboo biochar were mainly due to the low SSA, where the low fractions of carboxylate groups did not contribute sufficiently to increase the negative surface charge on biochar particles [56]. Based on the low response of our crop yield to the chemical indicators, we could not set any strong driving mechanism to understand this yield output.
Contrarily, the effect of biochar on crop productivity was strongly associated with changes in soil water retention capacity, available water content (AWC), and air capacity (AC) conditions. Changes in soil water retention depend on the particle sizes of biochar and the soil texture, consistent with the work of Masiello et al. [57]. The larger particle size of the bamboo biochar compared to the soil materials led to a change in the grain size distribution in the mixtures. This, including the hydrophilicity of the biochar, strongly supports that the added biochar could have contributed to changes in AWC according to the particle size distribution of the different soil types. In the silt loam treatments, we found an opposite behavior between soil water retention and AWC. About 85% of the soil grains (smaller than the biochar particles) were able to fill the pores inside the biochar, forming new fine pores. This new pore formation in the intraparticle pore space increased soil water retention up to 10% and 8% of soil water retention in the SiL and SL treatments, respectively, though not necessarily AWC, especially in the SiL treatments. The new fine pores (<0.2 µm) were able to retain water inaccessible for plants at high matric potentials [57]. Additionally, the hydrophilic surfaces and the water-binding capacity of the biochar might have also played a role by increasing soil water retention at the permanent wilting point (PWP). Therefore, AWC, mainly in the silt loam treatments, did not significantly increase due to the formation of new fine pores able to hold soil water at high matric potentials. The increase of AWC in soils with high sand content agrees with previous studies [17,19,58] and differs with [24,26] that reported non-significant changes of biochar on water retention. Furthermore, it is contrary to available water content reports in silt loam soils by [59]. These contradictory results might be due to the different biochar particle size used in the studies [60].
Biochar kept high levels of the soil water storage index (SWSCI) in the silt loam treatments, and produced a close optimum equilibrium in the sandy loam mixtures, concerning the air capacity index (ACI). These results are consistent with Castellini et al. [61] who argue that coarse textures benefit more, in terms of their soil physical quality, than fine textures, from biochar additions, due to effects on its porosity and air capacity. Such a SWSCI/ACI relationship was directly correlated to fruit yield. Reynolds et al. [62] suggest SWSCI optimal values range between 0.6 and 0.7 and ACI optimal values surpass 0.14, in order to obtain optimal root-zone development. The formation of macropores (equivalent average pore diameter >50 µm) and capillary pores (pore diameter between 50 and 0.2 µm) in the sandy loam treatments produced optimal conditions for an ideal solute exchange, resulting in a higher total tomato yield, in contrast to the silt loam treatments, where AC conditions produced severe aeration deficits, non beneficial for plant growth [41,63]. These relations suggest that SWSCI/ACI imbalances may affect tomato production and is highly dependent on the soil type, biochar application rate, and its particle size [64].
Towards more efficient irrigation and management practices, we believe that differences in SWSCI/ACI indexes for the different soil textures may help promote adapted water management strategies based on soil physical changes provoked by biochar soil amendments. Adaptations in frequency and intensity of irrigation must be taken into consideration when adding biochar, to reduce water losses, from downward vertical processes, such as percolation, and to avoid excess water that might harm crop production.

5. Conclusions

Results demonstrate that the addition of a hydrophilic macroporous biochar to a sandy loam and a silt loam soil had dramatic effects on the soil’s physical properties, leading to strong and contrasting impacts on the yield of tomatoes in a greenhouse experiment. The yields of A and B class tomatoes significantly increased in the sandy loam with the 2.5% biochar fraction (45% higher than control), whereas the contrary occurred in the silt loam treatments. For efficient water use and facing threats such as water scarcity and climate change, a water irrigation plan strategy for loam soils amended with hydrophilic macroporous biochars is recommended to control the water storage to air capacity ratio SWSCI/ACI.

Author Contributions

Conceptualization, K.V.-M., F.M.-M. and J.Q.-K.; Methodology, K.V.-M., F.M.-M. and J.Q.-K.; Formal Analysis, K.V.-M., F.M.-M. and J.Q.-K.; Investigation, K.V.-M., F.M.-M. and J.Q.-K.; Resources, K.V.-M., F.M.-M., J.Q.-K. and C.A.G.-G.; Data Curation, K.V.-M., F.M.-M. and J.Q.-K.; Writing—Original Draft Preparation, K.V.-M.; Writing—Review & Editing, K.V.-M., F.M.-M., J.Q.-K., C.A.G.-G. and R.H.; Visualization, K.V.-M.; Supervision, F.M.-M. and J.Q.-K.; Project Administration, F.M.-M.; Funding Acquisition, K.V.-M., F.M.-M. and J.Q.-K. All authors have read and agreed to the published version of the manuscript.

Funding

This research was funded by the Research and Extension Vice presidency of the Costa Rican Institute of Technology (1460069) and the National Tomato Program (FITTACORI) of the Agricultural and Livestock Ministry of Costa Rica. Additionally, this research was partially funded by Xunta de Galicia [ED431C 2020/17], MICINN [PID2020-120010RB-I00], Agencia Estatal de Investigación [AEI] and FEDER funds.

Acknowledgments

The authors would like to thanks to Wagner Peña (R.I.P.) from Universidad Estatal a Distancia (UNED) for the valuable discussion on this paper and Elemer Briceño from UNED for providing the bamboo and technical support on its handling. The author C.A.G.-G would like to thank MINECO for a Ramón y Cajal Fellowship [RYC2014-15239] and Patricia Blanco Carro (I+D Farma Group) with the helium pycnometry measurements.

Conflicts of Interest

The authors declare no conflict of interest.

References

  1. Mehmood, K.; Chávez Garcia, E.; Schirrmann, M.; Ladd, B.; Kammann, C.; Wrage-Mönnig, N.; Siebe, C.; Estavillo, J.M.; Fuertes-Mendizabal, T.; Cayuela, M.; et al. Biochar research activities and their relation to development and environmental quality. A meta-analysis. Agron. Sustain. Dev. 2017, 37, 22. [Google Scholar] [CrossRef] [Green Version]
  2. World Reference Base for Soil Resources 2014, Update 2015 International Soil Classification System for Naming Soils and Creating Legends for Soil Maps; IUSS Working Group WRB: Rome, Italy, 2015.
  3. Agegnehu, G.; Srivastava, A.K.; Bird, M.I. The role of biochar and biochar-compost in improving soil quality and crop performance: A review. Appl. Soil Ecol. 2017, 119, 156–170. [Google Scholar] [CrossRef]
  4. Boletin del ENOS N°118, Fase Actual: El Niño; IMN: San José Province, Costa Rica, 2019.
  5. Agbna, G.H.D. Biochar amendments improves tomato growth, yield and irrigation water use efficiency under poor silt loam soil. Int. J. Eng. Sci. Res. 2017, 5, 95–104. [Google Scholar]
  6. Akhtar, S.S.; Li, G.; Andersen, M.N.; Liu, F. Biochar Enhances Yield and Quality of Tomato under Reduced Irrigation. Agric. Water Manag. 2014, 138, 37–44. [Google Scholar] [CrossRef]
  7. Keabetswe, L.; Shao, G.C.; Cui, J.; Lu, J.; Stimela, T. A combination of biochar and regulated deficit irrigation improves tomato fruit quality: A comprehensive quality analysis. Folia Hortic. 2019, 31, 181–193. [Google Scholar] [CrossRef] [Green Version]
  8. Li, Y.; Niu, W.; Wang, J.; Liu, L.; Zhang, M.; Xu, J. Effects of Artificial Soil Aeration Volume and Frequency on Soil Enzyme Activity and Microbial Abundance when Cultivating Greenhouse Tomato. Soil Sci. Soc. Am. J. 2016, 80, 1208–1221. [Google Scholar] [CrossRef]
  9. Suthar, R.G.; Wang, C.; Nunes, M.C.N.; Chen, J.; Sargent, S.A.; Bucklin, R.A.; Gao, B. Bamboo biochar pyrolyzed at low temperature improves tomato plant growth and fruit quality. Agriculture 2018, 8, 153. [Google Scholar] [CrossRef] [Green Version]
  10. Huang, M.; Zhang, Z.; Zhu, C.; Zhai, Y.; Lu, P. Effect of biochar on sweet corn and soil salinity under conjunctive irrigation with brackish water in coastal saline soil. Sci. Hortic. 2019, 250, 405–413. [Google Scholar] [CrossRef]
  11. Glaser, B.; Lehmann, J.; Zech, W. Ameliorating physical and chemical properties of highly weathered soils in the tropics with charcoal—A review. Biol. Fertil. Soils 2002, 35, 219–230. [Google Scholar] [CrossRef]
  12. Cross, A.; Zwart, K.; Schackley, S.; Ruysschaert, G. The Role of Biochar in Agricultural Soils. In Biochar in European Soils and Agriculture: Science and Practice; Shackley, S., Ruysschaert, G., Zwart, K., Glaser, B., Eds.; Routledge: Abingdon, UK, 2016. [Google Scholar]
  13. Uzoma, K.C.; Inoue, M.; Andry, H.; Zahoor, A.; Nishihara, E. Influence of biochar application on sandy soil hydraulic properties and nutrient retention. J. Food Agric. Environ. 2011, 9, 1137–1143. [Google Scholar] [CrossRef] [Green Version]
  14. Hussain, M.; Farooq, M.; Nawaz, A.; Al-Sadi, A.M.; Solaiman, Z.M.; Alghamdi, S.S.; Ammara, U.; Ok, Y.S.; Siddique, K.H.M. Biochar for Crop production: Potential Benefits and Risks. J. Soils Sediments 2017, 17, 685–716. [Google Scholar] [CrossRef]
  15. Sohi, S.; Lopez-Capel, E.; Krull, E.; Bol, R. Biochar, Climate Change and Soil: A Review to Guide Future Research; CSIRO: Canberra, Australia, 2009. [Google Scholar]
  16. Verheijen, F.; Jeffery, S.; Bastos, A.C.; Van Der Velde, M.; Diafas, I. Biochar Application to Soils: A Critical Scientific Review of Effects on Soil Properties, Processes and Functions; Office for the Official Publications of the European Communities: Luxembourg, 2010; Volume 8, ISBN 9789279142932. [Google Scholar]
  17. Abel, S.; Peters, A.; Trinks, S.; Schonsky, H.; Facklam, M.; Wessolek, G. Impact of biochar and hydrochar addition on water retention and water repellency of sandy soil. Geoderma 2013, 202–203, 183–191. [Google Scholar] [CrossRef]
  18. Barnes, R.T.; Gallagher, M.E.; Masiello, C.A.; Liu, Z.; Dugan, B. Biochar-induced changes in soil hydraulic conductivity and dissolved nutrient fluxes constrained by laboratory experiments. PLoS ONE 2014, 9, e108340. [Google Scholar] [CrossRef] [Green Version]
  19. Villagra-Mendoza, K.; Horn, R. Effect of biochar on the unsaturated hydraulic conductivity of two amended soils. Int. Agrophys. 2018, 32, 373–378. [Google Scholar] [CrossRef]
  20. Kumari, K.; Moldrup, P.; Paradelo, M.; Elsgaard, L.; Hauggaard-Nielsen, H.; de Jonge, L.W. Effects of bbiochar on air and water permeability and colloid and phosphorus leaching in soils from a natural calcium carbonate gradient. J. Environ. Qual. 2014, 647–657. [Google Scholar] [CrossRef]
  21. El-Naggar, A.; Lee, S.S.; Rinklebe, J.; Farooq, M.; Song, H.; Sarmah, A.K.; Zimmerman, A.R.; Ahmad, M.; Shaheen, S.M.; Ok, Y.S. Biochar application to low fertility soils: A review of current status, and future prospects. Geoderma 2019, 337, 536–554. [Google Scholar] [CrossRef]
  22. Cornelissen, G.; Jubaedah Nurida, N.L.; Hale, S.E.; Martinsen, V.; Silvani, L.; Mulder, J. Fading positive effect of biochar on crop yield and soil acidity during five growth seasons in an Indonesian Ultisol. Sci. Total Environ. 2018, 634, 561–568. [Google Scholar] [CrossRef] [PubMed]
  23. Jeffery, S.; Abalos, D.; Prodana, M.; Bastos, A.C.; Van Groenigen, J.W.; Hungate, B.A.; Verheijen, F. Biochar boosts tropical but not temperate crop yields. Environ. Res. Lett. 2017, 12, 53001. [Google Scholar] [CrossRef]
  24. Jeffery, S.; Meinders, M.B.J.; Stoof, C.R.; Bezemer, T.M.; van de Voorde, T.F.J.; Mommer, L.; van Groenigen, J.W. Biochar application does not improve the soil hydrological function of a sandy soil. Geoderma 2015, 251–252, 47–54. [Google Scholar] [CrossRef]
  25. Atkinson, C.J.; Fitzgerald, J.D.; Hipps, N.A. Potential mechanisms for achieving agricultural benefits from biochar application to temperate soils: A review. Plant Soil 2010, 337, 1–18. [Google Scholar] [CrossRef]
  26. Hardie, M.; Clothier, B.; Bound, S.; Oliver, G.; Close, D. Does biochar influence soil physical properties and soil water availability? Plant Soil 2014, 376, 347–361. [Google Scholar] [CrossRef]
  27. Ruysschaert, G.; Nelisesen, V.; Postma, R.; Bruun, E.; O’Toole, A.; Hammond, J.; Rödger, J.M.; Hylander, E.; Kihlberg, T.; Zwart, K.; et al. Field applications of pure biochar in the North Sea region and across Europe. In Biochar in European Soils and Agriculture: Science and Practice; Schackley, S., Ruysschaert, G., Zwart, K., Glaser, B., Eds.; Routledge: London, UK, 2016. [Google Scholar]
  28. Pérez Martínez, E.Y. Evaluación de un carbonizador portátil de bajo costo en la valorización de residuos biomásicos lignocelulósicos, Licenciateship; Carrera de Ingeniería Ambiental, Instituto Tecnológico de Costa Rica: Provincia de Cartago, Costa Rica, 2015. [Google Scholar]
  29. Ajayi, A.E.; Horn, R. Modification of chemical and hydrophysical properties of two texturally differentiated soils due to varying magnitudes of added biochar. Soil Tillage Res. 2016, 164, 34–44. [Google Scholar] [CrossRef]
  30. Wang, Y.; Villamil, M.B.; Davidson, P.C.; Akdeniz, N. A quantitative understanding of the role of co-composted biochar in plant growth using meta-analysis. Sci. Total Environ. 2019, 685, 741–752. [Google Scholar] [CrossRef] [PubMed]
  31. Bertsch, F. La fertilidad de los suelos y su manejo; Asociacion Costarricense de la Ciencia del Suelo (ACCS): San José, Costa Rica, 1995. [Google Scholar]
  32. Gee, G.W.; Or, D. Particle Size Analysis. In Methods of Soil Analysis. Part 4, Physical Methods; Book Series No. 5; Dane, J.H., Topp, G.C., Eds.; Soils Science Society of America: Madison, WI, USA, 2002; pp. 255–294. [Google Scholar]
  33. Durner, W.; Iden, S.C.; von Unold, G. The integral suspension pressure method (ISP) for precise particle-size analysis by gravitational sedimentation. Water Resour. Res. 2017, 53, 33–48. [Google Scholar] [CrossRef]
  34. Zimmermann, I.; Horn, R. Impact of sample pretreatment on the results of texture analysis in different soils. Geoderma 2020, 371, 114379. [Google Scholar] [CrossRef]
  35. Sumner, M.E.; Miller, W.P. Cation Exchange Capacity and Exchange Coefficients. In Methods of Soil Analysis Part 3: Chemical Methods; SSA Book Series 5; Sparks, D.L., Ed.; Soil Science Society of America: Madison, WI, USA, 1996; pp. 1201–1230. [Google Scholar]
  36. Bertsch, F.; Ostinelli, M. Standard Operating Procedure for Soil Total Carbon: Dumas Dry Combustion Method; Food and Agriculture Organization of the United Nations, Global Soil Laboratory Network GLOSOLAN: Rome, Italy, 2019. [Google Scholar]
  37. Masís-Meléndez, F.; Segura-Chavarría, D.; García-González, C.A.; Quesada-Kimsey, J.; Villagra-Mendoza, K. Variability of Physical and Chemical Properties of TLUD Stove Derived Biochars. Appl. Sci. 2020, 10, 507. [Google Scholar] [CrossRef] [Green Version]
  38. van Genuchten, M.T. A closed-form equation for predicting the hydraulic conductivity of unsaturated soils. Soil Sci. Soc. Am. J. 1980, 44, 892–898. [Google Scholar] [CrossRef] [Green Version]
  39. AG Boden. Bodenkundliche Kartieranleitung, 5. Aufl.; E. Schweizerbart´sche Verlagsbuchhandlung: Stuttgart, Germany, 2005. [Google Scholar]
  40. Hartge, K.H.; Horn, R. Essential Soil Physics; Schweizerbart Science Publishers: Stuttgart, Germany, 2016. [Google Scholar]
  41. Reynolds, W.D.; Bowman, B.T.; Drury, C.F.; Tan, C.S.; Lu, X. Indicators of good soil physical quality: Density and storage parameters. Geoderma 2002, 110, 131–146. [Google Scholar] [CrossRef]
  42. Hutcheson, G.D. Data analysis using R and the R-commander (Rcmdr); Manchester University: Manchester, UK, 2013. [Google Scholar]
  43. Montiel, M.; Jiménez, V.M.; Guevara, E. Caracterización anatómica ultraestructural de las variantes “Atlántica”, “Sur” y “Cebolla” del bambú, Guadua angustifolia (Poaceae: Bambusoideae), en Costa Rica. Rev. Biol. Trop. 2006, 54, 1–12. [Google Scholar] [CrossRef]
  44. Osorio, L.; Trujillo, E.; Lens, F.; Ivens, J.; Verpoest, I.; Van Vuure, A.W. In-depth study of the microstructure of bamboo fibres and their relation to the mechanical properties. J. Reinf. Plast. Compos. 2018, 37, 1099–1113. [Google Scholar] [CrossRef]
  45. Eustáquio Moreira, L.; Seixas, M.; Ghavami, K. Lightness and efficiency of structural bars: Comparison of bamboo, steel and wood bars under compression. In Proceedings of the 18th International Conference on Non-Conventional Materials and Technologies ”Construction Materials & Technologies for Sustainability”, Nairobi, Kenya, 24–26 July 2019. [Google Scholar]
  46. Van Genuchten, M.V.; Leij, F.J.; Yates, S.R. The RETC Code for Quantifying the Hydraulic Functions of Unsaturated Soils; ResearchGate: Berlin, Germany, 1991. [Google Scholar]
  47. Diatta, A.A.; Fike, J.H.; Battaglia, M.L.; Galbraith, J.M.; Baig, M.B. Effects of biochar on soil fertility and crop productivity in arid regions: A review. Arab. J. Geosci. 2020, 13, 595. [Google Scholar] [CrossRef]
  48. Guo, L.; Yu, H.; Kharbach, M.; Zhang, W.; Wang, J.; Niu, W. Biochar Improves Soil-Tomato Plant, Tomato Production, and Economic Benefits under Reduced Nitrogen Application in Northwestern China. Plants 2021, 10, 759. [Google Scholar] [CrossRef] [PubMed]
  49. Laird, D.A.; Rogovska, N.; Garcia-Perez, M.; Collins, H.; Streubel, J.; Smith, M. Pyrolysis and biochar-opportunities for distributed production and soil quality enhancement. In Sustainable Alternative Fuel Feedstock Opportunities, Challenges and Roadmaps for Six U.S. Regions; Newell, K., Ed.; United States Department of Agriculture (USDA): Washington, DC, USA, 2011. [Google Scholar]
  50. Yargicoglu, E.N.; Sadasivam, B.Y.; Reddy, K.R.; Spokas, K. Physical and chemical characterization of waste wood derived biochars. Waste Manag. 2015, 36, 256–268. [Google Scholar] [CrossRef] [PubMed]
  51. Fidel, R.B.; Laird, D.A.; Thompson, M.L.; Lawrinenko, M. Characterization and quantification of biochar alkalinity. Chemosphere 2017, 167, 367–373. [Google Scholar] [CrossRef] [PubMed] [Green Version]
  52. Yuan, J.H.; Xu, R.K.; Qian, W.; Wang, R.H. Comparison of the ameliorating effects on an acidic ultisol between four crop straws and their biochars. J. Soils Sediments 2011, 11, 741–750. [Google Scholar] [CrossRef]
  53. Cornelissen, G.; Martinsen, V.; Shitumbanuma, V.; Alling, V.; Breedveld, G.; Rutherford, D.; Sparrevik, M.; Hale, S.; Obia, A.; Mulder, J. Biochar Effect on Maize Yield and Soil Characteristics in Five Conservation Farming Sites in Zambia. Agronomy 2013, 3, 256–274. [Google Scholar] [CrossRef] [Green Version]
  54. Krismawati, A.; Arifin, Z.; Hermanto, C.; Tafakresnanto, C. Application of biochar to improve maize performance on volcanic and sediment soil based parent materials in dry land. In Proceedings of the 1st International Conference on Sustainable Tropical Land Management, Bogor, Indonesia, 16–18 September 2020; Volume 648. [Google Scholar] [CrossRef]
  55. Novak, J.M.; Busscher, W.J.; Laird, D.L.; Ahmedna, M.; Watts, D.W.; Niandou, M.A. Impact of Biochar Amendment on Soil Fertility of a Southeastern Coastal Plain Soil. Soil Sci. 2009, 174, 105–112. [Google Scholar] [CrossRef] [Green Version]
  56. Liang, B.; Lehmann, J.; Solomon, D.; Kinyangi, J.; Grossman, J.; O’Neill, B.; Skjemstad, J.O.; Thies, J.; Luizão, F.J.; Petersen, J.; et al. Black carbon increases cation exchange capacity in soils. Soil Sci. Soc. Am. J. 2006, 70, 1719–1730. [Google Scholar] [CrossRef] [Green Version]
  57. Masiello, C.A.; Dugan, B.; Brewer, C.E.; Spokas, K.; Novak, J.M.; Liu, Z.; Sorrenti, G. Biochar effects on soil hydrology. In Biochar for Environmental Management Science, Technology and Implementation; Johannes Lehmann, S.J., Ed.; Routledge: London, UK, 2014; pp. 541–560. [Google Scholar]
  58. Ajayi, A.E.; Horn, R. Comparing the potentials of clay and biochar in improving water retention and mechanical resilience of sandy soil. Int. Agrophysics 2016, 30, 391–399. [Google Scholar] [CrossRef] [Green Version]
  59. Zhang, J.; Amonette, J.E.; Flury, M. Effect of biochar and biochar particle size on plant-available water of sand, silt loam, and clay soil. Soil Tillage Res. 2021, 212, 104992. [Google Scholar] [CrossRef]
  60. Głąb, T.; Palmowska, J.; Zaleski, T.; Gondek, K. Effect of biochar application on soil hydrological properties and physical quality of sandy soil. Geoderma 2016, 281, 11–20. [Google Scholar] [CrossRef]
  61. Castellini, M.; Giglio, L.; Niedda, M.; Palumbo, A.D.; Ventrella, D. Impact of biochar addition on the physical and hydraulic properties of a clay soil. Soil Tillage Res. 2015, 154, 1–13. [Google Scholar] [CrossRef]
  62. Reynolds, W.D.; Drury, C.F.; Tan, C.S.; Fox, C.A.; Yang, X.M. Use of indicators and pore volume-function characteristics to quantify soil physical quality. Geoderma 2009, 152, 252–263. [Google Scholar] [CrossRef]
  63. Reynolds, W.D.; Drury, C.F.; Yang, X.M.; Tan, C.S. Optimal soil physical quality inferred through structural regression and parameter interactions. Geoderma 2008, 146, 466–474. [Google Scholar] [CrossRef]
  64. Chen, C.; Wang, R.; Shang, J.; Liu, K.; Irshad, M.K.; Hu, K.; Arthur, E. Effect of Biochar Application on Hydraulic Properties of Sandy Soil under Dry and Wet Conditions. Vadose Zone J. 2018, 17, 180101. [Google Scholar] [CrossRef] [Green Version]
Figure 1. Carbonization kilns designed at the Costa Rica Institute of Technology for biochar production: (a) pyrolysis chambers of three kilns (behind) and halved bamboo stems (at left); (b) reactor during production.
Agronomy 11 02052 g001
Figure 2. Experimental setup of pots in the greenhouse: (a) Scheme of the random block design of each pot replicate where SL refers to sandy loam soil, SiL refers to silt loam soil and numbers 0, 1, 2.5, and 5 refer the application rates (%-dry weight) of bamboo biochar; (b) pots in position and their irrigation system.
Agronomy 11 02052 g002aAgronomy 11 02052 g002b
Figure 3. Particle size distribution of the bamboo biochar (squares and continuous blue line), and the soil materials: sandy loam (circles with dashed red line) and silt loam (triangles with dotted green line).
Agronomy 11 02052 g003
Figure 4. Scanning electron microscope (SEM) analysis (bar 300 µm × 300 magnification) to characterize porosity composition of the different bamboo biochar particle sizes of (a) 0.063 mm, (b) 0.125 mm, (c) 0.250 mm, (d) 0.500 mm, (e) 1.0 mm, and (f) >2 mm.
Agronomy 11 02052 g004
Figure 5. Water retention curve for the silt loam (SiL) and sandy loam (SL) materials and their mixtures with 1, 2.5, and 5 wt.% bamboo biochar. Observed data were fitted with the van Genuchten–Mualem model by means of the RETC software [46].
Agronomy 11 02052 g005
Figure 6. Soil Water Storage Index (SWSCI) and Air Capacity Index (ACI) for the silt loam (SiL) and sandy loam (SL) mixtures. The horizontal continuous line represents limit index values suggested by Reynolds et al. [41].
Agronomy 11 02052 g006
Figure 7. Average weight yield of tomatoes per plant for three biochar treatments of the silty loam (SiL) and sandy loam (SL), according to tomato size class, harvested in eight weeks. Tomatoes were classified as class A (>200 g), class B (100–200 g), and class C (<100 g). Continuous black line represents the total tomato yield for each treatment. Average fruit quantity per plant is reported in the x axis. Different letters indicate significant differences (p < 0.05).
Agronomy 11 02052 g007aAgronomy 11 02052 g007b
Table 1. Doses of water-soluble fertilizer applied to 56 pots during 16 weeks. The same dose schedule was applied weekly during four weeks.
FertilizerDoses per Week During Periods of Four Weeks
kg
Total Dose
kg
1–45–89–1213–16
12:42:120.0000.0200.0000.0000.080
10:5:250.1000.2800.8400.7507.880
Magnesium sulfate0.0400.1600.2200.2552.700
Potassium sulfate0.0000.0800.1400.1501.480
Calcium nitrate0.0330.5100.4900.5006.132
The four-week dose is calculated by multiplying the weekly dose by 4.
Table 2. Elemental analysis, specific surface area (SSA), and skeletal density (SD) of the biochar after sieving and granulometric classification with biochar particle size (BPS) distribution ranging 3.5 to 0.063 mm.
BPS (mm)CHONSAshC:NO:CH:CSSASDBDpH
% m2/gg/cm3
>2.0057.5 a5.1 a19.3 a0.4 a7.2 a10.4 a133.6 ab0.3 a1.1 a1.4 *1.4 9.7
1.0038.1 b4.3 a42.9 a0.4 a6.8 a7.5 b108.9 ab0.9 a1.4 a0.8 *1.6
0.5048.6 a4.0 a35.9 a0.3 a7.4 a9.7 ab135.0 ab0.7 a1.1 a0.4 *1.40.29 ± 0.01
0.2558.1 a4.9 a22.1 a0.4 a5.8 a8.7 ab159.4 b0.3 a1.0 a0.3 *1.5
0.12569.5 c4.8 a23.1 a0.5 ab7.0 a9.9 ab128.7 ab0.4 a1.1 a1.0 *1.5
0.06343.4 a4.2 a32.3 a0.6 b5.8 a13.7 c76.0 a0.6 a1.2 a1.4 *1.5
C: total carbon; H: hydrogen; O: oxygen; N: nitrogen; S: sulfur; C:N: carbon-to-nitrogen ratio; O:C oxygen-to-carbon molar ratio; H:C: hydrogen-to-carbon molar ratio; SSA: specific surface area based on the multipoint BET surface area method; SD: skeletal density calculated by helium pycnometry; BD: bulk density. * result below the limit of detection, probably suggesting macroporosity domain. Variables with same letters are not significantly different (p < 0.05).
Table 3. Physical and chemical properties of biochar and the soil treatments silt loam (SiL) and sandy loam (SL) with 0, 1, 2.5 and 5% biochar dosage.
PropertiesUnitsTreatments
SiL0SiL1SiL2.5SiL5SL0SL1SL2.5SL5
pH (H2O) 6.16.16.46.35.05.35.25.6
Aciditycmol(+)/L0.130.120.110.110.740.310.480.17
Ca2+11.911.412.111.612.113.712.812.6
Mg2+1.71.71.81.91.51.71.71.6
K+1.11.61.72.01.71.71.92.5
ECEC14.914.815.715.616.117.416.916.8
CEC8.3 ± 0.2 a8.1 ± 0.2 a8.9 ± 0.3 b8.7 ± 0.1 ab10.8 ± 0.2 c11.0 ± 0.2 c11.1 ± 0.1 c10.8 ± 0.1 c
AS%%0.90.80.70.75231
ECmS/cm0.90.50.50.81.41.41.00.9
AWCcm3/100 cm335.3 ± 1.9 a36.0 ± 3.2 a26.4 ± 3.5 b27.9 ± 0.6 b22.0 ± 2.5 cb21.1 ± 0.6 c24.1 ± 1.5 cb25.8 ± 2.0 cb
AC16.3 ± 2.4 a15.5 ± 4.1 a14.6 ± 3.9 a15.1 ± 0.9 a18.4 ± 1.9 a25.3 ± 2.0 b26.3 ± 1.3 b25.5 ± 3.6 b
FC58.1 ± 4.2 ab59.2 ± 3.9 ab56.1 ± 3.5 a64.5 ± 4.9 b39.4 ± 3.4 c40.2 ± 3.5 c41.9 ± 1.5 c43.0 ± 3.9 c
BDg/cm30.8 ± 0.07 a0.8 ± 0.08 a0.8 ± 0.07 a0.7 ± 0.05 a0.8 ± 0.05 b0.8 ± 0.05 b0.9 ± 0.01 b0.8 ± 0.06 b
Sand%36 56
Silt59 35
Clay4 8
Textural class Silt loam (SiL)Sandy loam (SL)
AS%: acid saturation percentage; EC: electrical conductivity; ECEC: effective cation exchange capacity; CEC: cation exchange capacity; AWC: available water content; AC: air capacity; FC: field capacity; BD: bulk density. Variables with same letters are not significantly different (p < 0.05).
Table 4. Soil hydraulic fitted parameters based on the van Genuchten–Mualem model (m = 1 − 1/n), shown in Figure 5.
TreatmentKs θ s α nR2
cm/Daycm3/cm3
SiL0655.00.713380.022101.526980.9960
SiL1635.20.736940.025681.490740.9930
SiL2.5480.20.697330.023741.708730.9960
SiL5747.00.691880.010501.885840.9840
SL0550.20.582930.093831.348210.9850
SL1968.70.699770.141821.420130.9900
SL2.5832.60.672710.119941.350600.9870
SL51086.30.718480.130041.374400.9900
Ks: saturated hydraulic conductivity; α, n, θs: fitted parameters; R2: correlation coefficient.
Publisher’s Note: MDPI stays neutral with regard to jurisdictional claims in published maps and institutional affiliations.

