Article

Effects of Dry Sourdough on Bread-Making Quality and Acrylamide Content

by
Georgiana Gabriela Codină
*,
Cristina Sarion
and
Adriana Dabija
Faculty of Food Engineering, Stefan cel Mare University of Suceava, 720229 Suceava, Romania
*
Author to whom correspondence should be addressed.
Agronomy 2021, 11(10), 1977; https://doi.org/10.3390/agronomy11101977
Submission received: 27 August 2021 / Revised: 20 September 2021 / Accepted: 28 September 2021 / Published: 30 September 2021

Abstract

:
The aim of this study was to investigate the possibility of reducing the acrylamide content of bread samples obtained from wheat flour with a high extraction rate by adding a dry sourdough (SD) into the bread recipe. According to the data obtained, compared to the control sample the acrylamide content was significantly reduced (p < 0.05) by more than 50% for the bread samples in which low levels of SD of 1–3% were added to wheat flour. More so, due to the fact that SD affects bread quality, its technological effects on bread making have been investigated. The dough’s rheological properties (mixing and pasting using Mixolab, extension using Alveograph, fermentation using Rheofermentometer), falling number value, and bread quality parameters (loaf volume, porosity, elasticity, color, textural and sensory qualities) have been investigated. In general, SD addition caused a weakening effect on wheat flour dough, an increase in the total volume of CO2 produced during fermentation and a decrease in the falling number value. On bread quality, SD addition improved bread physical characteristics, darkened the bread crumb and crust, decreased the textural parameters (firmness, gumminess, cohesiveness and resilience) and improved the bread sensory characteristics for the samples with the addition of 1–2% SDto wheat flour.

1. Introduction

Acrylamide is one of the most common harmful compounds detected in a wide range of foods containing cooked and fried carbohydrates, such as breakfast cereals, potato chips, coffee, meat products, French fries, cookies, pastries, and bakery products [1,2,3,4]. According to the Food and Agriculture Organization of the United Nations (FAO/WHO, 2002), the average intake of acrylamide in the diet of people in developed countries was estimated to be 0.3–0.8 µg/AA/kg body weight per day, but actual consumption is likely to exceed this value [5].
The concentration of acrylamide in processed foods has become a very serious health problem, as it has been shown to be genotoxic, carcinogenic, toxic to the reproductive system, neurotoxic and to cause DNA damage [6,7,8,9]. A wide range of researchers representing national food safety authorities, academia and food producers have sought to better understand the mechanisms of acrylamide formation and to find ways to minimize its formation in food [3].
Despite the fact that bread contains relatively low levels of acrylamide, being a basic element of the diet in many regions of the world, it contributes about 25% of the total dietary intake of acrylamide [10]. Reducing acrylamide levels in bread thus remains a very important issue [6]. Acrylamide is a carcinogenic compound formed mostly from the Maillard reaction that involves the amino acid asparagine and reducing sugars during the process of baking bread at temperatures above 120 °C [1,3,11].
As dietary exposure to acrylamide has been recognized as a major health problem, various strategies to reduce the level of acrylamide in food have been investigated. Our research was focused on two main possibilities for reducing the level of acrylamide: (1) avoiding the formation of acrylamide in foods (interventions in raw materials, elimination of acrylamide precursors or inhibition of the Maillard reaction); (2) removal of acrylamide after generation, which can be achieved by conventional and emerging techniques. Practice has shown that a combination of these methods is more effective than either performed individually [8,12].
Several methods (physical, chemical, biological) for reducing acrylamide levels in foods with the purpose of reducing its precursors, impacting the raw material, modifying manufacturing recipes (adding ingredients that could reduce the content of acrylamide) have been potentially explored, with various recommendations on processing parameters (i.e., temperature and high temperature exposure time). However, some of these methods cannot be practiced due to the need for high amounts of energy, expensive equipment and harmful effects on the nutritional quality of food. It is not easy for food industry producers to take an approach which balances both efficiency and cost. In this regard, the application of microorganisms, such as lactic acid bacteria (LAB) and probiotics, has been considered for use as a pre-process and post-process attenuation tool [4,7,13].
Utilizing sourdough in baking technology is an old, traditional practice, as sourdough is considered a natural starter for the manufacture of bakery products, and an alternative to baking yeast and chemical fermentation [14,15]. Modern bakeries use sourdough to improve the sensory, nutritional and functional properties of finished products [2,10]. It has been demonstrated that the use of sourdough has led to improved flavor, structure and stability and increased the shelf life of bakery products [16,17].
Some studies show that acidic dough increases the antioxidant capacity and bioavailability of minerals by enzymatic degradation of phytic acid. It also reduces gluten immunotoxicity in people with celiac disease and delays starch digestion, inducing a low glycemic response and reducing the formation of acrylamide [6,7,15,18].
Sourdough is defined as a dough consisting of wheat flour and/or rye flour, water and sometimes salt, fermented with lactic acid bacteria (LAB) and yeast, microorganisms that give it its acidifying and leavening capabilities [1,19]. Yeasts act primarily as leavening agents, while lactic acid bacteria mainly contribute to acidification and the production of flavors and other metabolic compounds in bakery products [10]. From a numerical point of view, lactic acid bacteria are dominant, the ratio between them and yeasts being about 100:1 [5]. Symbiotic relationships are created between these microorganisms, while the developed microbiome has superior properties in a single bioprocess, such as stability, functional robustness and the ability to simultaneously involve several different microbial interactions.
The multiple effects of alcoholic and lactic fermentations in the dough ensure the loosening of the dough and the bread, and the byproducts of fermentation influence the taste and aroma of the finished product.
The most commonly used lactic acid bacteria with conclusive results in reducing the level of acrylamide in bakery products belong to the genera Lactobacillus (Lactobacillus brevis, Lactobacillus rhamnosus, Lactobacillus plantarum, Lactobacillus casei, Lactobacillus lactis) [2,5,16,17,20]. Acrylamide levels in bakery products can be reduced up to 85% by using acid dough [14]. Research has shown that the potential to reduce the acrylamide content of lactic acid bacteria in the dough is specific to the strain, with the best results obtained with the species Lactobacillus plantarum, Lactobacillus rhamnosus, Pediococcus acidilactici [3,4,6,7,10]. In these species of lactic bacteria, the chemical composition of the cell wall was studied and a positive relationship was observed between their binding capacity and the acrylamide level. It seems that teichoic acid compounds, which are part of peptidoglycan group, are responsible for acrylamide binding. Moreover, some functional groups of peptidoglycan, such as amide, carboxyl, arene, polysaccharides and amines, were involved in acrylamide binding in bacterial cell walls [21]. The ability to bind acrylamide and to use it as a carbon source depends on the genus and species of LAB. However, other factors such as the pH of the dough system, strain carbohydrate fermentative ability can affect the capacity of LAB to reduce acrylamide. A lower pH and a higher carbohydrate metabolism increase LAB ability to reduce acrylamide formation in bread. For example, Lactobacillus brevis presented a lower carbohydrate fermentative ability, whereas Lactobacillus plantarum and Pediococcus pentosaceus presented a higher one [6].
Previous studies have shown a decrease in acrylamide content in all bakery products obtained with sourdough compared to bread obtained only with yeast [10]. A first explanation of these results was the positive correlation between the acrylamide content and the pH of the dough [12]. Other authors suggest that cell wall carbohydrates, mainly peptidoglycan (PGN), were the main components responsible for the binding of acrylamide by the lactic acid bacterial cell. PGN is a major component of the bacterial cell wall, representing approximately 90% of the cell wall mass [9,20]. It has also been reported that acid dough fermentation reduces free asparagine in dough and acrylamide content in bread [7].
In conclusion, reducing the level of acrylamide is a challenge for processors in the bakery industry, and the use of sourdough proves to be an efficient and inexpensive strategy because the fermentation process can be easily adapted to a technological line of bread production. In addition, sourdough is accessible to producers and safe for consumers [10].
The paper proposes the use of dry sourdough as a natural ingredient to reduce the acrylamide content from bread samples and also to improve the quality of the bread products. Furthermore, the effect of dry sourdough on bread making has been evaluated by analyzing the impact of sourdough addition on the rheological properties of dough mixing, extension and pasting.

2. Materials and Methods

2.1. Materials

Wheat flour of a high extraction rate (harvest 2020) was provided by Pambac SA Company (Bacău, Romania). The dry sourdough (SD) provided by Enzymes & Derivates S.A. Company (Neamt, Romania) was obtained from wheat flour through fermentation in the presence of the flour’s own microorganisms, including its own active LAB, which was used in a powder form. The commercial dry sourdough was produced by AIT Ingredients (Soufflet Group, Saint-Maximin, France) with the commercial name Grande Sélection Ble N◦1. The product’s technical sheet did not mention the active LAB species present in the SD but according to the international literature six genera dominate LAB sourdough obtained through wheat fermentation: Lactobacillus, Enterococcus, Leuconostoc, Lactococcus, Weissella and Pediococcus. From those, the most prevalent species are: Lactobacillus plantarum, Weissella cibaria, Leuconostoc citreum and Leuconostoc pseudomesenteroides [22] The wheat flour was analyzed according to international standard methods and presented the following characteristics: 12.30 g/100 g moisture (according to the International Association for Cereal Science and Technology—ICC 110/1); 1.36 g/100 g ash (ICC 104/1); 25.2 g/100 g wet gluten (ICC 106/1); falling number 334 s (ICC 107/1).

2.2. Dough Rheological Properties Analysis

The dough rheological parameters for mixing and pasting properties were determined with the Mixolab device (Chopin, Tripette et Renaud, Paris, France) according to ICC 173/1. The analyzed parameters were: water absorption (WA), dough development time (DT), dough stability (ST) and torques related to protein weakening (C2), starch gelatinization phase (C3), stability of hot starch paste (C4) and to the final starch paste viscosity after cooling at 50 °C (C5).
The dough rheological parameters for extension were determined with the Alveograph device (Chopin Technologies, Villeneuve-la-Garenne, France) according to ICC 121 method at constant hydration to a 14% moisture basis. The analyzed parameters were: maximum pressure (P), index of swelling (G), dough extensibility (L), baking strength (W) and configuration ratio of the Alveograph curve (P/L).
The dough rheological properties during fermentation were determined with the (Chopin Rheo, type F4, Villeneuve-La-Garenne, France) according to AACC 89–01.01 method. The analyzed parameters were: maximum height of gaseous production (H’m), volume of the gas retained in the dough at the end of the test (VR), total CO2 volume production (VT), and retention coefficient (CR).
The pH values of the dough samples were analyzed by introducing the electrode of a HQ30d portable pH Meter (HACK, Loveland, CO, USA) into the probe sample. The falling number value, which is a measure of α-amylase activity in wheat samples, was determined with the Falling Number device (PerkinElmer’s, Hägersten, Sweden) according to ICC standard method 107/1.

2.3. Bread Quality Parameters Analysis

For bread making, the following ingredients were used: wheat flour as basis and 2.5% Saccharomyces cerevisiae type yeast in a compressed form, 1.3% salt, 2.5% bakery improver which consists of a mix from vital wheat gluten, diacetyl tartaric acid ester with mono and diglycerides, ascorbic acid and L-cysteine, with respect to the amount of wheat flour used in order to obtain a wheat flour with good characteristics for bread making. Water was incorporated into the dough recipe according to the water absorption value of the dough samples. The dry sourdough was added to wheat flour at the levels of 1% (SD_1), 2% (SD_2), 3% (SD_3) and 4% (SD_4). The sample with no SD addition was the control sample. The ingredients were mixed to a temperature around of 30 °C for 7–8 min, after which the dough was left to rest for 10 min. After dough division in order to obtain 300 g of bread, each the sample was proofed for 50–60 min at a temperature of 35–39 °C and relative humidity of 66–74%. Finally, the dough was baked for 15–17 min at a temperature of 250 °C.
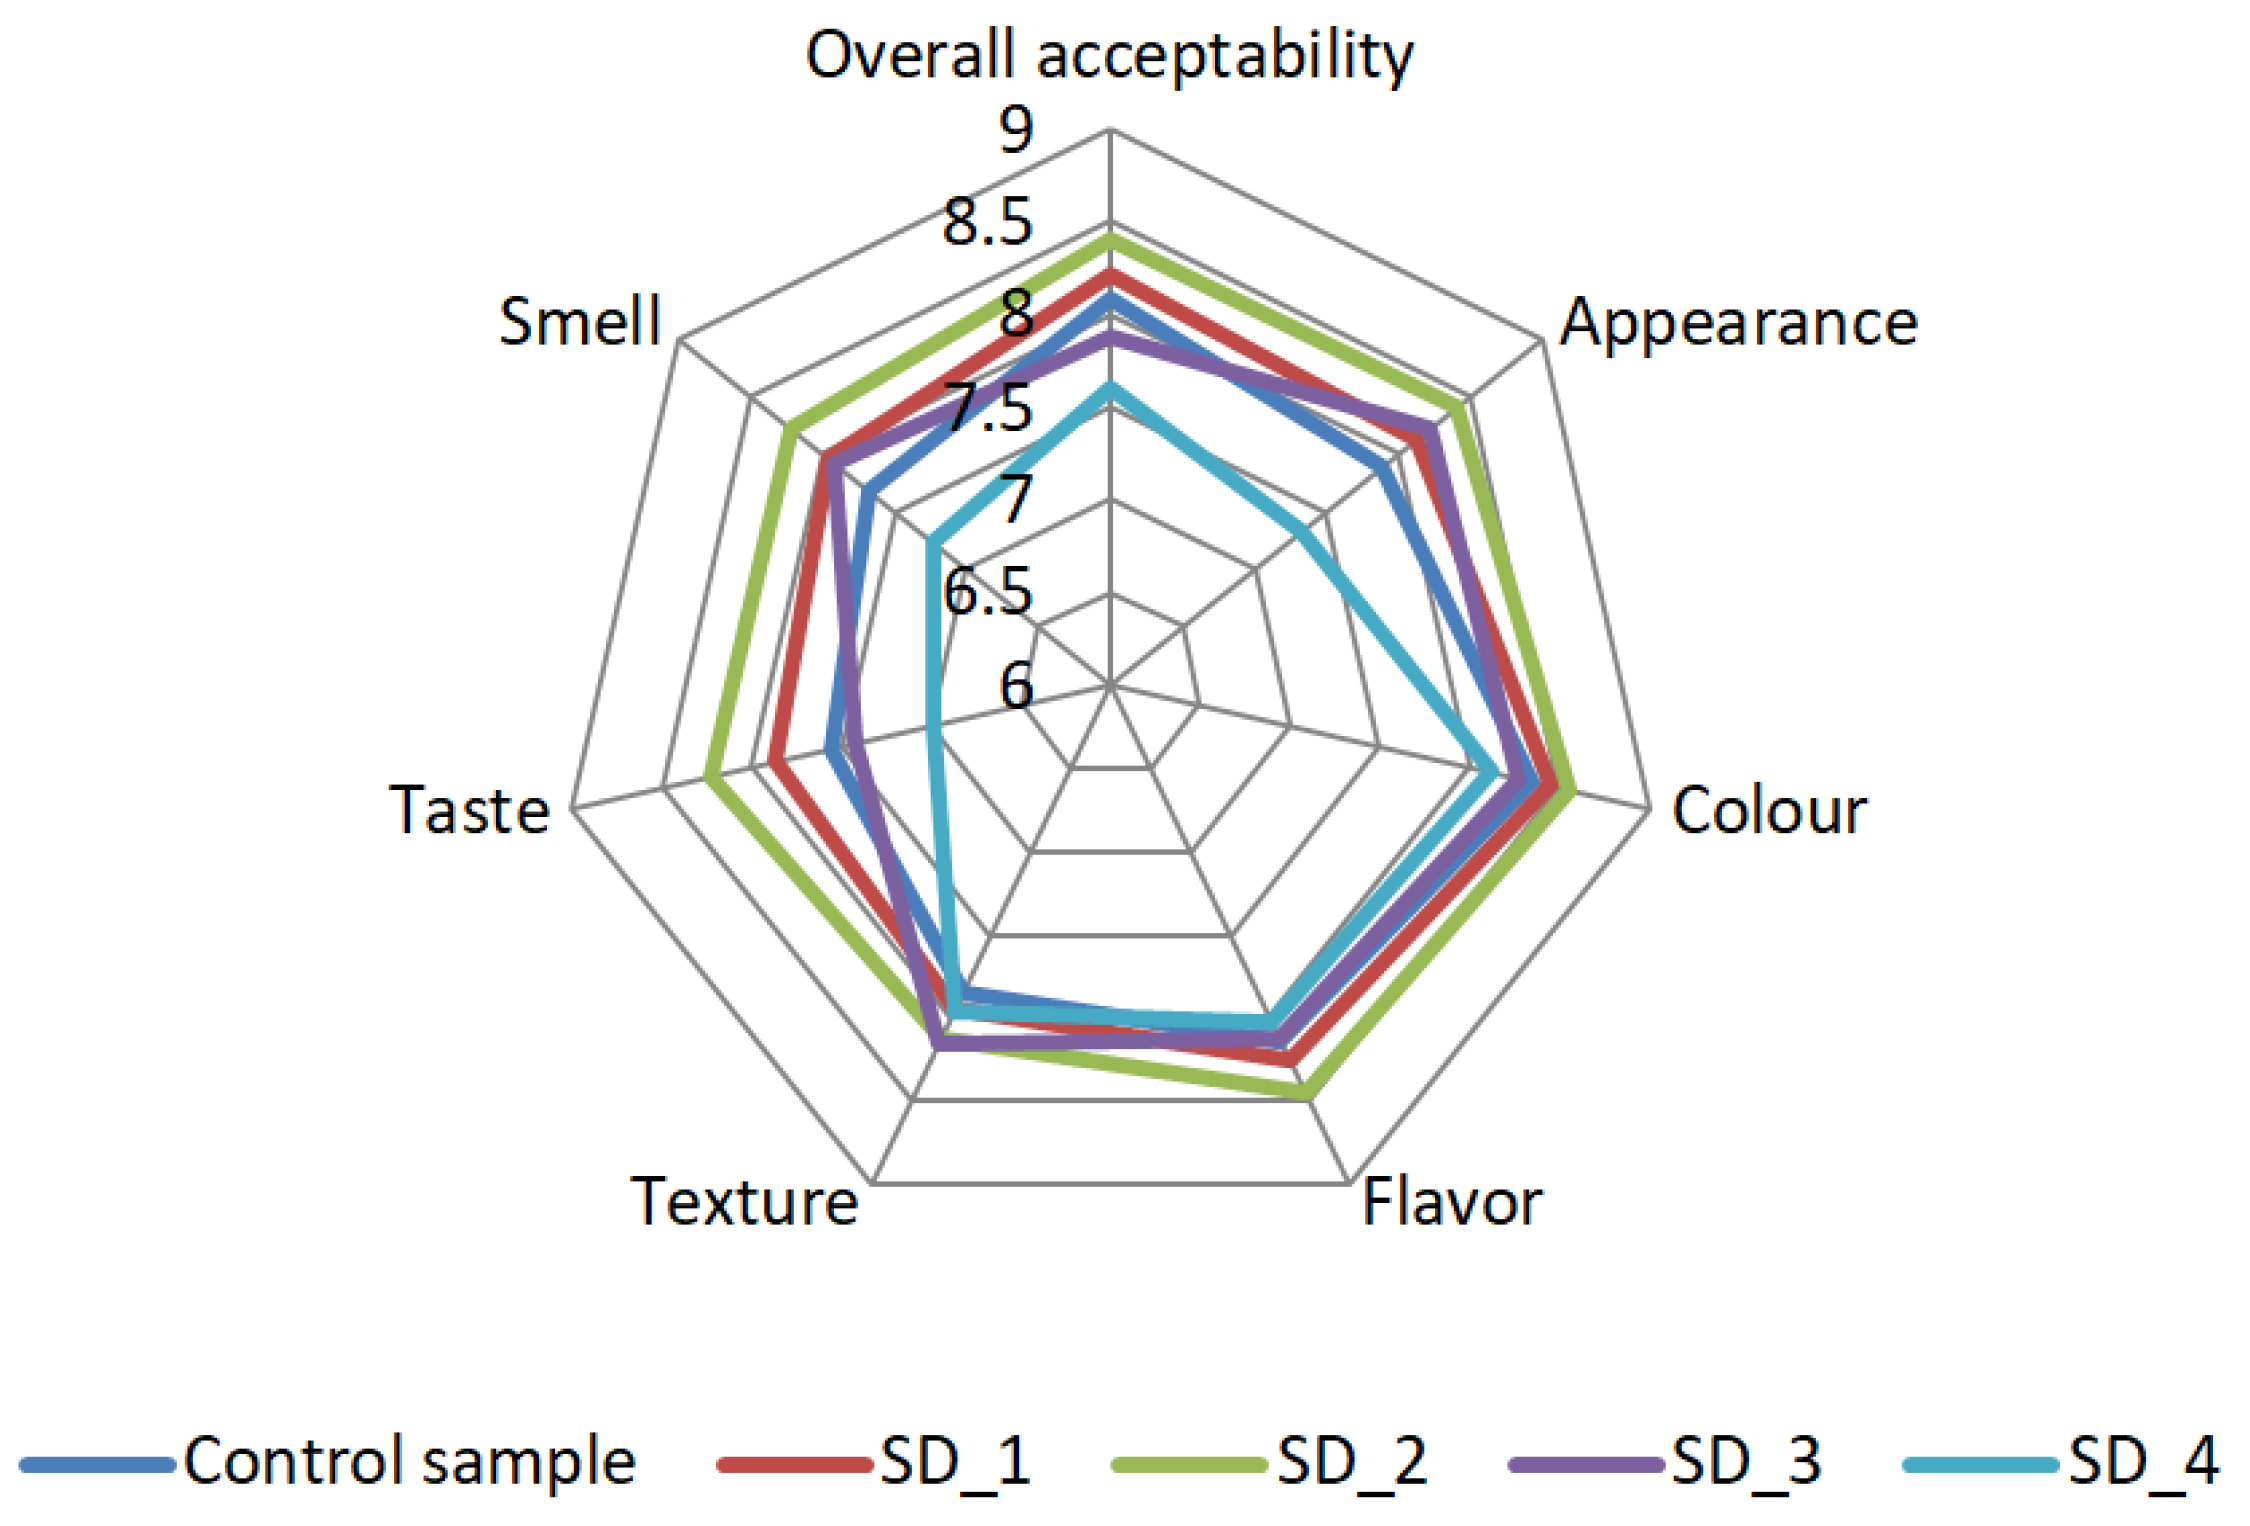
After cooling, the bread samples obtained were analyzed for their physical, textural, color, and sensorial characteristics. The bread physical characteristics (loaf volume, porosity and elasticity) were determined according to the Romanian SR 90: 2007 standard method. The bread color parameters (L*, a*, b*) were analyzed for crumb and crust by using the Konica Minolta CR-400 colorimeter (Tokyo, Japan). The textural parameters of bread samples (firmness, gumminess, cohesiveness and resilience) were determined using the TVT-6700 device (Perten Instruments, Hägersten, Sweden) equipped with a 10 kg load cell. The sensory analysis was conducted by using a 9 point hedonic scale using a panel of 20 semi-trained judges. The following bread sensory characteristics were evaluated: appearance, aroma, taste, color, texture, smell and overall acceptability.
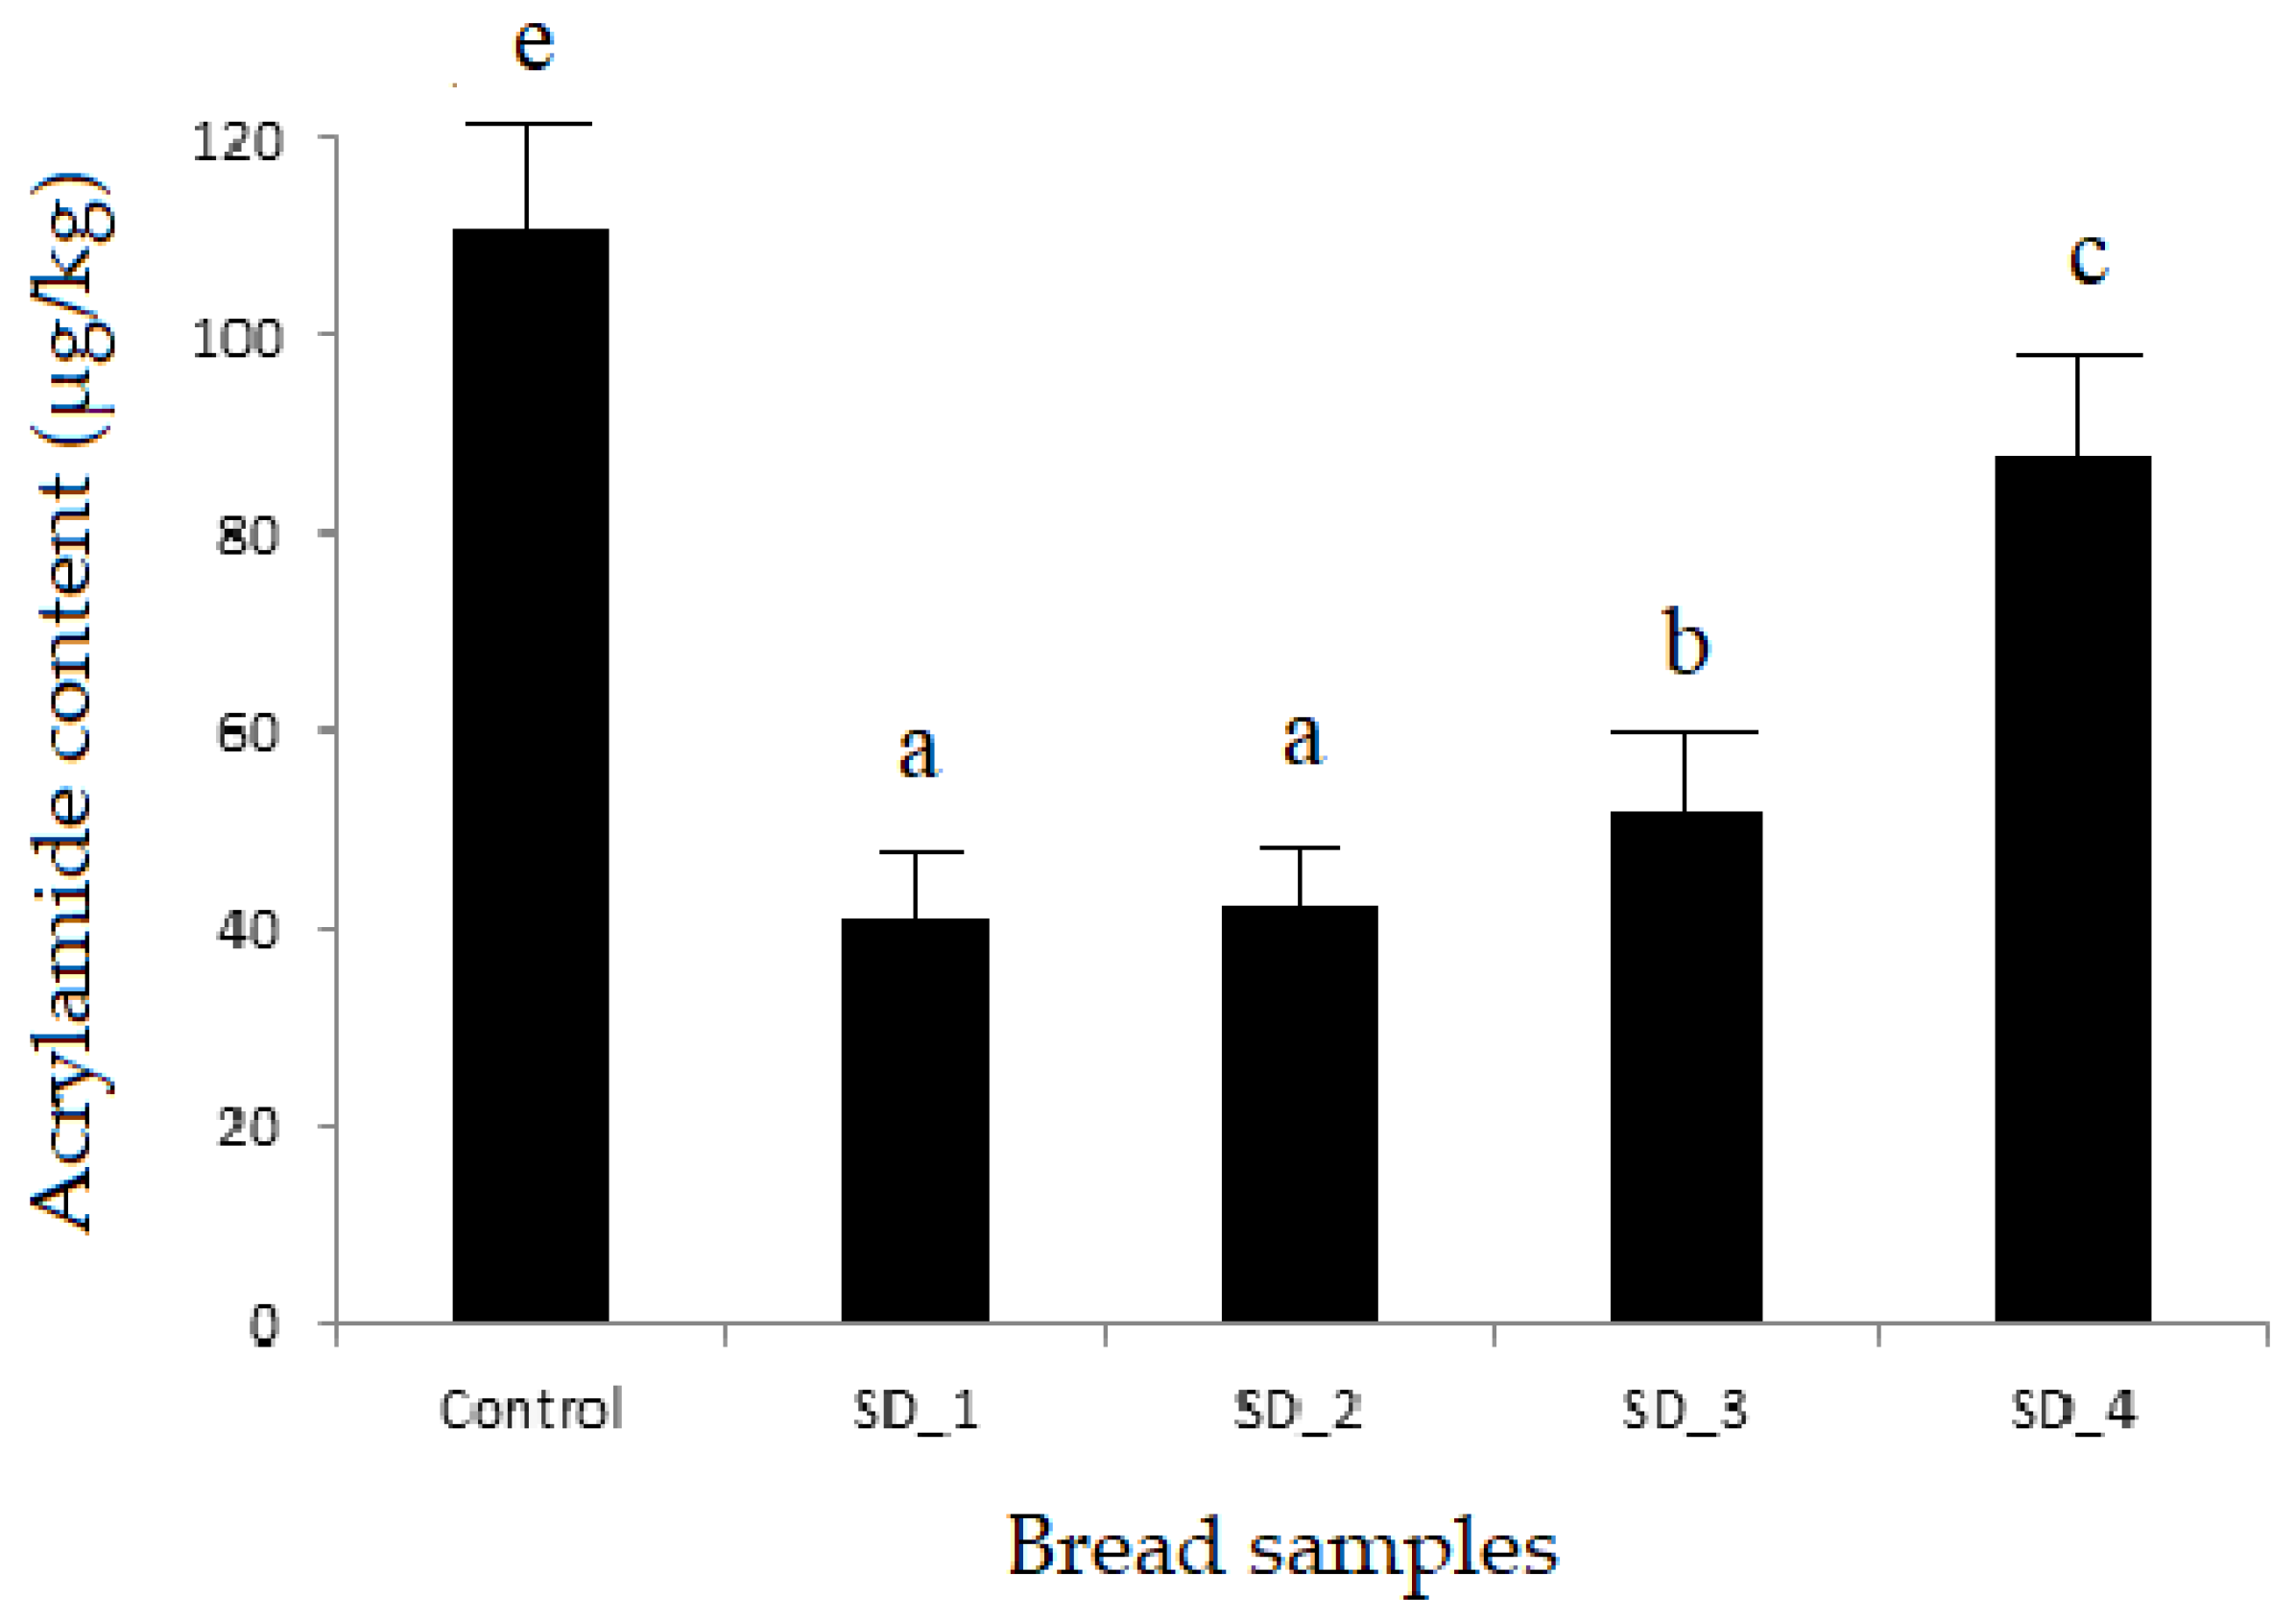
The acrylamide level of bread samples were determined using 5 g of the ground sample, to which 15 mL of acetonitrile was added in a tube. The mixture obtained was homogenized for 30 s in a centrifuge, and after that 15 g of quextrak 1 salt was added, which was homogenized for 1 min by centrifugation. Subsequently, 4 mL of supernatant was taken, to which 15 g of quextrak 2 was added, which was homogenized for 30 s by centrifugation. From this mixture was taken 2 mL of supernatant, which was evaporated under a stream of nitrogen at 50 °C, then the sample was eluted in 0.5 mL of distilled water, with the correction factor of 0.75. The sample was introduced into HPLC equipped with a diode array detector. To determine the concentration of acrylamide of the bread sample, the analytical signal (peak) was integrated and, with the help of the apparatus software, its concentration was determined by extrapolation on the calibration curve. The limits of detection (LOD) and limits of quantification (LOQ) of the HPLC method were of 20 µg/kg and 25 µg/kg, respectively. The results were expressed in µg/kg to 2 decimal places.
The acrylamide contents in the bread samples were determined by LC method with minor changes [23,24,25]. From the stock substance of acrylamide (reference material produced under ISO 17043, manufacturer Agilent, concentration 1000 µg/mL in methanol solvent, storage temperature −18 °C) which was presented in liquid form, a standard working solution was prepared by successive dilutions with Hirschmann Laborgerate single-channel micropipettes until the working solution concentrations of 1000, 500, 300, 100, 50 ng/mL were reached. The working solutions were homogenized with the Vortex homogenizer and prepared on the day of the analysis.
The bread sample, in a minimum quantity of 1 Kg, was finely ground entirely at the Retch GM 300 laboratory mill and from the resulting quantity 5 g were weighed on the Mettler Tolledo technical balance (in a centrifuge tube, manufacturer Corning, with a capacity of 50 mL) over which 15 mL of Acetonitrile was added (99.9% Acetonitrile, HPLC for gradient analysis, filtered to 0.2 micron, manufacturer ThermoFisher Scientific, Waltham, MA, USA). The mixture was homogenized for 30 s with the Vortex homogenizer. Then, we added the Quechers extract salts (composition 4 g MgSO4; 0.5 g NaCl, manufacturer Agilent) which were vigorously mixed for 1 min with the Vortex homogenizer, then centrifuged for 5 min at 5000 RPM with Sanyo Harrier 18/80 centrifuge to decant the sample.
This composition was measured with a single-channel Hirschmann Laborgerate 4 mL supernatant pipette which was placed in 15 mL centrifuge tubes containing other extraction salts (Dispersive SPE 15 mL Fruits & Veg for Pigmented Fruits and Vegetables, composition 400 mg PSA, 400 mg GCB, 1200 mg MgSO4, manufacturer Agilent) and homogenized the mixture again on Vortex for 1 min, then centrifuged for 5 min at 5000 RPM with Sanyo Harrier 18/80 centrifuge.
From the obtained supernatant it was transferred with the single-channel micropipette 1 mL in a glass tube (glass tube), it was introduced in a multichannel evaporator ZIPVAP, (Zanntek Analytical Evaporator, Glas-Col, Terre Haute, IN, USA) set at 50 °C under nitrogen flow (gas purity 5.0) until evaporation at sec.
The next step was to elute the sample in 1 mL of ultrasonically degassed distilled water, followed by homogenization for 30 s at Vortex. The solution obtained (distilled water with the remains on the walls of the test tube) was placed in small bottles with a stopper (vials capacity 2 mL) and placed in the autosampler for analysis.
The HPLC system (manufacturer PerkinElmer, model Series 200, Waltham, MA, USA) has the following chromatographic conditions: Mobile phase—distilled water (degassed by ultrasound); Chromatographic column: manufacturer Thermo Scientific, model: Hypercarb; column dimensions: 50 × 2.1 mm by 5 µm; sample injection volume: 20 µL; loop size: 50 µL; flow: 0.3 mL/min; detection with DAD detector: at 210 nm wavelength with bandwidth 20 nm, and reference 310 nm.
To quantify acrylamide, we drew the calibration curve (calibration) with the calibration points on the 50–100–300–500–1000 curve (ng/mL).
Compounds of interest were identified by comparing the retention times of the peaks in the recorded chromatograms and by analyzing the DAD spectrum for the samples to be analyzed with the retention times of the peaks in the chromatograms recorded for the standard substance.
To determine the concentration of acrylamide in a sample, the analytical signal (peak) was integrated and, with the help of the apparatus software, its concentration was determined by extrapolation on the calibration curve. Spectral analysis was performed by accessing the IRIS partition of TotalChrom software (version 6.2.1, Perkin Elmer Waltham, MA, USA, access date 23 May 2021), followed by the use of functions: 3D spectrum, peak purity, baseline, maximum absorbance, absorbance ratio.
The analytical result was recorded in the corrected form for recovery, which was higher than 83%. The results were expressed in µg/Kg, to 2 decimal places. Results below the detection limit were undetectable. The limits of detection (LOD) and limits of quantification (LOQ) of the HPLC method were of 20 µg/kg and 25 µg/kg, respectively.

2.4. Statistical Analysis

The data samples were expressed as the mean ± standard deviation. For statistical analysis a Statistical Package for Social Science statistical package (v.28, SPSS, Chicago, IL, USA, free trial) was used. A one-way ANOVA with Tukey’s test at a 5% significant differences level was used.

3. Results and Discussions

3.1. Effect of Dry Sourdough on Dough Rheological Parameters

3.1.1. Effect of Dry Sourdough on Mixolab Rheological Parameters

The dough’s rheological properties, as measured by a Mixolab device, are shown in Table 1. As can be seen, the addition of dry sourdough (SD) slightly increased water absorption value—this result being in agreement with those reported by Nogueira et al. [26]. In the initial Mixolab mixing stage, dough development time and stability significantly decreased (p < 0.01) with the increased level of SD addition to wheat flour. This fact indicates that dough becomes less stable and weaker when SD is added to wheat flour. A weakening effect of SD addition on dough mixing properties has previously been reported by other researchers [26,27,28]. This may be due to the fact that the addition of SD to wheat flour may lead to a hydrolytic intensification of the protein and starch degradation. This leads to a release of water from the gluten system, which decreases the dough’s consistency and therefore its stability. Therefore, a hydrolitic act of SD on gluten leads to a softening of the dough when mixing. The addition of SD to wheat flour shortens and hydrolyzes the polypeptide chains of the dough system, allowing them to reassemble in protein films. These protein changes decreased the mixing time required to obtain maximum dough development, which is important from the energy consumption point of view. As can be seen in Table 1 below, the addition of SD led to a decrease of almost five times for DT value for the SD_4 sample, compared to the control.
The SD addition significantly decreased (p < 0.05) the C2 value up to 47.8% for the SD_4 sample compared to the control sample one. This decrease is due to protein denaturation, which was favored by the action of proteolytic activity from SD on gluten. Therefore, when temperature increases, the dough consistency decreases even more with the increased level of SD addition to wheat flour. This fact indicates a weaker dough with less ability to retain gases in the early stages of baking [29].
Starch gelatinization begins to take place in the temperature range of 60–65 °C, which has a major impact on the dough’s rheological characteristics. This fact contributes to an increase in the dough’s viscosity due to the formation of a colloidal dispersion. The starch gelatinization ends around 100 °C, when baking is complete. During starch gelatinization, the enzymatic attackability of starch increases. Compared to the control sample, the dough recorded a significant decrease (p < 0.05) in viscosity for samples with SD incorporated in the manufacturing recipe. The C3 value decreased up to 11% for the sample with 4% addition of SD to the wheat flour. This may be due to the fact that the starch compound had been exposed over time to the action of amylases in the dough [30]. Temperature and pH are two factors that favor the action of amylolitic activity from SD and wheat flour on the starch substrate. These factors influence the constant rate of enzymatic reactions, up to certain values, when the process of amylase denaturation occurs. The SD addition led to a slightly acidic dough, with a pH value of around 5.7, an optimum level for the amylase enzyme in the dough samples with high levels of SD incorporated in the wheat flour. The optimal temperature and pH for amylase activity led to an increase in their activity and therefore to a decrease in dough viscosity [28]. Consequently, the maximum torque-measure of starch gelatinization C3 value decreased with the increase in the levels of SD added to the wheat flour. The amylase hydrolysis in starch will lead to an accumulation of molecular-weight dextrin [31]. This hydrolysis product will lead to a decrease in starch gelling capacity to retain water, which in turn reduces dough consistency. Therefore, the torque for stability of hot starch paste, C4, will decrease with the increased level of SD being added to the wheat flour. Starch behavior during heating influences dough’s rheolgical properties, mainly due to its gelatinization [32]. A more complete starch gelatinization leads to enhanced amylases attackability and a lower dough consistency. It is due to this face that all the Mixolab torques related to starch behavior, namely C3, C4 and C5, presented lower values for the samples with the addition of SD to wheat flour compared to the control. From all these Mixolab torques, the C5 torque related to the final starch was the sample where the paste viscosity decreased in the most significant way (p < 0.05) with the addition of increased levels of SD to wheat flour.

3.1.2. Effect of Dry Sourdough on Alveograph Rheological Parameters

The Alveograph data obtained presented in Table 2 show that the addition of SD caused a change in dough’s tenacity (maximum pressure) after a variable trend, with values being significantly lower (p < 0.05) than the control for samples with an addition of SD to wheat flour of up to a 2%, after which this value significantly increased.
The maximum pressure value decreases for dough samples due to the enzymatic activity of SD. A decrease in dough tenacity may be due to the action of α-amylase and protease on starch and gluten structure, which led to a decrease in dough consistency [33]. However, in an expected way, the p value significantly increased (p < 0.05) when high levels of SD were incorporated into the wheat flour, reaching up to 15% for the SD_4 sample compared to the control sample. This may be explicable since, as can be seen from the Mixolab data, the water absorption needed for the dough to reach the optimum consistency value increased with the increase in the level of SD added to the wheat flour. Due to the fact that we determined the Alveograph rheological properties at constant hydration, we added the same amount of water in the Alveograph mixer when SD was added to the wheat flour. This may lead to a lower amount of water being correlated with the dough needs, a higher dough consistency and therefore to higher dough tenacity. The increase in p value takes place only when high levels of SD are added to wheat flour, and in these cases a significantly higher amount of water is needed in the dough system. The addition of low levels of SD to wheat flour leads to a higher dough extensibility and index of swelling, while the addition of high levels of SD to wheat flour leads to a lower L and G values. This behavior may be due to the water availability from the dough system and its enzymatic activity. The addition of SD to wheat flour leads to an intensification of the enzymatic activity. As a result of the protease and α-amylase action on gluten and starch structure maltose, dextrins and amino acids are formed. Maltose formed through starch hydrolysis dehydrates the gluten enzymatically hydrolyzed by proteases, increasing the available water from the dough system, reducing dough consistency and increasing dough extensibility [34]. The extensibility of the dough is dependent on its viscosity. Even if enzymes act more intensely in the dough system due to SD addition, the addition of a lower amount of water to the wheat flour due to the constant hydration method used with the the Alveograph leads to a higher dough viscosity and therefore to lower G and L values when high levels of SD are incorporated into the wheat flour. The baking strength value did not present significant variation (p < 0.05) between the control sample and the samples with 2 and 4% SD addition to wheat flour. However, the samples with 1 and 3% SD addition to wheat flour presented significantly higher W values (p < 0.05) compared with the control. This fact indicates that SD addition slightly improved the dough’s rheological properties during extension, as determined by the Alveograph device. From the P/L values point of view, it may be seen that no significant differences (p < 0.05) were recorded between the samples with the addition of 1 and 2% SD to wheat flour and significant ones (p < 0.05) were recorded between the samples with the addition of 3 and 4% SD to wheat flour (which presented higher values than the control).

3.1.3. Effect of Dry Sourdough on pH, Falling Number and Rheofermentometer Rheologial Parameters

The addition of SD to wheat flour led to a significant decrease (p < 0.05) in the pH value of dough, as may be seen from Table 3. The decrease in pH value with the increased level of SD addition has been reported by various researchers [14,34]. These decreases are due to the lactic acid content of SD, which was obtained as a result of the fermentation of lactic acid bacteria in wheat flour [35]. During fermentation, the pH value slightly increased with the increase in the dough fermentation time. This slight pH increase during fermentation may be due to the proteolytic activity of SD, which acts on proteins releasing amino acids, thus increasing the pH level in the dough system. However, this increase is not a significant one, with the pH value being somehow constant during dough fermentation.
As may be seen from Table 4 below, the addition of SD to wheat flour decreased the FN value, which indicates an improvement of the α-amylase activity in the dough system. This drop is a significant one (p < 0.05), by as much as 19.5% for the sample with an addition of 4% SD to wheat flour compared to the control. According to the data obtained, the FN values decreased and reached optimum values, which are between 250 and 300 s [36]. Therefore, it may be concluded that SD addition improved the wheat flour quality up to a normal α-amylase activity, making it of a good quality for breadmaking from the amylase activity point of view.
The importance of adjusting the level of α-amylase activity in wheat flour is essential for dough fermentation. In general, wheat flour contains relatively small amounts of fermentable carbohydrates—totally insufficient for a good development of the yeast activity that would lead to a good bread quality. Therefore, the increase in the α-amylase content in wheat flour through SD addition favors the formation of the maltose used by yeast for the production of carbon dioxide, ethanol and other fermentation products. From amylases, α-amylase acts on the starch contained in the wheat flour, favoring the action of β-amylase, which is present in wheat flour in large amounts [31]. This will lead to the continuous production of carbon dioxide during fermentation, to an amount that favors obtaining a high quality bread. With the increase in the amount of fermentable carbohydrates in the dough, the activity of yeast and bacteria is stimulated. It multiplies the number of yeast cells and amplifies its fermentative activity [37]. Additionally, the amount of heterofermentative lactic acid bacteria also increases in wheat flour dough due to the addition of SD, a fact that may contribute to the structural changes in the dough and their ability to form carbon dioxide, even if the amount of these gases is much lower than in the case of yeast [27,28]. As may be seen from the Rheofermentometer data, the total volume of CO2 production rose with the addition of increased levels of SD to wheat flour, with the highest VT value being recorded for the sample with 3% SD added to the wheat flour. A significant (p < 0.05) increase in VT value of 6% was recorded for this sample in comparison to the control.
The dough’s ability to retain gases is influence by the changes in its rheological properties due to SD addition. As may be seen, the volume of the gas retained in the dough at the end of the VR test significantly decreased (p < 0.05) with the increased level of SD addition compared to the control sample. The lowest VR value was recorded for the sample where 4% SD was added to the wheat flour, for which the VR value decreased by 7.2% compared with the control. However, between the samples SD_1 and SD_2 and between the samples SD_3 and SD_4, no significant differences (p < 0.05) were recorded for VR value.
The increase in the amount of gas formed during fermentation and the decrease in the dough’s ability to retain gases influences the H’m and CR values. For the H’m value no significant differences (p < 0.05) were noticed between the sample with the addition of 1% SD to wheat flour and the control sample, or between the SD_2 and SD_3 samples. However, for the dough samples to which doses higher than 2% SD were added to the wheat flour, significantly (p < 0.05) lower values were recorded compared to the control. For the CR value, significantly lower values (p < 0.05) were recorded for the samples with the addition of SD to wheat flour compared with the control. Taking into account that CR is the ratio between the VR and VT values, it may be concluded that the dough’s ability to retain gases is lower than the amount of gases formed during the fermentation process. The decrease in CR value for the samples with SD addition compared with the control is a consequence of the worsening of the dough’s rheological properties due to the addition of SD to the wheat flour, which is not capable of retaining the gases formed during fermentation.

3.2. Bread Quality Characteristics

3.2.1. Bread Physical Characteristics

The data on bread physical characteristics are shown in Table 5. It may be noticed that all samples with SD addition presented significantly (p < 0.05) higher values for loaf volume, porosity and elasticity compared to the control sample. For loaf volume, no significant differences (p < 0.05) were recorded between the SD_1, SD_2 and SD_3 samples. The highest value for loaf volume was obtained for the SD_2 sample, which was 23.4% higher than the value obtained for control sample. For the porosity and elasticity values no significant differences (p < 0.05) were obtained between the SD_1 and SD_4 samples. Similarly, for elasticity, no significant differences (p < 0.05) were recorded between the SD_2 and SD_3 samples. Because of its enzymatic activity, SD addition favors yeast activity due to the increased amount of fermentable carbohydrates in the dough, and consequently improves loaf volume, porosity and elasticity. The significant increase in the values of the physical characteristics of the bread for the samples with SD addition can be explained by the higher amount of gases formed during the dough fermentation, and by the higher speed of the fermentation process performed by the yeasts in the presence of lactic bacteria from the SD, as well as a good ability of dough to retain gases [14]. However, the addition of high levels of SD to the bread recipe led to a slight decline in the bread’s physical characteristics due to the loss of the dough capacity to retain gases.

3.2.2. Bread Color Characteristics

The color analysis of the bread samples for crust and crumb is shown in Table 6. The bread color values L and b* were significantly affected (p < 0.05) by SD addition for the bread crust and insignificantly affected (p < 0.05) for the bread crumb. The L values (which represent the lightness of the bread samples) were lower with the increased level of SD addition in wheat flour. The b* values (which represent the degree of blueness to yellowness) also decreased with the increased level of SD addition to wheat flour. The a* value (which indicates greenness to redness) were significantly different (p < 0.05) for all samples in which SD was added to the wheat flour. This value also decreased with the increased level of SD addition to wheat flour. The L, a* and b* color parameters’ evolution indicates a darkening of the bread color characteristics that is more significant for the bread crumb than for the bread crust. Due to the fact that starch and proteins’ hydrolysis was more intense for the dough samples with SD addition, the fermentable sugars and amino acids which were not entirely consumed during fermentation process participate in the Maillard reaction during baking. As a result, higher amounts of melanoidins are formed, which contributes to the intensification of the color of both bread crust and crumb [28].

3.2.3. Bread Textural Characteristics

The textural parameters values for the bread are shown in Table 7. As may be seen, the addition of increased levels of SD to wheat flour led to a significant decrease (p < 0.05) in the firmness and gumminess values. This decrease may be due to a reduced starch staling for the samples with SD addition, which may lead to a less rigid crumb and therefore to lower firmness values. Various studies have reported a reduction in the starch retrogradation rate for bread obtained with sourdough addition [14,38]. It was concluded that the staling rate of bread is significantly influenced by α-amylase content from the dough system by affecting the interactions between the proteins and starch granules, which are reduced due to starch hydrolysis products not specifically associated with the protein network [39]. This resulted in a less firm and gummy bread. From the point of view of the cohesiveness and resilience values, it may be seen that when low levels of SD were added to the wheat flour, no significant effect (p < 0.05) was obtained between bread samples. When high levels of SD were added to the wheat flour, it became apparent that the values for cohesiveness and resilience were significantly lower (p < 0.05) than the control sample.

3.2.4. Bread Sensorial Characteristics

The results of the sensory evaluation of bread samples with different levels of SD addition are shown in Figure 1. All the bread samples were well evaluated. The most appreciated bread sample was the one with the addition of 2% SD to wheat flour; however, the rest of the samples were also highly rated. The lowest rate of appreciation was recorded for taste, with a score lower than 7 being recorded for the SD_4 sample. The bread sample with 4% of SD addition presented a sourdough taste, and even a salty one. However, the bread samples with 1 and 2% SD addition were appreciated more than the control sample. This may be due to the fact that SD addition leads to an increase in sugar content in the bread, which improves its taste, color and texture. Because of a higher amount of hydrolyses of starch and gluten due to the addition of SD to the wheat flour, the amount of fermentable carbohydrates and amino acids in the bread increased. After the fermentation process, some of them remain in the bread and give it a pleasant taste. In addition, they participate in the Maillard reaction during baking, forming melanoidins that contribute to the intensification of the crust color and bread flavor [40]. The aroma and taste of bread depend on the flour extraction rate and the enzymatic reactions that take place during fermentation. Additionally, the aroma and taste of the bread depend on the reactions that take place when baking. The main compounds that contribute to the aroma and taste of bread are organic acids, alcohols, esters and carbonyl compounds. Due to the lactic bacteria from SD in its composition, the use of wheat flour with a high degree of extraction as raw material for bread making will lead to the accumulation of a higher amount of volatile compounds due to the alcoholic and lactic fermentation that takes place in the wheat flour dough [14]. In addition to the lactic acid bacteria that SD contains, a slightly proteolytic activity is also present, which favors the accumulation of amino acids. The accumulation of amino acids in wheat flour dough is partially degraded by the Ehrilch pathway, leading to higher amounts of aldehydes or superior alcohols, which indicate an increase in flavor compounds [41].

3.2.5. Bread Acrylamide Content

As may be seen from Figure 2, the acrylamide content from bread samples where SD had been added to the wheat flour presented significantly (p < 0.05) lower values than those obtained for the control sample. The lowest value for acrylamide content was obtained for the bread sample with the addition of 1% SD to wheat flour, for which the acrylamide content decreased by up to 63% compared to the control. However, no significant differences (p < 0.05) were recorded between the SD_1 and SD_2 bread samples from the acrylamide content point of view. The decrease in acrylamide content in bread samples following dry sourdough addition has been reported by various researchers [7,10,14]. This may be due to the decrease in pH with SD addition. The lower the pH is, the lower the acrylamide content of the bread products is [12]. As may be seen from the data obtained, from the pH point of view (Table 3) the SD addition significantly decreased (p < 0.05) the dough’s pH level, by up to 5.8% for SD_4 sample compared to the control. The use of SD in bread recipes may increase the amount of lactic acid bacteria (LAB) contained by the SD. According to different studies, some LAB may possess asparaginase genes that favor asparagine consumption by LAB during the fermentation process [7,42]. However, according to our data, the reduction in acrylamide in bread samples was due to the pH decrease rather than to the LAB content from the dough system. When more than 2% SD was added to wheat flour, the acrylamide content began to increase in a significant way (p < 0.05) even if the bread samples presented lower values of acrylamide content compared to the control sample. This may be due to the enzymatic activity from SD as proteolytic ones can act on proteins and increase the asparagine content in the dough system. Additionally, it is possible that the SD does not to possess LAB with asparaginase genes that can consume the asparagine from wheat flour dough. These data are in agreement with those obtained by Ma et al. [16] which concluded that the acrylamide reduction is more a result of the pH decrease that due to the consumption of acrylamide precursors, such as asparagine, and reducing sugars. It is well known that acrylamide is formed mainly during the Maillard reaction between amino acids (especially asparagine) and the reduction in carbohydrates, which occurs at high temperature levels during baking [43]. According to our data, the addition of high levels of SD to the wheat flour did not decrease the pH of the dough samples in a significant way compared to the dough of the SD_1 sample. However, SD possesses some enzymatic activity, the levels of which increase when increased levels of SD are added to the wheat flour. As a consequence, the peptidase activity from SD leads to the formation of amino acids, including asparagine, which influences the formation of acrylamide. In addition, the increase in the level of amylases due to SD addition (a fact demonstrated by the decrease in the FN value with the increase in the level of SD addition) may also favor the increased reduction in carbohydrates which also are involved in the acrylamide formation. These facts, combined with an insignificant decrease in dough pH when high levels of SD are added to wheat flour, may lead to an increase in the AA level in bread samples when high doses of SD are incorporated in the bread recipe. However, the LAB content from SD, and the lower pH values for dough samples with SD addition compared with the control one lead to significantly (p < 0.05) lower values for AA content in all bread samples in which SD was incorporated into the bread recipe compared to the control one.

4. Conclusions

The rheological behavior of the dough samples with the addition of different levels of SD to wheat flour led to significant changes during mixing, extension, heating and fermentation. The water absorption value increased with the increase in levels of SD addition, whereas the dough development time, stability and Mixolab torques related to starch behavior during heating decreased with the increase in levels of SD addition to wheat flour. The dough’s rheological behavior during extension indicated an improved extensibility and index of swelling, a decline in dough tenacity when low levels of SD were added to the wheat flour, and a decrease in these values when high levels of SD were incorporated into the bread recipe. During fermentation, total CO2 volume production presented higher values for dough samples with different levels of SD addition, whereas the volume of the gas retained in the dough at the end of the test decreased with the increase in the levels of SD added to the wheat flour. All of the bread samples in which SD was added to the flour presented better physical characteristics than the control. All the textural parameters that were evaluated (i.e., firmness, gumminess, cohesiveness and resilience) decreased with the addition of increased levels of SD to the bread recipe. The color measurements of the bread samples indicate a more significant darkening of the color of bread crust than bread crumb following SD addition. The best bread samples from the physical and sensorial point of view were those where 1 and 2% SD had been added to the wheat flour. For these samples, the lowest acrylamide levels were recorded, while the analysis between the samples did not obtain a statistically significant difference (p < 0.05) from the AA content point of view. Therefore, according to the data obtained, the amount of acrylamide (a compound which is carcinogenic to humans) formed in bread during baking may be reduced if SD is added to wheat flour of a high extraction rate. However, the addition of SD in bread making presented a differential effect on the acrylamide content in bread samples. Even though all the bread samples with SD addition presented significantly (p < 0.05) lower values for acrylamide content compared to the control sample, the highest decrease was recorded for SD_1 sample, which had an AA level 63% lower than the control. At high levels of SD addition to wheat flour, the AA content begins to increase, indicating the possibility of forming asparagine, a critical precursor for acrylamide formation in bread making. Therefore, to reduce the acrylamide content in bread, adding low levels of SD to wheat flour is a good option for bakeries. In addition, besides the fact that the addition of a low amount of SD to wheat flour is an effective way of decreasing the formation of acrylamide content in bread products, it also improves their quality from a technological and quality point of view.

Author Contributions

Conceptualization, G.G.C. and A.D.; methodology, G.G.C.; software, G.G.C.; validation, G.G.C., A.D. and C.S.; formal analysis, G.G.C.; investigation, C.S.; resources, C.S.; data curation, C.S.; writing—original draft preparation, G.G.C. and A.D.; writing—review and editing, G.G.C.; vis-ualization, G.G.C.; supervision, G.G.C.; project administration, G.G.C.; funding acquisition, G.G.C. All authors have read and agreed to the published version of the manuscript.

Funding

This research received no external funding.

Data Availability Statement

The data presented in this study are available in this article.

Acknowledgments

The authors thank to the Enzymes & Derivates Romania for the provided SD sample. Also wants to thank to the Pambac S.A, for the provided data.

Conflicts of Interest

The authors declare no conflict of interest.

References

  1. Diana, M.; Rafecas, M.; Quílez, J. Free amino acids, acrylamide and biogenic amines in gamma-aminobutyric acid enriched sourdough and commercial breads. J. Cereal Sci. 2014, 60, 639–644. [Google Scholar] [CrossRef]
  2. Suo, B.; Chen, X.; Wang, Y. Recent research advances of lactic acid bacteria in sourdough: Origin, diversity, and function. Curr. Opin. Food Sci. 2021, 37, 66–75. [Google Scholar] [CrossRef]
  3. Nachi, I.; Fhoula, I.; Smida, I.; Taher, I.B.; Chouaibi, M.; Jaunbergs, J.; Hassouna, M. Assessment of lactic acid bacteria application for the reduction of acrylamide formation in bread. LWT 2018, 92, 435–441. [Google Scholar] [CrossRef]
  4. Khorshidian, N.; Yousefi, M.; Shadnoush, M.; Siadat, S.D.; Mohammadi, M.; Mortazavian, A.M. Using probiotics for mitigation of acrylamide in food products: A mini review. Curr. Opin. Food Sci. 2020, 32, 67–75. [Google Scholar] [CrossRef]
  5. Rivas-Jimenez, L.; Ramírez-Ortiz, K.; González-Córdova, A.F.; Vallejo-Cordoba, B.; Garcia, H.S.; Hernandez-Mendoza, A. Evaluation of acrylamide-removing properties of two Lactobacillus strains under simulated gastrointestinal conditions using a dynamic system. Microbiol. Res. 2016, 190, 19–26. [Google Scholar] [CrossRef]
  6. Bartkiene, E.; Bartkevics, V.; Pugajeva, I.; Krungleviciute, V.; Mayrhofer, S.; Domig, K. The contribution of P. acidilactici, L. plantarum, and L. curvatus starters and L-(+)-lactic acid to the acrylamide content and quality parameters of mixed rye-Wheat bread. LWT 2017, 80, 43–50. [Google Scholar] [CrossRef]
  7. Przygodzka, M.; Piskula, M.K.; Kukurová, K.; Ciesarová, Z.; Bednarikova, A.; Zieliński, H. Factors influencing acrylamide formation in rye, wheat and spelt breads. J. Cereal Sci. 2015, 65, 96–102. [Google Scholar] [CrossRef]
  8. Nematollahi, A.; Meybodi, N.M.; Khaneghah, A.M. An overview of the combination of emerging technologies with conventional methods to reduce acrylamide in different food products: Perspectives and future challenges. Food Control 2021, 127, 108144. [Google Scholar] [CrossRef]
  9. Shen, Y.; Zhao, S.; Zhao, X.; Sun, H.; Shao, M.; Xu, H. In Vitro adsorption mechanism of acrylamide by lactic acid bacteria. LWT 2019, 100, 119–125. [Google Scholar] [CrossRef]
  10. Nasiri Esfahani, B.; Kadivar, M.; Shahedi, M.; Soleimanian-Zad, S. Reduction of acrylamide in whole-wheat bread by combining lactobacilli and yeast fermentation. Food Addit. Contam. Part A Chem. Anal. Control Expo. Risk Assess 2017, 34, 1904–1914. [Google Scholar] [CrossRef]
  11. Canesin, M.R.; Cazarin, C.B.B. Nutritional quality and nutrient bioaccessibility in sourdough bread. Curr. Opin. Food Sci. 2021, 40, 81–86. [Google Scholar] [CrossRef]
  12. Dastmalchi, F.; Razavi, S.H.; Faraji, M.; Labbafi, M. Effect of Lactobacillus casei-casei and Lactobacillus reuteri on acrylamide formation in flat bread and Bread roll. JFST 2016, 53, 1531–1539. [Google Scholar] [CrossRef] [PubMed]
  13. Albedwawi, A.S.; Turner, M.S.; Olaimat, A.N.; Osaili, T.M.; Al-Nabulsi, A.A.; Liu, S.Q.; Ayyash, M.M. An overview of microbial mitigation strategies for acrylamide: Lactic acid bacteria, yeast, and cell-free extracts. LWT 2021, 143, 111159. [Google Scholar] [CrossRef]
  14. Arora, K.; Ameur, H.; Polo, A.; Di Cagno, R.; Rizzello, C.G.; Gobbetti, M. Thirty years of knowledge on sourdough fermentation: A systematic review. Trends Food Sci. Technol. 2021, 108, 71–83. [Google Scholar] [CrossRef]
  15. Bartkiene, E.; Bartkevics, V.; Lele, V.; Pugajeva, I.; Zavistanaviciute, P.; Mickiene, R.; Juodeikiene, G. A concept of mould spoilage prevention and acrylamide reduction in wheat bread: Application of lactobacilli in combination with a cranberry coating. Food Control 2018, 91, 284–293. [Google Scholar] [CrossRef]
  16. Ma, S.; Wang, Z.; Guo, X.; Wang, F.; Huang, J.; Sun, B.; Wang, X. Sourdough improves the quality of whole-wheat flour products: Mechanisms and challenges—A review. Food Chem. 2021, 360, 130038. [Google Scholar] [CrossRef] [PubMed]
  17. Bartkiene, E.; Jakobsone, I.; Juodeikiene, G.; Vidmantiene, D.; Pugajeva, I.; Bartkevics, V. Study on the reduction of acrylamide in mixed rye bread by fermentation with bacteriocin-like inhibitory substances producing lactic acid bacteria in combination with Aspergillus niger glucoamylase. Food Control 2013, 30, 35–40. [Google Scholar] [CrossRef]
  18. Reale, A.; Di Stasio, L.; Di Renzo, T.; De Caro, S.; Ferranti, P.; Picariello, G.; Mamone, G. Bacteria do it better! Proteomics suggests the molecular basis for improved digestibility of sourdough products. Food Chem. 2021, 359, 129955. [Google Scholar] [CrossRef]
  19. Oshiro, M.; Zendo, T.; Nakayama, J. Diversity and dynamics of sourdough lactic acid bacteriota created by a slow food fermentation system. J. Biosci. Bioeng. 2021, 131, 333–340. [Google Scholar] [CrossRef]
  20. Zhang, D.; Liu, W.; Li, L.; Zhao, H.Y.; Sun, H.Y.; Meng, M.H.; Shao, M.L. Key role of peptidoglycan on acrylamide binding by lactic acid bacteria. Food Sci. Biotechnol. 2017, 26, 271–277. [Google Scholar] [CrossRef]
  21. Koszucka, A.; Nowak, A.; Nowak, I.; Motyl, I. Acrylamide in human diet, its metabolism, toxicity, inactivation and the associated European Union legal regulations in food industry. Crit. Rev. Food Sci. Nutr. 2019, 60, 1677–1692. [Google Scholar] [CrossRef]
  22. Alfonzo, A.; Ventimiglia, G.; Corona, O.; Di Gerlando, R.; Gaglio, R.; Francesca, N.; Moschetti, G.; Settanni, L. Diversity and technological potential of lactic acid bacteria of wheat flours. Food Microbiol. 2013, 36, 343–354. [Google Scholar] [CrossRef] [PubMed] [Green Version]
  23. Pule, B.O.; Torto, N. Determination of Acrylamide in Cooking Oil by Agilent Bond Elut Quechers Acrylamide Kit and HPLC-DAD, Agilent Application Note; No. 5990-.; Agilent Technologies, Inc.: Santa Clara, CA, USA, 2018. [Google Scholar]
  24. Cavalli, S.; Maurer, R.; Höfler, F. Fast Determination of Acrylamide in Food Samples Using Accelerated Solvent Extraction Followed by Ion Chromatography with Uv or Ms-Detection. In LC/GC Europe; The Applications NoteBook; Dionex Corporation: Sunnyvale, CA, USA, 2003; pp. 1–3. [Google Scholar]
  25. Comite Europeen de Normalisation. Food Analysis—Determination of Acrylamide in Food by Liquid Chromatography Tandem Mass Spectrometry (LC-ESI-MS/MS); Comite Europeen de Normalisation: Brussel, Belgium, 2015. [Google Scholar]
  26. Nogueira, A.C.; Kussano, J.T.; Steel, C.J. Sourdough reduces sodium in wheat flour doughs. Int. J. Food Sci. Technol. 2015, 50, 2621–2629. [Google Scholar] [CrossRef]
  27. Voinea, A.; Stroe, S.G.; Codină, G.G. The effect of sodium reduction by sea salt and dry sourdough addition on the wheat flour dough rheological properties. Foods 2020, 9, 610. [Google Scholar] [CrossRef]
  28. Voinea, A.; Stroe, S.G.; Codină, G.G. The effect of sea salt, dry sourdough and fermented sugar as sodium chloride replacers on rheological behavior of wheat flour dough. Foods 2020, 9, 1465. [Google Scholar] [CrossRef] [PubMed]
  29. Dabija, A.; Codină, G.G.; Fradinho, P. Effect of yellow pea flour addition on wheat flour dough and bread quality. Rom Biotechnol. Lett. 2017, 22, 12888. [Google Scholar]
  30. Codină, G.G.; Dabija, A.; Oroian, M. Prediction of pasting properties of dough from mixolab measurements using artificial neuronal networks. Foods 2019, 8, 447. [Google Scholar] [CrossRef] [Green Version]
  31. Struyf, N.; Verspreet, J.; Courtin, C.M. The effect of amylolytic activity and substrate availability on sugar release in non-yeasted dough. J. Cereal Sci. 2016, 69, 111–118. [Google Scholar] [CrossRef]
  32. Mangan, D.; Szafranska, A.; McKie, V.; McCleary, B.V. Investigation into the use of the amylase SD assay of milled wheat extracts as a predictor of baked bread quality. J. Cereal Sci. 2016, 70, 240–246. [Google Scholar] [CrossRef]
  33. Caballero, P.A.; Gómez, M.; Rosell, C.M. Improvement of dough rheology, bread quality and bread shelf-life by enzymes combination. J. Food Eng. 2007, 81, 42–53. [Google Scholar] [CrossRef] [Green Version]
  34. Caballero, P.A.; Gómez, M.; Rosell, C.M. Bread quality and dough rheology of enzyme-supplemented wheat flour. Eur. Food Res. Technol. 2007, 224, 525–534. [Google Scholar] [CrossRef] [Green Version]
  35. Oshiro, M.; Tanaka, M.; Zendo, T.; Nakayama, J. Impact of pH on succession of sourdough lactic acid bacteria communities and their fermentation properties. Biosci. Microbiota Food Health 2020, 39, 152–159. [Google Scholar] [CrossRef] [PubMed] [Green Version]
  36. Ji, T.; Penning, B.; Baik, B.K. Pre-harvest sprouting resistance of soft winter wheat varieties and associated grain characteristics. J. Cereal Sci. 2018, 83, 110–115. [Google Scholar] [CrossRef]
  37. Codină, G.G.; Zaharia, D.; Ropciuc, S.; Dabija, A. Influence of magnesium gluconate salt addition on mixing, pasting and fermentation properties of dough. EuroBiotech. J. 2017, 3, 222–225. [Google Scholar] [CrossRef] [Green Version]
  38. Corsetti, A.; Gobbetti, M.; De Marco, B.; Balestrieri, F.; Paoletti, F.; Russi, L.; Rossi, J. Combined effect of sourdough lactic acid bacteria and additives bread firmness and staling. J. Agric. Food Chem. 2000, 48, 3044–3051. [Google Scholar] [CrossRef]
  39. Gerrard, J.A.; Every, D.; Sutton, K.H.; Gilpin, M.J. The role of maltodextrins in the staling of bread. J. Cereal Sci. 1997, 26, 201–209. [Google Scholar] [CrossRef]
  40. Thiele, C.; Ganzle, M.G.; Vogel, R.F. Contribution of sourdough lactobacilli, yeast, and cereal enzymes to the generation of amino acids in dough relevant for bread flavor. Cereal Chem. 2002, 79, 45–51. [Google Scholar] [CrossRef]
  41. Zhao, C.J.; Ganzle, M.G. Synthesis of taste-active γ-glutamyl dipeptides during sourdough fermentation by Lactobacillus reuteri. J. Agric. Food Chem. 2016, 64, 7561–7568. [Google Scholar] [CrossRef]
  42. Amer, M.N.; Mansour, N.M.; El-Diwany, A.I.; Dawoud, I.E.; Rashad, F.M. Isolation of probiotic lactobacilli strains harboring lasparaginase and arginine deiminase genes from human infant feces for their potential application in cancer prevention. Ann. Microbiol. 2013, 63, 1121–1129. [Google Scholar] [CrossRef]
  43. Sarion, C.; Codină, G.G.; Dabija, A. Acrylamide in bakery products: A review on health risks, legal regulations and strategies to reduce its formation. Int. J. Environ. Res. Public Health 2021, 18, 4332. [Google Scholar] [CrossRef]
Figure 1. Sensory analysis of bread samples with different levels of dry sourdough (SD) addition.
Agronomy 11 01977 g001
Figure 2. Acrylamide content of bread samples with different levels of dry sourdough (SD) addition. Vertical bars represent the standard errors of means. Each acrylamide content value followed followed by the same letter is not significantly different (p < 0.05).
Agronomy 11 01977 g002
Table 1. Mixolab rheological properties of dough samples with different levels of dry sourdough (SD) addition.
SamplesWA (%)DT (min)ST (min)C2 (Nm)C3 (Nm)C4 (Nm)C5 (Nm)
Control62.0 ± 0.11 a5.04 ± 0.06 d8.42 ± 0.03 e0.34 ± 0.01 e1.44 ± 0.02 c1.14 ± 0.02 d1.83 ± 0.03 d
SD_162.3 ± 0.10 a4.72 ± 0.25 c7.65 ± 0.03 d0.32 ± 0.00 de1.38 ± 0.02 b1.08 ± 0.01 c1.70 ± 0.01 c
SD_262.4 ± 0.10 a4.62 ± 0.05 c7.38 ± 0.03 c0.31 ± 0.00 c1.37 ± 0.01 b1.06 ± 0.02 c1.67 ± 0.02 bc
SD_362.6 ± 0.10 b3.97 ± 0.08 b6.48 ± 0.03 b0.25 ± 0.00 b1.34 ± 0.00 b1.02 ± 0.00 b1.62 ± 0.01 b
SD_462.8 ± 0.10 b0.93 ± 0.02 a5.15 ± 0.04 a0.23 ± 0.00 a1.28 ± 0.01 a0.98 ± 0.00 a1.52 ± 0.02 a
WA, water absorption value; DT, dough development time; ST, dough stability; C2, protein weakening torque; C3, starch gelatinization torque; C4, stability of hot starch paste torque; C5, final starch paste viscosity torque. Means followed by the same letter within a column are not significantly different (p < 0.05).
Table 2. Alveograph rheological properties of dough samples with different levels of dry sourdough (SD) addition.
SamplesP (mm)L (mm)G (mm)W (10−4 J)P/L
Control 95.3 ± 0.57 c50.3 ± 1.52 c15.7 ± 0.15 c169.6 ± 1.15 a1.89 ± 0.45 b
SD_192.0 ± 1.00 b60.0 ± 2.00 d17.2 ± 0.25 d176.3 ± 0.57 b1.53 ± 0.04 a
SD_288.0 ± 1.00 a59.0 ± 1.00 d17.0 ± 0.25 d169.3 ± 0.57 a1.49 ± 0.01 a
SD_3106.6 ± 1.52 d45.3 ± 1.52 b14.9 ± 0.20 b180.0 ± 2.00 c2.35 ± 0.11 c
SD_4109.6 ± 1.15 e38.6 ± 1.15 a13.8 ± 0.17 a167.3 ± 1.52 a2.83 ± 0.10 d
P, maximum pressure; L, dough extensibility; G, index of swelling; W, baking strength; P/L, configuration ratio of the Alveograph curve. Means followed by the same letter within a column are not significantly different (p < 0.05).
Table 3. pH values of dough samples with different levels of dry sourdough (SD) addition.
SamplespH
0 h1 h2 h3 h
Control 6.03 ± 0.01 d6.01 ± 0.00 d6.00 ± 0.00 e6.00 ± 0.00 d
SD_15.88 ± 0.00 c5.89 ± 0.00 c5.91 ± 0.00 d5.93 ± 0.00 c
SD_25.80 ± 0.01 b5.82 ± 0.00 b5.83 ± 0.00 c5.84 ± 0.00 b
SD_35.70 ± 0.01 a5.72 ± 0.01 a5.75 ± 0.00 b5.78 ± 0.01 a
SD_45.68 ± 0.00 a5.70 ± 0.00 a5.73 ± 0.00 a5.77 ± 0.00 a
a–e, mean values in the same column followed by different letters are significantly different (p < 0.05).
Table 4. Rheofermentometer parameters and Falling Number values of dough samples with different levels of dry sourdough (SD) addition.
SamplesH’m (mm)VT (mL)VR (mL)CR (%)FN (s)
Control 76.5 ± 0.15 c1772.6 ± 4.04 a1290.3 ± 2.51 c72.7 ± 0.05 e335.3 ± 1.52 d
SD_176.9 ± 0.35 c1795.0 ± 5.13 b1254.3 ± 1.52 b69.8 ± 0.47 d284.0 ± 2.00 c
SD_274.6 ± 0.30 b1865.3 ± 3.51 c1252.3 ± 2.51 b67.1 ± 0.00 b281.0 ± 2.00 c
SD_374.1 ± 0.20 b1878.6 ± 3.05 c1202.3 ± 2.51 a63.9 ± 0.05 a274.6 ± 0.57 b
SD_470.0 ± 0.25 a1784.3 ± 2.51 a1196.6 ± 2.51 a67.0 ± 0.10 b269.6 ± 1.52 a
H’m, maximum height of gaseous production; VT, total CO2 volume production; VR, volume of the gas retained in the dough at the end of the test; CR, retention coefficient; FN, falling number value; a–e, mean values in the same column followed by different letters are significantly different (p < 0.05).
Table 5. Physical characteristics of the bread samples with different levels of dry sourdough (SD) addition.
Bread SamplesLoaf Volume (cm3/100 g)Porosity (%)Elasticity (%)
Control 348.0 ± 2.00 a80.6 ± 0.20 a91.6 ± 0.20 a
SD_1419.0 ± 2.64 c81.2 ± 0.05 b92.3 ± 0.20 b
SD_2429.6 ± 4.61 c83.6 ± 0.15 d93.3 ± 0.20 c
SD_3425.0 ± 7.00 c81.7 ± 0.10 c93.7 ± 0.11 c
SD_4381.6 ± 9.01 b81.0 ± 0.11 b92.7 ± 0.15 b
Means followed by the same letter within a column are not significantly different (p < 0.05).
Table 6. Color measurements of bread samples with different levels of dry sourdough (SD) addition.
Bread SamplesCrust ColorCrumb Color
La*b*La*b*
Control 54.12 ± 1.02 d11.88 ± 0.40 c34.58 ± 0.35 d72.39 ± 1.20 a−2.22 ± 0.24 c25.03 ± 0.29 a
SD_152.96 ± 0.13 cd11.71 ± 0.05 bc34.43 ± 0.09 d72.16 ± 0.03 a−2.33 ± 0.01 bc24.28 ± 0.01 a
SD_252.57 ± 0.10 c11.48 ± 0.03 bc33.60 ± 0.02 c71.07 ± 0.07 a−2.41 ± 0.02 bc23.56 ± 0.17 a
SD_345.13 ± 0.10 b11.28 ± 0.09 b30.36 ± 0.06 b70.81 ± 0.05 a−2.60 ± 0.02 ab22.68 ± 0.02 a
SD_442.08 ± 0.10 a10.68 ± 0.04 a28.20 ± 0.05 a70.27 ± 0.04 a−2.84 ± 0.02 a22.47 ± 0.03 a
L, lightness, (L = 0 is black and L = 100 is white); a*, green-red opponent colors (−a = green and +a = red); b*, blue-yellow opponent colors (−b = blue and +b = yellow).Means followed by the same letter within a column are not significantly different (p < 0.05).
Table 7. Texture parameters of bread samples with different levels of dry sourdough (SD) addition.
Bread SamplesFirmness (N)Gumminess (N)Cohesiveness (Adimensional)Resilience (Adimensional)
Control 6.40 ± 0.12 e4.15 ± 0.22 e0.65 ± 0.03 b1.15 ± 0.08 b
SD_16.13 ± 0.56 d4.02 ± 0.16 d0.69 ± 0.01 b1.21 ± 0.03 b
SD_25.50 ± 0.16 c3.88 ± 0.13 c0.63 ± 0.06 b1.15 ± 0.10 b
SD_34.64 ± 0.34 b3.64 ± 0.19 b0.43 ± 0.04 a0.87 ± 0.05 a
SD_44.20 ± 0.22 a3.22 ± 0.10 a0.42 ± 0.02 a0.81 ± 0.06 a
Means followed by the same letter within a column are not significantly different (p < 0.05).
Publisher’s Note: MDPI stays neutral with regard to jurisdictional claims in published maps and institutional affiliations.

