Article

Ranking Species for Veld Restoration in Semi-Arid Regions Using Agronomic, Morphological and Chemical Parameters of Selected Grass Species at Different Developmental Stages under Controlled Environment

by
Ntokozo Happy Msiza
1,2,*,
Khuliso Emmanuel Ravhuhali
1,2,
Hilda Kwena Mokoboki
1,2,
Sydney Mavengahama
2,3 and
Lebogang Ezra Motsei
1,2
1
Department of Animal Science, School of Agricultural Sciences, Faculty of Natural and Agricultural Sciences, North West University, Mmabatho 2735, South Africa
2
Food Security and Safety Niche Area, School of Agricultural Sciences, Faculty of Natural and Agricultural Sciences, North West University, Mmabatho 2735, South Africa
3
Department of Crop Science, School of Agricultural Sciences, Faculty of Natural and Agricultural Sciences, North West University, Mmabatho 2735, South Africa
*
Author to whom correspondence should be addressed.
Agronomy 2021, 11(1), 52; https://doi.org/10.3390/agronomy11010052
Submission received: 24 November 2020 / Revised: 22 December 2020 / Accepted: 22 December 2020 / Published: 29 December 2020
(This article belongs to the Special Issue Grazing Effects on the Nutritive Value in Grassland Ecosystems)

Abstract

:
The establishment of complementary native grass species could be an ideal method of dealing with existing problems of veld degradation and inadequate forage quantity and quality of pastures. A greenhouse experiment was conducted to evaluate the effect of native grasses viz., Anthephora pubescens, Cenchrus ciliaris, Chloris gayana, Dactylis glomerata, Digitaria eriantha, Eragrostis curvula, Festuca arundinacea, Panicum maximum and Themeda triandra. Attributes at different growth stages on agronomy, morphology and chemical composition were checked. Panicum maximum had the broader (p < 0.05) leaves across all growth stages when compared to all other grass species. Festuca arundinacea had highest (p < 0.05) number of tillers than C. ciliaris, C. gayana, D. glomerata, D. eriantha, E. curvula, P. maximum and T. triandra at 2–4-months age. Within each species, all grasses had the highest (p < 0.05) number of leaves at maturity. Chloris gayana, D. glomerata and P. maximum had the highest (p < 0.05) biomass yield when compared to F. arundinacea at the elongation stage. Eragrostis curvula had the highest (p < 0.05) crude protein (CP) values when compared to all other grasses, except for D. glomerata, F. arundinacea and P. maximum at the elongation stage. Panicum maximum and T. triandra had the least (p < 0.05) acid detergent lignin (ADL) values when compared to all other grasses at both vegetative and the elongation stages. In the ranking, C. ciliaris, C. gayana, D. eriantha, E. curvula, P. maximum and A. pubescens outperformed the rest of the grasses on most parameters. With the low crude protein (CP) content of these grasses, protein supplementation is highly crucial for high performing ruminants, especially those animals that graze grasses as their sole diets.

1. Introduction

During the times of high feed costs and financial limitations faced by farmers, grasses are still significantly recognized as the sole and most cost-effective and easily accessible natural resource found in semi-arid regions globally [1]. As part of animal nutrition, native perennial grasses contribute a lot in meeting the daily nutritional demands of ruminants [2]. Perennial grasses maybe regarded as dual-purpose resources since they feed ruminants and conserve degraded rangelands through vegetative cover to prevent soil and/or water erosion [3]. Regrettably, negative implications of overstocking and over utilization of rangelands leading to soil compaction, soil erosion, and run-off, a severe deterioration of vegetation and soil have been prevalent [4]. Selemani et al. [5] stressed that the product of over-utilization of rangelands will cause poor production of aboveground herbaceous biomass and a decline in the grazing capacity of the rangeland. Due to the biotic and abiotic stress that grass plants are subjected to [6], it is of significance that grasses can robustly establish in unfavorable environments like semi-arid areas, to be competitive and grow quickly. Seedling establishment and emergence time, and plant developmental stages are known to be of paramount importance in the production life cycle of grasses as they contribute to species diversity, biomass and rehabilitation of degraded land [7]. Koukolová et al. [8] noted that ruminant productivity is influenced by different stages in harvested grasses because the yield and nutritive value in grass species is interconnected to the grass stage of growth, the morphology [9] and other existing dissimilarities such as plant parts [10], season and genetic distinction [11]. Therefore, the study sought to assess the agronomic, morphological and nutritive traits at different growth stages as an important part of a restoration of degraded rangeland and forage quality in semi-arid areas.

2. Materials and Methods

2.1. Study Area

The study was conducted in a controlled environment at the North West University, Molelwane Experimental farm. The greenhouse had temperatures ranging from 20 to 30 °C with a light-reflective roof. The farm is located at an altitude of 1500 m above sea level. Coordinates of the farm are 25°85’00″ S, 25°63’33″ E. The area surrounding the farm is semi-arid with summer temperatures range between 22 and 34 °C and an above average rainfall of 300 to 700 mm annually. The soil samples were collected from different villages, mixed and samples were drawn for chemical analysis. The soil collected was categorized as a Clovelly and Hutton form. The following properties were found pertaining to the soil: pH 4.38; N 1.9%, P 1.4 mg/kg, K 169 mg/kg, Ca 335 mg/kg, Mg 86 mg/kg, Na 0.004 mg/kg, Fe 3 mg/kg, Cu 0.5 mg/kg, Zn 0.36 mg/kg, Mn 15.4 mg/kg, and 1.2 mg/kg C.

2.2. Sourcing of Seeds and Planting

Seeds of nine selected grass species (Anthephora pubescens, Cenchrus ciliaris, Chloris gayana, Dactylis glomerata, Digitaria eriantha, Eragrostis curvula, Festuca arundinacea and Panicum maximum were sourced from Barenbrug Seed company (Onderstepoort, Pretoria), whereas Themeda triandra seeds were outsourced around Mafikeng area. Approximately 20 seeds were randomly planted in individual plastic pots (30 cm diameter and 22 cm deep) and were filled to identical weight with a soil. The growth trial required 81 pots (experimental units) for planting seeds so that each grass species would be replicated 9 times. Post germination seedlings were further thinned out to 10 plants per pot. Plants were watered 3 times a week using a 750 mL container and weeds were removed regularly from the pots.

2.3. Data Collection

Morphological and agronomic characteristics measurements: Several phenological traits (germination percentage (GM), biomass yield, chlorophyll content index (CCI), root length (RL), root mass (RM), plant height (PH), leaf width (LW), leaf number (LN) and tiller number (TN) were measured for each grass species. Germination percentage (%) was obtained five (5) days after planting. Planting was done in October 2019 and grasses were allowed to grow until March 2020. There was variation in the growth stages of all the grasses with time. The growth stage samples were in separate independent pots. The growth stages were determined as 2-leaf (vegetative), 3-leaf (elongation) and 4-leaf (maturity). The tallest tiller on each plant was used to measure the height of the shoot. The total number of leaves and tillers were estimated per shoot. The morphological attributes data was collected from October 2019 to December 2019 and for tiller development data, plants were allowed to grow until March 2020. Root length (cm) was assessed at the maturity stage. Chlorophyll meter SPAD-502Plus was used to measure chlorophyll at each growth stage. At all growth stages, each grass species was scored based on nutritive value, agronomic and morphological traits with the tallest plants composed of broad leaves, high tiller numbers and the high number of leaves being ranked high on a scale of 1–9 taken from their averages (1-unsuitable and 9-highly suitable) as outlined [12,13,14,15]. Based on the combination of nutritive value, agronomic and morphological traits, grass species were ranked according to their potential for restoring a degraded rangeland using their averages.

2.4. Chemical Analysis

All grass species samples were analysed for ash, organic matter (OM) and crude protein. (CP). Dried samples were placed in a muffle furnace set at 600 °C for 6 h to determine the ash content; and the loss in weight was measured as OM content [16]. Total nitrogen content was determined following the standard macro Kjeldahl method [16] and was converted to crude protein (CP) by multiplying the percentage of the N content by a factor of 6.25 and expressed in g/kg DM (dry matter). Neutral detergent fibre (NDF) and acid detergent fibre (ADF) were determined using ANKOM2000 Fibre Analyser (ANKOM Technology, New York, NY, USA). A heat-stable bacterial α-amylase was used for neutral detergent fibre (NDF) analysis [17]. Acid detergent lignin (ADL) was determined by treating ADF residue bags with 72% sulphuric acid. The study was conducted according to guidelines provided by North-West University Research Ethics Committee, with an approval ethic number NWU-01886-19-A5.

2.5. Statistical Analysis

One-way analysis of variance (ANOVA) was used to analyse the data on germination and root length, parameters using the General Linear Model Procedure of [18] Statistical Software Version 10, under the following model:
Yij = µ + Si + Eij
where;
Yij = response variable; µ = population mean; Si = the effect of grass species; Eij = random error.
Data on grass morphology, chlorophyll, biomass and chemical composition parameters were analysed using two-way analysis of variance (ANOVA) to determine the significance of variation due to plant species and growth stage using SAS [18] Statistical Software Version 10, under the following model:
Yijk = µ + Si +G j + (S × G) ij+ E ijk
where;
Yijk = response variable; µ = population mean; Si = the effect of grass species; Gj = the effect of the growth stage; S × G = the effect of interaction between grass species and growth stage; Eijk = random error.

3. Results

The germination status for each of the grass species was indicated in a descending order; 72% for E. curvula, for A. pubescens, 56%, for C. gayana, 53%, for F. arundinacea 53%, T. triandra 50%, C. ciliaris 47%, D. glomerata 39%, P. maximum, 38% and 23% for D. eriantha. Results on plant height (PH) and leaf width (LW) at varying developmental stages of the selected grass species under the greenhouse experiment are presented in Table 1. There was a variation observed on morphological attributes across grass species, growth stage and their interaction. Within each growth stage, C. ciliaris (76.37 cm) had taller (p < 0.05) plant heights at the elongation stage when compared to C. gayana, D. eriantha, P. maximum, A. pubescens, F. arundinacea and D. glomerata grasses. Within each species, all grass tillers had taller (p < 0.05) plant height values at maturity when compared to the same individual grass species at their elongated and vegetative growth stage. Panicum maximum leaves (Table 1) had the highest (p < 0.05) LW value (12.53 mm) across all growth stages when compared to all other grass species. Within each species, A. pubescens, C. ciliaris, C. gayana, D. glomerata, E. curvula, F. arundinacea and P. maximum had higher (p < 0.05) leaf width value at the maturity stage when compared to the same species at the elongation and vegetative stages which did not differ significantly from each other.
The average number of tillers and leaves of grass species at different ages under greenhouse conditions are presented in Table 2. Festuca arundinacea had the highest (p < 0.05) number of tillers (log10 0.90) than C. ciliaris, C. gayana, D. glomerata, D. eriantha, E. curvula, P. maximum and T. triandra at 2–4-months of age. Cenchrus ciliaris, C. gayana, D. glomerata, D. eriantha, E. curvula, P. maximum and T. triandra had the highest (p < 0.05) number of tillers at 4–6 months of age when compared to the same species at their 0–2- months and 2–4-months ages. Chloris gayana (log10 1.11/shoot) had the highest (p < 0.05) number of leaves when compared to other grasses at 4–6 months of age. Within each species, all grasses had the highest (p < 0.05) number of leaves at 4–6 months when compared to the same species at their 0–2 months and 2–4 months ages.
Results on biomass at different developmental stages of the selected species under the greenhouse experiment are presented in Figure 1. Chloris gayana (Mean ± Standard Error = 30.58 g ± 3.64), D. glomerata (30.26 g ± 3.64) and P. maximum (Mean ± SE = 30.25 g ± 3.64) had the highest (p < 0.05) biomass yield when compared to F. arundinacea (17.06 g ± 3.64) at the elongation stage.
Results on chlorophyll, root length and root weight of the nine selected grass species at maturity stage are presented in Figure 2. Eragrostis curvula grasses had the highest (p < 0.05) chlorophyll (56.86 ± 2.30 CCI), at elongation stage, when compared to all other grasses. Anthephora pubescens, C. ciliaris, C. gayana, D. glomerata, D. eriantha, F. arundinacea and P. maximum had the highest (p < 0.05) chlorophyll at the vegetative stage when compared to the same species at maturity and elongated growth stage. Cenchrus ciliaris (60.08 ±5.17 cm) had a longer (p < 0.05) root length when compared to F. arundinacea and D. glomerata at the maturity stage. Digitaria eriantha (75.46 ± 19.57 g) had the highest (p < 0.05) root mass when compared to F. arundinacea, T. triandra and A. pubescens grasses at the maturity stage. Cenchrus ciliaris, C. gayana, D. glomerata and E. curvula had the same (p > 0.05) root mass as all other grass species.
Results of the effect of species and growth stage on the chemical composition (Ash, OM, CP, NDF, ADF, ADL) at different developmental stages of the nine selected kinds of grass are presented in Table 3 and Table 4. There was a variation observed in the chemical composition across grass species, growth stages and their interactions. Panicum maximum had a higher (p < 0.05) ash concentration than all other grasses at the elongation stage (143.72 g/kg DM) and maturity stage (148.92 g/kg DM). Eragrostis curvula with 864.60 g/kg DM (vegetative stage); 890.98 g/kg DM (elongation stage) and 881.76 g/kg DM (maturity stage) had the highest (p < 0.05) OM values when compared to all other grasses across all growth stages. Eragrostis curvula (65.01 g/kg DM) had the highest (p < 0.05) CP values when compared to all other grasses, except for D. glomerata, F. arundinacea and P. maximum at the elongation stage. At the maturity stage, D. glomerata (55.18 g/kg DM), E. curvula (58.12 g/kg DM) and F. arundinacea (55.19 g/kg DM) had the highest (p < 0.05) CP values when compared to all other grasses. Eragrostis curvula (890.98 g/kg DM) had the highest (p < 0.05) organic matter content than all other grasses at elongation stage.
Anthephora pubescens, C. ciliaris, D. eriantha, E. curvula and T. triandra had the highest (p < 0.05) NDF content at the elongation stage. Except for A. pubescens; C. ciliaris (471.09 g/kg DM) had the highest (p < 0.05) ADF values when compared to all other grasses at the maturity stage. Panicum maximum and T. triandra had the least (p < 0.05) ADL values when compared to all other grasses across all growth stages. Cenchrus ciliaris, C. gayana, E. curvula, D. eriantha, P. maximum and A. pubescens ranked better than all grasses (Table 5).

4. Discussion

4.1. Plant Height and Leaf Width

The plant height of a grass species is described as the shortest distance between the soil surface and the upper portion of the seed head (cm) [19]. The most common benefit of height in plants is their capability to acquire more sunlight [20], which then improves the photosynthesis process. Taller plants are generally more desirable simply because they show a competitive ability over shorter plants [21]. From this study, variation was not found between the grasses grown in a controlled environment and those reported in the literature in an open field. The current study recorded that T. triandra grass had significantly higher plant height value (135.59 cm) when compared to A. pubescens, C. ciliaris, E. curvula, C. gayana, F. arundinacea, P. maximum and D. glomerata grasses at maturity stage. The results for D. glomerata (57.10 cm) at elongation stage were in line with those reported by Zhouri et al. [22] (56.90 cm) and Vasileva et al. [23] (30–60 cm) in an open field. The A. pubescens, E. curvula, C. gayana, F. arundinacea, P. maximum, D. eriantha and T. triandra height values are within the range reported by van Oudtshoorn [24] in an open field. The results for P. maximum (80.35 cm) were slightly in line with those reported by Ojo et al. [25] (84.90 cm) in an open field experiment. Yigzaw [26] reported the comparable height value for C. ciliaris (114.68 cm) plants harvested at maturity stage.
Besides being feed material for livestock, rangelands are symbolic for most communal homelands because grass height is of supreme importance to livestock grazing. Werner et al. [27] stated that incorporating grass height measurements and quality estimates are presently being used to supply sufficient forage for animals. Urrea [28] and Olson & Richards [29] stated that ruminants grazing 3-leaf stage plants of a height above 20 cm had more bites as these plants are accessible due to their distance from the surface. The lips, teeth and jaws of a cow make it simple to get close to the ground surface. Furthermore, at this 3-leaf stage, there is a higher build-up of secondary tillers and plant leaf area initiation for photosynthetic activity [30] due to a high concentration of carbohydrate (CO) reserves before defoliation.
Leaves are most photosynthetically active when they reach expansion. The excess carbohydrate produced through photosynthesis helps produce leaves. Thus, photosynthate produced by the plant is used efficiently in growth and maintenance [31]. Panicum maximum leaves had significantly higher leaf width value (12.53 mm) across all growth stages when compared to all other grass species. Grasses with broad leaves have a bigger surface area that enhances the photosynthetic activity, thereby, producing more carbohydrates that will stimulate regrowth post defoliation or drought [32].

4.2. Number of Tillers and Leaves per Shoot
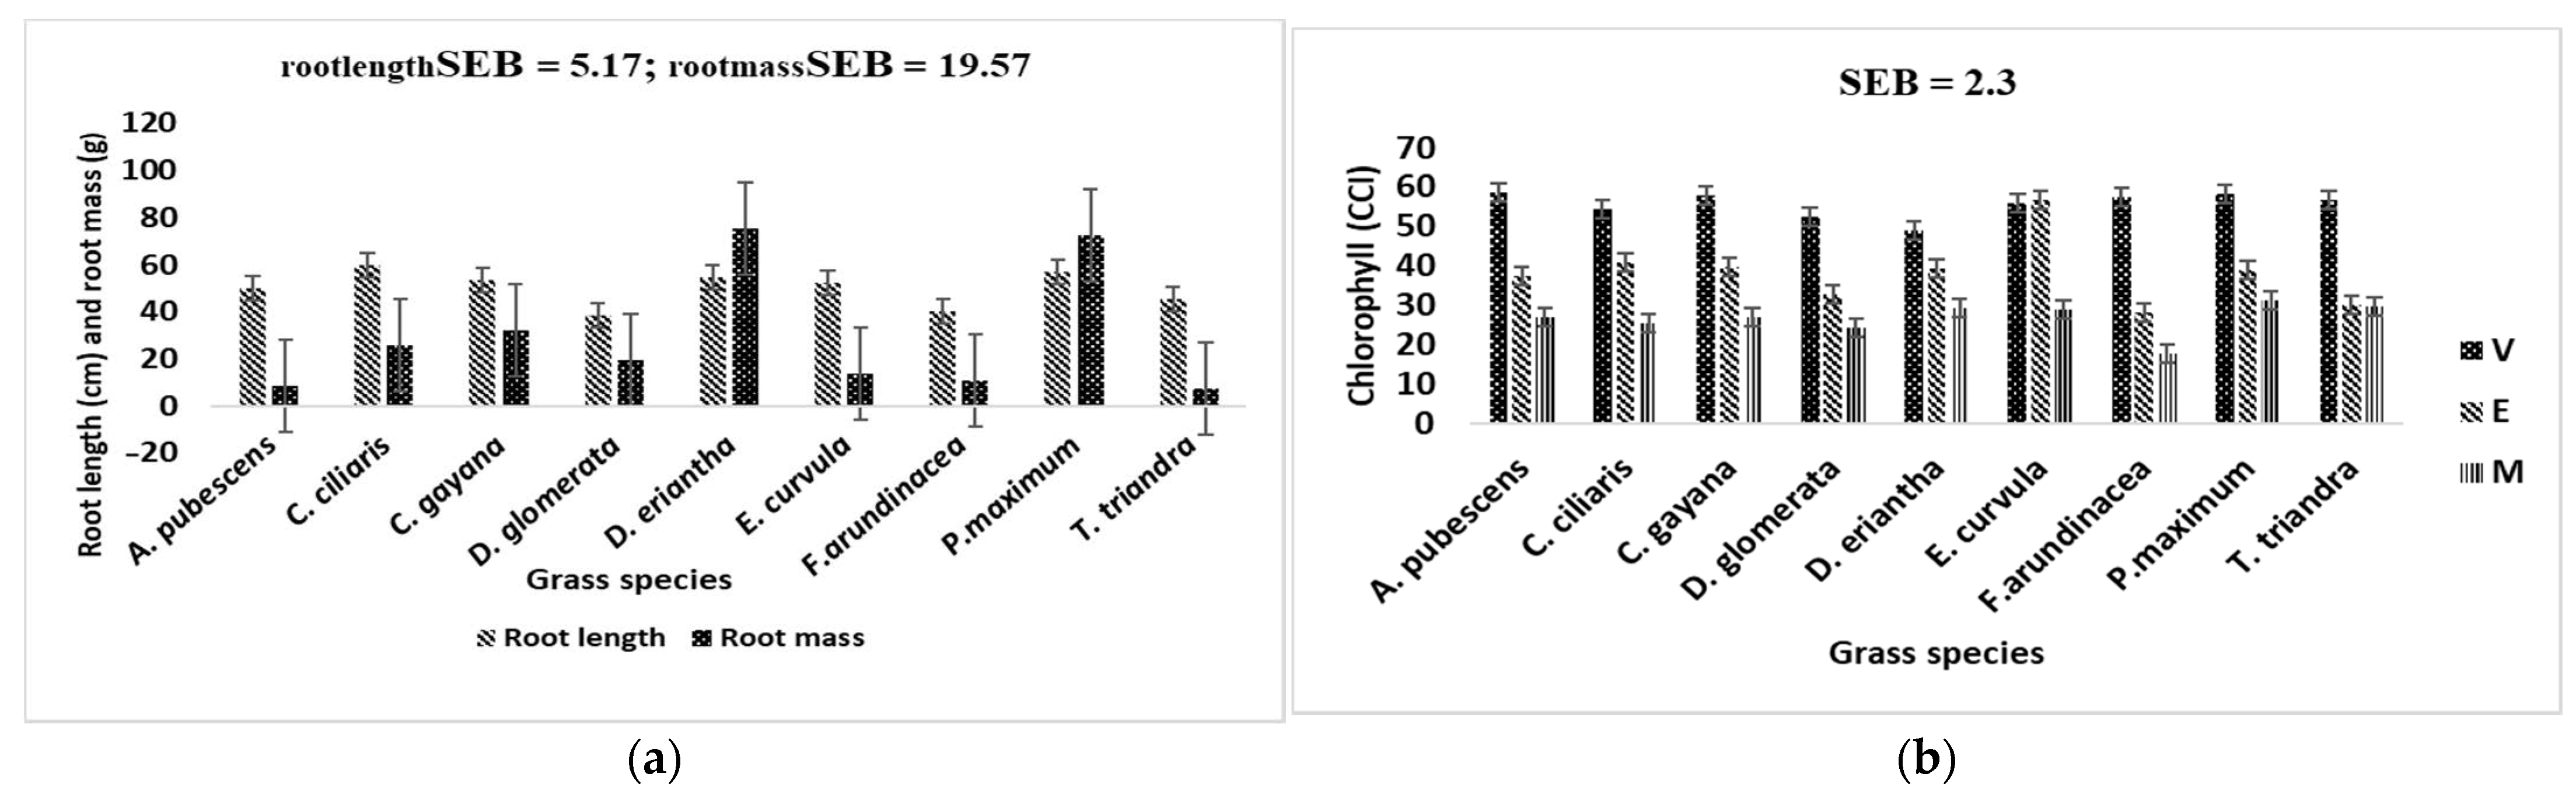
Tiller numbers are significantly important for plant adaptability and they increase the chance of survival under grazing pressure since they determine photosynthetic rates and ultimately, the availability of forage reserves for grass [33]. Mganga et al. [34] indicated that grass with more tillers would be a complement to the yield and resilience of a grass stand under defoliation. Tiller numbers are an indicator of resource use efficiency by different grass species and that the weight of a plant’s tiller determines its productivity [35].
Within each species C. ciliaris, C. gayana, D. glomerata, D. eriantha, E. curvula, P. maximum and T. triandra significantly had a higher number of tillers that developed at 4–6 months of age when compared to the same species at 0–2 months and 2–4 months of age. Nguku [36] indicated that C. gayana, like a creeping grass, has an excellent natural ability to spread since it produces stolons that creep over the ground and give roots at the nodes. de Lima Veras et al. [37] concluded that grass plants with a higher number of tillers are more persistent and contribute more resources to the next generation of reproductive tillers in the sward. For grasses like A. pubescens that did not necessarily show a higher tillering ability at the elongated nor maturity stages as compared to the previously mentioned grasses, this could be attributed to its growth habit. However, this trait might not completely be a disadvantage. Moolman et al. [38] stated that A. pubescens is classified a short grass with short internodes. Therefore, short grasses, with a large number of tillers are well adapted to regions with low, erratic precipitation, because it is advantageous to divide growth between meristems to ensure rapid regrowth after a period of drought stress. An increase in the number of nodes is followed by a production of an equal number of leaves in grass cut at maturity as compared to the harvesting of younger plants revealed that in pastures the usual number of leaves ranges between 2.2 to 4.7 leaves. This study shows that all grass species had the same number of leaves at the elongation stage. Also, C. gayana had a significantly higher number of leaves/shoot (7.50) per tiller when compared to other grasses at the maturity stage.
According to Opiyo et al. [39], when a pasture has a high number of leaves it is considered an important criterion because it suggests a high growth rate. The authors further reported that pastures with more leaves and better pigmentation are likely to achieve a greater photosynthetic capacity that will enable the grasses to grow rapidly [40]. Pasture leaves determine the quality of forage for livestock with green immature leaves contributing more to the increase in crude protein [41]. Higher leaf numbers in C. gayana and C. ciliaris may suggest better quality forage grasses that can be utilized for veld restoration of deteriorated rangelands. Also, C. ciliaris was observed in both the results of tiller numbers and leaf numbers as an outperforming grass. Therefore, this observation shows a close relationship between the number of leaves and the number of tillers.

4.3. Chlorophyll

Being the principal photoreceptor in the process of photosynthesis, chlorophyll is responsible for the transitioning of radiant energy into chemical energy in plant green tissues [42]. The concentration of chlorophyll within green plants indicates its capacity to absorb radiant energy and hence its photosynthetic efficiency [43,44]. At the maturity stage, P. maximum (31.43 CCI) grasses had significantly higher chlorophyll content than D. glomerata (24.29 CCI) and F. arundinacea (17.68 CCI). Our findings were in line with those of Biber [45] who observed chlorophyll content values in three species ranging from 11.98 CCI in Juncus roemerianus, 29.87 CCI in Spartina alterniflora and 30.68 CCI in Rhizophora mangle. With maturity, grasses tend to lose their vigor to photosynthesize at the 4-leaf stage of growth.

4.4. Root and Biomass Yield

Roots strength is a vital aspect of the ecology of rangeland perennial grass species. Many of the survival strategies of grass species from arid and semiarid areas, where rainfall is erratic and nutrients are generally low, depend on the root system [46]. Cenchrus ciliaris (60.08 ± 5.17 cm) had a longer root length when compared to F. arundinacea and D. glomerata at the maturity stage. Digitaria eriantha (75.46 ± 19.57 g) had the highest root mass than A. pubescens, F. arundinacea and T. triandra. Root depth provides the plants with penetration deeper into the soil layers for nutrient absorption and assists the plant to overcome the dormancy season. Adjolohoun et al. [47] found that the ability of all grass accessions to stand both biotic and abiotic stresses and be able to produce as much forage in less nutritive soils can be ascribed to their deep root development. Even though the morphological characteristics of the grass roots were not studied in this study, the thickness of the stem is always associated with thick roots system to function in high translocation from the roots to the whole plant through the xylem and phloem [14].
Basal cover plays a fundamental role concerning soil and water conservation. It contributes in the restoration of degraded lands especially in the areas where rainfall is erratic. Compared to vertical growth, decumbent species are more desirable in preventing land degradation [48] Basal cover also provides the quantity of biomass required by livestock and some of the main contributing factors contributing to biomass are plant height and number of tillers [49]. From our study, C. gayana, D. glomerata and P. maximum had the highest biomass yield at the 3-leaf stage. This is following the findings on morphological properties of these species, which might have been influenced by the fact that P. maximum and C. gayana from this study had thick and rigid tillers and have a high number of tillers. Previous findings of Marshall et al. [50] outline lower values when compared to those of this study. Tedder et al. [51] confirm that P. maximum height can contribute to yielding more biomass when compared with those species of lower height.

4.5. Chemical Composition

Ash: Forage quality is generally determined by the stage of growth which influences the nutritional composition of grass. Ash content in the forage diet is a representation of minerals (phosphorus, calcium, potassium, silica) that is critical in enhancing ruminant growth [52]. With the maturation of grasses, there was an observable variation in the ash content. In the present study, the P. maximum grass had a higher ash content (143.72 g/kg) than all other grasses at the elongation stage. This value was much higher than the findings of Odedire & Babayemi [53], of 120 g/kg at the maturity stage. Except for C. gayana and C. ciliaris, the overall ash values for all grasses from this study were found to be within the range from 30 to 120 g/kg DM as reported earlier by Wassie et al. [54].
Crude protein: Grasses are the mainstay in animal nutrition because their nutritive profile like protein has the primary responsibility to meet the nutritional demands of ruminants for their improved growth, maintenance and production [55]. It is generally known that a minimum > 120 to 180 g/kg DM CP in forage material is sufficient for optimum growth and performance of ruminants [56]. Some crude protein values from these investigated grasses in our current study do fall within this range. Our results indicate that with the aging of the grass species comes a decrease in the crude protein concentration, which is consistent with the findings of Keba et al. [57]. Eragrostis curvula CP content was highest followed by D. glomerata, F. arundinacea and P. maximum when compared to other grasses at the elongation stage. From this current study E. curvula (65.01 g/kg DM) had significantly lower CP content than the earlier report by Berhane et al. [58] (93 g/kg DM) and Erasmus et al. [59] (156 g/kg DM) while being higher than the one reported by Adejoro & Hassen [60] (48.9 g/kg DM). The CP value for P. maximum (56.41 g/kg DM) in this study at the elongation was lower than that of Omotoso et al. [61] who reported 114.0 g/kg DM on the same species. The variation of CP concentration in these grasses may be potentially justified by their genetic dissimilarities of grass species and their respective advancing age. The CP content from all grasses in this study was below the critical threshold level (85 g/kg DM/day) as recommended by NRC [62,63] on livestock and sheep.
Neutral and acid detergent fibres; and acid detergent lignin: Neutral detergent fibre (NDF) is a symbol of fibrous tissues found in grasses [64], of which more fibrous pasture correlated to extensive ruminal retention and restricts the intake rate. NDF content showed variation among the grasses, with an increasing trend in the NDF content with growing grass. Amiri & Shariff [65] justify that it is common for grasses to have more fibrous tissues as opposed to other forage types. Lima et al. [66] explained that a low forage intake is a consequence of NDF exceeding 72%. Our NDF values were within the range of 47%–60% (medium–good forage intake) and < 61% (low forage intake) [67]. Anthephora pubescens and T. triandra had the highest NDF content at the elongation and maturity stages. These observations are lower to those reported by Matlebyane et al. [68] in T. triandra of (723 g/kg DM), from three different chief areas of the Capricorn region in Limpopo province and again higher (653 g/kg DM) to the ones reported by van Niekerk & Hassen [69]. Based on observation the low NDF content (493.82 g/kg DM) of D. glomerata may have been a result of its thin stems and the high number of leaves. Coêlho et al. [70] also indicated that the stem diameter (thin) and the number of leaves (high number) can influence the low content of NDF.
Acid detergent fibre is a part of the fibre fraction of forage composed of cellulose and lignin. Cellulose and lignin are important as they influence forage digestibility and degradability by ruminants [63]. There was an increasing trend in the ADF content as the grasses were aging [71] with a decrease of the number of leaves on stems. Cenchrus ciliaris showed higher ADF values than all other grasses at elongation and maturity stages. A low acid detergent fibre is desirable because it gives more chance for ruminant to have better feed conversion efficiency to induce higher digestibility of forages [72,73]. Lignin is known for providing mechanical support for the tillers to impart strength and rigidity to plant cell walls and also provides resistance to disease and other biotic and abiotic stresses [74]. Older leaves are known to be more lignified than younger leaves [75].
Lignin deposits increase with plant growth (cellulose, hemicelluloses and lignin) [76], of which this negatively affects the degradability of substrates. The ADL value of C. ciliaris (217.21 g/kg DM) from this study was much higher than that reported by Ramirez et al. [77] and lower than that noted by Aganga & Autlwetse [78] (647 g/kg DM). Compared to small stock, cattle have a high concentration of microflora in the digestive tract that can able to properly breakdown the highly lignified grass since this lignin is highly resistant to chemical and enzymatic degradation [79].

5. Conclusions

Our results of the native grass species studied have shown dissimilarities in their agronomic, morphological and nutritional profile with A. pubescens, C. ciliaris, C. gayana, D. eriantha, E. curvula and P. maximum outperforming the rest of the grasses on most parameters (biomass yield; high chlorophyll content, number of leaves and tillers; long roots, root mass, crude protein and lignin). These grass properties show that these grasses can be of dual purpose in semi-arid regions, in that they can potentially establish rapidly, are resource competitive, their contribution towards veld restoration and also a potential feed source is essential, as compared to D. glomerata, F. arundinacea and T. triandra. Secondly, the application of grazing management principles is needed in order to avoid further land deterioration. Despite the outstanding individual nutritional status from these grasses, it is highly recommended that ruminants grazing these grasses as their sole diet should be given protein supplementation.

Author Contributions

Conceptualization, N.H.M., K.E.R., H.K.M., S.M., and L.E.M.; Data curation, N.H.M.; Formal analysis, N.H.M., K.E.R., H.K.M., S.M. and L.E.M.; Methodology, N.H.M., K.E.R., H.K.M., S.M.; Project administration, K.E.R.; Resources, L.E.M.; Supervision, K.E.R., H.K.M. and S.M.; Writing–original draft, N.H.M., and K.E.R.; Writing–review & editing, N.H.M., K.E.R., H.K.M., S.M. and L.E.M. All authors have read and agreed to the published version of the manuscript.

Funding

This research received no external funding.

Institutional Review Board Statement

The study was conducted according to the guidelines provided by North-West University Research Ethics Committee, with an approval ethic number NWU-01886-19-A5.

Informed Consent Statement

Informed consent was obtained from all subjects involved in the study.

Data Availability Statement

The data presented in this study are available on request from the corresponding author.

Acknowledgments

Authors fully acknowledge the financial support of National Research Fund, Meat Industry Trust and North West University bursaries.

Conflicts of Interest

The authors declare no conflict of interest.

References

  1. Ansah, T.; Osafo, E.L.K.; Hansen, H.H. Herbage yield and chemical composition of four varieties of Napier (Pennisetum purpureum) grass harvested at three different days after planting. Agric. Biol. J. N. Am. 2010, 15, 923–929. [Google Scholar] [CrossRef]
  2. Beyene, S.T.; Mlambo, V. Botanical and chemical composition of common grass species around dip-tank areas in semi-arid communal rangelands of Swaziland. Trop. Subtrop. Agroecosyst. 2012, 15, 143–152. [Google Scholar]
  3. Deyoung, R.W.; Hellgren, E.C.; Fulbright, T.E.; Robbins, W.F.; Humphreys, I.D. Modeling nutritional carrying capacity for translocated desert Bighorn sheep in western Texas. Restor. Ecol. 2000, 8, 57–65. [Google Scholar] [CrossRef] [Green Version]
  4. Kassahun, A.; Tegegne, A.; Aberra, D. Impacts of rangeland degradation on soil physical, chemical and seed bank properties along a gradient in three rangeland vegetation types in Somali Region, Eastern Ethiopia. Ethiop. J. Agric. Sci. 2012, 22, 84–101. [Google Scholar]
  5. Selemani, I.S.; Eik, L.O.; Holand, Ø.; Ådnøy, T.; Mtengeti, E.; Mushi, D. The effects of a deferred grazing system on rangeland vegetation in a north-western, semi-arid region of Tanzania. Afr. J. Range Forage Sci. 2013, 30, 141–148. [Google Scholar] [CrossRef]
  6. Lascano, C.E.; Schmidt, A.; Barahona, R. Forage quality and the environment. Int. Grassl. Congr. 2001, 19, 1–19. [Google Scholar]
  7. Zimmermann, J.; Higgins, S.I.; Grimm, V.; Hoffmann, J.; Münkemüller, T.; Linstädter, A. Recruitment filters in a perennial grassland: The interactive roles of fire, competitors, moisture and seed availability. J. Ecol. 2008, 96, 1033–1044. [Google Scholar] [CrossRef]
  8. Koukolová, V.; Homolka, P.; Koukol, O.; Jančík, F. Nutritive value of Trifolium pratense L. for ruminants estimated from in situ ruminal degradation of neutral detergent fibre and in vivo digestibility of organic matter and energy. Czech J. Anim. Sci. 2010, 55, 372–381. [Google Scholar] [CrossRef] [Green Version]
  9. Gustavsson, A.M. A developmental scale for perennial forage grasses based on the decimal code framework. Grass Forage Sci. 2011, 66, 93–108. [Google Scholar] [CrossRef]
  10. Ravhuhali, K.E.; Motsepe, K.; Mnisi, C.M.; Sebolai, T. Chemical composition and in vitro ruminal DM degradability of native pasture grasses and their plant parts. Range Manag. Agrofor. 2018, 39, 243–250. [Google Scholar]
  11. Arzani, H.; Basiri, M.; Khatibi, F.; Ghorbani, G. Nutritive value of some Zagros Mountain rangeland species. Small Rumin. Res. 2006, 65, 128–135. [Google Scholar] [CrossRef]
  12. Elberse, W.T.; Berendse, F. A comparative study of the growth and morphology of eight grass species from habitats with different nutrient availabilities. Funct. Ecol. 1993, 7, 223–229. [Google Scholar] [CrossRef]
  13. Tefera, S. Local knowledge of grasses in semi-arid South Africa: Comparison of forage traits, status and trends, and similarities with field studies. In Proceedings of the Grassland Society of Southern Africa 49th Annual Congress, Wilderness, Western Cape, South Africa, 3–8 July 2016. [Google Scholar]
  14. Ravhuhali, K.E.; Mlambo, V.; Beyene, T.S.; Palamuleni, L.G. A comparative analysis of the morphology and nutritive value of five South African native grass species grown under controlled conditions. Afr. J. Range Forage Sci. 2019, 36, 67–70. [Google Scholar] [CrossRef]
  15. Aamlid, T.S.; Kvalbein, A.; Waalen, W. Handbook Turf Grass Winter Survival: Grass Species and Varieties for Severe Winter Climates; NIBIO Turfgrass Research Group, Norwegian Institute of Bioeconomy Research: Oslo, Norway, 2020. [Google Scholar]
  16. AOAC. Official Methods of Analysis of AOAC International, 18th ed.; Association of Official Analytical Chemists: Arlington, VA, USA, 2012. [Google Scholar]
  17. Van Soest, P.J.; Robertson, J.B.; Lewis, B.A. Methods for dietary fiber, neutral detergent fiber, and nonstarch polysaccharides in relation to animal nutrition. J. Dairy Sci. 1991, 74, 3583–3597. [Google Scholar] [CrossRef]
  18. SAS. Statistical Analysis System. Statistics Software. Release 10; SAS Institute Inc.: Cary, NC, USA, 2010. [Google Scholar]
  19. Ozkose, A.; Tamkoc, A. Morphological and agronomic characteristics of perennial rye grass (Lolium perenne L.) genotype. Turk. J. Field Crops 2014, 19, 231–237. [Google Scholar] [CrossRef] [Green Version]
  20. Falster, D.S.; Westoby, M. Plant height and evolutionary games. Trends Ecol. Evol. 2003, 18, 337–343. [Google Scholar] [CrossRef]
  21. Moles, A.T.; Warton, D.I.; Warman, L.; Swenson, N.G.; Laffan, S.W.; Zanne, A.E.; Pitman, A.; Hemmings, F.A.; Leishman, M.R. Global patterns in plant height. J. Ecol. 2009, 97, 923–932. [Google Scholar] [CrossRef]
  22. Zhouri, L.; Kallida, R.; Shaimi, N.; Barre, P.; Volaire, F.; Gaboun, F.; Fakiri, M. Evaluation of cocksfoot (Dactylis glomerata L.) population for drought survival and behaviour. Saudi J. Biol. Sci. 2019, 26, 49–56. [Google Scholar] [CrossRef]
  23. Vasileva, V.; Kocheva, K.; Mincheva, J.; Georgiev, G.; Ilieva, A.; Porqueddu, C. Physiological analysis of growth and nitrogen metabolism of intercropped pasture species subterranean clover (Trifolium subterraneum L.) and cocksfoot (Dactylis glomerata L.) supplemented with different forms of inorganic nitrogen. J. Plant Nutr. 2017, 40, 2116–2126. [Google Scholar] [CrossRef]
  24. Van Oudtshoorn, F. Guide to Grasses of Southern Africa; Briza Publications: Pretoria, South Africa, 2014. [Google Scholar]
  25. Ojo, V.O.A.; Dele, T.A.; Amole, U.Y.; Adeoye, S.A.; Hassan, J.A.O.; Idowu, O.J. Effect of intercropping Panicum Maximum var. Ntchisi and Lablab purpureus on the growth, yield and chemical composition of Panicum maximum var. Ntchisi at different harvesting times. Pak. J. Biol. Sci. 2013, 10, 1–4. [Google Scholar] [CrossRef]
  26. Yigzaw, G.W. Effect of harvesting stage on yield and nutritive value of buffel grass (Cenchrus ciliaris linn) under irrigation at Gewane district, north eastern Ethiopia. J. Sci. Innov. Res. 2019, 8, 7–12. [Google Scholar]
  27. Werner, J.; Umstatter, C.; Leso, L.; Kennedy, E.; Geoghegan, A.; Shalloo, L.; Schick, M.; O’Brien, B. Evaluation and application potential of an accelerometer-based collar device for measuring grazing behaviour of dairy cows. Animal 2019, 13, 2070–2079. [Google Scholar] [CrossRef] [PubMed] [Green Version]
  28. Urrea, J.L. Grass Height in Cow Nutrition: Size does Matter; CIAT Blog: Medellín, Colobmbia, 2019. [Google Scholar]
  29. Olson, A.B.E.; Richards, J.H. Tussock regrowth after grazing intercalary: Meristem and axillary bud activity of tillers of Agropyron desertorum. Oikos 1988, 51, 374–382. [Google Scholar] [CrossRef]
  30. Manske, L.L. General Description of Grass Growth and Development and Defoliation Resistance Mechanisms. NDSU Dickson Research Extension Center. Range Management Report DREC 98-1022; NDSU Dickinson Research Extension Center: Dickinson, ND, USA, 1998. [Google Scholar]
  31. Trlica, M.J. Grass Growth and Response to Grazing. Service Action; No. 6.108; Colorado State University: Fort Collins, CO, USA, 1992. [Google Scholar]
  32. Bhattarai, S.P.; Fox, J.; Gyasi-Agyei, Y. Enhancing buffel grass seed germination by acid treatment for rapid vegetation establishment on railway batters. J. Arid Environ. 2008, 72, 255–262. [Google Scholar] [CrossRef]
  33. Laidlaw, A.S. The relationship between tiller appearance in spring and contribution to dry-matter yield in perennial ryegrass (Lolium perenne L.) cultivars differing in heading date. Grass Forage Sci. 2005, 60, 200–209. [Google Scholar] [CrossRef]
  34. Mganga, K.Z.; Musimba, N.K.; Nyariki, D.M.; Nyangito, M.; Mwang’omb, A.; Ekaya, W.; Mwang’ombe, A.; Muiru, W.; Books, R.; Oer, R.; et al. Influence of forage value on the choice of grass species to combat desertification in semi-arid regions of Kenya. In Proceedings of the Fifth African Higher Education week and RUFORUM Biennial Conference, “Linking Agricultural Universities with Civil Society, the Private Sector, Governments and Other Stakeholders in Support of Agricultural Development in Africa”, Cape Town, South Africa, 17–21 October 2016; pp. 537–541. [Google Scholar]
  35. Montagner, D.B.; Nascimento Júnior, D.D.; Vilela, H.H.; Sousa, B.M.D.L.; Euclides, V.P.B.; Silva, S.C.D.; Carloto, M.N. Tillering dynamics in pastures of guinea grass subjected to grazing severities under intermittent stocking. Rev. Bras. Zootec. 2012, 41, 544–549. [Google Scholar] [CrossRef] [Green Version]
  36. Nguku, S.A. An Evaluation of Brachiaria Grass Cultivars Productivity in Semi-Arid Kenya. Master’s Thesis, South Eastern Kenya University, Kitui, Kenya, 2015. [Google Scholar]
  37. De Lima Veras, E.L.; Difante, G.D.S.; Chaves Gurgel, A.L.; Gracianoda Costa, A.B.; Gomes Rodrigues, J.; Marques Costa, C.; Emerenciano Neto, J.V.; Gusmão Pereira, M.D.; Ramon Costa, P. Tillering and structural characteristics of panicum cultivars in the Brazilian semiarid region. Sustainability 2020, 12, 3849. [Google Scholar] [CrossRef]
  38. Moolman, A.C.; Van Rooyen, N.; Van Rooyen, M.W. The effect of drought stress on the dry matter production, growth rate and biomass allocation of Anthephora pubescens Nees. S. Afr. J. Bot. 1996, 62, 41–45. [Google Scholar] [CrossRef] [Green Version]
  39. Opiyo, F.E.O.; Ekaya, W.N.; Nyariki, D.M.; Mureithi, S.M. Seedbed preparation influence on morphometric characteristics of perennial grasses of a semi-arid rangeland in Kenya. Afr. J. Plant Sci. 2011, 5, 460–468. [Google Scholar]
  40. Mnene, W.N. Strategies to Increase Success Rates in Natural Pasture Improvement through Re-Seeding Degraded Semi-Arid Rangelands of Kenya. Ph.D. Thesis, University of Nairobi, Nairobi, Kenya, 2006. [Google Scholar]
  41. Arzani, H.; Zohdi, M.; Fish, E.; Amiri, G.H.Z.; Nikkhah, A.; Wester, D. Phenological effects on forage quality of five grass species. J Range Manag. 2004, 57, 624–629. [Google Scholar] [CrossRef]
  42. Hughes, M.P.; Mlambo, V.; Lallo, C.H.O.; Basha, N.A.D.; Nsahlai, I.V.; Jennings, P.G.A. Accuracy of two optical chlorophyll meters in predicting chemical composition and in vitro ruminal organic matter degradability of Brachiaria hybrid, Megathyrsus maximus, and Paspalum atratum. Anim. Nutr. 2017, 3, 67–76. [Google Scholar] [CrossRef] [PubMed]
  43. Mishra, S.S.; Mishra, K.N.; Mahananda, M.R. Chlorophyll content studies from inception of leaf buds to leaf-fall stages of Teak (Tectona Grandis) of Kapilash forest division, Dhenkanal, Odisha. J. Glob. Biosci. 2013, 2, 26–30. [Google Scholar]
  44. Filimon, R.V.; Rotaru, L.; Filimon, R.M. Quantitative investigation of leaf photosynthetic pigments during annual biological cycle of Vitis vinifera L. table grape cultivars. S. Afr. J. Enol. Vitic. 2016, 37, 1–14. [Google Scholar] [CrossRef] [Green Version]
  45. Biber, P.D. Evaluating a chlorophyll content meter on three coastal wetland plant species. J. Agric. Food Environ. Sci. 2007, 1, 1–11. [Google Scholar]
  46. Brown, R. The water relations of range plants: Adaptations to water deficits. Wildl. Plants Physiol. Ecol. Dev. Morphol. 1995, 47, 291–413. [Google Scholar]
  47. Adjolohoun, S.; Bindelle, J.; Adandedjan, C.; Colinet, G.; Buldgen, A. Soil chemical changes following 3-year legume or grass leys in west Africa. Trop. Grasslands 2010, 44, 115–122. [Google Scholar]
  48. Demlew, M.; Alemu, B.; Awuk, A. Evaluation of agronomic performance and biomass yield of buffel grass and silver leaf Desmodium grown in pure stands and in mixture at different harvesting times in Gozamen district, east Gojjam Zone, Ethiopia. Greener J. Agric. Sci. 2019, 9, 396–404. [Google Scholar]
  49. Ndathi, A.; Bosma, L.; Kioko, T.; Kadenyi, N.; Wambua, S.; Van Steenbergen, F.; Musimba, N. Morpho-ecological characteristics of forage grasses used to rehabilitate degraded African rangelands. Rangel. J. 2019, 1–19. [Google Scholar]
  50. Marshall, V.M.; Lewis, M.M.; Ostendorf, B. Buffel grass (Cenchrus ciliaris) as an invader and threat to biodiversity in arid environments: A review. J. Arid Environ. 2012, 78, 1–12. [Google Scholar] [CrossRef]
  51. Tedder, M.J.; Morris, C.D.; Fynn, R.W.S.; Kirkman, K.P. Grass-on-grass competition along a catenal gradient in mesic grassland, South Africa. Afr. J. Range Forage Sci. 2011, 28, 79–85. [Google Scholar] [CrossRef]
  52. Rambau, M.D.; Fushai, F.; Baloyi, J.J. Productivity, chemical composition and ruminal degradability of irrigated Napier grass leaves harvested at three stages of maturity. S. Afr. J. Anim. Sci. 2016, 46, 388–408. [Google Scholar] [CrossRef] [Green Version]
  53. Odedire, J.A.; Babayemi, O.J. Comparative studies on the yield and chemical composition of Panicum maximum and Andropogon gayanus as influenced by Tephrosia candida and Leucaena leucocephala. Livest. Res. Rural Dev. 2008, 20, 1–8. [Google Scholar]
  54. Wassie, W.A.; Tsegay, B.A.; Wolde, A.T.; Limeneh, B.A. Evaluation of morphological characteristics, yield and nutritive value of Brachiaria grass ecotypes in Northwestern Ethiopia. Agric. Food Secur. 2018, 7, 89. [Google Scholar] [CrossRef]
  55. Daba, A.W.; Qureshi, A.S.; Nisaren, B.N. Evaluation of some Rhodes grass (Chloris gayana) genotypes for their salt tolerance, biomass yield and nutrient composition. Appl. Sci. 2019, 9, 143. [Google Scholar] [CrossRef] [Green Version]
  56. Soliva, C.R.; Amelchanka, S.L.; Kreuzer, M. The requirements for rumen-degradable protein per unit of fermentable organic matter differ between fibrous feed sources. Front. Microbiol. 2015, 6, 1–17. [Google Scholar] [CrossRef]
  57. Keba, H.T.; Madakadze, I.C.; Angassa, A.; Hassen, A. Nutritive value of grasses in semi-arid rangelands of Ethiopia: Local experience-based herbage preference evaluation versus laboratory analysis. Asian Australas. J. Anim. Sci. 2013, 26, 366–377. [Google Scholar] [CrossRef] [Green Version]
  58. Berhane, G.; Eik, L.O.; Tolera, A. Chemical composition and in vitro gas production of vetch (Vicia sativa) and some browse and grass species in northern Ethiopia. Afr. J. Range Forage Sci. 2006, 23, 69–75. [Google Scholar] [CrossRef]
  59. Erasmus, L.J.; Botha, P.M.; Cruywagen, C.W.; Meissner, H.H. Amino acid profile and intestinal digestibility in dairy cows of rumen-undegradable protein from various feedstuffs. J. Dairy Sci. 1994, 77, 541–551. [Google Scholar] [CrossRef]
  60. Adejoro, F.A.; Hassen, A. Effect of supplementing or treating Eragrostis curvula hay with urea or nitrate on its digestibility and in vitro fermentation. S. Afr. J. Anim. Sci. 2017, 47, 168–177. [Google Scholar] [CrossRef] [Green Version]
  61. Omotoso, O.B.; Ogunlusi, O.K.; Fajemisin, A.N.; Alokan, J.A. Growth response of west African dwarf sheep fed guinea grass substituted with Mulberry. In Proceedings of the 10th International Rangeland Congress, Saskatoon, SK, Canada, 16–22 July 2016; pp. 341–343. [Google Scholar]
  62. National Research Council (NRC). Nutrient Requirements of Laboratory Animals: 1995; National Academies Press: Washington, DC, USA, 1995; pp. 38–53. [Google Scholar]
  63. National Research Council (NRC). Nutrient Requirements of Beef Cattle, 7th ed.; NRC: Washington, DC, USA, 2000. [Google Scholar]
  64. Amary, N.M. Assessing the Quality of Forage for Livestock in a Semi-Arid Pastoral System in South Africa. Master’s Thesis, University of the Western Cape, Tigerberg City, South Africa, 2016. [Google Scholar]
  65. Amiri, F.; Mohamed Shariff, A.R. Comparison of nutritive values of grasses and legume species using forage quality index. Songklanakarin J. Sci. Technol. 2012, 34, 577–586. [Google Scholar]
  66. Lima, L.G.D.; Nussio, L.G.; Gonçalves, J.R.S.; Simas, J.M.C.D.; Pires, A.V.; Santos, F.A.P. Frontes de amido e proteína em dietas para vacas leiteiras em dietas à base de capim elefante. Sci. Agric. 2002, 59, 19–27. [Google Scholar] [CrossRef] [Green Version]
  67. Schroeder, K. Feeding Cull Potatoes to Dairy and Beef Cattle; University of Wisconsin Extension: Portage Country, WI, USA, 2012; Available online: http://citeseerx.ist.psu.edu/viewdoc/download?doi=10.1.1.278.5494&rep=rep1&type=pdf (accessed on 28 December 2020).
  68. Matlebyane, M.M.; Ng’ambi, J.W.W.; Aregheore, E.M. Relationships between chemical composition and in vitro digestibility of some common forage species used for ruminant livestock production in three chief areas of Capricorn region, Limpopo Province, South Africa. Res. J. Agric. Biol. Sci. 2009, 5, 138–149. [Google Scholar]
  69. Van Niekerk, W.A.; Hassen, A. Qualitative evaluation of four subtropical grasses as standing hay: Diet selection, rumen fermentation and partial digestibility by sheep. Afr. J. Range Forage Sci. 2009, 26, 69–74. [Google Scholar] [CrossRef]
  70. Coêlho, J.J.; de Mello, A.C.L.; dos Santos, M.V.F.; Dubeux, J.C.B., Jr.; da Cunha, M.V.; Lira, M.A. Prediction of the nutritional value of grass species in the semiarid region by repeatability analysis. Pesqui. Agropecu. Bras. 2018, 53, 378–385. [Google Scholar] [CrossRef] [Green Version]
  71. Galindo, F.S.; Buzetti, S.; Filho, M.C.M.T.; Dupas, E. Rates and sources of nitrogen fertilizer application on yield and quality of Panicum maximum cv. Mombasa. Idesia 2019, 37, 67–73. [Google Scholar] [CrossRef]
  72. Abdullah, M.; Rafay, M.; Hussain, T.; Ahmad, H.; Tahir, U.; Rasheed, F.; Ruby, T.; Khalil, S. Nutritive potential and palatability preference of browse foliage by livestock in arid rangelands of Cholistan desert (Pakistan). J. Anim. Plant Sci. 2017, 27, 1656–1664. [Google Scholar]
  73. Aung, M.; Thein, S.M.; Phaw, N.C.; Phyo, T.H.; Phyo, Y.P.; Phyo, N.Y.; Van Bik, L.; Bo, A.B.; Maw, H.; Maw, A.M.; et al. In vitro fermentation of grass-based diet supplemented with two different tree legume forages in ruminant. Adv. Anim. Vet. Sci. 2019, 10, 272–279. [Google Scholar] [CrossRef] [Green Version]
  74. Ndozi, H.M. Effects of Chemical Treatment on Nutrient Content and Palatability of Senegalia mellifera and Catophtactes alexandrii Bush-Based Feeds. Master’s Thesis, University of Namibia, Windhoek, Namibia, 2019. [Google Scholar]
  75. Limenih, B.A. Evaluation of the Agronomic, Utilization, Nutritive and Feeding Value of desho Grass (Pennisetum pedicellatum). Ph.D. Thesis, Jimma University, Jimma, Ethiopia, 2016. [Google Scholar]
  76. Agza, B.; Kassa, B.; Zewdu, S.; Aklilu, E.; Alemu, F. Forage yield and nutritive value of natural pastures at varying levels of maturity in North West Lowlands of Ethiopia. World J. Agric. Sci. 2013, 1, 106–112. [Google Scholar]
  77. Ramírez, G.R.; Aguilera-Gonzalez, J.C.; Garcia-Diaz, G.; Núñez-González, A.M. Effect of urea treatment on chemical composition and digestion of Cenchrus ciliaris and Cynodon dactylon hays and Zea mays residues. Cellulose 2007, 38, 1036–1041. [Google Scholar]
  78. Aganga, A.A.; Autlwetse, M.N. Utilization of sorghum forage, millet forage, veldt grass and buffel grass by Tswana sheep and goats when fed Lablab purpureus L. as protein supplement. Asian Australas. J. Anim. Sci. 2000, 13, 1127–1132. [Google Scholar] [CrossRef]
  79. Bayble, T.; Melaku, S.; Prasad, N.K. Effects of cutting dates on nutritive value of Napier (Pennisetum purpureum) grass planted sole and in association with Desmodium (Desmodium intortum) or Lablab (Lablab purpureus). Livest. Res. Rural Dev. 2007, 19, 120–136. [Google Scholar]
Figure 1. Effect of grass species and growth stage on biomass (g/pot) of nine selected grass species grown under controlled conditions. V = vegetative stage; E = elongated stage; M = maturity stage. SEB = standard error bar.
Agronomy 11 00052 g001
Figure 2. Effect of grass species on root length (cm) and root weight (g) (a) and chlorophyll content index (CCI) (b), of nine selected grass species at maturity stage. V = vegetative stage; E = elongated stage; M = maturity stage. SEB = standard error bar.
Agronomy 11 00052 g002
Table 1. Effect of grass species and growth stage on plant height (cm) and leaf width (mm) of nine selected grass species grown under controlled conditions.
Plant Height (cm)Leaf Width (mm)
Grass SpeciesVEMVEM
A. pubescens25.60 aC47.33 cB113.21 bA4.98 cC6.37 cB8.04 cdA
C. ciliaris34.52 aC76.37 aB107.28 bcA3.95 cdC7.86 bcB12.54 bA
C. gayana25.61 aC54.94 bcB89.77 eA5.55 bcC7.40 bcB8.49 cA
D. glomerata23.96 aC36.78 cB57.10 fA3.84 cdeC6.01 cB7.46 cdA
D. eriantha28.53 aC52.18 bcB118.00 abA7.04 bB8.97 bB12.55 bA
E. curvula37.91 aC69.96 abB102.99 bcdA1.89 eC3.65 dB4.76 eA
F. arundinacea25.07 aC40.91 cdB84.69 deA2.92 deC6.43 cB7.90 cdA
P. maximum27.48 aC51.30 cB80.35 eA12.53 aC15.27 aB17.88 aA
T. triandra29.77 aC70.36 abB135.59 aA4.02 cdeB6.11 cA6.27 deA
SE3.5080.371
a,b,c,d,e,f = Means with different superscripts within each growth stage are significantly different (p < 0.05); ABC = Means with different superscripts within each species are significantly different (p < 0.05); SE = Standard error; V= vegetative stage; E= elongated stage; M = maturity.
Table 2. Effect of grass species and age on the average number of tillers and leaves (LN/shoot) and tillers (log10) of nine selected grass species grown under controlled conditions.
Average Number of Tillers (log10)Average Number of Leaves (LN/shoot) (log10)
Grass Species0–2 Months2–4 Month4–6 Months0–2 Months2–4 Months4–6 Months
A. pubescens0.30 abB0.81 abA0.87 cdeA0.32 abC0.60 aB0.92 bcdA
C. ciliaris0.25 abC0.65 cB0.80 eA0.28 bcC0.58 aB0.98 bA
C. gayana0.29 abC0.68 cB1.15 abA0.30 abcC0.63 aB1.11 aA
D. glomerata0.21 bC0.65 cB0.92 cdA0.37 aC0.62 aB0.92 bcdA
D. eriantha0.30 aC0.48 dB0.85 deA0.23 cC0.60 aB0.90 cdA
E. curvula0.24 abC0.48 dB1.07 bA0.300 abcC0.58 aB0.88 dA
F. arundinacea0.27 abB0.90 aA0.95 cA0.27 bcC0.59 aB0.95 bcA
P. maximum0.30 abC0.80 bB1.20 aA0.300 abcC0.61 aB0.92 bcdA
T. triandra0.27 abC0.56 dB0.79 eA0.27 bcC0.58 aB0.99 bA
SE0.030.35
a,b,c,d,e = Means with different superscripts within each growth stage are significantly different (p < 0.05); ABC = Means with different superscripts within each species are significantly different (p < 0.05); SE = Standard error.
Table 3. Effect of species and growth stage on ash, organic matter (OM) and crude protein (CP) (DM in g/kg) in nine selected grass species grown under controlled conditions.
Ash (g/kg DM) OM (g/kg DM)CP (g/kg DM)
Grass SpeciesVEMVEMVEM
A. pubescens116.68 dA107.45 eB78.27 fC836.41 bA835.11 cA849.88 bcA55.39 eA51.63 bcA40.68 bcB
C. ciliaris127.58 bA130.03 bA131.41 bA827.10 bA830.38 cA832.59 deA87.27 cA35.01 dB30.32 dB
C. gayana119.05 dB132.69 bA120.66 cB824.22 bB822.68 cB842.22 bcdA87.63 cA40.00 dB37.10 bcdB
D. glomerata121.88 cdA115.28 cdB123.56 cA822.50 bA835.15 cA836.15 cdeA75.95 dA61.38 abB59.18 aB
D. eriantha125.64 bcA89.02 fC113.39 dB821.53 bC855.91 bB877.59 aA64.52 eA42.12 cdB39.01 bcdB
E. curvula90.83 eA75.24 gC83.69 fB864.60 aB890.98 aA881.76 aA102.29 bA65.01 aB58.12 aB
F. arundinacea142.76 aA111.37 deC118.13 cdB757.12 cB825.52 cA828.11 deA120.14 aA60.31 abB55.19 aB
P. maximum130.60 bC143.72 aB148.92 aA828.09 bA826.80 cA821.24 eA97.07 bcA56.41 abB45.07 bC
T. triandra116.48 dA117.40 cA106.41 eB838.03 bB838.24 cB855.87 bA35.79 fA34.84 dA33.27 cdA
SE1.925.893.49
a,b,c,d,e,f = Means with different superscripts within each growth stage are significantly different at (p < 0.05) with each parameter; ABC = Means with different superscripts within each species are significantly different at (p < 0.05) with each parameter; SE = Standard error; DM = dry matter; V = vegetative stage; E = elongated stage; M = maturity stage.
Table 4. Effect of species and growth stage on fibre fraction and lignin (DM in g/kg) in nine selected grass species grown under controlled conditions.
NDFADFADL
Grass SpeciesVEMVEMVEM
A. pubescens553.71 cB667.44 aA687.94 aA418.04 aB450.75 aA449.17 abA131.59 aB164.43 aA191.56 bA
C. ciliaris581.03 bcB665.57 aA678.43 abA390.62 bC446.99 aB471.09 aA133.98 aB163.06 aB217.21 abA
C. gayana557.14 cB599.89 bA638.85 bcA324.68 cB338.00 dB384.34 dA168.07 aB185.62 aA206.06 abA
D. glomerata470.27 dA483.37 dA493.82 dA325.41 cB363.17 cA375.63 dA167.66 aA177.00 aA201.35 bA
D. eriantha620.97 abB644.78 aA665.05 abcA406.54 abB415.09 bA436.90 bA162.27 aB194.91 aB240.45 aA
E. curvula627.01 aA643.02 aA667.10 abcA341.06 cC365.68 cB426.58 bcA163.69 aB194.19 aA213.42 abA
F. arundinacea410.70 eB460.71 dA487.79 dA293.48 dC339.06 dB374.45 dA148.73 aB166.91 aB216.50 abA
P. maximum507.95 dC556.01 cB629.01 cA292.79 dC318.02 dB374.09 dA72.87 bB91.78 bA113.38 cA
T. triandra613.12 abB648.67 aA688.01 aA397.88 abA405.15 bA413.77 cA79.39 bB95.18 bA130.89 cA
SE15.018.0413.09
a,b,c,d,e = Means with different superscripts within each growth stage are significantly different (p < 0.05); ABC = Means with different superscripts within each species are significantly different at (p < 0.05); SE = Standard error; DM = dry matter; V = vegetative stage; E = elongated stage; M = maturity stage.
Table 5. Veld restoration potential rankings of some selected grass species based on their agronomic, morphological and nutritional value parameters assessed at various growth stages.
Grass SpeciesPHLWTNNLCCIRLRMBIOASHOMNDFADFADLCPAverage
A. pubescens556664221659335
C. ciliaris873559658468446
C. gayana468976797343756
D. glomerata144221575524664
D. eriantha682347943877925
E. curvula715795432985886
F. arundinacea237112316112594
P. maximum399488889231176
T. triandra921833164796214
PH = plant height; LW = leaf width; TN = tiller numbers; NL = number of leaves; CCI = chlorophyll; RL = root length; RM = root mass; BIO = biomass; Ash, CP = crude protein; OM = organic matter; NDF = neutral detergent fibre; ADF = acid detergent fibre; ADL = acid detergent lignin.
Publisher’s Note: MDPI stays neutral with regard to jurisdictional claims in published maps and institutional affiliations.

