Article

Assessment of the Capacity of Beneficial Bacterial Inoculants to Enhance Canola (Brassica napus L.) Growth under Low Water Activity

1
Centre for Regional and Rural Futures, Faculty of Science, Engineering and Built Environment, Deakin University, Geelong 3022, Australia
2
Centre for Cellular and Molecular Biology, School of Life and Environmental Sciences, Deakin University, Geelong 3022, Australia
3
South Australian Research and Development Institute, GPO Box 397, Adelaide 5001, Australia
4
College of Medicine and Public Health, Flinders University, Adelaide 5042, Australia
*
Author to whom correspondence should be addressed.
Agronomy 2020, 10(9), 1449; https://doi.org/10.3390/agronomy10091449
Submission received: 8 August 2020 / Revised: 18 September 2020 / Accepted: 18 September 2020 / Published: 22 September 2020

Abstract

:
Canola (Brassica napus L.) is the third largest crop produced in Australia after wheat and barley. For such crops, the variability of water access, reduced long-term annual rainfall and increasing water prices, higher overall production costs, and variability in production quantity and quality are driving the exploration of new tools to maintain production in an economical and environmentally sustainable way. Microorganisms associated with the rhizosphere have been shown to enhance plant growth and offer a potential way to maintain or even increase crop production quality and yield in an environmentally sustainable way. Here, seven bacterial isolates from canola rhizosphere samples are shown to enhance canola growth, particularly in low water activity systems. The seven strains all possessed commonly described plant growth promoting traits, including the ability to produce indole-3-acetic acid and 1-aminocyclopropane-1-carboxylate deaminase, and the capacity to solubilise nutrients (Fe2+/3+ and PO43−). When the isolates were inoculated at the time of sowing in pot-based systems with either sand or clay loam media, and in field trials, a significant increase in dry root and shoot biomass was recorded compared to uninoculated controls. It is likely that the strains’ plant growth promoting capacity under water stress is due to the combined effects of the bacterial phenotypes examined here.

1. Introduction

In Australia, canola (Brassica napus L.) is the third largest broad-acre crop after wheat and barley [1]. Annually, Australia’s canola exports exceed one million tonnes, contributing over AU$2 billion to its economy [2,3,4,5]. Water availability is a limiting factor in farming systems in Australia, particularly in late autumn/early winter when canola is planted.
During the drought-sensitive phenological stages, low water activity causes reduced germination, flower development and seed yield [6,7,8]. When compared to plants grown with ideal water availability, simulated drought stress has been shown to reduce germination efficiency by around 80% for seeds grown in approximately 50% (−10 to −12 bars, the equivalent −1.0 to −1.2 MPa) polyethylene glycol (PEG), and result in overall yield losses of 22% to over 50% [6,7,8,9]. Application of tools that limit water loss such as antitranspirants have been shown to increase germination, flower development, and seed yield [6,7,8].
There has been increasing interest in utilising plant growth promoting bacteria (PGPB) to offset increasing fertiliser inputs in agriculture and development of commercial products that have varying impacts on cropped plant growth and/or yield; where generally the consensus from farmers is the benefits of reduced input costs and increased long-term sustainability outweigh the risk of poor quality or ineffective inoculants [10,11].
Plant growth promoting bacterial strains are capable of enhancing plant growth both directly and indirectly. Direct promotion of plant growth can occur by the bacterial production of phytohormones or through the solubilisation of nutrients from the environment [12]. Indirect plant growth promotion takes place when PGPBs restrict the growth of other organisms or by limiting deleterious effects, via the production of antagonistic substances or from inducing resistance to pathogens [12].
Several studies have been conducted to identify the role of PGPB in plants at low water conditions [13,14,15]. Production of phytohormones, reducing plant ethylene levels and inducing systemic resistance are some of the mechanisms have evolved to overcome otherwise growth inhibiting low water activity environments [16]. Inoculation with PGPB could stimulate plant development by enhancing root development, which could then result in better absorption of water and nutrients from the soil [17,18]. The addition of beneficial microorganisms has been shown to increase water holding capacity in soils and rhizospheres, increase water-uptake by plants and reduce the impacts of heat stress in plants by reducing stress responses such as oxidative stress by reducing reactive oxygen species (ROS) and ethylene production–through the production of catalase, peroxidase and 1-aminocyclopropane-1-carboxylate (ACC) deaminase enzymes [10,19,20].
Abiotic stress conditions including drought, heat, salinity and low pH negatively affect plant growth and reduce overall crop production, including in B. napus L. [21,22,23]. Drought conditions trigger numerous response mechanisms in plants, including changes to gene expression and cellular metabolism [24,25]. As water activity reduces, enzyme functioning and the ability to regulate the production of crucial immune response systems and signalling molecules such as ethylene, reactive oxygen species, and abscisic acid are reduced or lost [23,24,26].
Water facilitates the transport of nutrients in the soil, and whilst nutrient and water absorption are separate processes they are directly linked [27,28]. Under low water activity (drought conditions) nutrient cycling decreases due to the reduction of thin water films around soil particles [29,30]. To counteract the negative water potential in dry soil, some microbes accumulate osmoregulatory compounds including: polyols, lactones, sugar aldehydes, and amino acids [23,28,31,32]. This physiological response avoids microbial dehydration and in turn may benefit plants by helping retain moisture (in the form of biomass), and enhance drought resistance and nutrient cycling at the rhizosheath level [28,32,33]. The increased understanding of the role of rhizosphere-associated microbes in enhancing nutrient availability and crop yield demonstrates their value in agricultural production as alternatives or supplements to mineral or organic fertilisers [34,35]. The interactions between plants and microbes, in particular, beneficial microorganisms that may enhance plant growth, occur in the rhizosphere. The rhizosphere is the relatively small layer of soil, approximately one to three millimetres that surrounds plant roots [36]. This is distinguished from the bulk soil, which extends from the rhizosphere; where the rhizosphere can contain up to 1 × 10¹¹ microbial cells per gram [37,38]. Plant root exudates including vitamins, sugars, proteins, carbohydrates, organic acids, amino acids, and mucilage, provide important sources of carbon and other nutrients to rhizospheric microbial populations [39]. The proximity of PGPB in relation to plant tissue has previously been shown to be an influential factor on their efficacy at enhancing plant growth; where proximity of bacteria to root tissue correlates to the levels of indole-3-acetic acid (IAA) and/or other phytohormones available to the plants [40]. Information on PGPB association with canola plants and their influence on growth and establishment is limited, particularly for PGPB candidates that enhance germination and growth in low water activity (simulated drought) environments. This study, for the first time, identifies PGPB that can enhance canola germination and growth under moisture limiting conditions.

2. Materials and Methods

2.1. Bacterial Isolation Method

Soil samples were collected from canola fields in the Central Highlands, Loddon Campaspe, Wimmera Southern Mallee, and Great South Coast regions in Victoria, Australia. The GPS coordinates (±5 km) for sample sites were recorded using Google Earth, along with the postcode for each strain: Leigh Creek, Victoria (3352) −37.558527, 143.968666 (Pantoea agglomerans DUS1-2); Eddington, Victoria (3472) −36.900295, 143.817677 (Pseudomonas sp. DUS5-2); Majorca, Victoria (3465) −37.088682, 143.823557 (Pseudomonas fluorescens DUS11-9); Bungalally, Victoria (3401) −36.814969, 142.307717 (Pseudomonas protegens DUS1-27); Tarrington, Victoria (3301) −37.780693, 142.110517 (Pseudomonas fluorescens DUS1-14); and Leslie Manor, Victoria (3260) −38.093205, 143.369098 for both Pseudomonas fluorescens DUS1-29 and Janthinobacterium sp. DUS1-33. Multiple samples of approximately 200 g of rhizosphere, bulk soil, and plant (canola) roots were collected from each site and immediately stored in sterile polythene zip-locked bags on ice or at 4 °C. For each of the rhizosphere and root samples, 10 g of material was suspended in 10 mL of sterile phosphate buffered saline (PBS) and a homogeneous suspension was obtained by vortexing the soil suspension for 1 min. Samples were then left on the bench for one hour to enable solid particles to settle. To obtain single colonies, rhizosphere soil suspensions were diluted 1000-fold using 1 × PBS and 50 µL of these dilutions spread plated onto tryptone yeast (TY) agar and incubated at 22 °C for 48 h. Following Gram-staining to confirm purity, single colonies were transferred into TY liquid medium and incubated overnight at 22 °C in a rotary shaker (200 rpm). Glycerol stocks were prepared from the liquid cultures with 750 μL of bacterial cultures grown for 48 h mixed with 750 μL of 80% sterile glycerol, transferred into a sterile 2 mL cryogenic vial, flash-frozen in liquid nitrogen, and stored at −80 °C for further analysis.

2.2. Assessment of Bacterial Isolates for Catalase Activity

Bacterial isolates were screened for catalase activity using the slide (drop) method, where cells were exposed to 3% hydrogen peroxide (H2O2) and observed for the production of O2 [41]. Catalase positive bacteria produce bubbles, whereas no bubbles occur for catalase negative bacteria [42,43].

2.3. Iron Solubilisation Assays

Iron (Fe2+/3+) solubilisation by all strains was assessed as previously described [44]. Briefly, 10 µL of bacterial suspension with an optical density of 0.5 at a wavelength of 600 nm (OD600 0.5) grown overnight in PBS (low nutrient environment), was placed on Chrome Azurol S (CAS) agar plates [44]. After three days of incubation at 22 °C the diameter of yellow/orange halos was measured around each colony. Siderophore positive isolates produce yellow/orange halos because iron is removed from the original blue CAS-Fe(III) complex during siderophore production.

2.4. Phosphate Solubilisation Assays

Phosphate solubilisation was assessed as previously described [45]. A 10 µL bacterial suspension (OD600 0.5) was added to 10 µM CaCl2 solution and incubated overnight (low phosphate environment), then placed on Pikovskaya (PVK) agar plates containing calcium phosphate. The formation of halos (solubilisation of PO43−) was evaluated after three days of incubation at 22 °C.

2.5. Quantification of Indole-3-Acetic Acid (IAA) Production by Bacterial Isolates

Bacterial isolates were screened for their ability to produce the plant growth promoting auxin IAA [46]. Cells of each strain were grown in 5 mL of TY medium for 48 h at 28 °C following which, 20 μL aliquots were transferred to Dworkin and Foster (DF) salts minimal medium and DF medium supplemented with L-tryptophan (5 mg L−1) for 48 h at 28 °C. One millilitre aliquots were taken from each culture and centrifuged (5500× g for 10 min) to remove bacterial cells. The supernatants were mixed with 4 mL of Salkowski’s reagent (150 mL concentrated H2SO4, 250 mL distilled H2O, and 7.5 mL 0.5 M FeCl3.6H2O). After incubating at room temperature for 20 min, the absorbance was measured at 535 nm. The concentration of IAA produced by bacteria was determined using an IAA standard curve, the total protein concentrations measured (Pierce BCA protein assay kit, ThermoFisher Scientific) and the IAA concentration produced standardised to µg of IAA produced per mg of protein [46].

2.6. Quantification of 1-Aminocyclopropane-1-Carboxylate (ACC) Deaminase Activity by Bacterial Isolates

The ability of strains to produce the enzyme 1-aminocyclopropane-1-carboxylate (ACC) deaminase was assessed as follows [47]. Single colonies were transferred into 5 mL of TY medium and incubated overnight (growth to late log phase) at 28 °C on a shaker at 200 rpm. Two ml of each culture was centrifuged at 8000× g for 5 min and the cell pellet washed twice with DF medium and suspended in 2 mL of DF-ACC medium and incubated at 28 °C on a shaker at 200 rpm of 24 h. Two millilitres of uninoculated DF-ACC medium was incubated parallel as a negative control. One millilitre of each culture was centrifuged at 8000× g for 5 min. One hundred microlitres was taken from the supernatant and diluted 10 fold with DF medium. Sixty microlitres of diluted supernatant was used for the assay [47]. Standard concentrations of ACC were used to produce a standard curve, the total protein concentrations measured (Pierce BCA protein assay kit, ThermoFisher Scientific) and the ACC concentration produced standardised to µM of ACC produced per mg of protein.

2.7. Bacterial Identification Using 16S rRNA Gene Sequences

The bacterial isolates were identified by sequencing the bacterial 16S rRNA gene as follows: Isolates were grown in TY medium on a rotary shaker 200 rpm at 25 °C for 24 h. Bacterial genomic DNA was extracted using the Wizard genomic DNA purification kit (Promega). The quality and quantity of genomic DNA extracted were analysed via electrophoresis and spectrophotometry (A260/280).
The universal 16S primers used were: 27 F-5′ AGA GTT TGA TCM TGG CTC AG 3′ and 1492 R-5′ CGG TTA CCT TGT TAC GAC TT 3′. The thermocycling conditions involved an initial denaturation at 95 °C for 3 min, followed by 30 cycles of 95 °C for 30 s, 52 °C for 30 s, and 72 °C for 100 s and final extension at 72 °C for 5 min. The PCR product was run through 1% agarose gel electrophoresis, visualised products were excised from the gels and purified using Qiagen QIAquick gel extraction kit (Qiagen). The purified PCR products were sequenced (Sanger Sequencing by the Australian Genome Research Facility, Melbourne, Australia) and base calling for sequencing results assessed using the program Sequencher, version 5.4.6 DNA sequence analysis software, Gene Codes Corporation, Ann Arbor, MI, USA (http://www.genecodes.com). To determine the most-probable species for 16S rRNA gene sequences of unknown isolates. Basic Local Alignment Search Tool (BLAST) searches of the unknown sequences were performed against species deposited in the National Centre for Biotechnology Information (NCBI) database https://blast.ncbi.nlm.nih.gov/Blast.cgi. Species were assigned based on the highest E-value, highest sequence identity, and coverage.

2.8. Screening of Bacterial Isolates and Canola Germination on Medium Containing Polyethylene Glycol (PEG) to Reduce Water Activity

Seeds of B. napus L. were grown for seven days on 20% Hoagland and Arnon medium with 1.5% agar overlayed with a range of PEG levels as previously described [9,48]. After seven days of growth, the effects on germination efficiency (percentage number of seeds germinated) were recorded.

2.9. Effect of Water Activity on Growth of Bacterial Isolates

To assess the effect of water activity on the bacterial growth, 1 × 10³ colony forming units (CFU) of each of the seven strains were spread plated on the 50% Hoagland and Arnon medium overlayed with a range of PEG levels, with 1.5% agar and 10 mM of glucose added as a carbon source [9,48] and colonies counted after 72 h of growth at 22 °C.

2.10. Screening of Bacterial Isolates on Canola Plants in a Sterilised Sand-Based Medium

Brassica napus L. cv. Bonito seeds were obtained from Elders Farm Supplies (Geelong, Victoria, Australia). Five surface sterilised canola seeds (sterilised as follows: in a 2 mL tube, 100 seeds equalling ~1 m mL vol. were washed in 1 mL 70% EtOH for 1 min, 50% bleach for 3 min, and washed five times in 1 mL of sterilised ddH2O) were placed evenly in each pot (diameter: 150 mm, height: 140 mm), which contained 2.2 kg of autoclaved sterilised washed river sand dried to either 1.5% (v/w) or 3% (v/w) water activity. Fifty millilitre cultures of each bacterial strain was pelleted and re-suspended in 50% diluted Hoagland and Arnon medium [49] and the optical density (OD600) adjusted to 0.15, which corresponded to approx 1 × 10³ CFU per mL. A volume of 1 mL of cells (1 × 10³) was applied to seedlings five days post germination. Fifty millilitres of 50% diluted Hoagland and Arnon medium [49] was also added to the control pots. After seven days post sowing, pots were thinned to three seedlings per pot and left to grow for 30 days at 22 °C (16 h light/8 h dark) in a plant growth cabinet. Plants were watered up to three times per week with sterile 50% diluted Hoagland and Arnon medium as required to maintain prescribed water activity. After 30 days, plants were carefully removed from the pots and the roots and shoots separated. Plant material was then dried for seven days at 65 °C and root and shoot dry weights recorded. At the time of harvest, 10 g of soil was also collected for assessing abundance (CFU) and diversity of bacteria associated with rhizosphere.

2.11. Screening of Bacterial Isolates on Canola Plants in Sterilised Clay Loam-Based Medium

Brassica napus L. cv. Bonito seeds (surface sterilised as previously described) were coated with 1 × 10³ CFU per seed of each bacterial strain suspended [50] in a 0.1% xanthan gum and 0.1% sodium alginate sticker. Pots (diameter: 150 mm, height: 140 mm) contained 2.2 kg of autoclaved sterilised clay loam-based medium dried to either 4% (v/w) or 8% (v/w) water activity. Ten seeds per pot were added at day zero, and then after seven days thinned to five seedlings per pot. Plants were watered up to three times per week with sterile 50% diluted Hoagland and Arnon medium as required to maintain prescribed water activity at 22 °C (16 h light/8 h dark). After 91 days, plants were carefully removed from the pots and the root and shoot lengths separated. Plant material was then dried for seven days at 65 °C and dry root and shoot weights were recorded. At the time of harvest, 10 g of rhizosphere soil was also collected for assessing abundance (CFU) and diversity of bacteria associated with the rhizosphere.

2.12. Field-Based Assessment of PGPB Strains on Canola Growth

Brassica napus L. Bonito open pollinating cultivar seeds were coated with 1 × 10³ CFU per seed of each bacterial strain suspended [50] in a 3 gL−1 xanthan gum and 0.5 gL−1 sodium alginate (Sigma, St. Louis, MO, USA) sticker. Coated seeds were sown at a trial site Minnipa, South Australia (−32.798234, 135.170398), in six-replicate 18 m2 (12 × 1.5 m) plots. The soil profile was a reddish brown sandy loam, with an alkaline pH ranging from 7.5 to 8.7 and an average annual rainfall of approx. 325 mm. Plants were grown for 91 days, with bacterial abundance and diversity assessed before sowing and at harvest following the previously described method of spread plating serial dilutions prepared from 10 g soil samples suspended in PBS. After 91 days, all plants within plot areas of 10 m2 were harvested and dry root and shoot weights assessed.

2.13. Statistical Analyses

Statistical analyses were based on normally distributed data produced by a minimum of three biological replicates (n = 3) of each experimental treatment and 3, 5, or >10 technical replicates for sand-based pot experiments, clay loam-based pot experiments or field trial experiments, respectively. The statistical program IBM SPSS Statistics 26 (for Windows) was used for all statistical analyses. Probability plots (P-P Plots) were produced for all data sets to test for normal distribution. Statistical tests used were one-way analysis of variance (one-way ANOVA) and Tukey’s honest significant difference test for the plant root and shoot dry biomass. Principal component analyses (PCA) performed for total dry plant biomass from inoculated and uninoculated “control” plants grown in the different growth systems was performed using ClustVis (https://biit.cs.ut.ee/clustvis/) [51]. All statistical analyses were tested against the probability value (p-value) of <0.05.

3. Results

3.1. Biochemical Screening of Isolates for PGPB Traits

Screening of bacterial isolates for plant growth promoting traits, including the ability to solubilise nutrients (Fe2+/3+ and PO43−), production of the growth promoting auxin IAA and the enzyme ACC deaminase, and their capacity to tolerate desiccation, was performed (Table 1).
Production of IAA varied across the seven shortlisted strains, ranging from 0.07 µg per mg of protein (Pseudomonas protegens DUS1-27 and Pseudomonas fluorescens DUS1-14), 0.24–0.29 µg per mg of protein (Pseudomonas fluorescens DUS11-9, Pseudomonas fluorescens DUS1-29, and Pseudomonas sp. DUS5-2), 0.84 µg per mg of protein (Pantoea agglomerans DUS1-2), and up to 2.41 µg per mg of protein (Janthinobacterium sp. DUS1-33) (Table 1).

3.2. Strain Identification

Based on sequencing of 16S rRNA regions and comparing sequencing results for the “unknown” isolates against databases of known bacterial 16S rRNA gene sequences, the selected bacterial strains were identified as Pantoea agglomerans DUS1-2, Pseudomonas sp. DUS5-2, Pseudomonas fluorescens DUS11-9, Pseudomonas protegens DUS1-27, Pseudomonas fluorescens DUS1-14, Pseudomonas fluorescens DUS1-29, and Janthinobacterium sp. DUS1-33; with identities >98% and E-values over 1 × 10⁵ (Table 1).

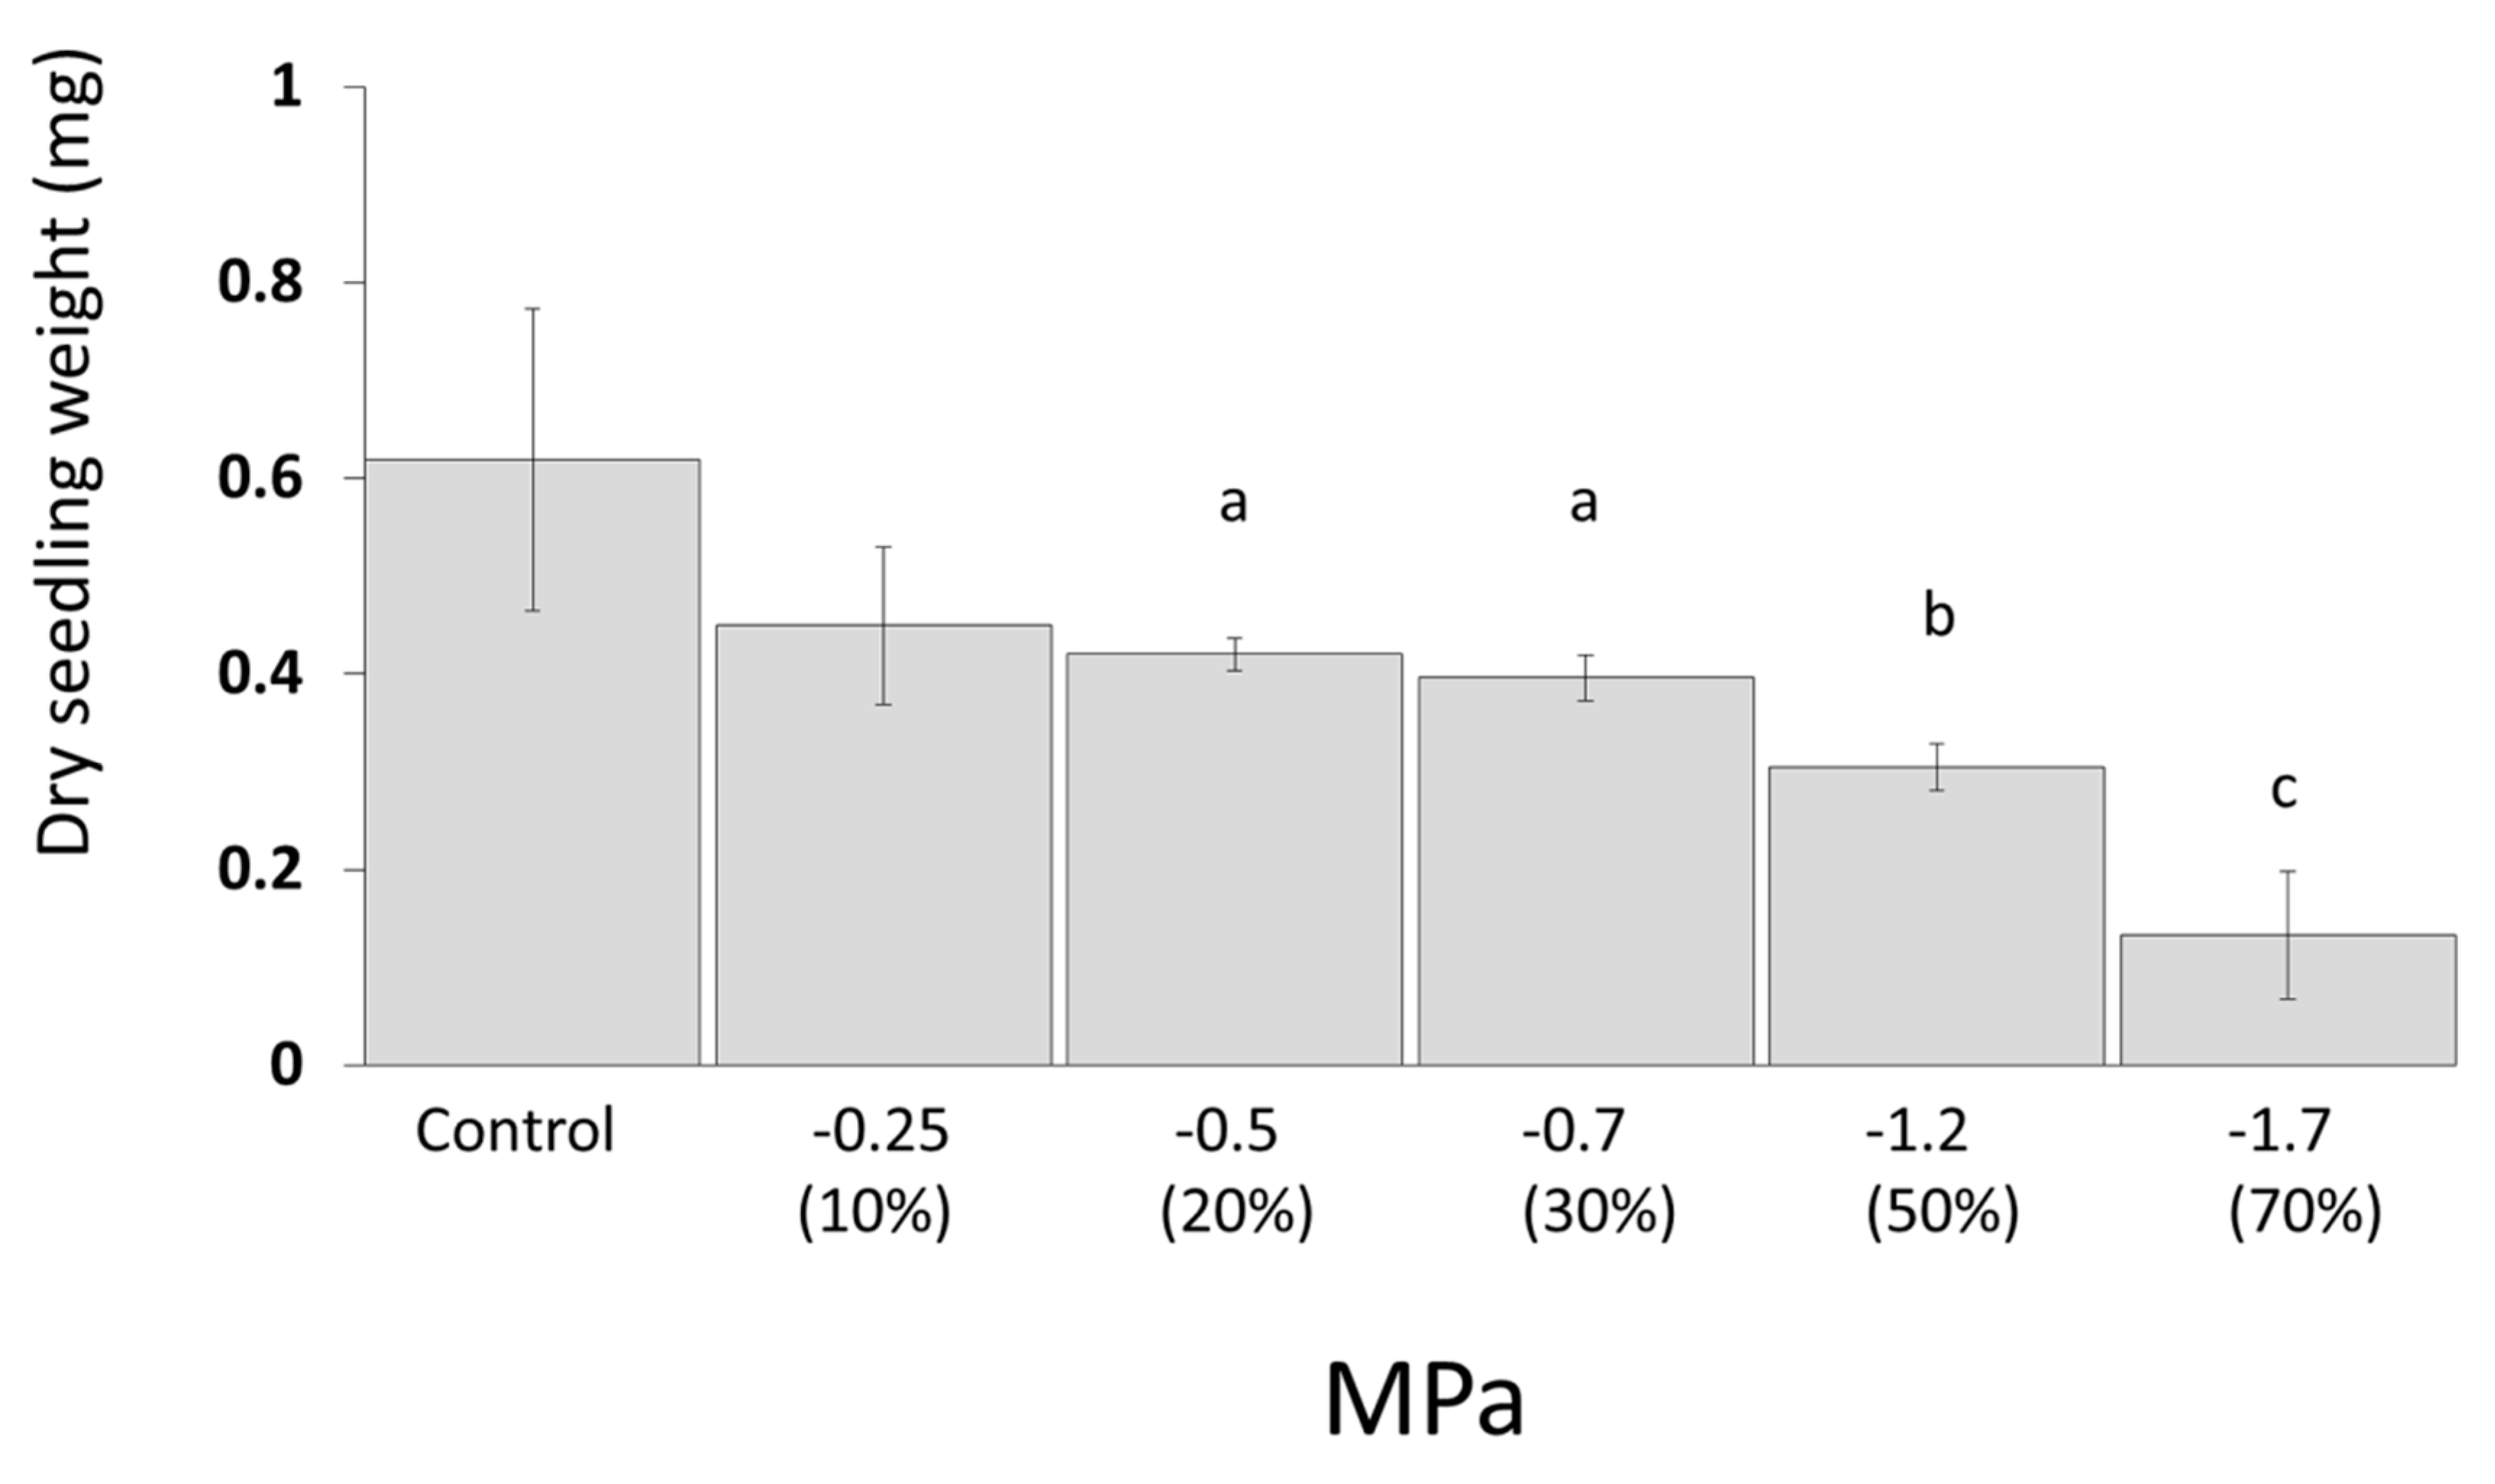
3.3. Desiccation Tolerance of Canola and Bacterial Strains

Seeds of B. napus L. were grown on agar solid Hoagland and Arnon medium for seven days overlayed with a range of PEG levels to assess effects on germination efficiency and total seedling biomass (dry weight). The germination efficiency was greater than 95% across all treatments. Levels of 20% PEG or higher, significantly reduced seedling weight; where 20% PEG equates to a desiccation level of −0.5 MPa (Figure 1). For bacterial isolates, all strains grew on PEG concentrations of up to 70% with a minimum CFU of 1 × 10⁵ observed.

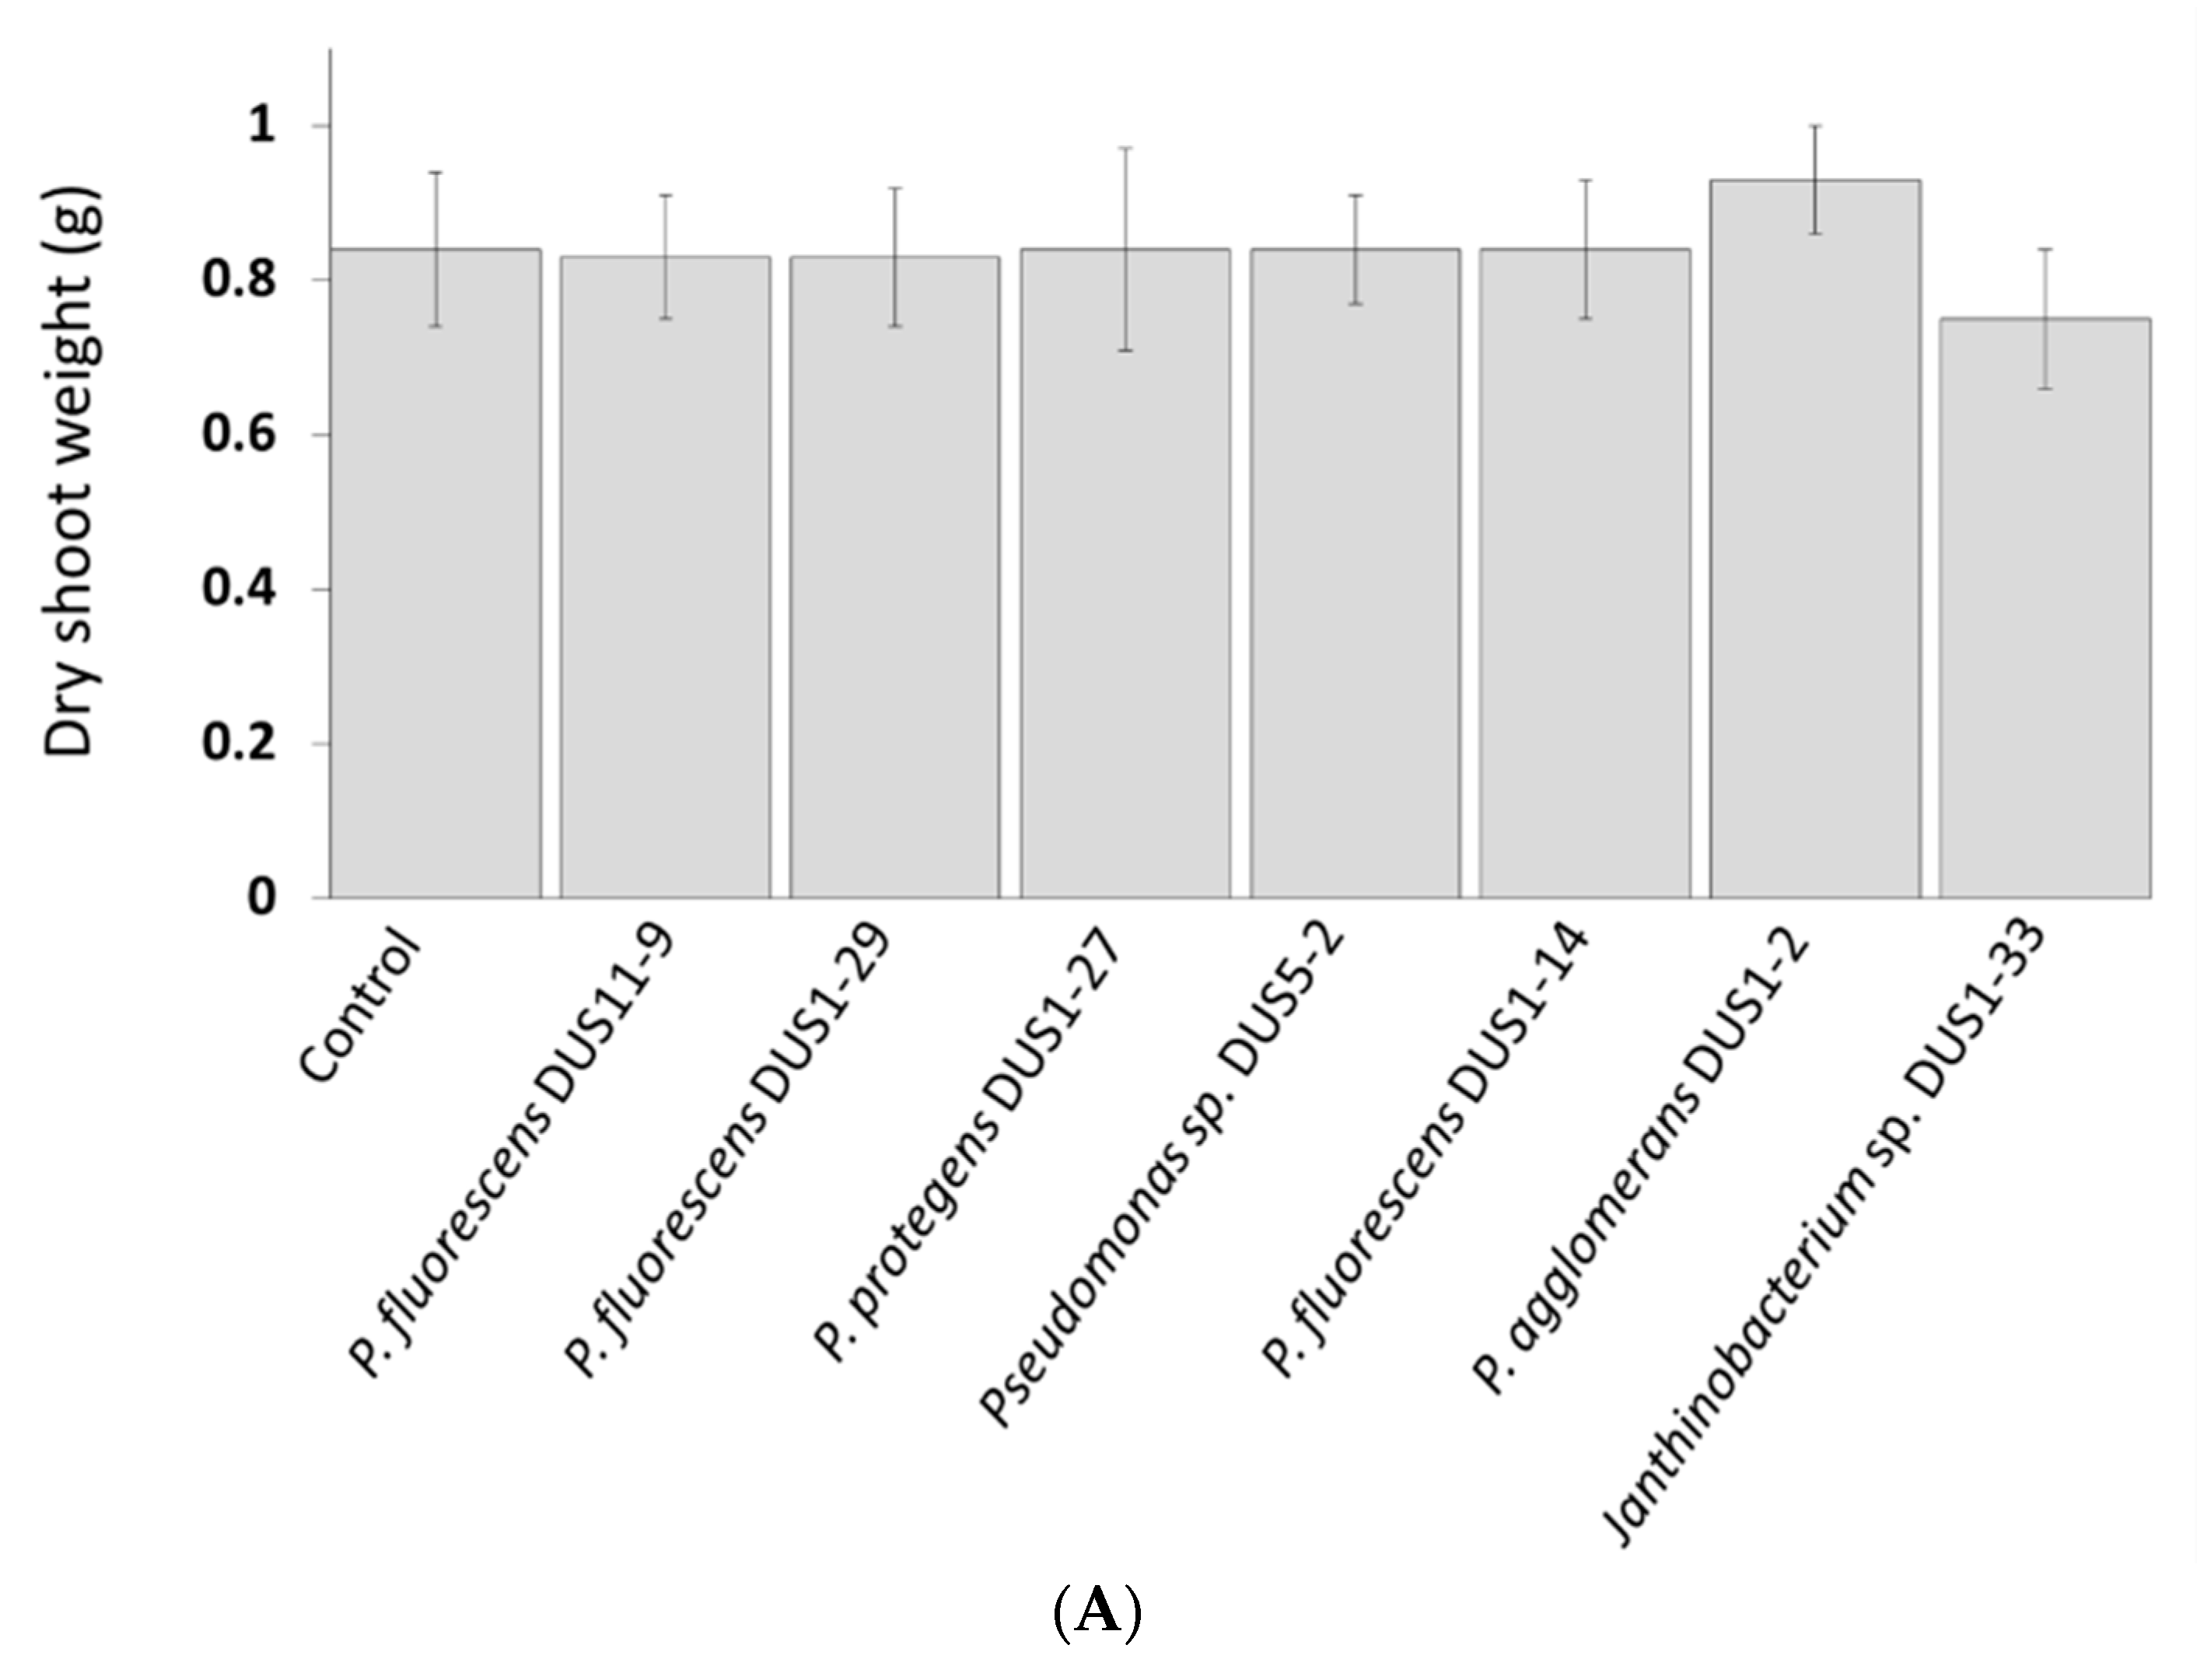
3.4. Growth Assessment in Sand-Based Medium

In a constant environment plant growth cabinet, 200 shortlisted isolates (selected based on their plant growth promoting ability) were screened on B. napus L. plants over 30 days to test their effect on germination in a sterile sand-based medium with normal (3%) and low (1.5%) water activity levels (Figure 2A,B). In a sand-based system with 3% water activity (v/v), P. agglomerans DUS1-2, Pseudomonas sp. DUS5-2, and P. fluorescens DUS11-9 significantly increased the dry shoot weight, by over 200% compared to the uninoculated control (Figure 2A). Only Pseudomonas sp. DUS5-2 significantly increased dry root weight (by approx. 0.2 g) compared with the control plants (Figure 2B). At the time of harvest, soil samples were collected, and the final bacterial cell counts determined to be between approximately 6 × 10⁴ to 1 × 10⁵ CFU per g of sand-based medium (Table 2).
A sterile sand-based growth system with 1.5% water activity was used to challenge B. napus L. growth over 30 days in the presence and absence of added bacterial strains (1 mL of a 1 × 10³ CFU per mL suspension was added at the time of sowing). Inoculation of the stressed plants with isolates P. fluorescens DUS11-9, P. fluorescens DUS1-29, P. protegens DUS1-27, P. fluorescens DUS1-14, and Janthinobacterium sp. DUS1-33 significantly enhanced both shoot and root dry biomass by over 100% and 200%, respectively (Figure 3A,B). At the time of harvest, soil samples were collected and the final bacterial cell counts determined to be between approx. 4 × 10³ to 8 × 10³ CFU per g of sand-based medium (Table 3).

3.5. Effect of Bacterial Isolates on Canola Growth after 91 Days of Growth in a Sterile Clay Loam-Based Medium with Normal (8%) and Low (4%) Water Activity Levels

Plants were grown for 91 days in a soil-based medium with either 8% or 4% water activity. No alterations in shoot biomass were observed compared to the control for inoculated plants grown in soil with 8% water activity (Figure 4A). For roots of inoculated plants, dry biomass was significantly increased with the addition of the P. fluorescens DUS11-9 and Pseudomonas sp. DUS5-2–by approximately 0.13 g compared to the uninoculated control plant roots (Figure 4B).
For the low water activity (4%) soil-based plants, no significant differences in shoot biomass were observed for inoculated plants (Figure 5A). Root dry biomass was significantly increased by the addition of Pseudomonas sp. DUS5-2, P. fluorescens DUS1-14, and P. agglomerans DUS1-2, with root biomass approximately 0.1 g more compared to the uninoculated control plant roots (Figure 5B).
The rhizosheath mass associated with plants grown in the soil-based medium with 8% water activity was significantly increased by 1.6 to 2.2 g for plants inoculated with P. fluorescens DUS11-9, P. fluorescens DUS1-29, and Janthinobacterium sp. DUS1-33 in comparison with rhizosheath masses for control plants (Figure 6A). Inoculation with P. protegens DUS1-27 significantly increased rhizosheath mass by 3.7 g in comparison with rhizosheath masses for control plants (Figure 6A). The rhizosheath mass associated with plants grown in the soil-based medium with 4% water activity was significantly increased by 1.3 g and 1.7 g for plants inoculated with P. fluorescens DUS11-9 and Pseudomonas sp. DUS5-2, in comparison with control plants rhizosheath mass, respectively (Figure 6B).
For both 8% and 4% water activity treatment groups, there was no significant difference (p > 0.05) in germination rate observed after seven days for control or inoculated seeds, with germination rates of 97% to 100% (Table 4 and Table 5).
The initial number for CFU applied to the seeds using xanthan gum and alginate-based sticker was 1 × 10³ CFU per seed, with all media, buffers and solutions sterilised. After 91 days, the seed bacterial count was 15.4 × 10⁴ CFU for P. fluorescens DUS11-9, and approximately 20 × 104 up to 24 × 104 CFU for Pseudomonas sp. DUS5-2, P. protegens DUS1-27, P. agglomerans DUS1-2, and P. fluorescens DUS1-14 (Table 4). For P. fluorescens DUS1-29 and Janthinobacterium sp. DUS1-33 approx. 39 × 104 CFU per mL were recorded (Table 4).

3.6. Assessment of Strain Performance on Enhancing B. napus L. Total Dry Plant Biomass in Sand or Soil Based Pot Systems with Either “Optimum” (3% Water Activity or Sand, or 8% Water Activity for Soil) or “Low” (1.5% Water Activity for Sand or 4% Water Activity for Soil) Water Activity

The effect of all strains on B. napus L. growth based on total plant dry biomass for plants grown in either sand-based systems with 3% water activity (optimum), sand-based system with 1.5% water activity (low), soil-based system with 8% water activity (optimum), or soil-based system with 4% water activity (low) was assessed using PCA analysis (Figure 7). Pantoea agglomerans DUS1-2 was ranked as the overall highest performer, due to its effect on total plant biomass for plants grown in sand with 3% water activity and soil with 4% water activity. Pseudomonas fluorescens DUS11-9 was observed as having the most consistent positive impact on plant growth, followed by Pseudomonas sp. DUS5-2 (Figure 7).

3.7. Field Assessment

The efficacy of the top five most consistent performing strains was selected based on the results of previous plant growth trials and biochemical plant growth promoting (PGP) traits. These five strains were coated onto B. napus L. seeds using a xanthan gum-sticker (1 × 10⁶ CFU per seed) and planted in crop trials at Minnipa, South Australia. After 91 days of growth, plant shoot biomass P. fluorescens DUS1-29 significantly increased shoot biomass by 1.4 kg per 10 m2 plot compared to the uninoculated control plants (Figure 8A). No significant increase in root biomass was observed (Figure 8B).

3.8. Assessment of Strain Performance on Enhancing B. napus L. Total Dry Plant Biomass across All Plant Growth Systems Including Field Conditions

The effect of the five selected strains trialed on B. napus L. for 91 days under field conditions and across all other growth systems was ranked based on total plant dry biomass (Figure 9). Based on dry plant biomass from the field trial data only, inoculation with P. fluorescens DUS1-29 had the most positive effect on plant dry biomass, followed by Janthinobacterium sp. DUS1-33 (Figure 9). Overall, when all five strains selected for field trials were assessed for their effect on plant growth across all systems, P. fluorescens DUS11-9 was observed as having the most consistent positive impact on plant growth, followed by Pseudomonas sp. DUS5-2 (Figure 9). Pseudomonas fluorescens DUS1-29 was ranked the third top performer (pushed up by field trial performance), then Janthinobacterium sp. DUS1-33 and P. protegens DUS1-27 as the lowest ranked performer (Figure 9).

4. Discussion

Plant growth promoting bacteria colonising the plant rhizosphere play important beneficial roles that directly or indirectly influence plant growth and development [12]. Various examples of PGPB in mediating nutrient mobilisation and involvement in biochemical processes have been reported in the past, including for B. napus L. (canola) [52,53,54,55,56]. This study isolated and characterised rhizosphere bacteria possessing multiple PGP traits with the purpose of determining if the bacteria could increase germination and growth of B. napus L., particularly under simulated drought conditions (low water activity).
Water is one of the most important factors influencing plant growth–affecting nutrient availability and microbial community structure [27,28]. Plant available water (PAW) is the amount of water held within soils and available to plants; between the holding capacity of the soil and permanent wilting point [57]. In sand, the larger particles and lower surface forces of the particles mean that a higher percentage of the water in the system is available to plants. In contrast, clay loams have higher amounts of finer colloidal particles that have stronger surface binding forces, resulting in higher water retention and lower PAW. Here we used a sand-based and clay loam-based soil, where optimum growth was observed at 3% water activity for the sand based medium and at 8% for the clay loam. Wilting point for B. napus L. in the sand based medium was observed at 1.5% water activity, whereas in the clay loam wilting point was observed at 4%—where the differences in percentage water activity of the two systems is attributed to the differences in PAW. The addition of strains P. fluorescens DUS11-9 and P. agglomerans DUS1-2 increased shoot biomass under ideal water activity on the sand-based system (3% Aw), whereas Pseudomonas sp. DUS5-2 increased both shoot and root dry biomass compared to the uninoculated control plants. For plants grown in the sand-based medium with low AW (1.5%), the strains P. fluorescens DUS11-9, P. fluorescens DUS1-29, P. protegens DUS1-27, P. fluorescens DUS1-14, and Janthinobacterium sp. DUS1-33 all increased plant root and shoot dry biomass compared to the uninoculated control. These results show that the seven different strains cause a different effect on plants depending on water availability, with five of the seven strains enhancing plant growth under simulated drought conditions. In a clay loam based medium with 8% AW, plants inoculated with P. fluorescens DUS11-9 and Pseudomonas sp. DUS5-2 increased root biomass compared to the uninoculated control plants. In the clay loam with 4% AW, the addition of Pseudomonas sp. DUS5-2, P. fluorescens DUS1-14, and P. agglomerans DUS1-2 resulted in increased root biomass compared to the uninoculated control—reinforcing that the different strains elicit different effects on plant growth depending on water availability as well as medium (sand vs. clay loam). Under drought stimulated conditions, exopolysaccharide producing P. agglomerans NAS206 had a positive effect on rhizosphere soil aggregation and an overall positive effect on growth and establishment of plants [58], and N-acylhomoserine lactones produced by Gluconacetobacter diazotrophicus enhance the drought tolerance in red rice by suppressing various deleterious drought effects, in the form of induced systemic tolerance [32]. For sorghum, it has previously been reported that plants grown in sandy soil had a higher yield compared to plants grown in clay soil [59]. The higher yield for plants grown in sandy soil was attributed to higher nutrient availability in the rhizosphere due to increased microbial mineralisation activity [59]. The results for increased plant growth observed by our investigations are consistent with previous studies that have shown PGPB are capable of successfully inhabiting the rhizosphere, where the bacteria increase nutrient availability for themselves and the plants, as well as produce growth stimulating IAA and stress reducing hormone ACC deaminase—potential modes of action for the seven strains presented here [16,28,31,46,52].
The plant rhizosphere provides an important niche for soil microbes, where the root exudates and root debris provide a carbon source to facilitate the growth of the microbes [16,33,46,52]. In the soil-based medium, at 8% AW with the addition of P. fluorescens DUS11-9, P. fluorescens DUS1-29, P. protegens DUS1-27, and Janthinobacterium sp. DUS1-33 there was a significant increase in rhizosheath mass. At 4% AW, the addition of P. fluorescens DUS11-9 and Janthinobacterium sp. DUS1-33 significantly increased in rhizosheath mass. Similar CFU numbers were observed after 91 days in the soil-based medium at both 4% and 8% Aw, suggesting that microbial populations were relatively unaffected by the reduction in AW and that the increased plant biomass and rhizosheath masses observed were attributed to the strains plant growth promoting activity rather than their abundance (CFU). The data presented here suggest that the selected isolates may benefit canola plants via multiple modes of action including plant growth promotion via the production of IAA and ACC deaminase, nutrient solubilisation and competitive colonisation [60,61,62].
In the rhizosphere, bacterially produced extra cellular polymeric substances (EPS) such as mucilage, correlates to the ability of plant roots to extract water and nutrients from soils [63,64]. The increased levels of mucilage around plant roots from rhizobia increases the soil moisture associated with the roots, particularly under low or negative water potentials where it keeps the rhizosphere moist; maintaining the hydraulic connection between roots and soil [65]. Species belonging to Pseudomonas, Pantoea, and Janthinobacterium genera are well established as being capable of producing extra cellular polymeric substances (EPS) that make up biofilms; particularly in soil environments, where the production of EPS can aggregate and bind substrates within soils such as mineral and organic particles [64,66,67,68]. Our study showed that Janthinobacterium sp. DUS1-33, P. fluorescens DUS11-9, P. fluorescens DUS1-29, and P. protegens DUS1-27 enhanced plant rhizosheath abundance after 91 days grown under optimum water activity (8%), and Pseudomonas sp. DUS5-2, and P. fluorescens DUS11-9 enhanced plant rhizosheath abundance after 91 days grown under low water activity (4%). The increase in rhizosheath mass by these strains suggests that they may have increased mass by forming a thick mucilaginous sheath, particularly for the top performing strains Pseudomonas sp. DUS5-2 and P. fluorescens DUS11-9 under low water activity. This increase in rhizosheath mass could be due to the bacteria facilitating growth of a larger root mass, adherence of aggregated soil particles to the root surface, increasing nutrient availability to roots, and enhancing levels of complexed water within the sheath associated with the roots surface [64,65].
Siderophore production is one of the important traits of PGPB and has gained increased attention in recent years due to their chemical nature and potential applications in agriculture. The results show that 90% of the tested strains produce siderophores in CAS agar medium, particularly fluorescent siderophores produced by P. fluorescens. Similar findings were reported on bacterial isolates obtained from the peanut rhizosphere [69] where eight out of nine strains were positive for siderophore production. Interestingly, four of the siderophore producing isolates were P. fluorescens [69]. Siderophores have been shown to be capable of binding more than 16 different metal ions, either for nourishment or to avoid metal toxicity, in addition to being able to reach an optimum production in nutrient scarce conditions [70,71,72]. Moreover, the siderophore pyoverdine produced by P. fluorescens C7R12 has been shown to positively regulate the expression of genes related to the development and iron acquisition/redistribution while it repressed the expression of defence-related genes [73]. The ability of the isolates presented to solubilise nutrients is an important trait for their broader role in enhancing plant growth when under low nutrient conditions.
Potentially, the mode of actions for enhancing plant growth by the strains presented include improving plant nutrient bioavailability, triggering induced systematic resistance (ISR) in plants, production of anti-fungal metabolites (e.g., 2,4-diacetyl phloroglucinol produced by P. fluorescens), and/or limiting macronutrient availability to pathogens in the rhizosphere [74]. The seven isolates presented were all capable of solubilising iron and phosphate, indicating the production of siderophores. Bacterially produced siderophores have been shown to have antagonistic effects on fungal growth due to the siderophores binding iron, limiting its availability to the fungi and triggering plant immune response systems [75,76]. Moreover, bacterially produced siderophores have been shown to induce systematic resistance in plants, effectively priming the plants defense mechanisms against a broad range of pathogens [77,78].
The regulation of H2O2 production and levels within the rhizosphere, plays an important role in regulating signalling pathways, transcription factors, and also form part of the plant’s pathogen defence mechanism {Baxter, 2014 #34;Kuźniak, 2000 #38;Orozco-Cardenas, 1999 #39;Quan, 2008 #1842}. Production of antioxidant enzymes such as peroxidase, catalase, and superoxide dismutase by PGPB has been linked to reducing pathogen infection in plants, via their complementary response in antioxidant production inhibiting infection [79,80]. The seven isolates were all positive for catalase production and reduced the growth of key pathogens that exist in B. napus L. cropland soils. The combined production of antioxidants and nutrient binding by siderophores infection could be potential modes of action for the isolates to limit pathogen growth, increase their competitiveness in the rhizosphere and benefit associated plants—leading to increased plant growth.
For PGPB to be effective, they need to be competitive at establishing in the rhizosphere [81]. Testing of the strains’ capability to acquire nutrients, reduce the growth of pathogens that exist in cropland soils, and ability to prosper in a range of environments including selective laboratory-based media, sand, clay loam, and cropland soils was performed. For every experiment, the inoculant CFU was standardised to 1 × 10³ CFU for each system, while the final CFU per mL in the rhizosphere was assessed at the end of the experiment. Rhizosphere CFU increased by over 1000-fold, indicating that the isolates were effective at establishing in the tested systems.
It is well-established that IAA enhances plant growth mainly via an extension of the root system, increasing access to a larger soil volume for water and nutrient uptake [54,82]. Indole acetic acid is synthesised by plants and PGPB from the amino acid tryptophan, a common precursor in root exudates of the decarboxylation reaction [83]. A wide range of microbes including epiphytic and tissue colonising bacteria have been found to synthesise IAA [84]; with an estimated 80% of all bacteria that inhabit the rhizosphere having the capacity to produce IAA [85]. The strains presented here all produced IAA. Pseudomonas spp. produced lower IAA levels (0.07–0.25 μg of IAA per mg of protein) compared to P. agglomerans and the Janthinobaterium sp., which produced 0.84 and 2.4 μg of IAA per mg of protein respectively. The levels of IAA produced by the strains presented in this study ranged from moderate to very high levels, comparable to previous studies of IAA production by PGPB that were able to increase plant growth [86]. This suggests that the IAA produced by the strains presented here is possibly one mode of action for enhancing inoculated plant growth.
Several previous studies have shown that ACC deaminase producing PGPB increases root elongation and overall plant growth by reducing ethylene levels in plants [69,87] via the cleavage of the plant ethylene precursor ACC into ammonia and α-ketobutyrate [16]. The expression of ACC deaminase activity under soil condition is governed by the interaction of the inoculant strain with the host plant, microorganisms in the rhizosphere, environmental factors, and its genetic make-up [69]. In the present study, the seven strains presented were all positive for ACC deaminase production. Many species of bacteria are capable of producing ACC deaminase including Pseudomonas, Alcaligenes, and Bacillus species, which exhibit ACC deaminase activity ranging from 147–1805 nmol NH4+ mg−1h−1 [88,89]. Growth pouch experiments on canola co-inoculated with halotolerant PGP bacterial strains showed the synergistic interaction between ACC deaminase on both plant and bacterial IAA auxin facilitated increased plant growth [90]. In line with previous observations, the seven isolates reported here were capable of producing both IAA and ACC deaminase. Whilst the synergy of ACC deaminase and IAA production and their combined influence on plant growth are not explored in detail here, the bacterial strains did enhance plant growth in a range of systems, including under simulated drought stress.
The microbiome of canola plants has previously been explored and genomic assessments of the rhizosphere have included members of the Pseudomonas genus [91,92,93,94,95] with their effects on B. napus L. (canola) reported as being both positive and negative. The plant growth data presented here show positive plant growth effect of the five Pseudomonas strains across the different growth systems, particularly for plants exposed to low water abiotic stress. In both the sand and soil pot based growth systems, P. agglomerans DUS1-2 showed the most consistent increase to plant biomass, followed by P. fluorescens DUS11-9, and then Pseudomonas sp. DUS5-2. Based on total plant dry biomass in the field trial experiments, the P. fluorescens DUS1-29 isolate was the best performer for enhancing plant growth; however, out of the final five strains trialled across all systems, Pseudomonas sp. DUS5-2 was the most consistent strain for enhancing plant dry biomass, followed by P. fluorescens DUS11-9, then P. fluorescens DUS1-29. This would suggest that the best candidates to progress with for future field-based applications would be Pseudomonas sp. DUS5-2, P. fluorescens DUS11-9, and P. fluorescens DUS1-29; either independently or as a mixed consortia. It is likely that the strains’ plant growth promoting capacity under water stress is due to the combined effects of the bacterial phenotypes examined here.
The present study showed the inoculation of canola with PGPB resulted in enhanced biomass and higher rhizosheath mass. The PGP traits of the individual bacterium may have a cumulative effect for water stress mitigation in canola by providing iron, phosphate, IAA, ACC deaminase, and overall protection against plant pathogens. Using such PGPB with multifactorial traits can alleviate drought stress while enhancing plant growth and development.

Author Contributions

Conceptualization, D.P., L.H., and L.B.; methodology, D.P., L.H., S.B., and R.B.; formal analysis, D.P. and L.H.; investigation, D.P.; resources, R.B., C.M.M.F., and L.B.; data curation, D.P., L.H., and S.B.; writing—original draft preparation, D.P., L.H., and L.B.; writing—review and editing, A.E., S.B., R.B., and C.M.M.F.; project administration, C.M.M.F., S.B., R.B., and L.B.; and funding acquisition, S.B., R.B., C.M.M.F., and L.B. All authors have read and agreed to the published version of the manuscript.

Funding

This research was funded by the Grains Research and Development Corporation, Grant Number UF00008.

Conflicts of Interest

The authors declare no conflict of interest. The funders had no role in the design of the study; in the collection, analyses, or interpretation of data; in the writing of the manuscript, or in the decision to publish the results.

References

  1. Van de Wouw, A.; Idnurm, A.; Davidson, J.; Sprague, S.; Khangura, R.; Ware, A.; Lindbeck, K.; Marcroft, S. Fungal diseases of canola in Australia: Identification of trends, threats and potential therapies. Australas. Plant Pathol. 2016, 45, 415–423. [Google Scholar] [CrossRef]
  2. GRDC. GRDC Grownotes-Canola; Grain Research and Development Corporation Australia: Barton, Australia, 2018; pp. 1–8. [Google Scholar]
  3. Eady, S. Greenhouse Gas Emissions from the Cultivation of Canola Oilseed in Australia; CSIRO: Clayton, Australia, 2017. [Google Scholar]
  4. AOF. The Australian Oilseed Industry; Australian Oilseeds Federation: Sydney, Australia, 2010. [Google Scholar]
  5. Westwood, T. Oilseeds; The Australian Bureau of Agricultural and Resource Economics: Canberra, Australia, 2020; pp. 1–6. [Google Scholar]
  6. Faralli, M.; Grove, I.G.; Hare, M.C.; Kettlewell, P.S. In-field film antitranspirant application shows potential yield protection from flowering-stage drought periods in winter canola (Brassica napus). Crop. Pasture Sci. 2017, 68, 243–253. [Google Scholar] [CrossRef]
  7. Elferjani, R.; Soolanayakanahally, R. Canola responses to drought, heat, and combined stress: Shared and specific effects on carbon assimilation, seed yield, and oil composition. Front. Plant Sci. 2018, 9, 1–17. [Google Scholar] [CrossRef] [PubMed] [Green Version]
  8. Channaoui, S.; El Idrissi, I.S.; Mazouz, H.; Nabloussi, A. Reaction of some rapeseed (Brassica napus L.) genotypes to different drought stress levels during germination and seedling growth stages. OCL 2019, 26, 23. [Google Scholar] [CrossRef] [Green Version]
  9. O’Donnell, N.H.; Møller, B.L.; Neale, A.D.; Hamill, J.D.; Blomstedt, C.K.; Gleadow, R.M. Effects of PEG-induced osmotic stress on growth and dhurrin levels of forage sorghum. Plant Physiol. Biochem. 2013, 73, 83–92. [Google Scholar] [CrossRef]
  10. Santos, M.S.; Nogueira, M.A.; Hungria, M. Microbial inoculants: Reviewing the past, discussing the present and previewing an outstanding future for the use of beneficial bacteria in agriculture. AMB Express 2019, 9, 205. [Google Scholar] [CrossRef]
  11. Alori, E.T.; Babalola, O.O. Microbial inoculants for improving crop quality and human health in Africa. Front. Microbiol. 2018, 9, 2213. [Google Scholar] [CrossRef] [Green Version]
  12. Glick, B.R. The enhancement of plant growth by free-living bacteria. Can. J. Microbiol. 1995, 41, 109–117. [Google Scholar] [CrossRef]
  13. Cohen, A.C.; Bottini, R.; Pontin, M.; Berli, F.J.; Moreno, D.; Boccanlandro, H.; Travaglia, C.N.; Piccoli, P.N. Azospirillum brasilense ameliorates the response of Arabidopsis thaliana to drought mainly via enhancement of ABA levels. Physiol. Plant. 2015, 153, 79–90. [Google Scholar] [CrossRef]
  14. Wang, C.-J.; Yang, W.; Wang, C.; Gu, C.; Niu, D.-D.; Liu, H.-X.; Wang, Y.-P.; Guo, J.-H. Induction of drought tolerance in cucumber plants by a consortium of three plant growth-promoting rhizobacterium strains. PLoS ONE 2012, 7, 1–10. [Google Scholar] [CrossRef] [Green Version]
  15. Lim, J.-H.; Kim, S.-D. Induction of drought stress resistance by multi-functional PGPR Bacillus licheniformis K11 in pepper. Plant Pathol. J. 2013, 29, 201. [Google Scholar] [CrossRef] [PubMed]
  16. Glick, B.R. Bacteria with ACC deaminase can promote plant growth and help to feed the world. Microbiol. Res. 2014, 169, 30–39. [Google Scholar] [CrossRef] [PubMed]
  17. Vardharajula, S.; Zulfikar Ali, S.; Grover, M.; Reddy, G.; Bandi, V. Drought-tolerant plant growth promoting Bacillus spp.: Effect on growth, osmolytes, and antioxidant status of maize under drought stress. J. Plant Interact. 2011, 6, 1–14. [Google Scholar] [CrossRef]
  18. Kaushal, M.; Wani, S.P. Rhizobacterial-plant interactions: Strategies ensuring plant growth promotion under drought and salinity stress. Agric. Ecosyst. Environ. 2016, 231, 68–78. [Google Scholar] [CrossRef]
  19. Lobo, C.B.; Tomás, M.S.J.; Viruel, E.; Ferrero, M.A.; Lucca, M.E. Development of low-cost formulations of plant growth-promoting bacteria to be used as inoculants in beneficial agricultural technologies. Microbiol. Res. 2019, 219, 12–25. [Google Scholar] [CrossRef] [PubMed]
  20. Ali, S.Z.; Sandhya, V.; Grover, M.; Linga, V.R.; Bandi, V. Effect of inoculation with a thermotolerant plant growth promoting Pseudomonas putida strain AKMP7 on growth of wheat (Triticum spp.) under heat stress. J. Plant Interact. 2011, 6, 239–246. [Google Scholar] [CrossRef] [Green Version]
  21. Hu, H.; Xiong, L. Genetic engineering and breeding of drought-resistant crops. Annu. Rev. Plant Biol. 2014, 65, 715–741. [Google Scholar] [CrossRef]
  22. Mittler, R. Oxidative stress, antioxidants and stress tolerance. Trends Plant Sci. 2002, 7, 405–410. [Google Scholar] [CrossRef]
  23. You, J.; Chan, Z. ROS regulation during abiotic stress responses in crop plants. Front. Plant Sci. 2015, 6, 1–15. [Google Scholar] [CrossRef] [Green Version]
  24. Miller, G.; Suzuki, N.; Ciftci-Yilmaz, S.; Mittler, R. Reactive oxygen species homeostasis and signalling during drought and salinity stresses. Plant Cell Environ. 2010, 33, 453–467. [Google Scholar] [CrossRef]
  25. Reddy, A.R.; Chaitanya, K.V.; Vivekanandan, M. Drought-induced responses of photosynthesis and antioxidant metabolism in higher plants. J. Plant Physiol. 2004, 161, 1189–1202. [Google Scholar] [CrossRef] [PubMed]
  26. Huang, H.; Ullah, F.; Zhou, D.-X.; Yi, M.; Zhao, Y. Mechanisms of ROS regulation of plant development and stress responses. Front. Plant Sci. 2019, 10. [Google Scholar] [CrossRef]
  27. Clark, J.S.; Campbell, J.H.; Grizzle, H.; Acosta-Martìnez, V.; Zak, J.C. Soil microbial community response to drought and precipitation variability in the Chihuahuan Desert. Microb. Ecol. 2009, 57, 248–260. [Google Scholar] [CrossRef]
  28. Xue, R.; Shen, Y.; Marschner, P. Soil water content during and after plant growth influence nutrient availability and microbial biomass. J. Soil Sci. Plant Nutr. 2017, 17, 702–715. [Google Scholar] [CrossRef] [Green Version]
  29. Guntinas, M.; Gil-Sotres, F.; Leiros, M.; Trasar-Cepeda, C. Sensitivity of soil respiration to moisture and temperature. J. Soil Sci. Plant Nutr. 2013, 13, 445–461. [Google Scholar] [CrossRef] [Green Version]
  30. Papendick, R.; Campbell, G.S. Theory and Measurement of Water Potential; Soil Science Society of America: Madison, WI, USA, 1981; Volume 9, pp. 1–22. [Google Scholar]
  31. Harris, R. Effect of Water Potential on Microbial Growth and Activity; Soil Science Society of America: Madison, WI, USA, 1981; Volume 9, pp. 23–95. [Google Scholar]
  32. Filgueiras, L.; Silva, R.; Almeida, I.; Vidal, M.; Baldani, J.I.; Meneses, C.H.S.G. Gluconacetobacter diazotrophicus mitigates drought stress in Oryza sativa L. Plant Soil 2019, 451, 1–17. [Google Scholar] [CrossRef]
  33. Marasco, R.; Mosqueira, M.J.; Fusi, M.; Ramond, J.-B.; Merlino, G.; Booth, J.M.; Maggs-Kölling, G.; Cowan, D.A.; Daffonchio, D. Rhizosheath microbial community assembly of sympatric desert speargrasses is independent of the plant host. Microbiome 2018, 6, 215–225. [Google Scholar] [CrossRef]
  34. Jilani, G.; Akram, A.; Ali, R.M.; Hafeez, F.Y.; Shamsi, I.H.; Chaudhry, A.N.; Chaudhry, A.G. Enhancing crop growth, nutrients availability, economics and beneficial rhizosphere microflora through organic and biofertilizers. Ann. Microbiol. 2007, 57, 177–184. [Google Scholar] [CrossRef]
  35. Andrews, M.; James, E.; Cummings, S.; Zavalin, A.; Vinogradova, L.; McKenzie, B. Use of nitrogen fixing bacteria inoculants as a substitute for nitrogen fertiliser for dryland graminaceous crops: Progress made, mechanisms of action and future potential. Symbiosis 2003, 35, 209–229. [Google Scholar]
  36. Ren, X.; Guo, S.; Tian, W.; Chen, Y.; Han, H.; Chen, E.; Li, B.; Li, Y.; Chen, Z. Effects of plant growth-promoting bacteria (PGPB) inoculation on the growth, antioxidant activity, Cu uptake, and bacterial community structure of rape (Brassica napus L.) grown in Cu-contaminated agricultural soil. Front. Microbiol. 2019, 10, 1455. [Google Scholar] [CrossRef]
  37. Egamberdieva, D.; Kamilova, F.; Validov, S.; Gafurova, L.; Kucharova, Z.; Lugtenberg, B. High incidence of plant growth stimulating bacteria associated with the rhizosphere of wheat grown on salinated soil in Uzbekistan. Environ. Microbiol. 2008, 10, 1–9. [Google Scholar] [CrossRef] [PubMed]
  38. Mendes, R.; Kruijt, M.; de Bruijn, I.; Dekkers, E.; van der Voort, M.; Schneider, J.H.; Piceno, Y.M.; DeSantis, T.Z.; Andersen, G.L.; Bakker, P.A. Deciphering the rhizosphere microbiome for disease-suppressive bacteria. Science 2011, 332, 1097–1100. [Google Scholar] [CrossRef] [PubMed]
  39. Lynch, J.M.; de Leij, F. Rhizosphere; John Wiley & Sons, Ltd.: Chichester, UK, 2001. [Google Scholar] [CrossRef]
  40. Silva, R.; Filgueiras, L.; Santos, B.; Coelho, M.; Silva, M.; Estrada-Bonilla, G.; Vidal, M.; Baldani, J.I.; Meneses, C. Gluconacetobacter diazotrophicus changes the molecular mechanisms of root development in Oryza sativa L. growing under water stress. Int. J. Mol. Sci. 2020, 21, 333. [Google Scholar] [CrossRef] [Green Version]
  41. Duke, P.; Jarvis, J. The catalase test-a cautionary tale. J. Med. Lab. Technol. 1972, 29, 203–204. [Google Scholar]
  42. Forbes, B.A.; Sahm, D.F.; Weissfeld, A. Bailey and Scott’s Diagnostic Microbiology, 14th ed.; Elsevier-Health Sciences Division: St. Louis, MO, USA, 2007; pp. 779–800. [Google Scholar]
  43. MacFaddin, J.F. Biochemical Tests for Identification of Medical Bacteria, 3rd ed.; Lippincott Williams & Wilkins: Philadelphia, PA, USA, 1976. [Google Scholar]
  44. Louden, B.C.; Haarmann, D.; Lynne, A.M. Use of blue agar CAS assay for siderophore detection. J. Microbiol. Biol. Educ. 2011, 12, 51–53. [Google Scholar] [CrossRef] [Green Version]
  45. Nautiyal, C.S. An efficient microbiological growth medium for screening phosphate solubilising microorganisms. FEMS Microbiol. Lett. 1999, 170, 265–270. [Google Scholar] [CrossRef]
  46. Mohite, B. Isolation and characterisation of indole acetic acid (IAA) producing bacteria from rhizospheric soil and its effect on plant growth. J. Soil Sci. Plant Nutr. 2013, 13, 638–649. [Google Scholar]
  47. Li, Z.; Chang, S.; Lin, L.; Li, Y.; An, Q. A colorimetric assay of 1-aminocyclopropane-1-carboxylate (ACC) based on ninhydrin reaction for rapid screening of bacteria containing ACC deaminase. Lett. Appl. Microbiol. 2011, 53, 178–185. [Google Scholar] [CrossRef] [PubMed]
  48. Vílchez, J.I.; García-Fontana, C.; Román-Naranjo, D.; González-López, J.; Manzanera, M. Plant drought tolerance enhancement by trehalose production of desiccation-tolerant microorganisms. Front. Microbiol. 2016, 7, 1577. [Google Scholar] [CrossRef] [Green Version]
  49. Hoagland, D.R.; Arnon, D.I. The Water-Culture Method for Growing Plants without Soil, 2nd ed.; College of Agriculture, University of California: Berkeley, CA, USA, 1950; Volume 347. [Google Scholar]
  50. Ding, W.; Shah, N.P. Effect of various encapsulating materials on the stability of probiotic bacteria. J. Food Sci. 2009, 74, 100–107. [Google Scholar] [CrossRef] [PubMed]
  51. Metsalu, T.; Vilo, J. ClustVis: A web tool for visualizing clustering of multivariate data using Principal Component Analysis and heatmap. Nucleic Acids Res. 2015, 43, 566–570. [Google Scholar] [CrossRef] [PubMed]
  52. Glick, B.R. Plant growth-promoting bacteria: Mechanisms and applications. Scientifica 2012, 2012, 1–15. [Google Scholar] [CrossRef] [PubMed] [Green Version]
  53. Kloepper, J.W.; Lifshitz, R.; Zablotowicz, R.M. Free-living bacterial inocula for enhancing crop productivity. Trends Biotechnol. 1989, 7, 39–43. [Google Scholar] [CrossRef]
  54. Arruda, L.; Beneduzi, A.; Martins, A.; Lisboa, B.; Lopes, C.; Bertolo, F.; Passaglia, L.M.P.; Vargas, L.K. Screening of rhizobacteria isolated from maize (Zea mays L.) in Rio Grande do Sul State (South Brazil) and analysis of their potential to improve plant growth. Appl. Soil Ecol. 2013, 63, 15–22. [Google Scholar] [CrossRef]
  55. Trifi, H.; Salem, I.B.; Benzina, N.K.; Fourati, A.; Costa, M.C.; Achouak, W.; Sghaier, H.; Saidi, M. Effectiveness of the plant growth-promoting rhizobacterium Pantoea sp. BRM17 in enhancing Brassica napus growth in phosphogypsum-amended soil. Pedosphere 2017, 30, 570–576. [Google Scholar] [CrossRef]
  56. El-Howeity, M.; Asfour, M. Response of some varieties of canola plant (Brassica napus L.) cultivated in a newly reclaimed desert to plant growth promoting rhizobacteria and mineral nitrogen fertilizer. Ann. Agric. Sci. 2012, 57, 129–136. [Google Scholar] [CrossRef]
  57. Kirkham, M. Field Capacity, Wilting Point, Available Water, and the Non-Limiting Water Range, 2nd ed.; Acedemic Press: Cambridge, MA, USA, 2005. [Google Scholar] [CrossRef]
  58. Amellal, N.; Burtin, G.; Bartoli, F.; Heulin, T. Colonization of wheat roots by an exopolysaccharide-producing Pantoea agglomerans strain and its effect on rhizosphere soil aggregation. Appl. Environ. Microbiol. 1998, 64, 3740–3747. [Google Scholar] [CrossRef] [Green Version]
  59. Pera, A.; Vallini, G.; Sireno, I.; Bianchin, M.L.; De Bertoldi, M. Effect of organic matter on rhizosphere microorganisms and root development of sorghum plants in two different soils. Plant Soil 1983, 74, 3–18. [Google Scholar] [CrossRef]
  60. Glick, B.R.; Liu, C.; Ghosh, S.; Dumbroff, E.B. Early development of canola seedlings in the presence of the plant growth-promoting rhizobacterium Pseudomonas putida GR12-2. Soil Biol. Biochem. 1997, 29, 1233–1239. [Google Scholar] [CrossRef]
  61. Bertrand, H.; Nalin, R.; Bally, R.; Cleyet-Marel, J.-C. Isolation and identification of the most efficient plant growth-promoting bacteria associated with canola (Brassica napus). Biol. Fertil. Soils 2001, 33, 152–156. [Google Scholar] [CrossRef]
  62. Kloepper, J.; Hume, D.; Scher, F.; Singleton, C.; Tipping, B.; Laliberte, M.; Frauley, K.; Kutchaw, T.; Simonson, C.; Lifshitz, R. Plant growth-promoting rhizobacteria on canola (rapeseed). Plant Dis. 1988, 72, 42–46. [Google Scholar] [CrossRef]
  63. Ahmadi, K.; Zarebanadkouki, M.; Ahmed, M.A.; Ferrarini, A.; Kuzyakov, Y.; Kostka, S.J.; Carminati, A. Rhizosphere engineering: Innovative improvement of root environment. Rhizosphere 2017, 3, 176–184. [Google Scholar] [CrossRef]
  64. Santaella, C.; Schue, M.; Berge, O.; Heulin, T.; Achouak, W. The exopolysaccharide of Rhizobium sp. YAS34 is not necessary for biofilm formation on Arabidopsis thaliana and Brassica napus roots but contributes to root colonization. Environ. Microbiol. 2008, 10, 2150–2163. [Google Scholar] [CrossRef] [PubMed] [Green Version]
  65. Carminati, A.; Zarebanadkouki, M.; Kroener, E.; Ahmed, M.A.; Holz, M. Biophysical rhizosphere processes affecting root water uptake. Ann. Bot. 2016, 118, 561–571. [Google Scholar] [CrossRef] [Green Version]
  66. Chenu, C. Extracellular Polysaccharides: An Interface between Microorganisms and Soil Constituents; CRC Lewis Publishers: Boca Raton, FL, USA, 1995; pp. 217–233. [Google Scholar]
  67. Pantanella, F.; Berlutti, F.; Passariello, C.; Sarli, S.; Morea, C.; Schippa, S. Violacein and biofilm production in Janthinobacterium lividum. J. Appl. Microbiol 2007, 102, 992–999. [Google Scholar] [CrossRef]
  68. Yu, X.; Jiang, J.; Liang, C.; Zhang, X.; Wang, J.; Shen, D.; Feng, Y. Indole affects the formation of multicellular aggregate structures in Pantoea agglomerans YS19. J. Gen. Appl. Microbiol. 2016, 62, 31–37. [Google Scholar] [CrossRef] [PubMed] [Green Version]
  69. Dey, R.; Pal, K.; Bhatt, D.; Chauhan, S. Growth promotion and yield enhancement of peanut (Arachis hypogaea L.) by application of plant growth-promoting rhizobacteria. Microbiol. Res. 2004, 159, 371–394. [Google Scholar] [CrossRef]
  70. Hernlem, B.J.; Vane, L.M.; Sayles, G.D. The application of siderophores for metal recovery and waste remediation: Examination of correlations for prediction of metal affinities. Water Res. 1999, 33, 951–960. [Google Scholar] [CrossRef]
  71. Schalk, I.J.; Hannauer, M.; Braud, A. New roles for bacterial siderophores in metal transport and tolerance. Environ. Microbiol. 2011, 13, 2844–2854. [Google Scholar] [CrossRef]
  72. Rajkumar, M.; Ae, N.; Prasad, M.N.V.; Freitas, H. Potential of siderophore-producing bacteria for improving heavy metal phytoextraction. Trends Biotechnol. 2010, 28, 142–149. [Google Scholar] [CrossRef]
  73. Trapet, P.; Avoscan, L.; Klinguer, A.; Pateyron, S.; Citerne, S.; Chervin, C.; Mazurier, S.; Lemanceau, P.; Wendehenne, D.; Besson-Bard, A. The Pseudomonas fluorescens siderophore pyoverdine weakens Arabidopsis thaliana defense in favour of growth in iron-deficient conditions. Plant Physiol. 2016, 675–693. [Google Scholar] [CrossRef] [PubMed] [Green Version]
  74. Ganeshan, G.; Manoj Kumar, A. Pseudomonas fluorescens, a potential bacterial antagonist to control plant diseases. J. Plant Interact. 2005, 1, 123–134. [Google Scholar] [CrossRef]
  75. Aznar, A.; Dellagi, A. New insights into the role of siderophores as triggers of plant immunity: What can we learn from animals? J. Exp. Bot. 2015, 66, 3001–3010. [Google Scholar] [CrossRef] [PubMed] [Green Version]
  76. Chaiharn, M.; Chunhaleuchanon, S.; Lumyong, S. Screening siderophore producing bacteria as potential biological control agent for fungal rice pathogens in Thailand. World J. Microbiol. Biotechnol. 2009, 25, 1919–1928. [Google Scholar] [CrossRef]
  77. Pieterse, C.M.; Zamioudis, C.; Berendsen, R.L.; Weller, D.M.; Van Wees, S.C.; Bakker, P.A. Induced systemic resistance by beneficial microbes. Annu. Rev. Phytopathol. 2014, 52, 347–375. [Google Scholar] [CrossRef] [PubMed] [Green Version]
  78. Chaiharn, M.; Theantana, T.; Pathom-aree, W. Evaluation of Biocontrol Activities of Streptomyces spp. against Rice Blast Disease Fungi. Pathogens 2020, 9, 126. [Google Scholar] [CrossRef] [PubMed] [Green Version]
  79. Chandrasekaran, M.; Chun, S.C. Induction of defence-related enzymes in tomato (Solanum lycopersicum) plants treated with Bacillus subtilis CBR05 against Xanthomonas campestris pv. vesicatoria. Biocontrol Sci. Technol. 2016, 26, 1366–1378. [Google Scholar] [CrossRef]
  80. Shoaib, A.; Awan, Z.A.; Khan, K.A. Intervention of antagonistic bacteria as a potential inducer of disease resistance in tomato to mitigate early blight. Sci. Hortic. 2019, 252, 20–28. [Google Scholar] [CrossRef]
  81. Backer, R.; Rokem, J.S.; Ilangumaran, G.; Lamont, J.; Praslickova, D.; Ricci, E.; Subramanian, S.; Smith, D.L. Plant growth-promoting rhizobacteria: Context, mechanisms of action, and roadmap to commercialization of biostimulants for sustainable agriculture. Front. Plant Sci. 2018, 9, 1473. [Google Scholar] [CrossRef] [Green Version]
  82. Patten, C.L.; Glick, B.R. Bacterial biosynthesis of indole-3-acetic acid. Can. J. Microbiol. 1996, 42, 207–220. [Google Scholar] [CrossRef] [PubMed]
  83. Prinsen, E.; Costacurta, A.; Michiels, K.; Vanderleyden, J.; Van Onckelen, H. Azospirillum brasilense indole-3-acetic acid biosynthesis: Evidence for a non-tryptophan dependent pathway. Mol. Plant Microbe Interact. 1993, 6, 609–615. [Google Scholar] [CrossRef]
  84. Jasim, B.; Joseph, A.A.; John, C.J.; Mathew, J.; Radhakrishnan, E. Isolation and characterization of plant growth promoting endophytic bacteria from the rhizome of Zingiber officinale. 3 Biotech 2014, 4, 197–204. [Google Scholar] [CrossRef] [Green Version]
  85. Francis, C.A.; Obraztsova, A.Y.; Tebo, B.M. Dissimilatory metal reduction by the facultative anaerobe Pantoea agglomerans SP1. Appl. Environ. Microbiol. 2000, 66, 543–548. [Google Scholar] [CrossRef] [Green Version]
  86. Sachdev, D.P.; Chaudhari, H.G.; Kasture, V.M.; Dhavale, D.D.; Chopade, B.A. Isolation and characterization of indole acetic acid (IAA) producing Klebsiella pneumoniae strains from rhizosphere of wheat (Triticum aestivum) and their effect on plant growth. Indian J. Exp. Biol. 2009, 47, 993–1000. [Google Scholar] [PubMed]
  87. Glick, B.R.; Karaturovíc, D.M.; Newell, P.C. A novel procedure for rapid isolation of plant growth promoting pseudomonads. Can. J. Microbiol. 1995, 41, 533–536. [Google Scholar] [CrossRef]
  88. Belimov, A.A.; Safronova, V.I.; Sergeyeva, T.A.; Egorova, T.N.; Matveyeva, V.A.; Tsyganov, V.E.; Borisov, A.Y.; Tikhonovich, I.A.; Kluge, C.; Preisfeld, A. Characterization of plant growth promoting rhizobacteria isolated from polluted soils and containing 1-aminocyclopropane-1-carboxylate deaminase. Can. J. Microbiol. 2001, 47, 642–652. [Google Scholar] [CrossRef] [PubMed]
  89. Indiragandhi, P.; Anandham, R.; Madhaiyan, M.; Sa, T. Characterization of plant growth–promoting traits of bacteria isolated from larval guts of diamondback moth Plutella xylostella (Lepidoptera: Plutellidae). Curr. Microbiol. 2008, 56, 327–333. [Google Scholar] [CrossRef] [PubMed]
  90. Siddikee, M.A.; Chauhan, P.; Anandham, R.; Han, G.-H.; Sa, T. Isolation, characterization, and use for plant growth promotion under salt stress, of ACC deaminase-producing halotolerant bacteria derived from coastal soil. J. Microbiol. Biotechnol. 2010, 20, 1577–1584. [Google Scholar] [CrossRef] [PubMed]
  91. Lay, C.-Y.; Bell, T.H.; Hamel, C.; Harker, K.N.; Mohr, R.; Greer, C.W.; Yergeau, É.; St-Arnaud, M. Canola root–associated microbiomes in the Canadian Prairies. Front. Microbiol. 2018, 9, 1–19. [Google Scholar] [CrossRef] [PubMed]
  92. Poly, F.; Monrozier, L.J.; Bally, R. Improvement in RFLP procedure to study the community of nitrogen fixers in soil through the diversity of nifH gene. Res. Microbiol. 2001, 152, 95–103. [Google Scholar] [CrossRef]
  93. Gray, E.; Smith, D. Intracellular and extracellular PGPR: Commonalities and distinctions in the plant–bacterium signaling processes. Soil Biol. Biochem. 2005, 37, 395–412. [Google Scholar] [CrossRef]
  94. Farina, R.; Beneduzi, A.; Ambrosini, A.; de Campos, S.B.; Lisboa, B.B.; Wendisch, V.; Vargas, L.K.; Passaglia, L.M. Diversity of plant growth-promoting rhizobacteria communities associated with the stages of canola growth. Appl. Soil Ecol. 2012, 55, 44–52. [Google Scholar] [CrossRef]
  95. de Campos, S.B.; Youn, J.-W.; Farina, R.; Jaenicke, S.; Jünemann, S.; Szczepanowski, R.; Beneduzi, A.; Vargas, L.K.; Goesmann, A.; Wendisch, V.F. Changes in root bacterial communities associated to two different development stages of canola (Brassica napus L. var oleifera) evaluated through next-generation sequencing technology. Microbiol. Res. 2013, 65, 593–601. [Google Scholar] [CrossRef] [PubMed]
Figure 1. The effect of reducing water activity on B. napus L. total biomass after 7 days of growth compared to normal water activity “control” (50% Hoagland and Arnon solidified with 1.5% agar medium and no added PEG) to −0.25 MPA (10% PEG overlayed), −0.5 (20% PEG overlayed), −0.7 MPA (30% PEG overlayed), −1.2 MPA (50% PEG Overlayed), and −1.7 (70% PEG overlayed) was assessed. “a” denotes significant difference (p < 0.05) in total dry plant biomass measured for plants germinated and grown on 50% strength Hoagland and Arnon medium with 1.5% agar and 20–30% PEG compared to “control” plants germinated and grown on 50% strength Hoagland and Arnon medium with 1.5% agar. “b” denotes significant difference (p < 0.05) in total dry plant biomass measured for plant germinated and grown on 50% strength Hoagland and Arnon medium with 1.5% agar and 50% PEG compared to “control” plants and all other treatment groups. “c” denotes significant difference (p < 0.05) in total dry plant biomass measured for plants germinated and grown on 50% strength Hoagland and Arnon medium with 1.5% agar and 70% PEG compared to “control” plants and all other treatment groups.
Agronomy 10 01449 g001
Figure 2. Effect of bacterial isolates on plant shoot (A) and root (B) biomass after 30 days in a laboratory based growth chamber at 22 °C, a low nutrient sand based medium supplemented with 50% Hoagland and Arnon solution and a controlled water activity of 3%. For each strain, 1 × 10³ CFU of each strain was added when seeds were sown. “a” denotes significant (p < 0.05) difference in dry shoot biomass for plants inoculated with P. fluorescens DUS11-9 and Pseudomonas sp. DUS5-2 compared to uninoculated control plants, and plants treated with other inoculants. “b” denotes significant (p < 0.05) difference in dry shoot biomass for plants inoculated with P. agglomerans DUS1-2 compared to uninoculated control plants, and all other inoculated plants. “c” denotes significant (p < 0.05) difference in dry root biomass for plants inoculated with Pseudomonas sp. DUS5-2 compared to uninoculated control plants, and all other inoculated plants.
Agronomy 10 01449 g002
Figure 3. Effect of bacterial isolates on plant shoot (A) and root (B) biomass after 30 days in a laboratory based growth chamber at 22 °C, a low nutrient sand based medium supplemented with 50% Hoagland and Arnon solution and a controlled water activity of 1.5%. For each strain, 1 × 10³ CFU of each strain was added when seeds were sown. “a” denotes significant (p < 0.05) difference in dry shoot and root biomass compared to uninoculated control plants and plants inoculated with Pseudomonas sp. DUS5-2 or P. agglomerans DUS1-2.
Agronomy 10 01449 g003aAgronomy 10 01449 g003b
Figure 4. Effect of bacterial isolates on plant shoot (A) and root (B) biomass after 91 days in a glasshouse system with media (soil) maintained at 8% water activity. For inoculated plants, 1 × 10³ CFU of each strain were added when seeds were sown. Five biological replicates (five pots) with five technical replicates (five plants per pot) were set up and grown for 91 days for each treatment group. Significantly (p < 0.05) increased dry shoot (A) and dry root (B) biomass of inoculated plants compared to uninoculated control plants are denoted by the letter “a”.
Agronomy 10 01449 g004aAgronomy 10 01449 g004b
Figure 5. Effect of bacterial isolates on plant shoot (A) and root (B) biomass after 91 days in a glasshouse system with media (soil) maintained at 8% water activity. For inoculated plants, 1 × 10³ CFU of each strain were added when seeds were sown. Five biological replicates (five pots) with five technical replicates (five plants per pot) were set up and grown for 91 days for each treatment group. Significantly (p < 0.05) increased dry shoot (A) and dry root (B) biomass of inoculated plants compared to uninoculated control plants are denoted by an “a”.
Agronomy 10 01449 g005aAgronomy 10 01449 g005b
Figure 6. Effect of bacterial isolates on rhizosheath mass for plants growth in 8% (A) or 4% (B) water activity after 91 days of growth in a glasshouse system in the presence of plant growth promoting (PGP) bacterial strains (control plants were uninoculated). For inoculated plants, 1 × 10³ CFU of each strain were added when seeds were sown. Five biological replicates (five pots) with five technical replicates (five plants per pot) were set up and grown for 91 days for each treatment group. For rhizosheath mass from plants grown in 8% water activity: “a” denotes significant (p < 0.05) difference between rhizosheath of plants inoculated with Janthinobacterium sp. DUS1-33 compared to control plants rhizosheath. “b” denotes significant (p < 0.05) difference between P. fluorescens DUS11-9 and DUS1-29 compared to rhizosheaths of uninoculated control plants, or plants inoculated with Pseudomonas sp. DUS5-2, P. fluorescens DUS1-14, or P. agglomerans DUS1-2. “c” denotes significant (p < 0.05) difference between P. protegens DUS1-27 with rhizosheaths from all other treatments apart from P. fluorescens DUS1-29. For rhizosheath mass from plants grown in 4% water activity: “d” denotes significant (p < 0.05) difference between rhizosheaths of plants inoculated with Pseudomonas sp. DUS5-2 compared to uninoculated control plants and plants inoculated with Janthinobacterium sp. DUS1-33. “e” denotes significant (p < 0.05) difference between rhizosheaths of plants inoculated with P. fluorescens DUS11-9 compared to uninoculated control plants and plants inoculated with Pseudomonas strains DUS1-29 and DUS1-27, P. agglomerans DUS1-2, or Janthinobacterium sp. DUS1-33.
Agronomy 10 01449 g006aAgronomy 10 01449 g006b
Figure 7. Total plant dry biomass for plants grown in either sand-based systems with 3% water activity (3% sand), sand-based system with 1.5% water activity (1.5% sand), soil-based system and 8% water activity (8% soil) or soil-based system with 4% water activity (4% soil). The ranking is based on PCA analysis where total dry plant biomass of uninoculated control plants or inoculated plants was compared across the four growth systems.
Agronomy 10 01449 g007
Figure 8. Field trial assessment of PGP effect of bacterial isolates on plants after 91 days of growth based on dry shoot (A) and dry root (B) biomass from triplicate 10 m2 plots for each treatment. For each strain, 1 × 10³ CFU of each strain was added when seeds were sown. Bacterial strains that significantly (p < 0.05) increase dry shoot biomass for plants inoculated with P. fluorescens DUS1-29 to uninoculated control plants or plants inoculated with other strains is denoted by an “a”.
Agronomy 10 01449 g008
Figure 9. Principal component analysis of the effect bacterial isolates have on B. napus L. total plant dry biomass for plants grown in either sand-based systems with 3% water activity (3% sand), sand-based system with 1.5% water activity (1.5% sand), soil-based system and 8% water activity (8% soil), soil-based system with 4% water activity (4% soil), or field conditions (Field Trial). Ranking is based on PCA analysis where total dry plant biomass of uninoculated control plants or inoculated plants was compared across the five growth systems.
Agronomy 10 01449 g009
Table 1. Isolate capacity to solubilise both Fe2+/3+ and PO43−, production of Indole-3-acetic acid (IAA) and 1-aminocyclopropane-1-carboxylate (ACC), and deaminase activity.
Isolate IDOrganism NameFe2+/3+ SolubilisationPO43− SolubilisationIAA μg/mg ProteinACC Deaminase Activity (µM)
Per mg of Protein
DUS11-9Pseudomonas fluorescens++0.240.94
DUS1-29Pseudomonas fluorescens++0.251.12
DUS1-27Pseudomonas protegens++0.070.79
DUS5-2Pseudomonas sp.++0.290.45
DUS1-14Pseudomonas fluorescens++0.071.59
DUS1-2Pantoea agglomerans++0.841.33
DUS1-33Janthinobacterium sp.++2.410.84
Table 2. Colony forming units (CFU) of inoculated bacteria per g of sand-based medium and CFU per g of “other bacteria” associated with canola grown in sterilised sand-based medium for 30 days with media (soil) maintained at 3% water activity. For each strain, 1 mL of cells (1 × 10³) was applied to seedlings five days post germination. No significant difference (p < 0.05) was observed for CFU of inoculated strains or “other bacteria” in the sand-based medium after 30 days.
Strain NameCFU × 104 Inoculated StrainCFU × 102 Other Bacteria
Control (uninoculated)N/A4 ± 1.0
P. fluorescens DUS11-99.0 ± 1.03 ± 1.0
P. fluorescens DUS1-299.0 ± 2.04 ± 1.0
P. protegens DUS1-277.0 ± 1.04 ± 1.0
Pseudomonas sp. DUS5-28.0 ± 1.04 ± 1.0
P. fluorescens DUS1-149.0 ± 1.03 ± 1.0
P. agglomerans DUS1-29.0 ± 1.03 ± 1.0
Janthinobacterium sp. DUS1-337.0 ± 1.04 ± 1.0
Table 3. Colony forming units of inoculated bacteria per g of sand-based medium and CFU per g of “other bacteria” associated with canola grown in sterilised sand-based medium for 30 days with media (soil) maintained at 1.5% water activity. For each strain, 1 mL of cells (1 × 10³) was applied to seedlings five days post germination. No significant difference (p < 0.05) was observed for CFU of inoculated strains or “other bacteria” in the sand-based medium after 30 days.
Strain NameCFU × 103 Inoculated StrainCFU × 102 Other Bacteria
Control (uninoculated)N/A3 ± 1.0
P. fluorescens DUS11-96.0 ± 1.03 ± 1.0
P. fluorescens DUS1-297.0 ± 1.02 ± 1.0
P. protegens DUS1-276.0 ± 1.03 ± 1.0
Pseudomonas sp. DUS5-26.0 ± 1.02 ± 1.0
P. fluorescens DUS1-146.0 ± 1.03 ± 1.0
P. agglomerans DUS1-27.0 ± 1.02 ± 1.0
Janthinobacterium sp. DUS1-335.0 ± 1.03 ± 1.0
Table 4. Germination efficiency, CFU of inoculated bacteria per g of sand-based medium and total bacterial CFU of other bacteria per g of soil-based medium associated with canola grown in sterilised soil-based medium for 91 days in a glasshouse system with media (soil) maintained at 8% water activity. For each strain, 1 × 10³ CFU per 50 seeds of each strain were adhered to seeds using a xanthan gum and alginate based sticker 24 h prior to sowing. No significant difference (p < 0.05) was observed for CFU of inoculated strains in soil after 91 days. “a” denotes soil samples where the CFU of “other bacteria” in the growth medium is significantly lower (p < 0.05) compared to the CFU of bacteria quantified from soil of the uninoculated control plants.
Strain NameCFU × 104 Inoculated StrainCFU × 104 Other BacteriaGermination % (15 Seeds)
Control (uninoculated)N/A53.6 ± 21.3100 ± 0
P. fluorescens DUS11-915.4 ± 9.719.4 ± 8.3 a100 ± 0
P. fluorescens DUS1-2939.0 ± 11.314.4 ± 8.5 a100 ± 0
P. protegens DUS1-2720.8 ± 8.328.2 ± 7.5100 ± 0
Pseudomonas sp. DUS5-220.2 ± 12.131.4 ± 10.4100 ± 0
P. fluorescens DUS1-1424.4 ± 10.321.2 ± 10.398 ± 2
P. agglomerans DUS1-222.4 ± 5.727.4 ± 10.3100 ± 0
Janthinobacterium sp. DUS1-3339.4 ± 13.622.2 ± 8.498 ± 2
Table 5. Germination efficiency, CFU of inoculated bacteria per g of soil-based medium and total bacterial CFU per g of soil-based medium associated with canola grown in sterilised soil-based medium for 91 days in a glasshouse system with media (soil) maintained at 4% water activity. For each strain, 1 × 10³ CFU per 50 seeds of each strain were adhered to seeds using a xanthan gum and alginate based sticker 24 h prior to sowing. “a” denotes CFU of P. fluorescens DUS1-27 present in soil medium after 91 days as being significantly higher (p < 0.05) than CFUs of other inoculated strains after 91 days. “b” denotes soil samples where the CFU of “other bacteria” in the growth medium is significantly lower (p < 0.05) compared to that of the CFU bacteria quantified from soil of the uninoculated control plants.
Strain NameCFU × 104 Inoculated StrainCFU × 104 Other BacteriaGermination % (15 Seeds)
Control (uninoculated)N/A47.6 ± 16.497 ± 3
P. fluorescens DUS11-929.4 ± 8.317.6 ± 6.8 b98 ± 2
P. fluorescens DUS1-2921.4 ± 9.215.2 ± 6.2 b98 ± 2
P. protegens DUS1-2761.2 ± 22.4 a11.6 ± 7.1 b98 ± 2
Pseudomonas sp. DUS5-223.2 ± 7.220.6 ± 11.397 ± 3
P. fluorescens DUS1-1419.8 ± 8.323.2 ± 10.597 ± 3
P. agglomerans DUS1-223.4 ± 8.618.6 ± 6.6 b100 ± 0
Janthinobacterium sp. DUS1-3323.2 ± 8.536.2 ± 8.397 ± 3

