Article

Genome-Wide Diversity Analysis of Valeriana officinalis L. Using DArT-seq Derived SNP Markers

1
Plant Breeding and Acclimatization Institute (IHAR)—National Research Institute, National Centre for Plant Genetic Resources, Radzików, 05-870 Błonie, Poland
2
Polish Academy of Sciences Botanical Garden—Center for Biological Diversity Conservation in Powsin, Prawdziwka 2, 02-973 Warsaw, Poland
3
Department of Vegetable and Medicinal Plants, Institute of Horticultural Sciences, Warsaw University of Life Sciences–SGGW, Nowoursynowska 166, 02-787 Warsaw, Poland
*
Author to whom correspondence should be addressed.
Agronomy 2020, 10(9), 1346; https://doi.org/10.3390/agronomy10091346
Submission received: 7 August 2020 / Revised: 31 August 2020 / Accepted: 2 September 2020 / Published: 7 September 2020

Abstract

:
Common valerian (Valeriana officinalis L.) is one of the most important medicinal plants, with a mild sedative, nervine, antispasmodic and relaxant effect. Despite a substantial number of studies on this species, the genetic diversity and population structure have not yet been analyzed. Here, we use a next-generation sequencing-based Diversity Array Technology sequencing (DArT-seq) technique to analyze Polish gene bank accessions that originated from wild populations and cultivars. The major and, also, the most astounding result of our work is the low level of observed heterozygosity of individual plants from natural populations, despite the fact that the species is widespread in the studied area. Inbreeding in naturally outcrossing species such as valerian decreases reproductive success. The analysis of the population structure showed the potential presence of a metapopulation in the central part of Poland and the formation of a distinct gene pool in the Bieszczady Mountains. The results also indicate the presence of the cultivated gene pool within wild populations in the region where the species is cultivated for the needs of the pharmaceutical industry, and this could lead to structural and genetic imbalances in wild populations.

1. Introduction

Common valerian (Valeriana officinalis L.) has a long tradition of use as a medicinal plant [1]. Valerian root is one of the best-tested plant materials in terms of pharmacology and clinical aspects. The raw material contains compounds from several chemical groups, including essential oil (according to European Pharmacopoeia [2], not less than 0.5%), valepotriates and sesquiterpenic acids (according to Eur. Ph. not less than 0.17%), with valerenic and acetoxyvalerenic acids considered as species-specific marker compounds. Valerian root and the extracts thereof are used in the states of anxiety or sleeping disorders. Their efficacy relates to an interplay between distinct groups of compounds rather than with individual compounds [3].
V. officinalis belongs to the genus Valeriana L. that is a part of the family Valerianaceae, now considered also as a part of the Caprifoliaceae Juss., in the order Dipsacales Juss. ex Bercht. & J.Presl [4]. Approximately 350 species are listed within this cosmopolitan genus, several of which are of commercial interest [5]. V. officinalis occurs natively throughout Eurasia, except for arctic and desert zones [6]. It occupies fresh habitats such as pastures, meadows, ditches, scrub, open woodland and along margins of watercourses but, also, dry calcareous soils. Common valerian is a highly morphologically differentiated perennial with short, straight rhizome, roots and stolons as underground organs. The leaves are sessile, pinnately separated, with 6–10 pairs of lance-shaped leaflets. The flowers are numerous, hermaphrodites arranged in a terminal cymose inflorescence with white or pink five-lobed corolla [7]. V. officinalis sensu lato makes up a collective species with controversial subordinate taxonomy and phylogeny. Besides a high degree of developmental plasticity, it also has a varying ploidy level (2n = 14, 2n = 28, 2n = 42 or 2n = 56) [8,9,10].
There is a lack of complex molecular genetic studies of V. officinalis, as well as for the majority of medicinal plants. Next-generation sequencing (NGS) technology could provide an efficient toolkit for genotyping studies of medicinal plants. NGS, which is based on massive parallel sequencing, has revolutionized plant science over the last years [11]. This ultra-high-throughput, scalable and high-speed technology can be applied to organisms having an unknown genome sequence. Large amounts of single nucleotide polymorphism (SNP) markers can be obtained through simplified genome sequencing like restriction site-associated DNA sequencing (RADSeq), genotyping-by-sequencing (GBS) or other related techniques [12,13,14]. DArT-seq (Diversity Array Technology sequencing) is one such method. DArT was first developed at the beginning of the 2000s and has improved both throughput and accuracy in the detection of DNA polymorphisms with no prior information on DNA sequences through hybridization and solid-state surfaces [15]. Today’s DArT-seq technique results from a combination of DArT and NGS [16]. Using combinations of endonucleases that target low-copy DNA sites rather than repetitive DNA fragments leads to an effective reduction in genome complexity. The resultant representation of the genome is composed of both constant and polymorphic fragments across individuals. Until now, DArT-seq has been applied to many plant species, especially cultivated plants, due to its high throughput, genomic coverage and transferability. Relatively few papers on its use for the genotyping of wild and medicinal plant species have been published. It has been successfully used in Eucalyptus L’Hér [17], Cochlearia polonica A.Fröhl. and Ligularia sibirica (L.) Cass. [18] research.
The aims of this study were (i) the evaluation of the usefulness of the DArT-seq technique for the genotyping of V. officinalis, (ii) the characterization of genetic variations of populations of V. officinalis in Poland, (iii) the comparison of variations of wild populations and the cultivar, (iv) the establishment of foundations for genetic monitoring of the species in the future and (v) the development of genetic fingerprint profiles for samples deposited in the gene bank and in natural sites to assess the degree of their genetic integrity and population structure preservation in the future.

2. Materials and Methods

2.1. Plant Materials

V. officinalis seeds were collected in 2015 from 19 wild populations in Poland (Mazowieckie, Świętokrzyskie, Kujawsko-Pomorskie and Podkarpackie sites) (Figure 1). The bulk samples of seeds representing each population were formed by collecting seeds from a minimum of 30 individuals covering the entire range of the population in the natural site. The abundance of V. officinalis was determined at each site according to the Braun-Blanquet scale [19]. Cultivar “Lubelski”, which seeds were obtained from the Martin Bauer Group, was used as a reference material. The accession number of the gene bank maintained at the National Centre for Plant Genetic Resources, Plant Breeding and Acclimatization Institute (IHAR)—National Research Institute (Poland) has been assigned to each of the seed samples (Table 1). From each accession, 25 seeds were taken at random and sown in the greenhouse, into multi-pots (with hole diameters 2–3 cm) filled with peat substrate to get seedlings. Voucher specimens were deposited at the herbarium of the Department of Vegetables and Medicinal Plants, Warsaw University of Life Sciences—SGGW. Seeds were preserved under gene bank conditions in the National Centre for Plant Genetic Resources and are available for distribution through the web-based application EGISET [20].

2.2. DNA Extraction and Genetic Analysis

For DNA analysis, 10 seedlings from wild populations and 20 from the cultivar were selected at random. Young, healthy leaves were collected separately from each plant and dried in the presence of active silica gel. Until DNA isolation, the dried material was stored in −18 °C in vacuum-sealed packages. The tissue was crushed into a fine powder in a bead mill (Mixer Mill MM 200, Retsch, Haan, Germany). Isolation of DNA was conducted using the Genomic Mini AX Plant kit (A&A Biotechnology, Gdynia, Poland) according to the manufacturer’s protocol. DNA integrity was evaluated visually after electrophoresis in 2% agarose gel. Purity and concentration were evaluated spectrophotometrically (NanoDrop ND-1000, NanoDrop Technologies, Willmington, DA, USA). A set of 188 isolates with appropriate qualitative and quantitative parameters was sent for DArT-seq analysis to Diversity Arrays Technology lab, University of Canberra, Australia. Reduction of the genome complexity was performed using two restriction enzymes, i.e., MseI and PstI.

2.3. Data Analysis

The results of genotyping were generated as a table listing SNP (codominant) markers that are single nucleotide polymorphisms detected in the sequenced fragments of genome representations. SNP markers were then scored as binary data, indicating the presence (1) or absence (0) of a marker in the genomic representation of each sample, as described by Cruz et al. [16] and, in the next step, were tested for reproducibility (%), call rate (%) and polymorphism information content (PIC). The following coefficients were calculated: observed heterozygosity (Ho), Nei unbiased genetic diversity (uHe) and inbreeding coefficient (FIS). The following equations were used:
uH e = n n 1 ( 1 i = 1 n p i 2 )
where n is the sample size, and pi is the frequency of the ith trait/marker.
F IS = 1 H o uH e
Genetic distance was measured by using the Jaccard coefficient [21] according to the formula:
d J = 1 a ( a + b + c )
where a is the number of variables present in both individuals being compared, b is the number of variables present in the first individual and absent from the second individual and c is the number of variables present in the second individual and absent from the first one. The symmetric genetic distance matrix was used to assess the amount of variation among the assigned regional groupings by Analysis of Molecular Variance (AMOVA) with tests including 999 permutations. In order to test for a correlation between genetic and geographical distances (in km) among populations, Mantel tests were performed (computing 10,000 permutations). Genetic structure was assessed using Principal Coordinate Analysis (PCoA) and model-based Bayesian clustering algorithms. Admixture and a correlated allele frequencies model was used to determine the number of clusters (K) in the range from one to ten. Ten independent runs were set for each number of clusters (K value), with a burn-in period of 100,000 and 500,000 Markov Chain Monte Carlo replications after burn-in with no prior information about the origin of individuals. The ΔK method was used to determine the most probable value of K [22]. All above mentioned analyses were performed using the Microsoft Excel 2016 (Microsoft, Redmond, WA, USA), R packages (vegan, dplyr and ape); XLSTAT Ecology (Addinsoft, Inc., Brooklyn, NY, USA); GenAlEx 6.501 [23]; STRUCTURE v2.3.4 [24] and CLUMPAK [25]. The data analysis was performed within the framework of the Computational Grant (G72-19) of the Interdisciplinary Centre for Mathematical and Computational Modelling, University of Warsaw, Poland (ICM UW). The raw supplementary data available at https://osf.io/76342/.

3. Results

3.1. Marker Quality Analysis

A total of 65,510 SNP markers with an average reproducibility of 99.6% were obtained using the DArT-seq method for 188 individuals of V. officinalis. Over 98% of SNPs had reproducibility above 95%, of which 55,101 were completely reproducible (Figure 2a). The SNP reproducibility is defined as the proportion of successful replicates among all repetition attempts. The call rate was in the range from 20% to 100% (Figure 2b). Approximately 63% of SNPs had a call rate above 75%. The call rate is defined as the proportion of individuals in the study for which SNP information in particular loci is available. When the quality criteria were applied, i.e., reproducibility above 95% and call rate 100%, 23,507 SNP markers were assigned to a subsequent analysis. The PIC was in the range of 0.01–0.5, with an average of 0.181 and a median of 0.129. As much as 40% of SNP markers had a PIC below 0.1, and only 1% had a maximum value of 0.5 (Figure 2c).

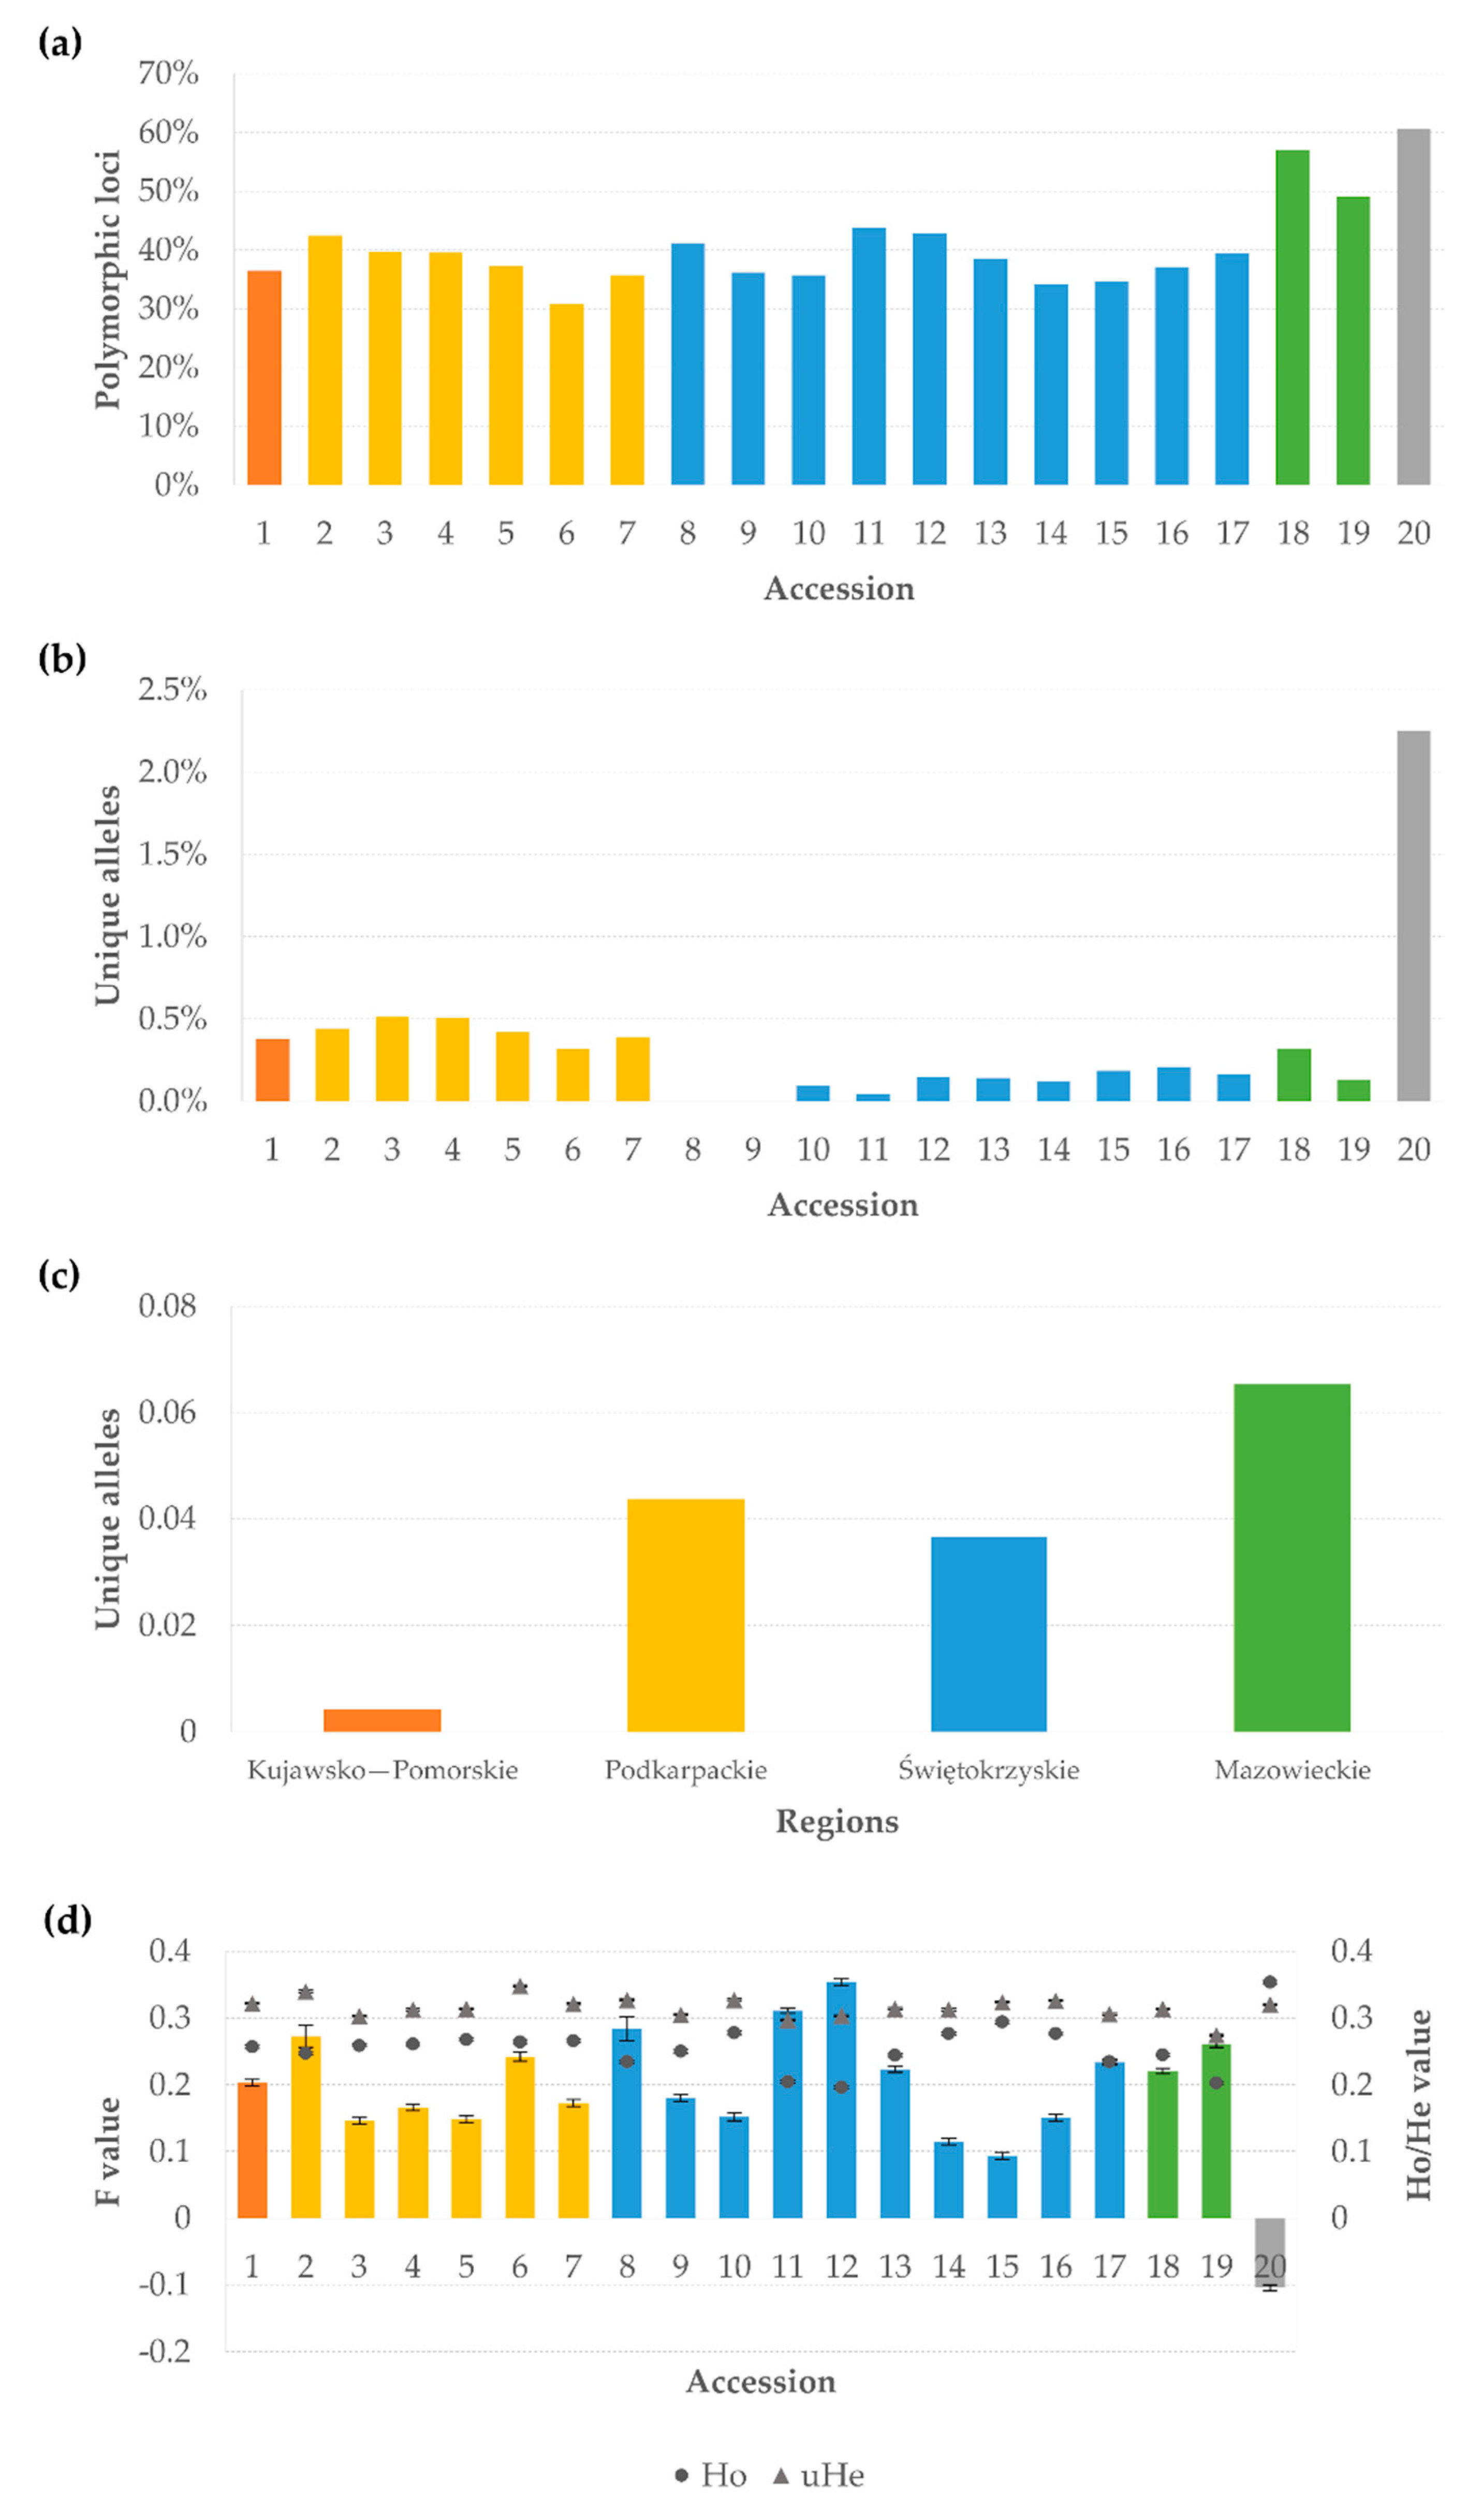
3.2. Genetic Diversity

The percentage of polymorphic loci ranged from 31% to 61% (Figure 3a). The comparison of wild populations and cultivar regarding the occurrence of unique alleles showed that their number ranged from 0 to 1059 (Figure 3b). No unique alleles were found in two populations (PL 403186(8) and PL 403187(9)) originating from the Świętokrzyskie Voivodeship. Twenty-two percent of alleles that occurred in wild populations were not represented in the cultivar. The contribution of SNP markers unique for the regions is shown in Figure 3c. The observed heterozygosity (Ho) ranged from 0.196 (PL 401941(12)) to 0.354 PL 401951(20)) (Figure 3d). The mean heterozygosity of the wild populations was 0.250. Individual specimens in accessions PL 406738(18) and PL 403192(19) showed significantly higher Ho levels. It was comparable to the Ho observed to the cultivar, which is tetraploid. The expected heterozygosity (uHe) varied between 0.274 (PL 403192(19)) and 0.348 (PL 403183(6)), with an average for the wild populations of 0.315 (Figure 3d). The lowest value of the inbreeding coefficient (FIS) was found for cultivar PL 401951(20) (–0.104), while the highest for accession PL 401941(12) (0.354) (Figure 3d). In general, in wild populations, this coefficient reached values above zero, which indicated inbreeding. The accession PL 401945(15) from the Świętokrzyskie Voivodeship was the closest to the state of Hardy-Weinberg equilibrium. A negative F-value for the cultivar indicates excessive heterozygosity. The genetic distance, according to Jaccard’s coefficient, between the examined individuals ranged from 0.08 (individuals from accessions PL 406738(18) and PL 403192(19)) to 0.380 (individuals from accessions PL 401941(12) and PL 406738(18)). The mean distance between individuals from natural populations was 0.239.

3.3. Mantel Test

The Mantel test, in which genetic distance matrices between populations with a matrix of geographical distance between them, were collated and showed a moderate positive relationship (0.304; p < 0.0001).

3.4. AMOVA

The AMOVA analysis for SNP markers of all samples showed that 23% of the variance in the allele frequency could be attributed to differences between populations. In the cases when only wild populations were analyzed, the value of the population differentiation (ɸPT) coefficient was 0.199 (p < 0.001). The hierarchical AMOVA of wild populations revealed that 78% of the total variance was found among individuals and 16% was found among populations, while the rest of the variation (6%) was among regions. The genetic variation between the cultivar and wild populations was 29% (Figure 4).

3.5. Population Structure

The first three main coordinates of PCoA explained only 24.5% of the total variability (Figure 5). In the first and second coordinate systems, four groups—i.e., the cultivar, the population originating from the Podkarpackie region, with a separate population of PL 403183(6), and a large group comprising populations from the other three Voivodeships—were clearly visible. The third coordinate allowed to isolate, as well, a group of individuals from the Mazowieckie Voivodeship. In the group formed by the cultivar, there were also five specimens from the Mazowieckie Voivodeship. These were specimens with a higher level of Ho, which seems to confirm that they were tetraploid.
In order to further elaborate the genetic structure of the populations, a model-based Bayesian clustering was conducted using Structure 2.3.4 software [24]. The analysis was run separately for di- and tetraploids. To find the suitable value of K, the number of clusters (K) was tested in the range from 1 to 10 and was plotted against ΔK. Genotypes that the estimated proportion of membership (Q) scored > 0.80 were considered as pure, while < 0.80 as admixed. A sharp peak for K = 2 (Figure 6a) indicated that two distinct pools were found to contribute significant genetic information across tested diploid accessions. However, lower-order structures were also recorded for K = 3 and K = 5. For tetraploid individuals, a clear peak was present for K = 2. (Figure 6b). The proportion of membership of individuals in each pool was illustrated in the bar plot of the population assignment test in the structure analysis (Figure 6c,d). Among the diploids, two main pools formed 30.4% and 66.7% of the individuals, respectively. The remaining 2.9% of the individuals were classified as admixed. To the first gene pool were assigned only individuals of accessions that originated from the Bieszczady Mountains in the Podkarpackie Voivodeship. The second gene pool consisted of individuals from the rest of the country. The secondary population structure, for K = 3, indicated that the third gene pool was separated from the second one. Eight out of thirteen individuals from the populations that originated from the Mazowieckie Voivodeship had a share coefficient of over 80% of the third gene pool. In addition, its negligible presence was observed among individuals from the Kujawsko-Pomorskie and Świętokrzyskie Voivodeships. The structure of the lower order was identified at the K = 5 level. The additional admixture, i.e., the fourth gene pool, has been shown for individuals of the accession PL 403183(6) collected in the Bieszczady Mountains. The presence of the fifth gene pool was recorded among the accessions that originated from the Świętokrzyskie Voivodeship. It dominated in three accessions, i.e., PL 403186(8), PL 403187(9) and PL 401938(10), while, in the remaining ones, it was an admixture. For tetraploids, two gene pools associated with biological status, i.e., cultivar and individuals from wild populations, were clearly visible (Figure 6d).

4. Discussion

V. officinalis is a species commonly used in herbal medicine. It is widespread in Europe and Asia and is currently not considered being endangered. Previous studies concerned mainly the content and specification of active compounds and their use for therapeutic purposes [1,26,27,28,29]. Several studies using molecular markers, such as amplified fragment length polymorphism (AFLP) or random amplification of polymorphic DNA (RAPD), were performed for this species, but none of them concerned the intraspecies diversity analysis [30,31,32]. In this context, Valeriana wallichii DC (syn. Valeriana jatamansi Jones) is much better recognized [33,34,35,36,37,38]. The NGS high-throughput sequencing technology, i.e., RADseq, has already been used in Valerianaceae phylogenetic research, but in the research presented in this paper, only the species native to South America were concerned, and V. officinalis was not included in it [39].

4.1. Utility of DArT-seq Markers

To the best of our knowledge, in the research presented in this paper, the NGS technology was used for the first time for analyzing intraspecies variations within the Valeriana genus. Until now, the used here DArT-seq technique has been mainly applied for the analyses of crop and animal species [40,41,42,43,44,45]. For 188 individuals of V. officinalis representing 19 accessions that originated from natural populations and one cultivar using the DArT-seq technique, over 65,000 SNPs with very high reproducibility coefficients were obtained. For comparison, in Triticum durum Desf., a DArT-seq analysis allowed to identify over than 20,000 SNPs [46]. In phylogenetic studies of the genus Secale, this technique allowed to identify about 14,000 SNPs, and in studies of rye inbreeding lines, almost 5000 SNP markers were obtained [47,48]. However, it should be noted that the genome of V. officinalis is over two point five times smaller than the genome of Secale cerale L. and more than four times smaller than the genome of T. durum [30,49,50]. Thus, a considerably larger part of the genome was covered here by the SNP analysis. In the population genomics of Eucalyptus species, 54,000 SNP markers were recorded [17]. In earlier studies of V. officinalis, using AFLP markers, only 311 fragments were generated [30]. The PIC value obtained in the presented study was quite low and amounted to 0.181. It was a derivative of a significant fraction of monomorphic loci. In the above-mentioned cereal studies, the PIC value was significantly higher and amounted to 0.302 in wheat and 0.37 in rye for the SNPs [17,48]. On the other hand, similar (~0.18) PIC values were obtained in the study of Ctenophorus caudicinctus, Litoria ewingii and Litoria paraewingi (Australian lizard and frogs) [45]. Based on the above data, therefore, it can be concluded that the DArT-seq technique is efficient and useful in the genetic analysis of V. officinalis.

4.2. Diversity

Due to the lack of earlier studies on genetic variability in the V. officinalis species, it is difficult to refer the level of parameters obtained in the presented paper to species-specific diversity patterns. A substantial fraction of monomorphic loci or such with a very low level of polymorphism and a negligible proportion of unique alleles/loci shows a very homogenous genetic background of the examined natural populations. The low level of observed heterozygosity and positive values of the inbreeding coefficients indicate a prevalence of mating between closely related individuals. Considering that V. officinalis produces rhizome and is capable of clonal propagation, there is a high probability that adjacent individuals at natural sites are, in fact, ramets clusters, i.e., a group of clones formed as a result of the vegetative proliferation of a genet (mother plant). They can still be linked to the mother plant or exist separately as a result of the division of the genet [51]. Moreover, according to the research of Konon and Novikova [52], in valerian, the mechanism of self-incompatibility appears to be absent. Thus, pollination with pollen of the same genotype is possible, although fertilization with foreign pollen is promoted by the delayed development of the stigma in relation to the stamens [32]. This is also confirmed by the lack of correlation between the level of variation and the abundance of V. officinalis in the natural sites. Moreover, in the cultivar, the level of genetic variability is significantly higher than in natural populations, and the inbreeding coefficient indicates the excess of heterozygotes, even though the cultivar was developed as a result of targeted selection. However, this selection was conducted in terms of the content of active compounds. Therefore, individuals representing a similar phenotype and a different genotype were probably selected. Their free crossbreeding led to an increase in heterozygosity. The higher variability of the cultivar results also from the farming practice and pollination biology of this species. Valerian has a high outcrossing rate of 76.5% to 97.7% under field conditions, as shown by studies of Penzkofer et al. [32]. Under the cultivation conditions for herbal raw material, plantations are established from the seedlings, and the plants are unearthed in the second year of growing. The result is that no clonal propagation takes place on plantations, i.e., a single plant is a single genet, and neighboring plants will probably have a different genetic makeup because of mixing of seeds before sowing and the random planting of seedlings. It is also important that the cultivar is tetraploid in contrast to accessions originated from the natural sites. Thus, the observed heterozygosity may result from the presence of different alleles on homologous chromosomes.

4.3. Gene Pool

Despite, to a large extent, the homogeneous genetic background of natural populations, based on the analysis of the population structure, the differentiation of gene pools typical for particular regions of the country was clearly visible. It is most noticeable in the case of Podkarpackie Voivodeship, where there occurs a spatial isolation due to the presence of the Bieszczady Mountains. However, the structure of the population also indicates that there is no complete isolation of the natural populations, since, in each of the regions, some admixture from the adjacent gene pool(s) appears, which is also indicated by the fact that the correlation between the genetic and geographical distance was rather limited. The presence of the additional gene pool in different degrees in populations originating from Podkarpackie and Świętokrzyskie Voivodeships from which the wild populations of V. officinalis originated may indicate that an additional gene pool may be present in Southern Poland. This may be facilitated by the topography of that part of the country, i.e., the presence of highlands and high mountains (Tatra Mountains) with a more severe climate. The presence of V. officinalis on natural sites in that region has been proven [6,51]. From the point of view of the genetic structure of the population, the similarity of genotypes occurring in the Świętokrzyskie and Kujawsko-Pomorskie Voivodeships also seems to be interesting. This may indicate that a metapopulation with free gene flow occurs in a significant part of Poland. This hypothesis is supported by the widespread occurrence of valerian across the country; however, its verification will be possible only after investigating a larger number of natural populations, especially from regions not included in this study [6]. In the populations inhabiting the Mazowieckie Voivodeship, the presence of individuals that are potential tetraploids were detected. Based on the morphological features, which show high variability, additionally affected by environmental factors, it is impossible to distinguish between particular cytotypes [10]. The analysis of the population structure revealed the presence of a gene pool typical for the cultivar within individuals representing a wild population. This is probably due to the presence of valerian plantations in the area. In other words, the uncontrolled spread of the cultivar beyond the plantation area and crossbreeding of the wild and cultivated specimens could be possible. However, the tetraploid individuals could also represent a separate cytotype that occurs natively in the area, although with a much lower abundance. In order to verify which of the above hypotheses is true, a more detailed study of the populations occurring in this region would be necessary. These studies, in addition to the genetic fingerprint and cytotype, should also determine the chemotype, because the cultivated forms have a distinct chemical profile and contain more active compounds. Valerian cultivation is very widespread and common in the Lubelskie Voivodeship, so, in that area, the probability of contamination of natural populations by the cultivars is extremely high. Unfortunately, no environmental monitoring is carried out in this context.

4.4. Vulnerabilities

Although V. officinalis is still considered to be a commonly occurring species not only in Poland but, also, throughout its entire range of distribution, due to the loss and degradation of habitats, the abundance of this species may start to decline rapidly. Climate change and increasing periods of drought are not without significance here [53]. Considering the low level of heterozygosity and definitely lower than assumed level of genetic variation, in a very short time, this species may face the threshold of extinction, as inbreeding decreases the reproductive capacity of outbreeding species [54]. An additional risk that is not considered is the uncontrolled release into the environment of cultivars. Since valerian is a native species, no environmental monitoring is carried out in this area, especially since, without the use of molecular techniques, it is basically not possible. However, it should be expected that cultivars developed by selection and not representing a complete genetic makeup of the species will have an additional negative impact on the size of the gene pool. The cultivation of medicinal plant species, on the one hand, enhances the protection of the wild populations that are not drained to obtain raw herbal resources and, on the other hand, may cause a disturbance of the structure and genetic balance of the wild populations through the uncontrolled spread of individuals of cultivars beyond the plantation area. Based on the results presented here, it is impossible to assess to what extent this threat is real and what long-term effects it will have. However, there is no doubt about the existence of this problem, and this issue should be explored further in the future.

5. Conclusions

This study showed that DArT-seq technology can be applied effectively in genetic studies of V. officinalis. The analysis of genetic diversity showed that the wild populations had highly similar genetic makeups, and the individuals displayed high levels of homozygosity. These may threaten the species, especially in the context of climate change. Individuals representing a gene pool typical for the cultivar were found in the natural environment. Further detailed research is necessary to determine their origin, and their impact on the wild populations should be monitored.

Supplementary Materials

The supplementary materials can be found at https://osf.io/76342/.

Author Contributions

Conceptualization, M.B., K.B. and Z.W.; methodology, M.B.; validation, A.R.; formal analysis, W.P. and Z.W.; investigation, M.B.; resources, K.B., O.K. and Z.W.; data curation, M.B. and A.R.; writing—original draft preparation, M.B., K.B. and O.K.; writing—review and editing, A.R., W.P. and Z.W.; visualization, M.B.; supervision, W.P. and Z.W.; project administration, M.B., Z.W. and W.P.; funding acquisition, M.B., Z.W. and W.P. All authors have read and agreed to the published version of the manuscript.

Funding

The molecular studies were financed by the National Science Centre from grant “MINIATURA I”, no. 2017/01/X/NZ9/01170. The acquisition of seeds from the wild populations was supported by the Ministry of Agriculture and Rural Development of Poland in the form of the multi-annual program: 2015-2020 “Establishment of a scientific basis for biological progress and preservation of plant genetic resources as a source of innovation in order to support sustainable agriculture and food security of the country”, coordinated by the Plant Breeding and Acclimatization Institute (IHAR)—National Research Institute. The calculations were performed at the Interdisciplinary Centre for Mathematical and Computational Modelling, University of Warsaw (ICM UW) within the framework of computational grant No. G72-19.

Acknowledgments

The authors would like to thank Monika Rakoczy-Trojanowska for her support in preparing the project proposal.

Conflicts of Interest

The authors declare that they have no competing interests.

References

  1. Patočka, J.; Jakl, J. Biomedically relevant chemical constituents of Valeriana officinalis. J. Appl. Biomed. 2010, 8, 11–18. [Google Scholar] [CrossRef] [Green Version]
  2. European Pharmacopoeia. Baldrianwurzel Valerianae Radix s.l., 9th ed.; Verlag GmbH: Stuttgart, Germany, 2017. [Google Scholar]
  3. Wichtl, M. Herbal Drugs and Phytopharmaceuticals: A Handbook for Practice on a Scientific Basis; Medpharm GmbH Scientific Publishers: Stuttgart, Germany, 2004. [Google Scholar]
  4. Khela, S. Valeriana Officinalis; The IUCN Red List of Threatened Species: Gland, Switzerland, 2012. [Google Scholar]
  5. Bell, C.D. Preliminary phylogeny of Valerianaceae (Dipsacales) inferred from nuclear and chloroplast DNA sequence data. Mol. Phylogenet. Evol. 2004, 31, 340–350. [Google Scholar] [CrossRef] [PubMed]
  6. Zaja̜c, M.; Zajac, A. Elementy Geograficzne Rodzimej Flory Polski: The Geographical Elements of Native Flora of Poland; Inst. Botaniki Uniw. Jagiellońskiego: Krakow, Poland, 2009; p. 93. [Google Scholar]
  7. Bone, K.; Simon Mills, M.; Fnimh, M. Principles and Practice of Phytotherapy: Modern Herbal Medicine; Elsevier Health Sciences: London, UK, 2012; p. 1056. [Google Scholar]
  8. Evstatieva, L.; Handjieva, N.; Popov, S.; Pashankov, P. A biosystematic study of Valeriana officinalis (Valerianaceae) distributed in Bulgaria. Plant Sys. Evol. 1993, 185, 167–179. [Google Scholar] [CrossRef]
  9. Hidalgo, O.; Vallès, J. First record of a natural hexaploid population for Valeriana officinalis: genome size is confirmed to be a suitable indicator of ploidy level in the species. Caryologia 2012, 65, 243–245. [Google Scholar] [CrossRef]
  10. Skalińska, M. Polyploidy in Valeriana officinalis Linn. in relation to its ecology and distribution. Bot. J. Linn. Soc. 1947, 53, 159–186. [Google Scholar] [CrossRef]
  11. Egan, A.N.; Schlueter, J.; Spooner, D.M. Applications of next-generation sequencing in plant biology. Am. J. Bot. 2012, 99, 175–185. [Google Scholar] [CrossRef] [Green Version]
  12. Andrews, K.R.; Good, J.M.; Miller, M.R.; Luikart, G.; Hohenlohe, P.A. Harnessing the power of RADseq for ecological and evolutionary genomics. Nat. Rev. Genet. 2016, 17, 81. [Google Scholar] [CrossRef] [Green Version]
  13. Davey, J.W.; Hohenlohe, P.A.; Etter, P.D.; Boone, J.Q.; Catchen, J.M.; Blaxter, M.L. Genome-wide genetic marker discovery and genotyping using next-generation sequencing. Nat. Rev. Genet. 2011, 12, 499. [Google Scholar] [CrossRef]
  14. Poland, J.A.; Brown, P.J.; Sorrells, M.E.; Jannink, J.-L. Development of high-density genetic maps for barley and wheat using a novel two-enzyme genotyping-by-sequencing approach. PloS ONE 2012, 7, e32253. [Google Scholar] [CrossRef] [Green Version]
  15. Jaccoud, D.; Peng, K.; Feinstein, D.; Kilian, A. Diversity arrays: A solid state technology for sequence information independent genotyping. Nucleic Acids Res. 2001, 29, 25. [Google Scholar] [CrossRef] [Green Version]
  16. Cruz, V.M.V.; Kilian, A.; Dierig, D.A. Development of DArT marker platforms and genetic diversity assessment of the US collection of the new oilseed crop Lesquerella and related species. PLoS ONE 2013, 8. [Google Scholar] [CrossRef] [PubMed] [Green Version]
  17. Rutherford, S.; Rossetto, M.; Bragg, J.G.; McPherson, H.; Benson, D.; Bonser, S.P.; Wilson, P.G. Speciation in the presence of gene flow: Population genomics of closely related and diverging Eucalyptus species. Heredity 2018, 121, 126–141. [Google Scholar] [CrossRef] [PubMed]
  18. Rucińska, A.; Polish Academy of Sciences Botanical Garden - Center for Biological Diversity Conservation in Powsin, Warsaw, Poland. Personal communication, 2018.
  19. Braun-Blanquet, J. Plant Sociology, The Study of Plant Communities; McGraw Hill: New York, NY, USA, 1932. [Google Scholar]
  20. NCPGR. EGISET. Available online: https://wyszukiwarka.ihar.edu.pl/pl (accessed on 1 July 2020).
  21. Jaccard, P. Étude comparative de la distribution florale dans une portion des Alpes et des Jura. Comparative study of the floral distribution in a part of the Alps and the Jura. Bull. Soc. Vaudoise. Sci. Nat. 1901, 37, 547–579. [Google Scholar]
  22. Evanno, G.; Regnaut, S.; Goudet, J. Detecting the number of clusters of individuals using the software STRUCTURE: A simulation study. Mol. Ecol. 2005, 14, 2611–2620. [Google Scholar] [CrossRef] [Green Version]
  23. Peakall, R.; Smouse, P.E. GenAlEx 6.5: Genetic analysis in Excel. Population genetic software for teaching and research-an update. Bioinformatics 2012, 28, 2537–2539. [Google Scholar] [CrossRef] [Green Version]
  24. Hubisz, M.J.; Falush, D.; Stephens, M.; Pritchard, J.K. Inferring weak population structure with the assistance of sample group information. Mol. Ecol. Res. 2009, 9, 1322–1332. [Google Scholar] [CrossRef] [Green Version]
  25. Kopelman, N.M.; Mayzel, J.; Jakobsson, M.; Rosenberg, N.A.; Mayrose, I. Clumpak: A program for identifying clustering modes and packaging population structure inferences across K. Mol. Ecol. Res. 2015, 15, 1179–1191. [Google Scholar] [CrossRef] [Green Version]
  26. Barton, D.L.; Atherton, P.J.; Bauer, B.A.; Moore, D.F., Jr.; Mattar, B.I.; LaVasseur, B.I.; Rowland, K.M., Jr.; Zon, R.T.; LeLindqwister, N.A.; Nagargoje, G.G. The use of Valeriana officinalis (valerian) in improving sleep in patients who are undergoing treatment for cancer: A phase III randomized, placebo-controlled, double-blind study: NCCTG Trial, N01C5. J. Support. Oncol. 2011, 9, 24. [Google Scholar] [CrossRef] [Green Version]
  27. Circosta, C.; De Pasquale, R.; Samperi, S.; Pino, A.; Occhiuto, F. Biological and analytical characterization of two extracts from Valeriana officinalis. J. Ethnopharmacol. 2007, 112, 361–367. [Google Scholar] [CrossRef]
  28. Letchamo, W.; Ward, W.; Heard, B.; Heard, D. Essential oil of Valeriana officinalis L. cultivars and their antimicrobial activity as influenced by harvesting time under commercial organic cultivation. J. Agr. Food Chem. 2004, 52, 3915–3919. [Google Scholar] [CrossRef]
  29. Singh, N.; Gupta, A.; Singh, B.; Kaul, V. Quantification of valerenic acid in Valeriana jatamansi and Valeriana officinalis by HPTLC. Chromatographia 2006, 63, 209–213. [Google Scholar] [CrossRef]
  30. Bressler, S.; Klatte-Asselmeyer, V.; Fischer, A.; Paule, J.; Dobeš, C. Variation in genome size in the Valeriana officinalis complex resulting from multiple chromosomal evolutionary processes. Preslia 2017, 89, 41–61. [Google Scholar] [CrossRef] [Green Version]
  31. Pant, M.; Nailwal, T.K.; Tewari, L.M.; Kumar, S.; Kumari, P.; Kholia, H.; Tewari, G.; Campus, D. Molecular characterization of Valeriana species with PCR, RAPD and SDS PAGE. Nat. Sci. 2009, 7, 41–49. [Google Scholar]
  32. Penzkofer, M.; Seefelder, S.; Heuberger, H. Estimation of outcrossing rates using genomic marker and determination of seed quality parameters in Valeriana officinalis L. sl under field conditions. Euphytica 2018, 214, 81. [Google Scholar] [CrossRef]
  33. Rajkumar, S.; Singh, S.K.; Nag, A.; Ahuja, P.S. Genetic Structure of Indian Valerian (Valeriana jatamansi) Populations in Western Himalaya Revealed by AFLP. Biochem. Genet. 2011, 49, 674–681. [Google Scholar] [CrossRef]
  34. Singh, S.K.; Katoch, R.; Kapila, R.K. Genetic and Biochemical Diversity among Valeriana jatamansi Populations from Himachal Pradesh. Sci. World J. 2015, 2015, 1–10. [Google Scholar]
  35. Sundaresan, V.; Sahni, G.; Verma, R.; Padalia, R.; Mehrotra, S.; Thul, S.T. Impact of geographic range on genetic and chemical diversity of Indian valerian (Valeriana jatamansi) from northwestern Himalaya. Biochem. Genet. 2012, 50, 797–808. [Google Scholar] [CrossRef]
  36. Jugran, A.; Rawat, S.; Dauthal, P.; Mondal, S.; Bhatt, I.D.; Rawal, R.S. Association of ISSR markers with some biochemical traits of Valeriana jatamansi Jones. Ind. Crop. Prod. 2013, 44, 671–676. [Google Scholar] [CrossRef]
  37. Jugran, A.K.; Bhatt, I.D.; Rawal, R.S.; Nandi, S.K.; Pande, V. Patterns of morphological and genetic diversity of Valeriana jatamansi Jones in different habitats and altitudinal range of West Himalaya, India. Flora 2013, 208, 13–21. [Google Scholar] [CrossRef]
  38. Jugran, A.K.; Bhatt, I.D.; Mondal, S.; Rawal, R.S.; Nandi, S.K. Genetic diversity assessment of Valeriana jatamansi Jones using microsatellites markers. Curr. Sci. 2015, 109, 1273–1282. [Google Scholar] [CrossRef] [Green Version]
  39. Gonzalez, L.A. Phylogenetics and mating system evolution in the Southern South American Valeriana (Valerianaceae). Master’s Thesis, University of New Orleans, New Orleans, LA, USA, 13 August 2014. [Google Scholar]
  40. Edet, O.U.; Gorafi, Y.S.; Nasuda, S.; Tsujimoto, H. DArTseq-based analysis of genomic relationships among species of tribe Triticeae. Sci. Rep. 2018, 8. [Google Scholar] [CrossRef]
  41. Zaitoun, S.Y.A.; Jamous, R.M.; Shtaya, M.J.; Mallah, O.B.; Eid, I.S.; Ali-Shtayeh, M.S. Characterizing Palestinian snake melon (Cucumis melo var. flexuosus) germplasm diversity and structure using SNP and DArTseq markers. BMC Plant Biol. 2018, 18, 246. [Google Scholar]
  42. Alam, M.; Neal, J.; O’Connor, K.; Kilian, A.; Topp, B. Ultra-high-throughput DArTseq-based silicoDArT and SNP markers for genomic studies in macadamia. PloS ONE 2018, 13, e0203465. [Google Scholar] [CrossRef] [PubMed] [Green Version]
  43. Schultz, A.J.; Cristescu, R.H.; Littleford-Colquhoun, B.L.; Jaccoud, D.; Frère, C.H. Fresh is best: Accurate SNP genotyping from koala scats. Ecol. Evol. 2018, 8, 3139–3151. [Google Scholar] [CrossRef] [PubMed]
  44. Nguyen, N.H.; Premachandra, H.; Kilian, A.; Knibb, W. Genomic prediction using DArT-Seq technology for yellowtail kingfish Seriola lalandi. BMC Genom. 2018, 19, 107. [Google Scholar] [CrossRef]
  45. Melville, J.; Haines, M.L.; Boysen, K.; Hodkinson, L.; Kilian, A.; Smith Date, K.L.; Potvin, D.A.; Parris, K.M. Identifying hybridization and admixture using SNPs: Application of the DArTseq platform in phylogeographic research on vertebrates. R. Soc. Open Sci. 2017, 4, 161061. [Google Scholar] [CrossRef] [Green Version]
  46. Baloch, F.S.; Alsaleh, A.; Shahid, M.Q.; Çiftçi, V.; de Miera, L.E.S.; Aasim, M.; Nadeem, M.A.; Aktaş, H.; Özkan, H.; Hatipoğlu, R. A whole genome DArTseq and SNP analysis for genetic diversity assessment in durum wheat from central fertile crescent. PLoS ONE 2017, 12, e0167821. [Google Scholar] [CrossRef] [Green Version]
  47. Al-Beyroutiová, M.; Sabo, M.; Sleziak, P.; Dušinský, R.; Birčák, E.; Hauptvogel, P.; Kilian, A.; Švec, M. Evolutionary relationships in the genus Secale revealed by DArTseq DNA polymorphism. Plant Syst. Evol. 2016, 302, 1083–1091. [Google Scholar] [CrossRef]
  48. Targońska-Karasek, M.; Bolibok-Brągoszewska, H.; Rakoczy-Trojanowska, M. DArTseq genotyping reveals high genetic diversity of polish rye inbred lines. Crop Sci. 2017, 57, 1906–1915. [Google Scholar] [CrossRef] [Green Version]
  49. Bauer, E.; Schmutzer, T.; Barilar, I.; Mascher, M.; Gundlach, H.; Martis, M.M.; Twardziok, S.O.; Hackauf, B.; Gordillo, A.; Wilde, P. Towards a whole-genome sequence for rye (Secale cereale L.). Plant J. 2017, 89, 853–869. [Google Scholar] [CrossRef] [Green Version]
  50. Bennett, M.D.; Leitch, I.J. Nuclear DNA amounts in angiosperms. Ann. Bot. 1995, 76, 113–176. [Google Scholar] [CrossRef]
  51. Kostrakiewicz-Gierałt, K. The variability of population and individual traits of medicinal plant Valeriana officinalis L. var. officinalis Mikan under different site conditions. Period. Biol. 2018, 120, 41–50. [Google Scholar]
  52. Konon, N.; Novikova, N. Reaction of Valeriana officinalis to inbreeding. Rastitel’nye Resur. 1981, 17, 85–90. [Google Scholar]
  53. Ruosteenoja, K.; Markkanen, T.; Venäläinen, A.; Räisänen, P.; Peltola, H. Seasonal soil moisture and drought occurrence in Europe in CMIP5 projections for the 21st century. Clim. Dyn. 2018, 50, 1177–1192. [Google Scholar] [CrossRef] [Green Version]
  54. Brook, B.W.; Tonkyn, D.W.; O’Grady, J.J.; Frankham, R. Contribution of inbreeding to extinction risk in threatened species. Conserv. Ecol. 2002, 6, 1–16. [Google Scholar] [CrossRef] [Green Version]
Figure 1. Geographical regions where the accessions of Valeriana officinalis originated from. Accession numbering in accordance with Table 1.
Agronomy 10 01346 g001
Figure 2. Distribution of Diversity Array Technology sequencing (DArT-seq) data for the quality parameters: (a) single nucleotide polymorphism (SNP) data reproducibility, (b) SNP data call rate and (c) SNP polymorphic information content distribution.
Agronomy 10 01346 g002
Figure 3. The results of the diversity analysis: (a) the percentage of polymorphic loci within the populations, (b) the contribution of unique alleles in the studied populations, (c) the percentage of unique alleles in the examined regions and (d) the genetic diversity coefficients. Accession numbering in accordance with Table 1. Ho: heterozygosity and He: genetic diversity.
Agronomy 10 01346 g003
Figure 4. The Analysis of Molecular Variance (AMOVA) framework.
Agronomy 10 01346 g004
Figure 5. The Principal Coordinate Analysis: (a) Coordinate 1 vs. Coordinate 2, (b) Coordinate 1 vs. Coordinate 3 and (c) Coordinate 2 vs. Coordinate 3.
Agronomy 10 01346 g005
Figure 6. The population structure analysis based on SNP markers. (a) The results of the most probable value of K (∆K) measures [22] for diploids; (b) the results of the ∆K measure for tetraploids; (c) the results of 100,000 iterations of Bayesian clustering algorithms using an admixture and correlated allele frequencies model by STRUCTURE software [24] with K = 2, K = 3 and K = 5, where K is the number of groups assumed for diploids, and (d) the results of 100,000 iterations of Bayesian clustering algorithms using an admixture and correlated allele frequencies model by STRUCTURE software with K = 2, where K is the number of groups assumed for tetraploids. Each vertical bar represents a single plant. The length of the colored segment shows the estimated proportion of membership of that sample to each group. Accession numbering is in accordance with Table 1.
Agronomy 10 01346 g006
Table 1. The list of surveyed accessions. The abundance according to the Braun-Blanquet scale. Accession number and passport data in accordance with the EGISET database of the National Centre for Plant Genetic Resources [20].
Population No.Region—VoivodeshipAccession No.LatitudeLongitudeAbundancePloidy
1Kujawsko-PomorskiePL 401930N 53.03E 17.1142n = 14
2PodkarpackiePL 401935N 49.26E 22.0322n = 14
3PodkarpackiePL 403179N 49.21E 22.0932n = 14
4PodkarpackiePL 403181N 49.25E 22.0722n = 14
5PodkarpackiePL 403182N 49.39E 21.5922n = 14
6PodkarpackiePL 403183N 49.36E 22.1212n = 14
7PodkarpackiePL 403184N 49.41E 22.1512n = 14
8ŚwiętokrzyskiePL 403186N 50.43E 20.3122n = 14
9ŚwiętokrzyskiePL 403187N 50.43E 20.3142n = 14
10ŚwiętokrzyskiePL 401938N 50.46E 20.3232n = 14
11ŚwiętokrzyskiePL 401939N 50.52E 20.5632n = 14
12ŚwiętokrzyskiePL 401941N 50.92E 20.5622n = 14
13ŚwiętokrzyskiePL 401942N 51.01E 20.2622n = 14
14ŚwiętokrzyskiePL 403190N 51.01E 20.2832n = 14
15ŚwiętokrzyskiePL 401945N 51.04E 20.2342n = 14
16ŚwiętokrzyskiePL 401946N 51.14E 20.2232n = 14
17ŚwiętokrzyskiePL 403191N 51.06E 20.1532n = 14
18MazowieckiePL 406738N 52.07E 21.0522n = 14
19MazowieckiePL 403192N 52.07E 21.0522n = 14
20Cultivar “Lubelski”PL 401951N 52.81E 20.182n = 28

