Article

Effects of Morphological and Anatomical Characteristics of Banana Crown Vascular Bundles on Cutting Mechanical Properties Using Multiple Imaging Methods

1
College of Engineering, South China Agricultural University, Guangzhou 510642, China
2
Center of Experimental Teaching for Common Basic Courses, South China Agricultural University, Guangzhou 510642, China
3
Guangdong Provincial Key Laboratory of Conservation and Precision Utilization of Characteristic Agricultural Resources in Mountainous Areas, Jiaying University, Meizhou 514015, China
*
Author to whom correspondence should be addressed.
Agronomy 2020, 10(8), 1199; https://doi.org/10.3390/agronomy10081199
Submission received: 15 July 2020 / Revised: 6 August 2020 / Accepted: 13 August 2020 / Published: 14 August 2020
(This article belongs to the Section Agricultural Biosystem and Biological Engineering)

Abstract

:
To obtain the appropriate mechanized cutting region for banana dehanding, the methods of X-ray Computed Tomography (CT), Paraffin-embedded tissue section, and scanning electron microscopy (SEM) were adopted to observe the morphological and anatomical characteristics of vascular bundles of the banana crown. The results indicated that the crown can be divided into three regions, viz., the central stalk–crown transition region (CSCTR), the crown expansion region (CER), and the crown–finger transition region (CFTR). According to the obtained characteristics, the cutting mechanical properties are found to be affected by the relative angle between the vascular bundle and cutter (RAVBC) and the vascular bundle density. In CSCTR, due to the opposite change of RAVBC and density, the cutting mechanical properties become unstable and the cutting energy decreases gradually from 4.30 J to 2.57 J. While in CER, the cutting mechanical properties tend to be stable, and the cutting energy varies in a small range (2.83–2.92 J), owing to the small changes of RAVBC and density. When the vascular bundles cross from the CER to CFTR, the cutting energy increases with the increase of RAVBC and density, which varies from 3.37 to 4.84 J. Accordingly, the appropriate cutting region for dehanding, which can reduce the energy consumption and improve the cutting efficiency, is ascertained to be between CSCTR and CER.

1. Introduction

Bananas are a popularly marketed fresh fruit grown in more than 120 countries around the world [1]. The global production of bananas in 2017 is about 113 million tons [2] and is of significant economic and social value. Banana dehanding, the process of using a special knife to separate the banana hands from the central stalk (peduncle), is one of the key steps in postharvest handling procedures. The cutting position in the process of dehanding is usually located on the crown connecting the fingers and the central stalk, so dehanding could also be called crown cutting. Currently, dehanding is mainly manual, which is very dangerous; moreover, it consumes plenty of time and labor force [3,4]. Therefore, mechanized cutting has a positive effect on reducing production costs and improving production efficiency at this step. Since vascular bundles are the principal supporting tissue of the banana, and dehanding essentially involves interaction between the knife and the vascular bundles in the crown, it is fundamental to ascertain the influence of the morphological and anatomical characteristics of vascular bundles on the cutting process to achieve mechanized cutting.
Engineering theories and methods have been widely applied to plant morphology and anatomy, which could help to solve some agronomic problems [5]. Gibson et al. used cellular mechanics to analyze the morphological structure of cells and helped to understand the growth process of the plant [6,7]. Some reports aimed to comprehend stalk lodging in the plant growth process by three-point bending tests [8,9]. Generally, the morphological and anatomical characteristics of plant tissues are clarified to design more suitable agricultural machinery. Recently, many researchers reported the relationship between plant morphological parameters and cutting energy in, for example, safflower [10] and maize [11]. Leblicq et al. built a discrete element model based on a hollow steel tube, which was similar to the bending mechanical properties of wheat/barley stalks, to help engineers understand the interaction between plant stalks and machines [12,13]. According to the analysis above, the engineering theories and methods, plant morphology, and anatomy can be effectively connected and integrated together. A combined methodology can be adopted in the present work. Meanwhile, research in some opening literature nowadays mainly focuses on the design of banana dehanding cutting machinery [14,15], and few works consider the crown morphology and anatomy. While morphological and anatomical characteristics cannot only help to determine the appropriate mechanized cutting region and reduce the cutting energy, they can also improve work efficiency, reduce labor intensity, and realize mechanized cutting.
Traditional plant morphology and anatomy research methods are usually destructive, tedious, and time-consuming. These methods make it difficult to continuously observe the morphological and anatomical characteristics of plant tissues [16]. In recent years, X-ray Computed Tomography (CT) scanning has been widely used in plant morphology and anatomy as an advanced imaging method [17,18]. Some studies concentrated on plant roots; for example, Wasaya et al. [19] used CT scanning to extract root morphological parameters of drought-tolerant plants. Zheng et al. [20] introduced data processing and statistical algorithms in CT scans of plant roots. They explained that parallel computation and crowd computing could improve the ability to process CT scan data of roots, which could be applied to root morphology. Paya et al. [21] and Bauerle and Centinari [22] used CT scanning to track the growth process of plant roots and reveal the differences in the growth of different plant roots. Some researchers focused on extracting the three-dimensional morphology of flowers, combining CT scanning data with geometric morphometrics to evaluate the changes in petal formation during flower growth [23,24]. Several studies applied CT scanning to explain the microstructure of fruits or vegetables such as fresh chestnuts [25], apples [26,27], and potatoes [28]. In this present work, CT scanning can help to continuously observe the morphology of vascular bundles in the entire banana crown, owing to the fact that CT scanning has the advantages of being non-invasive, non-destructive, and fast. In addition, it is convenient for analyzing cutting mechanical properties.
The primary purpose of the present work is to reveal the relations between variations in the cutting mechanical properties and the crown vascular bundles, and further determine the appropriate mechanized cutting region. The methodologies of CT scanning, paraffin-embedded tissue section, and SEM were adopted to qualitatively explain the morphological and anatomical characteristics of the crown vascular bundles. Moreover, cutting tests were conducted to analyze the mechanical properties of the crown at different positions. In this, we aim to provide a fundamental understanding of the morphological and anatomical characteristics of banana crown vascular bundles and provide technical guidance for banana postharvest processing.

2. Materials and Methods

2.1. Banana Crown Preparation

In this paper, the Cavendish banana cultivar “Brazilian” (Musa acuminate L.), which is widely planted in Guangdong Province, China, was used for experiments. In addition, experiments started from the inflorescence emergence stage, when the fruit grew for about 100 days, and the raw banana bunches were picked up from Jiangmen City, Guangdong Province (22°32′ N, 112°58′ E). Since postharvest handling procedures of bananas kept them fresh (approximately 92–94% w.b.), the bunch was immediately transported to the laboratory for crown preparation to make the experiment closer to the actual process.
The banana crown preparation process is shown in Figure 1. The bunch (Figure 1a) was manually cut perpendicular to the central stalk to obtain the banana hand (Figure 1b). Then, the fruit fingers connected to the crown were removed with a knife. The remaining part was the crown (Figure 1c). Since the crown resembles fan-shape, the sample size was ascertained by the arc length of fan-shape. The total 24 samples with arc length of 187.16 (±9.58) mm were selected for the experiments, of which 2 for CT scanning, 1 for paraffin-embedded tissue section, 1 for SEM, and 20 for cutting test.

2.2. CT Scanning

An industrial CT scanning system (X5000, NorthStar Imaging, Rogers, MN, USA) was used to characterize the morphology of the vascular bundles in the banana crown. During the scanning process, the operating voltage and operating current of X-ray WorX were 160 kV and 100 μA, respectively, and the focal spot size was set to 15 μm. The detector and object were 700 mm and 180.327 mm away from the tube, respectively. The crown was placed in a plastic box on the rotary table, which rotated 360° in a 0.2° rotation step. The whole process lasted for about 98 min at a resolution of 25.3 μm, and the 3D volume model of the crown was reconstructed and visualized by established parameters. Figure 2a–c describe the three views of the crown. CT scanning images of the three views are shown in Figure 2a1–c1. Continuous 2D cross-sectional images of the crown were obtained by the accompanying software EFX-CT (North Star Imaging, Rogers, MN, USA) to analyze the morphology of the vascular bundles in the crown.
In the above experiment, the crown was serially sliced from the longitudinal direction (Figure 4a), and the 2D cross-sectional images with significant morphological differences were identified for analysis.

2.3. Biological Microscopic Observations
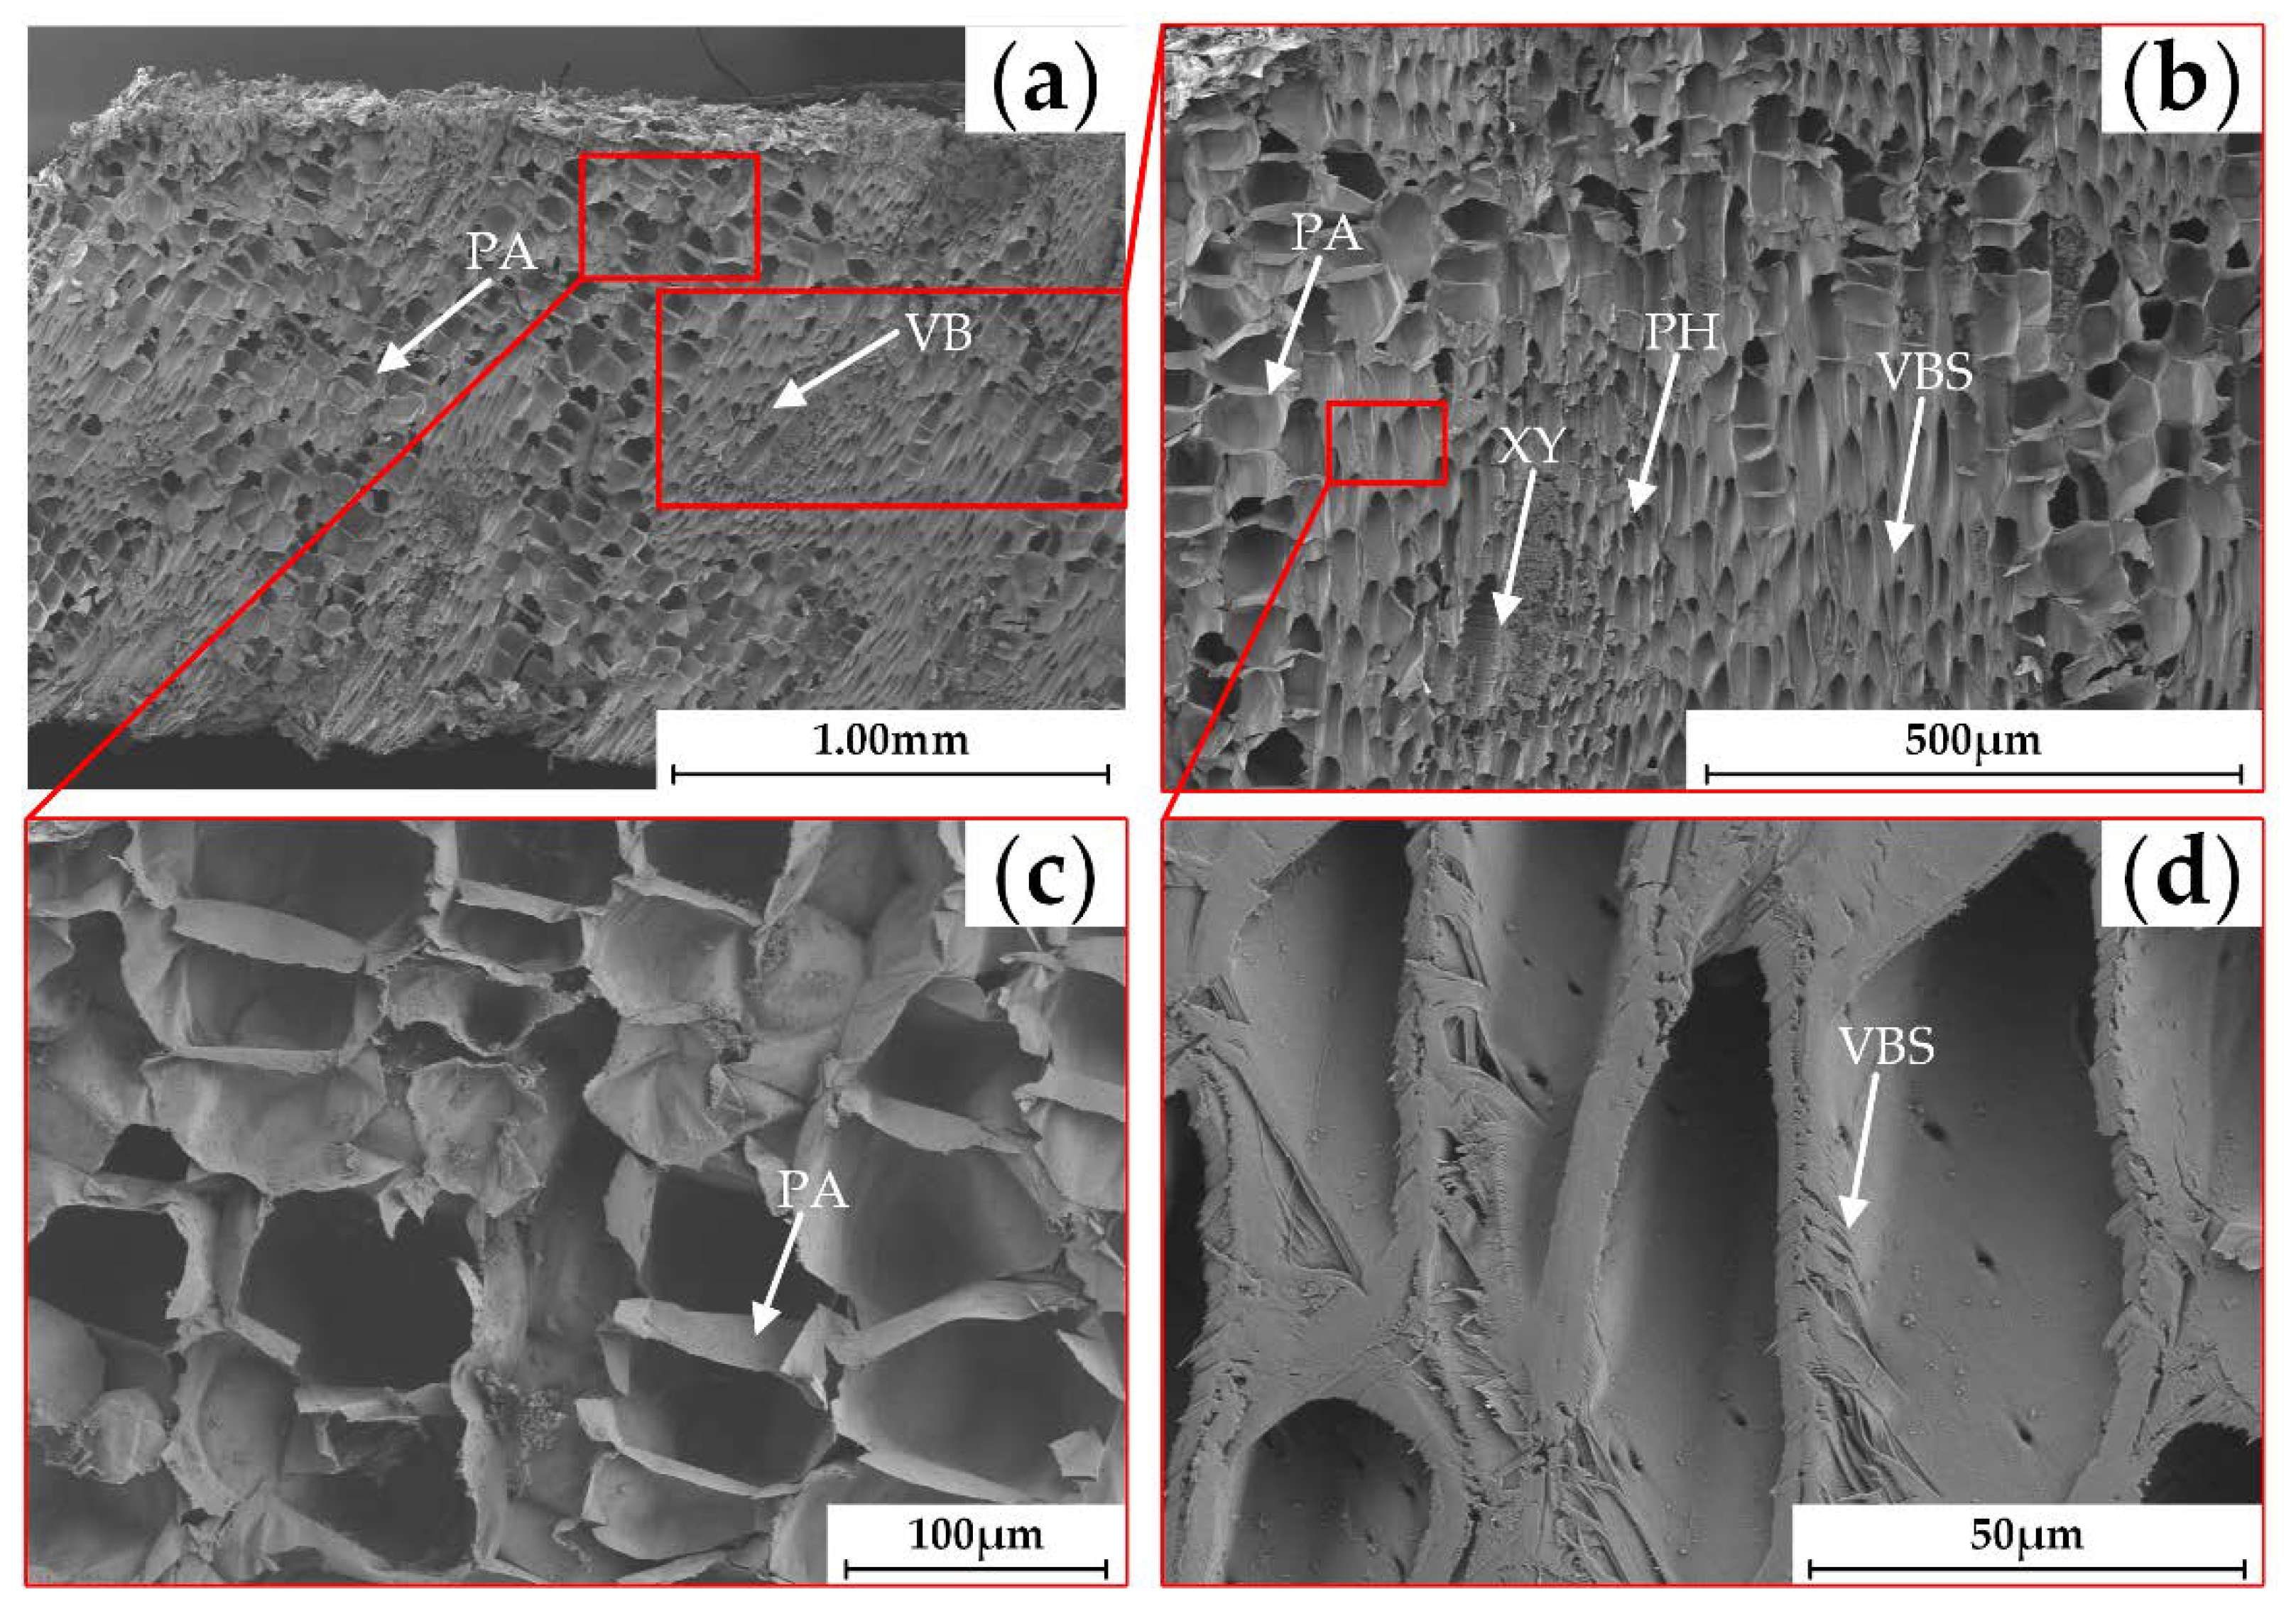
Longitudinal paraffin-embedded tissue sections were used to observe the anatomical characteristics of the banana crown. Combined with CT scanning images (Figure 4c3,c4), tissue sections with distinct morphological differences were prepared. The crown was longitudinally cut into 10 × 15 mm sections and immediately fixed by FAA solution (5% formaldehyde, 5% acetic acid, and 70% ethanol) for 48 h. The sections were washed with distilled water, and then the materials were dehydrated for 2 h each at a concentration of 50%, 70%, 80%, 95%, and 100% alcohol. Next, different proportions of butanol and absolute ethanol solutions were used to increase transparency (1:4, 2:2, 3:1, 4:0). Each step lasted for 2 h, followed by dipping for 24 h at 70 °C in paraffin and embedding. Finally, 8 μm thick sections were cut out by a microtome (Huahai 2508, Huahai, Jinhua, China). After the sections were dewaxed in xylene, they were stained with safranin O-fast Green (2%) [29]. The stained section was observed with automatic biological microscopy (BA600-4, Motic, Xiamen, China), and the section image was imaged and captured by the supporting software McAudi Digital Section Scanning System (V1.0, Motic, Xiamen, China).

2.4. SEM Analysis

SEM (SU8100, Hitachi, Tokyo, Japan) was used to characterize the microstructure of the crown tissues and compare it with paraffin-embedded tissue sections. An approximately 3 mm slice was taken from the concentration region of the vascular bundles in the crown (Figure 5e) and was viewed at an acceleration voltage of 3 kV and an emission current of 10.5 μA. The slice was treated by spray-gold prior to observation.

2.5. Cutting Tests

2.5.1. Apparatus Description and Cutting Mechanism

The testing apparatus mainly included an electronic universal material testing machine (WD-E, GRANDTRY, Guangzhou, China), liner-cutter (length of 65 mm, width of 40 mm, thickness of 1.5 mm), fixture, load cell (STC-100 Kg, VISHAY, Tianjin, China), personal computer, and operating software. During the tests, the cutter and load cell were fixed under the movable crossbeam of the electronic universal material testing machine. The cutter and load cell moved downward at a constant speed (200 mm/min) stably, and the cutter was always positioned vertically above the sample (Figure 3a). When the cutter interacted with the sample, the force and displacement data for each cutting position were measured by the corresponding sensors. These data were collected by operating software. The recorded data were plotted as force–displacement curves, which were used to illustrate the behavior of force and displacement at different positions. The peak cutting force and corresponding displacement values in curves were used to observe the relationship between the distribution characteristics of vascular bundles. The energy consumed during the cutting process, i.e., the cutting energy, is the main factor to evaluate the appropriate mechanized cutting region, which can be estimated as the area under the force–displacement curve [30,31].

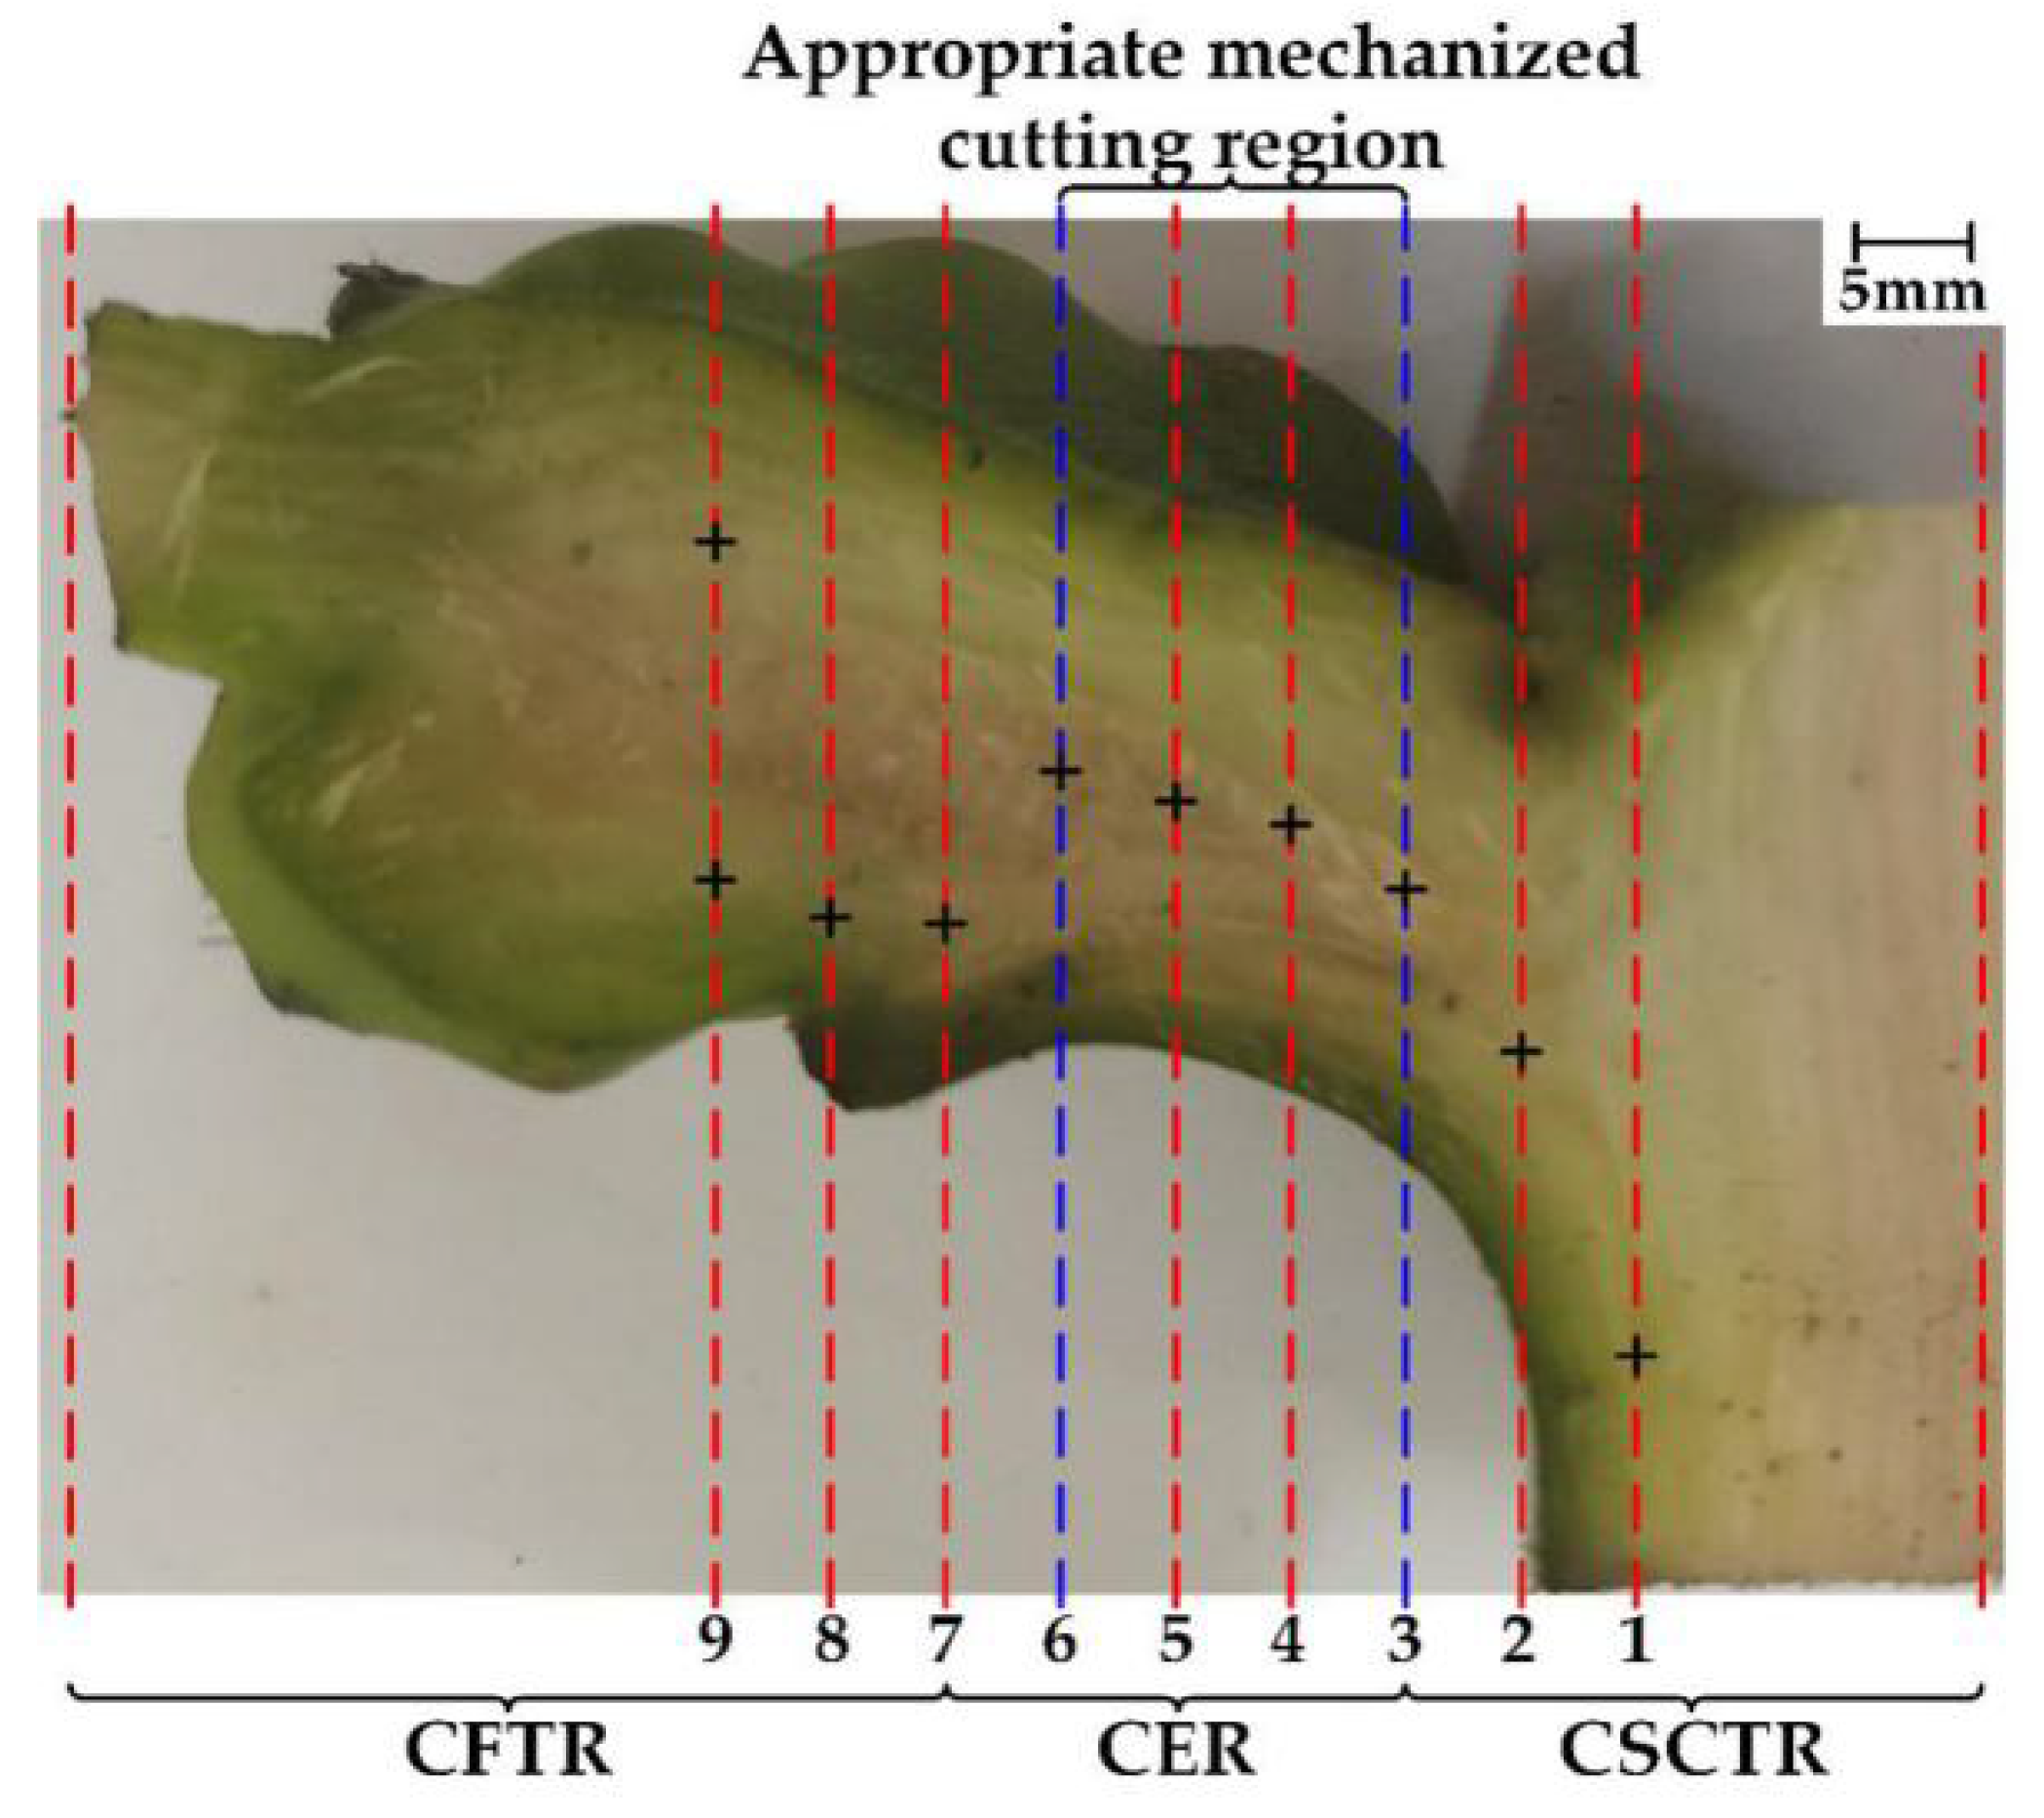
2.5.2. Experiment Design

In order to find the appropriate mechanized cutting region for dehanding, based on the analysis results of 2.1, 2.2, and 2.3, the regions of two adjacent fingers were selected for the cutting tests, and 20 pre-cut samples with similar physical size (70 mm × 25 mm) were prepared for the tests.
The fixture (Figure 3b) holding the pre-cut sample was mounted on a linear slide table. In Figure 3c, the cutting slot W1 (2 mm) represented the cutting position. The pre-cut sample was sequentially cut from each cutting slot by moving the linear slide table along the y-axis. The moving distance, also called cutting distance, was W2 (5 mm). The cutting position started from the junction of the central stalk and the crown; each sample was cut 9 times. The force and displacement at the different cutting positions of each pre-cut sample were measured. Origin 2019b Learning Edition (OriginLab, Northampton, MA, USA) was used to draw the force–displacement curve, the peak cutting force and corresponding displacement values at different cutting positions were obtained. The area under the force–displacement curve was calculated by the integral function in Origin (Figure 3d).

2.6. Data Analysis

The statistical differences of cutting positions and cutting energy were analyzed by one-way analysis of variance (ANOVA) and Duncan’s multiple-range tests with SPSS 23.0 (SPSS Inc., Chicago, IL, USA). In addition, the standard deviations of the means are shown in Table 1 for all measurement results. A significance level of p < 0.05 was used for all analyses.

3. Results and Discussion

3.1. Morphological Characteristics

Longitudinal CT cross-sectional images of two adjacent finger regions of the banana crown were analyzed (Figure 4a). The central stalk vascular bundles were distributed longitudinally along the central stalk at a high density and had tubular morphological characteristics (Figure 4b1–b8). In addition, the vascular bundles flowed from the central stalk into the crown and had a longitudinal distribution along the crown, and this characteristic existed over a small region of the crown (Figure 4c2,c4,c6,c8). However, the vascular bundles in the middle of the crown were mainly distributed transversely and had a mass gathering region (Figure 4c1–c8). The vascular bundles were finally dispersed into each finger after gathering in the crown. Additionally, in the middle of the upper (Figure 4c1,c5) and lower fingers (Figure 4c3,c7), a collection of vascular bundles distributed longitudinally along the finger could be observed. While in the region between the upper and lower fingers, the aggregation of vascular bundles was not apparent.
According to the morphological characteristics of the crown vascular bundles, the changes of vascular bundles from the central stalk to the fingers can be divided into three regions (Figure 4d): the central stalk–crown transition region (CSCTR), where the vascular bundles with low density are distributed longitudinally along the crown, and the vascular bundles of this region can provide the physical support and the nutrient delivery to the banana hands growing spirally around the central stalk [32]; the crown expansion region (CER), where the vascular bundles appear transversely and densely distributed in the crown; and the crown–finger dispersion region (CFTR), in which the vascular bundles are alternately dispersed into each finger and collected in the fingers. CT scanning, as an imaging methodology, also reported the vascular bundles in other plant stalks. Similar morphological characteristics of the crown vascular bundles were found in the maize stalks [33,34] and bamboo [35]. However, the vascular bundle morphological characteristics of the crown illustrated regular changes, which are seldom mentioned in other plants and may be one of the highlights of the present work. A detailed morphology of the vascular bundles in different regions is presented in Video S1, as shown in the Supplementary Materials.

3.2. Anatomical Characteristics

Figure 5 depicts the longitudinal anatomical characteristics of the crown, in which the xylem and vascular bundle sheath were stained red by safranin O while the phloem was stained blue by fast green. The findings from the paraffin-embedded tissue sections were consistent with those of CT scanning. In CSCTR, the vascular bundles distributed longitudinally along the crown were composed of tubular structures (Figure 4c4 and Figure 5a1), which included the xylem, phloem, and vascular bundle sheath, respectively (Figure 5a2,a3). Similar vascular bundle characteristics were reported in the maize stem [36]. Moreover, it can be observed from these pictures that the tubular structures in the vascular bundles are increasingly dispersed towards the crown. It may be necessary to prepare for the following transverse distribution of vascular bundles. In CER, massive vascular bundles were gathered (Figure 4c1–c8 and Figure 5b1) and were surrounded by abundant parenchyma (Figure 5b2 and Figure 6a,c). Meanwhile, the vascular bundles in the middle of CER clearly depicted transverse anatomical characteristics (Figure 5b3 and Figure 6b,d), also indicating the vascular bundles in the region were distributed transversely.
The morphological and anatomical characteristics of vascular bundles in banana crown were interacted revealed by the above three imaging methods. CT scanning enabled a fast, serial, and non-destructive visualization of crown internal tissue morphology, which are not the advantages of paraffin-embedded tissue section and SEM. However, the grayscale images obtained by CT scanning cannot observe the anatomical characteristics of crown tissue. To reduce the number of slices and time consumption, the regions with evident changes of vascular bundle morphology observed by CT scanning were selected for paraffin-embedded section and SEM analysis. Overall, these three complementary imaging methods achieved the foundational understanding of the crown tissue.

3.3. Cutting Mechanic Properties

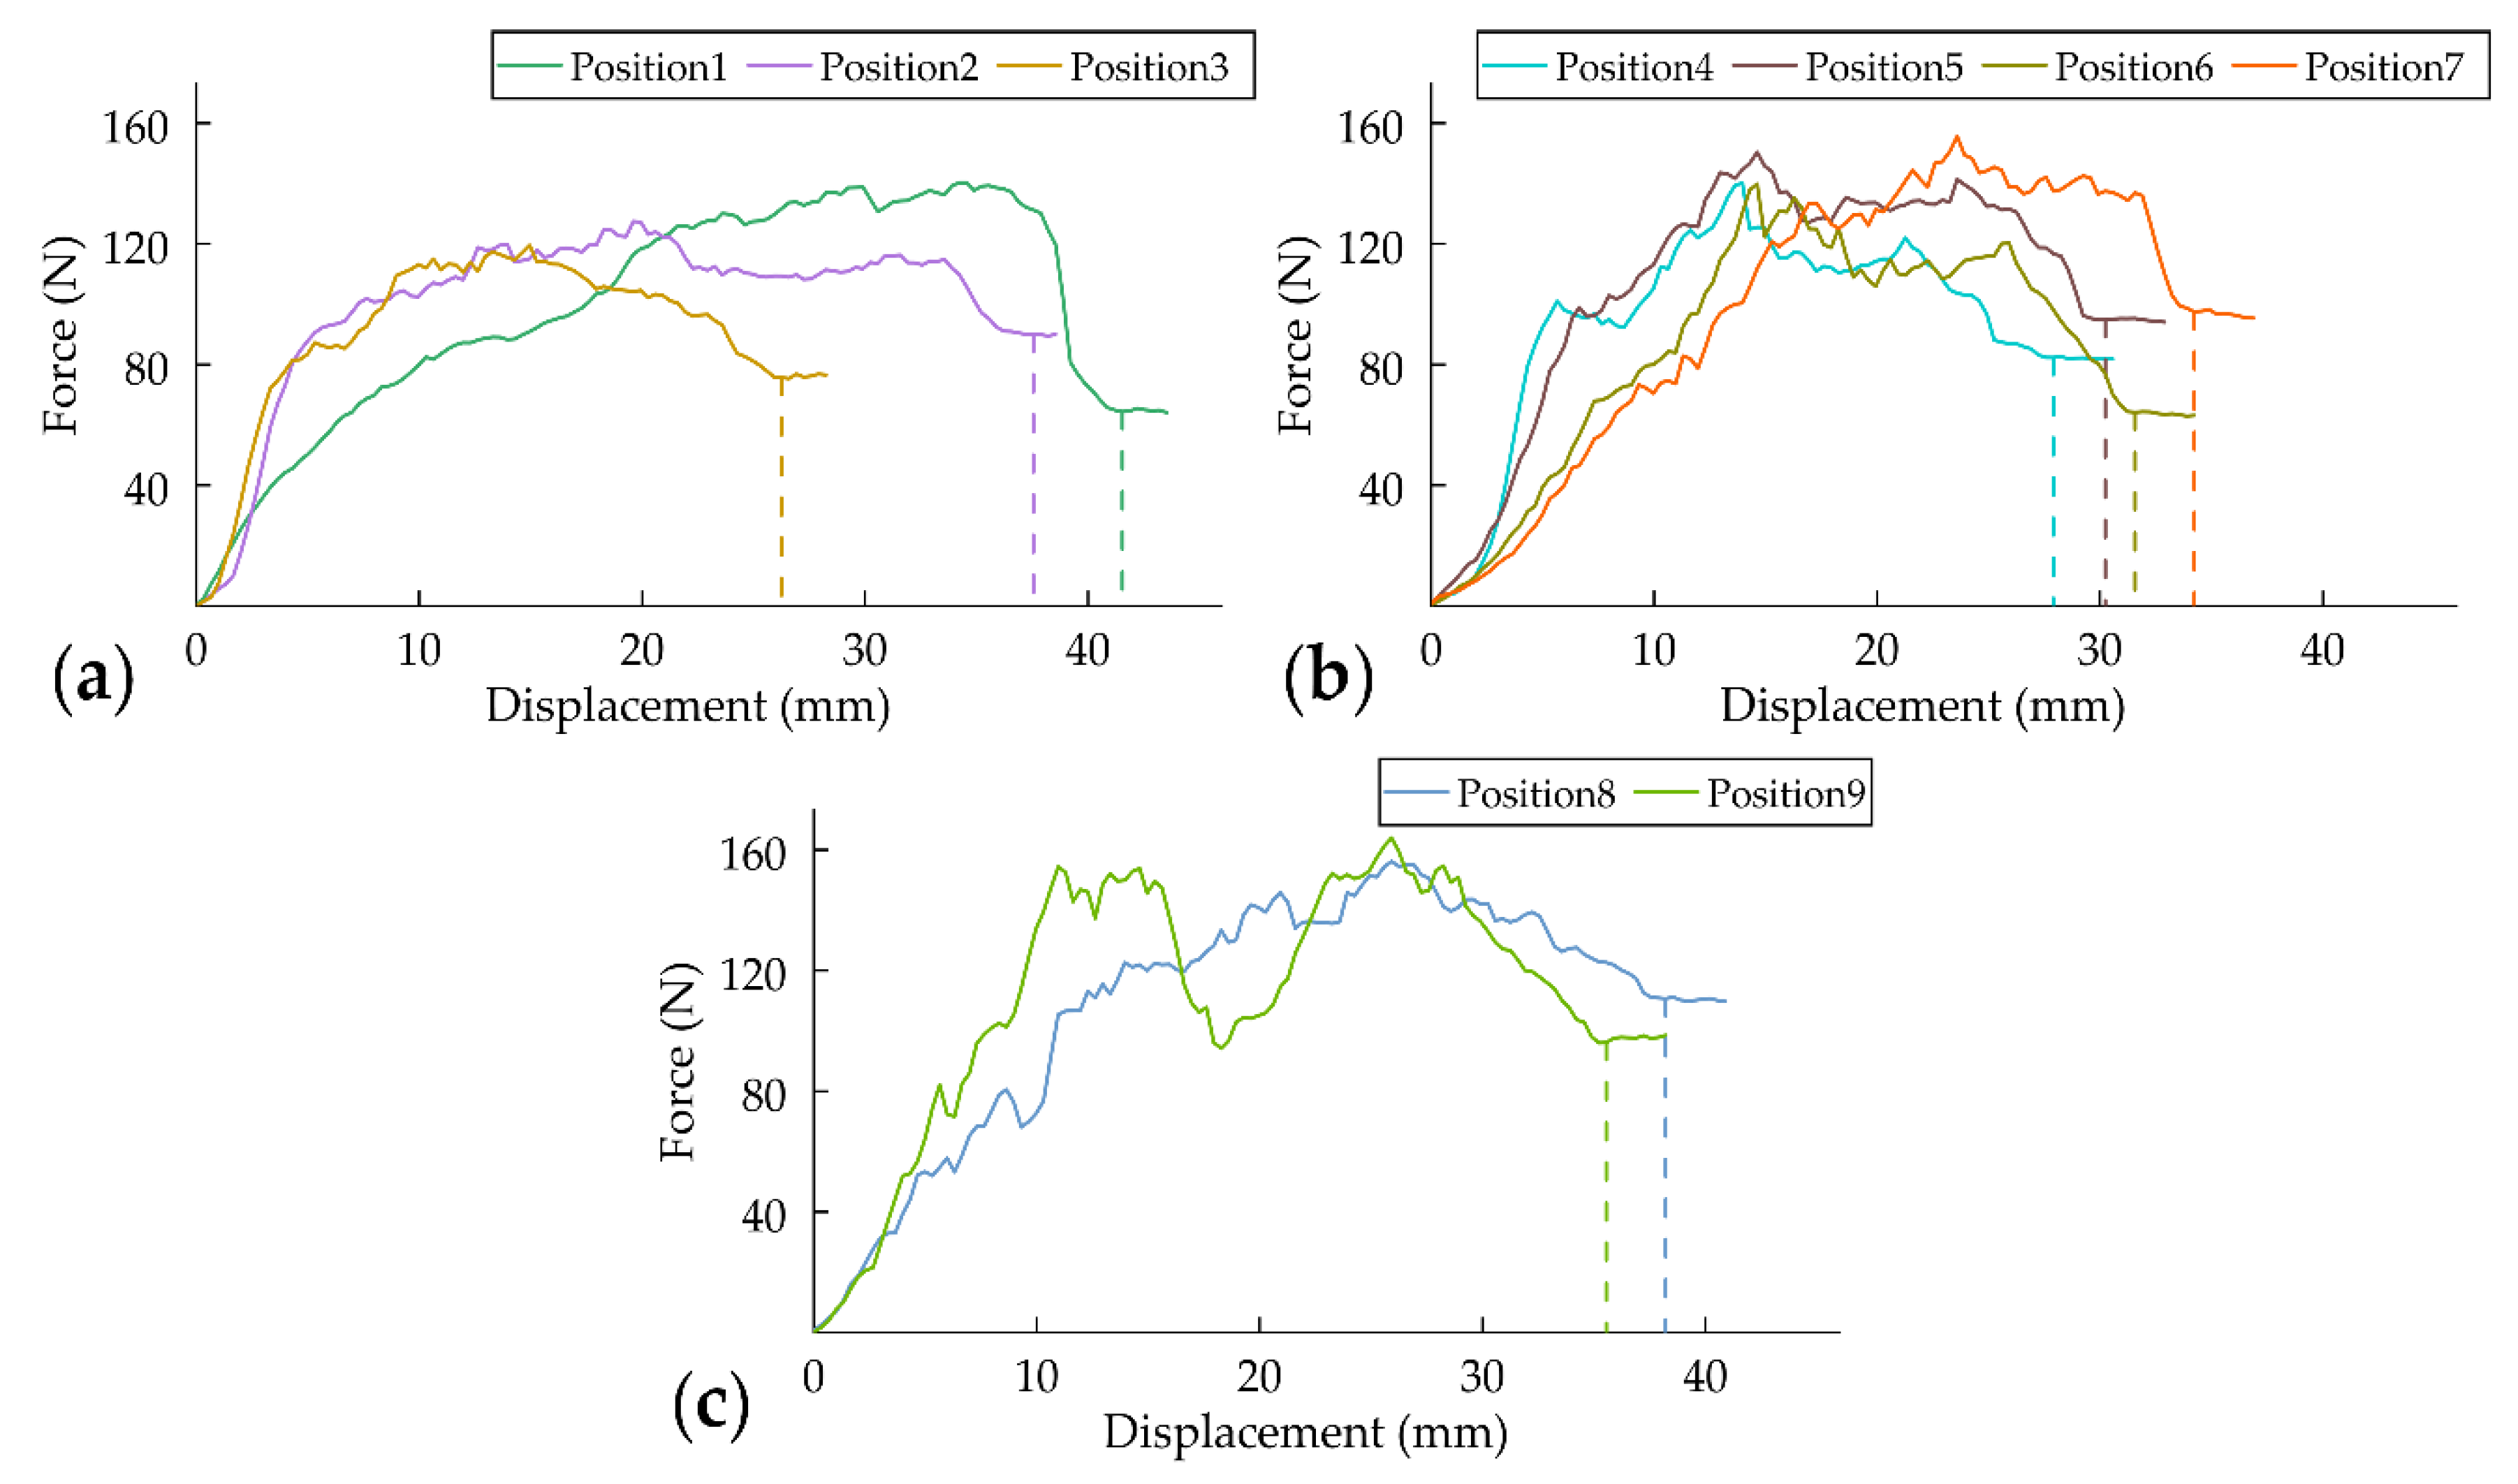
3.3.1. Force–Displacement Curves

The cutting positions and corresponding regions for a single sample are presented in Figure 7, and force–displacement curves at cutting positions are described in Figure 8. It can be seen that the curves of each region are different, and similar conclusions have been reported in other studies [37,38].
The force–displacement curves at cutting positions 1–3 in CSCTR were different (Figure 8a). The cutting distance from position 1 to 3 gradually decreased (41.54, 37.55, and 26.25 mm, respectively), which was caused by the change of thickness at different positions. Furthermore, compared with positions 2 and 3, the contact distance between the cutter and parenchyma was longer at position 1 due to the existence of massive parenchyma, which led to a slow increase in the cutting force. A schematic diagram of cutting vascular bundles at different cutting positions is depicted in Figure 9. The vascular bundles in CSCTR were distributed longitudinally along the crown. The relative angle between the cutter and the vascular bundle (RAVBC) gradually increased (approximately 27.38°, 46.75°, and 60.89°) in CSCTR, which might be the reason that the vascular bundles at positions 1–3 were almost completely cut off (Figure 9a). The peak cutting forces at positions 1, 2, and 3 were, respectively, ascertained to be 140.30, 127.45, and 119.50 N, while the corresponding displacements were 33.23, 33.56, and 29.57 mm. It is notable that the peak cutting forces at positions 1–3 gradually decreased, which may be due to reduction in the vascular bundle density caused by the dispersion of the vascular bundle. By combining Figure 7 and Figure 8, it can be summarized that the peak cutting forces in CSCTR were concentrated at the vascular bundles.
As depicted in Figure 7, cutting positions 4–7 were embedded in CER, where the force–displacement curves at positions 4–6 had similar trends (Figure 8b). The vascular bundles were distributed transversely along with the crown at positions 4–6, and the RAVBC was small. Meanwhile, the observed vascular bundle density at these positions was very large, which led to cutting and compression sections of the vascular bundle during the movement of the cutter, just as found in shear tests of hemp [39] and sunflower stalks [40]. The combined effect of cutting and compression sections resulted in a large number of vascular bundles being damaged at positions 4–6 (Figure 9b), and the cutting force was larger. The peak cutting forces were 140.19, 150.39, and 139.83 N from positions 4 to 6, and the corresponding displacements were concentrated at 13.96, 14.29, and 14.62 mm, which were also located near the vascular bundle concentration region (Figure 7).
The force–displacement curve at position 7 indicates that the vascular bundles began to disperse and were ready to alternately flow into the fingers (Figure 8b), and the RAVBC simultaneously became larger. Moreover, the high density of vascular bundles led to a mass of vascular bundles being completely cut off (Figure 9c), showing a peak cutting force of 155.63 N. Additionally, due to the dispersion of vascular bundles, the displacement value of the peak cutting force increased to 23.59 mm (Figure 7). The force–displacement curve at position 8 in CFTR was similar to position 7 (Figure 8c), which indicated the dispersion process of vascular bundles. The peak cutting force and displacement at position 8 were, respectively, 156.15 N and 25.92 mm. However, increases in the cutting force fluctuation at position 8 were obvious compared with that of position 7, which might be due to the dispersion of the vascular bundles being more intense at this position.
As can also be seen from Figure 7, the curve at position 9 in CFTR was different from all the previous curves, where there were two obvious increase–decrease processes (Figure 8c). The vascular bundles were distributed longitudinally along with the crown and were alternately gathered in the upper and lower fingers. Therefore, the density of the vascular bundle in the upper and lower fingers was higher than that in the area between fingers. In the process of cutting the fingers, the RAVBC was similar to positions 7 and 8, and the number of vascular bundles completely cut off in the upper and lower fingers was more (Figure 9d). The peak cutting forces in the upper and lower fingers were 154.38 and 163.95 N, and the corresponding displacements were 10.97 and 25.92 mm, respectively, which were obviously in the vascular bundle concentration region (Figure 7). However, when cutting the region between the upper and lower fingers, the cutting force was significantly decreased due to the fact that there were fewer vascular bundles.
According to the aforementioned analysis, it can be summarized that when the cutting direction is constant, the mechanical properties of the banana crown notably change during the vascular bundle transition region, which is probably due to changes in the vascular bundle direction and density. The vascular bundle direction affects the RAVBC, which also characterizes the vascular bundle that can be cut off in a region, and the density determines the number of vascular bundles that can be cut off in the region. In addition, the peak cutting force always exists in the vascular bundle concentrated area.

3.3.2. Cutting Energy

The area between the solid and dotted lines in Figure 8 was used to calculate the cutting energy at the corresponding cutting position. The values of the cutter displacement and cutting energy are tabulated in Table 1. According to the results of Duncan’s multiple-range tests, it can be concluded that the cutting energies in different regions were significantly different (p < 0.05). In addition, the cutting energy of CER was significantly less than that of the other two regions. Due to the fact that the vascular bundle distribution characteristics of positions 4–6 were relatively stable, the cutting forces and cutter displacements changed little, which ensures that the cutting energy was stable at these positions. Therefore, CER is considered as the optimized mechanized cutting region. Interestingly, the cutting energy at position 3 was very small, owing to the small crown thickness as well as the short displacement of the cutter. From the perspective of reducing energy, position 3 could also be used as the mechanized cutting region. However, the equation representing relationship between the cutting energy and corresponding displacement is illustrated in Figure 10. It is worth noting that the non-perfect R2 (0.73) is not only due to the variation of crown thickness, but also the distribution characteristics of vascular bundles at different positions of the crown (e.g., the density and the vascular bundles gathering area) should be considered. Overall, the appropriate mechanized cutting region should be located between CSCTR and CER.

4. Conclusions

The main conclusions depending on the results of this study are detailed below.
  • Based on the analysis of the morphological and anatomical characteristics, the banana crown vascular bundles are divided into three regions including: (1) CSCTR, the vascular bundles where the central stalk flows into the crown have a low density and are distributed longitudinally along the crown with a tubular structure; (2) CER, the vascular bundles in the region are distributed transversely at a high density, and the basic structure of the vascular bundle includes the xylem, phloem, and vascular bundle sheath; and (3) CFTR, in which the crown vascular bundles are dispersed in each finger and followed by collection in the fingers.
  • The cutting mechanical properties are significantly affected by the vascular bundle direction and density. In CSCTR, the cutting mechanical properties are unstable during the transition from central stalk to crown, and the cutting energy decreased from 4.3 to 2.57 J. For vascular bundles distributed transversely along with the crown in CER, the cutting mechanical properties remain stable, and the cutting energy varies from 2.83 to 2.92 J. The largest cutting energy (4.84 J) among the whole crown is found to be in the CFTR.
  • The appropriate mechanized cutting region for dehanding is ascertained to be between CSCTR and CER, which can help to reduce the energy needed in the cutting process.
Overall, it is feasible to analyze the morphological and anatomical characteristics of the banana crown with multiple imaging methods (CT, Paraffin-embedded tissue section, SEM) and use the results to explain the cutting mechanical behaviors. The main conclusions provide a theoretical basis for designing subsequent cutting machines, and the adopted combined methodology of plant morphology, anatomy, and engineering can provide guidance when fusing agronomy and agricultural machinery. Moreover, further study is recommended to quantitatively analyze the density and direction of the vascular bundles in the crown in order to clarify the effect of the interaction between these two characteristics on the cutting mechanical properties and establish a spatial model of the crown vascular bundles.

Supplementary Materials

The following are available online at https://www.mdpi.com/2073-4395/10/8/1199/s1, Video S1: The detailed morphology of vascular bundles of banana crown different regions are obtained by CT scanning.

Author Contributions

Conceptualization, L.Z. and H.X.; methodology, L.Z. and H.Y.; validation, Z.X.; formal analysis, L.Z., H.Y. and J.G.; investigation, H.F. and T.J.; data curation, M.J.; writing—original draft preparation, L.Z.; writing—review and editing, H.Y., H.X. and Z.Y.; supervision, J.D. and Z.Y.; project administration, J.D.; funding acquisition, Z.Y. All authors have read and agreed to the published version of the manuscript.

Funding

This research was funded by National Natural Science Foundation of China, grant number 51675189 and Agriculture Research System of China, grant number CARS-31.

Acknowledgments

Authors wish to thank Bin Li, Lanhui Fu, and Yan Xu for their help in writing.

Conflicts of Interest

The authors declare no conflict of interest.

References

  1. De Souza, A.V.; Bonini Neto, A.; Cabrera Piazentin, J.; Dainese Junior, B.J.; Perin Gomes, E.; dos Santos Batista Bonini, C.; Ferrari Putti, F. Artificial neural network modelling in the prediction of bananas’ harvest. Sci. Hortic. 2019, 257, 108724. [Google Scholar] [CrossRef]
  2. FAOSTAT. Food and Agriculture Organization of the United Nations. Available online: http://www.fao.org/faostat/en/#data/QC (accessed on 30 October 2019).
  3. Lassois, L.; Jijakli, M.H.; Chillet, M.; de Lapeyre de Bellaire, L. Crown Rot of Bananas: Preharvest Factors Involved in Postharvest Disease Development and Integrated Control Methods. Plant Dis. 2010, 94, 648–658. [Google Scholar] [CrossRef] [PubMed] [Green Version]
  4. Robert, E.P.; Odilo, D. Tropical Fruits, 2nd ed.; CABI: Oxfordshire, UK, 2011; Volume 1, pp. 214–216. [Google Scholar]
  5. Shah, D.U.; Reynolds, T.P.S.; Ramage, M.H. The strength of plants: Theory and experimental methods to measure the mechanical properties of stems. J. Exp. Bot. 2017, 68, 4497–4516. [Google Scholar] [CrossRef] [PubMed] [Green Version]
  6. Gibson, L.J. Biomechanics of cellular solids. J. Biomech. 2005, 38, 377–399. [Google Scholar] [CrossRef]
  7. Gibson, L.J. The hierarchical structure and mechanics of plant materials. J. R. Soc. Interface 2012, 9, 2749–2766. [Google Scholar] [CrossRef]
  8. Robertson, D.; Smith, S.; Gardunia, B.; Cook, D. An Improved Method for Accurate Phenotyping of Corn Stalk Strength. Crop Sci. 2014, 54, 2038–2044. [Google Scholar] [CrossRef] [Green Version]
  9. Gomez, F.E.; Muliana, A.H.; Niklas, K.J.; Rooney, W.L. Identifying Morphological and Mechanical Traits Associated with Stem Lodging in Bioenergy Sorghum (Sorghum bicolor). Bioenergy Res. 2017, 10, 635–647. [Google Scholar] [CrossRef]
  10. Shahbazi, F.; Galedar, M.N. Bending and Shearing Properties of Safflower Stalk. J. Agric. Sci. Technol. 2012, 14, 743–754. [Google Scholar]
  11. Seflek, A.Y. Determining the Physico-Mechanical Characteristics of Maize Stalks Fordesigning Harvester. J. Anim. Plant Sci. 2017, 27, 855–860. [Google Scholar]
  12. Leblicq, T.; Vanmaercke, S.; Ramon, H.; Saeys, W. Mechanical analysis of the bending behaviour of plant stems. Biosyst. Eng. 2015, 129, 87–99. [Google Scholar] [CrossRef]
  13. Leblicq, T.; Smeets, B.; Vanmaercke, S.; Ramon, H.; Saeys, W. A discrete element approach for modelling bendable crop stems. Comput. Electron. Agric. 2016, 124, 141–149. [Google Scholar] [CrossRef]
  14. Xu, Z.Y.; Yang, Z.; Zhu, Z.B. Parameter optimization of banana crown-cutting machine using combined cutters. Curr. Sci. 2019, 117, 492–497. [Google Scholar] [CrossRef]
  15. Xu, Z.Y.; Yang, Z.; Duan, J.L.; Jin, M.H.; Mo, J.S.; Zhao, L.; Guo, J.; Yao, H.L. Design and Experiment of Symmetrical Shape Deployable Arc Profiling Mechanism Based on Composite Multi-Cam Structure. Symmetry 2019, 11, 958. [Google Scholar] [CrossRef] [Green Version]
  16. Hesse, L.; Bunk, K.; Leupold, J.; Speck, T.; Masselter, T. Structural and functional imaging of large and opaque plant specimens. J. Exp. Bot. 2019, 70, 3659–3678. [Google Scholar] [CrossRef] [PubMed]
  17. Fiorani, F.; Schurr, U. Future Scenarios for Plant Phenotyping. In Annual Review of Plant Biology; Merchant, S.S., Ed.; Annual Reviews: Palo Alto, CA, USA, 2013; Volume 64, pp. 267–291. [Google Scholar]
  18. Brodersen, C.R.; Roddy, A.B. New frontiers in the three-dimensional visualization of plant structure and function. Am. J. Bot. 2016, 103, 184–188. [Google Scholar] [CrossRef] [PubMed] [Green Version]
  19. Wasaya, A.; Zhang, X.Y.; Fang, Q.; Yan, Z.Z. Root Phenotyping for Drought Tolerance: A Review. Agronomy 2018, 8, 241. [Google Scholar] [CrossRef] [Green Version]
  20. Xu, Z.; Valdes, C.; Clarke, J. Existing and Potential Statistical and Computational Approaches for the Analysis of 3D CT Images of Plant Roots. Agronomy 2018, 8, 71. [Google Scholar] [CrossRef] [Green Version]
  21. Paya, A.M.; Silverberg, J.L.; Padgett, J.; Bauerle, T.L. X-ray computed tomography uncovers root-root interactions: Quantifying spatial relationships between interacting root systems in three dimensions. Front. Plant Sci. 2015, 6, 274. [Google Scholar] [CrossRef]
  22. Bauerle, T.L.; Centinari, M. Assessment of Root System Development among Four Ornamental Tree Species through Time via X-ray Computed Tomography. HortScience 2014, 49, 44–50. [Google Scholar] [CrossRef] [Green Version]
  23. Hsu, H.C.; Wang, C.N.; Liang, C.H.; Wang, C.C.; Kuo, Y.F. Association between Petal Form Variation and CYC2-like Genotype in a Hybrid Line of Sinningia speciosa. Front. Plant Sci. 2017, 8, 558. [Google Scholar] [CrossRef] [Green Version]
  24. Van der Niet, T.; Zollikofer, C.P.; Leon, M.S.; Johnson, S.D.; Linder, H.P. Three-dimensional geometric morphometrics for studying floral shape variation. Trends Plant Sci. 2010, 15, 423–426. [Google Scholar] [CrossRef] [PubMed] [Green Version]
  25. Donis-Gonzalez, I.R.; Guyer, D.E.; Fulbright, D.W.; Pease, A. Postharvest noninvasive assessment of fresh chestnut (Castanea spp.) internal decay using computer tomography images. Postharvest Biol. Technol. 2014, 94, 14–25. [Google Scholar] [CrossRef]
  26. Herremans, E.; Verboven, P.; Verlinden, B.E.; Cantre, D.; Abera, M.; Wevers, M.; Nicolai, B.M. Automatic analysis of the 3-D microstructure of fruit parenchyma tissue using X-ray micro-CT explains differences in aeration. BMC Plant Biol. 2015, 15, 264. [Google Scholar] [CrossRef] [PubMed] [Green Version]
  27. Herremans, E.; Verboven, P.; Defraeye, T.; Rogge, S.; Ho, Q.T.; Hertog, M.L.A.T.M.; Verlinden, B.E.; Bongaers, E.; Wevers, M.; Nicolai, B.M. X-ray CT for quantitative food microstructure engineering: The apple case. Nucl. Instrum. Methods Phys. Res. Sect. B-Beam Interact. Mater. Atoms 2014, 324, 88–94. [Google Scholar] [CrossRef]
  28. Perez-Torres, E.; Kirchgessner, N.; Pfeifer, J.; Walter, A. Assessing potato tuber diel growth by means of X-ray computed tomography. Plant Cell Environ. 2015, 38, 2318–2326. [Google Scholar] [CrossRef] [PubMed]
  29. Sumardi, I.; Wulandari, M. Anatomy and morphology character of five Indonesian banana cultivars (Musa spp.) of different ploidy level. Biodiversitas J. Biol. Divers. 2010, 11, 167–175. [Google Scholar] [CrossRef]
  30. Boydas, M.G.; Comakli, M.; Sayinci, B.; Kara, M. Effects of moisture content, internode region, and oblique angle on the mechanical properties of sainfoin stem. Turk. J. Agric. For. 2019, 43, 254–263. [Google Scholar] [CrossRef] [Green Version]
  31. Galedar, M.N.; Tabatabaeefar, A.; Jafari, A.; Sharifi, A.; Rafiee, S. Bending and Shearing Characteristics of Alfalfa Stems. Agric. Eng. Int. CIGR Ejournal 2008, X, FP 08 001. [Google Scholar]
  32. Robinson, J.C.; Saúco, V.G. Bananas and Plantains, 2nd ed.; CABI: Oxfordshire, UK, 2010; pp. 248–253. [Google Scholar]
  33. Zhang, Y.; Du, J.; Wang, J.; Ma, L.; Lu, X.; Pan, X.; Guo, X.; Zhao, C. High-throughput micro-phenotyping measurements applied to assess stalk lodging in maize (Zea mays L.). Biol. Res. 2018, 51, 40. [Google Scholar] [CrossRef]
  34. Du, J.J.; Zhang, Y.; Guo, X.Y.; Ma, L.M.; Shao, M.; Pan, X.D.; Zhao, C.J. Micron-scale phenotyping quantification and three-dimensional microstructure reconstruction of vascular bundles within maize stalks based on micro-CT scanning. Funct. Plant Biol. 2017, 44, 10–22. [Google Scholar] [CrossRef]
  35. Huang, P.X.; Chang, W.S.; Ansell, M.P.; Chew, Y.M.J.; Shea, A. Density distribution profile for internodes and nodes of Phyllostachys edulis (Moso bamboo) by computer tomography scanning. Constr. Build. Mater. 2015, 93, 197–204. [Google Scholar] [CrossRef]
  36. Venard, C.; Vaillancourt, L. Colonization of Fiber Cells by Colletotrichum graminicola in Wounded Maize Stalks. Phytopathology 2007, 97, 438–447. [Google Scholar] [CrossRef] [PubMed] [Green Version]
  37. Aydin, I.; Arslan, S. Mechanical properties of cotton shoots for topping. Ind. Crop. Prod. 2018, 112, 396–401. [Google Scholar] [CrossRef]
  38. Ozbek, O.; Seflek, A.Y.; Carman, K. Some Mechanical Properties of Safflower Stalk. Appl. Eng. Agric. 2009, 25, 619–625. [Google Scholar] [CrossRef]
  39. Chen, Y.; Gratton, J.L.; Liu, J. Power requirements of hemp cutting and conditioning. Biosyst. Eng. 2004, 87, 417–424. [Google Scholar] [CrossRef]
  40. İnce, A.; Uğurluay, S.; Güzel, E.; Özcan, M.T. Bending and Shearing Characteristics of Sunflower Stalk Residue. Biosyst. Eng. 2005, 92, 175–181. [Google Scholar] [CrossRef]
Figure 1. Banana crown preparation processes. (a) Banana bunch; (b) banana hand; (c) banana crown. Red lines are used to mark where the knife cut in Figure 1a,b.
Agronomy 10 01199 g001
Figure 2. Sample and X-ray Computed Tomography (CT) scanning images of banana crown. (a) Side view of the crown; (b) front view of the crown; (c) top view of the crown; (a1) side view CT scan; (b1) front view CT scan; (c1) top view CT scan. PB = Plastic box.
Agronomy 10 01199 g002
Figure 3. The cutting platform. (a) Includes ① the linear slide stable, ② the fixture, ③ liner-cutter, ④ load cell. (b) Is the fixture, (c) is an enlarged image of the cutting slot in (b), where the liner-cutter moves downward from W1 (2 mm) at a constant speed V (200 mm/min) with each cut, and W2 (5 mm) represents the distance between the adjacent cutting positions. (d) Is an example of calculating the cutting energy, and the shaded portion represents the cutting energy.
Agronomy 10 01199 g003
Figure 4. CT cross-sectional images of the crown. (a) Top view of the crown. The red lines b1–b8 on the crown indicate the selected observation regions; (b1b8) are CT images of the entire selected regions; (c1c8) are enlarged images of the crown region of (b1b8); (d) shows the three regions (CSCTR, CER, CFTR). VB = Vascular bundle. Resolution = 25.3 μm.
Agronomy 10 01199 g004
Figure 5. Longitudinal tissue sections of the crown. (a1) Is the original paraffin-embedded tissue section image obtained at 20X magnification; (a2) and (a3) are the enlarged images of (a1), respectively; (b1) is the original paraffin-embedded tissue section image obtained at 20X magnification; (b2) and (b3) are the enlarged images of (b1), respectively. PA = Parenchyma, PH = Phloem, VB = Vascular bundle, VBS = Vascular bundle sheath, XY = Xylem.
Agronomy 10 01199 g005
Figure 6. Crown slice longitudinal SEM images. (a) Is the image of the overall morphology of the slice; (b) and (c) are enlarged views of (a); (d) is obtained from the rectangular area of (b). PA = Parenchyma, PH = Phloem, VB = Vascular bundle, VBS = Vascular bundle sheath, XY = Xylem.
Agronomy 10 01199 g006
Figure 7. The regions of two adjacent fingers for cutting tests. The lines and the numbers above the figure mean the cutting position and the corresponding number, respectively. The symbol “+” indicates the displacement corresponding to the peak cutting force when the sample is cut.
Agronomy 10 01199 g007
Figure 8. The force–displacement curves at different cutting positions. (a) Draws the cutting positions 1–3 in the central stalk–crown transition region (CSCTR), respectively; (b) represents the cutting positions 4–7 in the crown expansion region (CER); (c) is the cutting positions 8 and 9 in crown–finger transition region (CFTR).
Agronomy 10 01199 g008
Figure 9. Schematic diagram of cutting vascular bundles at different positions. The vascular bundle is represented by a tubular structure in the figure, and the cutter is located above the vascular bundle. (a) Represents positions 1–3 in CSCTR, respectively; (b) are positions 4–6 in CER, respectively; (c) includes position 7 in CER and position 8 in CFTR; (d) illustrates position 9 in CFTR. In (b), it is difficult to mark “RAVBC” due to the extremely small relative angles. RAVBC = Relative angle between the vascular bundle and cutter.
Agronomy 10 01199 g009
Figure 10. The effect of cutter displacement at different positions on cutting energy.
Agronomy 10 01199 g010
Table 1. The values of cutting energy and corresponding cutting position.
Crown RegionCutting PositionCutter Displacement (mm)Cutting Energy (J)
CSCTR141.96 ± 1.764.30 ± 0.23 c
237.81 ± 1.923.66 ± 0.16 d
326.18 ± 1.062.57± 0.17 g
CER427.98 ± 1.722.85 ± 0.20 f
530.40 ± 1.152.92 ± 0.14 f
631.69 ± 1.562.83 ± 0.13 f
734.43 ± 2.203.37 ± 0.29 e
CFTR838.49 ± 2.094.84 ± 0.46 a
935.77 ± 1.244.48 ± 0.41 b
Different letters within the same column indicate a significant difference in Duncan’s multiple-range tests (p < 0.05). The data are expressed as standard deviation of the mean (N = 20).

