Article

How Film Mulch Increases the Corn Yield by Improving the Soil Moisture and Temperature in the Early Growing Period in a Cool, Semi-Arid Area

1
State Key Laboratory of Grassland Agro-ecosystems, Institute of Arid Agroecology, School of Life Sciences, Lanzhou University, Lanzhou 730000, China
2
The Institute of Agriculture, The University of Western Australia, Perth, WA 6001, Australia
3
International Centre for Advanced Mediterranean Agronomic Studies (CIHEAM) Mediterranean Agronomic Institute of Bari, Via Ceglie 9, 70010 Valenzano, Bari, Italy
*
Author to whom correspondence should be addressed.
Agronomy 2020, 10(8), 1195; https://doi.org/10.3390/agronomy10081195
Submission received: 14 July 2020 / Revised: 12 August 2020 / Accepted: 12 August 2020 / Published: 14 August 2020

Abstract

:
Film mulch increases the crop grain yield via topsoil moisture and temperature improvement in cool, semi-arid areas, but little is known about the role of the hydrological and thermic relationship between early and later crop growth seasons in the improving grain yield. We conducted a field experiment to compare polyethylene film mulching (PM) with no mulching (CK) in 2014 and 2015 on the semi-arid Loess Plateau of China. Compared to CK, PM decreased evapotranspiration before the twelve-leaf stage (V12), but increased evapotranspiration after the V12 stage, and significantly increased the topsoil temperature before the six-leaf stage (V6) and the accumulation of soil growing degree days. Corn plants with PM treatment reached the V6 stage earlier, significantly enhancing the contemporary dry matter accumulation. The harvest index, 100-grain weight, and grain yield significantly increased in PM relative to CK in both years. The growing period to the whole growing season evapotranspiration ratio had a negative correlation with the grain yield before the V12 stage, but a positive correlation after the V12 stage. The grain yield had a negative correlation with the air growing degree days (GDDair) before the V6 stage, but positive correlation from silking to harvest. Conclusively, film mulch promoted the early development of maize via an increased soil temperature before the V6 stage, saved soil water before the V12 stage, resulted in a longer grain-filling period, and increased the GDDair and evapotranspiration during the grain-filling period, which is key to increasing the maize yield.

1. Introduction

Drought and low temperatures usually restrict crop growth, resulting in poor yields in cool, semi-arid areas [1,2]. The Loess Plateau of northwest China is a typical cool, semi-arid region. Corn (Zea mays L.), as a high-yield-potential crop and one of the dominant crops in the region, is particularly useful for promoting economic growth and ensuring food security in the region. Corn is a thermophilic and water-intensive crop. Usually, drought and cool temperatures restrict its early growth, resulting in poor yields in cool, semi-arid areas [3,4]. Mulching with plastic film is widely used in these areas to increase the corn grain yield by increasing both the soil moisture and temperature [2,3,4,5]. As a result, maize is now the dominant grain crop in the region. Plastic film mulching is a practice involving covering the soil surface with plastic film, such that rainwater intercepted by the plastic film penetrates the soil through seeding holes, the water and heat exchange between the soil and air decreases [2,6,7], and soil water evaporation declines due to the blocking effect of the film mulch [8].
How film mulch affects the soil moisture content [8,9,10], grain yield, and water-use efficiency [2,11,12] in corn production is well-documented. The increase in soil moisture by film mulch supports crop growth and development throughout the growing season [8,9,10,12]. Many studies have shown that increased water consumption after flowering is conducive to increasing crop yields [13,14,15]. In semi-arid areas, precipitation is limited during the cropping season. The increase in crop water consumption during the early stages affects the water condition at later stages, which can lead to water shortages during the reproductive stage, and thus affect the yield [15,16,17]. However, most studies on film mulch have focused on changes in water storage and water consumption during the whole growing season, and very little work has concentrated on the distribution of water consumption at different growth stages.
Usually, air temperature and soil moisture conditions in the Loess Plateau do not favor corn growth, because cool temperatures and low soil moisture after sowing can restrict crop emergence and growth, resulting in poor plant establishment [1,3,18]. Delayed crop development makes the crop vulnerable to frost in the grain-filling stage, leading to poor maturity and low yields [2,5]. The temperature increase in the early growth period will accelerate plant development and advance crop phenology and affect heat accumulation during the grain-filling period [11,19,20]. However, the resource capture and utilization and dry matter transfer during the grain filling stage are directly related to the grain yield of corn [11,21,22,23]. Greater heat accumulation during the grain-filling period results in a higher grain yield. However, few, if any, studies have examined how plastic film mulch affects the grain-filling length and the distribution of accumulation temperature. It is essential to understand the process by which plastic film mulching boosts the grain yield by increasing the soil temperature during early corn growth.
Therefore, the objectives of this study were to (1) study the effect of film mulch on the water consumption pattern of corn between the early and later growing season related to the grain yield, and (2) investigate how the increase of soil temperature in the early growth period affects heat accumulation and the grain-filling period under plastic film mulch. The results will help us to understand how plastic film mulching overcomes the adverse effects of drought and low temperatures in cool, semi-arid regions to increase corn productivity.

2. Materials and Methods

2.1. Site Description

The experiment was conducted in 2014 and 2015 on the Loess Plateau at Gansu Provincial Dryland Agroecology Research Station affiliated with Lanzhou University. The site is located at Zhonglianchuan village (36°02′ N, 104°25′ E, 2400 m above sea level) in Yuzhong country in Gansu Province of north-western China. The climate is medium temperate and semi-arid, with a mean annual air temperature of 6.5 °C. The mean monthly maximum of 19.0 °C occurs in July and the minimum of −8.0 °C occurs in January. The average wind speed (measured at the closest national metrological station of Yuzhong) for the past 30 years is 1.9 m s−1 [24]. The mean annual precipitation from 2002 to 2015 was 319.6 mm, of which about 60% was received between June and September, and the average annual free water evaporation is about 1300 mm. Groundwater is not a viable source of irrigation, with crops grown entirely under rainfed conditions. The soil is locally classified as Heima soil (Calcic Kastanozem (Siltic)) with a 0.229 g g−1 field water-holding capacity, 0.047 g g−1 permanent wilting coefficient, pH of 7.8, 14.9% sand, 62.6% silt, 22.6% clay, 10.11 g kg−1 organic carbon content, 0.71 g kg−1 total nitrogen, and 0.77 g kg−1 total phosphorus.
The mean air temperature over the growing season was 12.5 °C in 2014 and 13.3 °C in 2015, but varied each month, being significantly lower in May (10.9 °C in 2014 and 11.0 °C in 2015) than in July (16.2 °C in 2014 and 16.9 °C in 2015). The daily minimum and mean air temperatures in the first three weeks following sowing were 3.3 and 9.1 °C in 2014, and 4.9 and 10.9 °C in 2015, which are generally too low for corn emergence and seedling growth (Figure 1a,b). Frost and snow events occasionally occur during emergence and seedling growth. The daily minimum and mean air temperatures at the end of the growing season (October) were 4.9 and 8.7 °C in 2014, and 2.0 and 8.9 °C in 2015. The daily mean air temperature at the end of the growing season was below the suitable daily mean air temperature of 22–24 °C [25], so was not favorable for corn grain-filling and maturity. The 2014 growing season had 326.3 mm precipitation (or 77.5% of the 420.9 mm annual rainfall), while 2015 had 237.0 mm, or 79.9% of the 296.6 mm annual rainfall (Figure 1a,b).

2.2. Experimental Design and Field Management

The experiment comprised two treatments: (1) Mulching with plastic film (PM) with the film replaced each year, and (2) check (CK) without mulching (Figure S1). Each treatment was replicated three times, and each replicate plot was 40 m2 (8.0 m × 5.0 m). The experimental plot was located on flat farmland with zero slope. The experimental plots were set up in 2013, and the experiment began in spring, 2014. The plastic film used was collected manually or by machinery and recycled by specialized factories. Basal fertilizer was applied after removing the plastic film before the soil was ploughed and raked. The base fertilizer dose comprised 150 kg ha−1 of N in urea (46% N) and 25 kg ha−1 P in calcium superphosphate (16% P2O5). The PM plots were completely mulched with 0.008 mm thick transparent polyethylene film after cropland preparation. Two weeks after mulching (29 April 2014 and 27 April 2015), corn seeds (Cultivar Kenyu 10) were sown 40 cm apart in rows 60 cm apart. Two seeds were placed 6 cm deep in a hole using a mechanical dibbler (Yongfeng Agricultural and Forestry Tools Co., Ltd., Zhengzhou, China). Two weeks after sowing, when the emerging seedlings touched the film, the holes were expanded to release the seedlings and then covered with soil. Seedlings were thinned to one per hole about 30 days after sowing. All plots were hand weeded after 40 days of sowing. Corn growth was terminated on 14 October 2014 and 15 October 2015 due to the rapidly falling air temperatures. As a result, the plots were harvested on 28 October 2014 (slight delay due to rain) and 15 October 2015.

2.3. Methods and Measurements

A standardized system describing the developmental stages of corn was used to identify each stage of growth [26]: VE, seedling emergence; V4, four-leaf stage; V6, six-leaf stage; V12, twelve-leaf stage; R1, silking stage; and harvest (corn growth terminated). Three corn plants were randomly selected from the sampling zone of each plot at V4, V6, V12, R1, and harvest to record the plant height and stem diameter before sampling. The selected plants were cut off at ground level and oven-dried at 105 °C for 30 min to a constant weight at 72 °C. At harvest, two rows of corn in the middle of each plot were harvested by hand to determine the 100-grain weight, harvest index, biomass yield, and grain yield after drying to a constant weight at 72 °C. The grain yield and biomass yield were expressed as the dry weight.
The soil moisture content was determined at the sowing time (ST), V4, V6, V12, R1, and harvest at 20 cm intervals to a depth of 200 cm using a soil auger (diameter of 8 cm and height of 20 cm, Institute of Soil and Water Conservation, CAS&MWR, Yang Ling, China) in the middle of each plot between two plants within a row. Soil samples were oven-dried at 105 °C to a constant weight to calculate the gravimetric water content. In 2014, we only sampled at the V6 stage, but in 2015, we increased the sampling frequency to include V4. However, at the V6 stage in 2015 (10 Jun for PM, and 3 Jul for CK), soil moisture sampling did not occur due to rainfall.
Evapotranspiration (ET, mm) was calculated using the following equation:
ET = P + ΔW,
where P and ΔW are the precipitation (mm) and the change (mm) in the 0–200 cm layer of soil in which moisture was stored (mm) between the beginning and end of a stage.
The water-use efficiency (WUE, kg ha−1 mm−1) was calculated as follows:
WUE = Y/(Ptotal + ΔWtotal),
where Y is the grain yield (kg ha−1), Ptotal is the total precipitation (mm) over the growing season, and ΔWtotal is the change in soil moisture (mm) in the 0–200 cm soil layer between sowing and harvest.
Weather data were obtained from the weather station at the experimental site. The soil temperature was measured every two hours during the growing season using a temperature logger; sensors were placed midway between two plants within a row in each plot at a depth of 15 cm. A method for assessing the effect of temperature on crop growth in quantitative terms is to determine the growing degree days (GDD) [26,27]), which is an index of heat that measures the cumulative effect of temperature on crop development as it progresses from one growth stage to the next. We calculated both the soil growing degree days (°C d, GDDsoil) and air growing degree (°C d, GDDair) using the following equation [28]:
GDD = ∑ ((Tmax + Tmin)/2 − Tbase),
where Tmax and Tmin are the maximum and minimum daily temperatures, and Tbase is the base temperature for corn growth (10 °C). When Tmax was >30 °C, it was set to 30 °C; likewise, when Tmin was <10 °C, it was set to 10 °C [26,28]. The thermal-use efficiency of GDDair (TUEair) and GDDsoil (TUEsoil) was calculated as the grain yield (kg ha−1) divided by GDDair or GDDsoil, respectively.

2.4. Statistical Analysis

Microsoft Excel 2010 (Microsoft, Redmond, WA, USA) was used for data processing. The data were normally distributed according to the Shapiro–Wilk test. Independent sample t-tests were used to test the effects of plastic film mulching on the soil moisture, soil temperature, plant height, stem diameter, aboveground biomass, ET, GDD, grain yield, harvest index, 100-grain weight, and resource-use efficiency each year using GenStat v.18.1 (VSN International, Hemel Hempstead, UK), and graphs were plotted using Origin Pro 2015 (Origin Lab, Northampton, MA, USA). Mean differences were considered significant at the 0.05 level. Regression analyses were conducted for the ratio of growing period ET to whole growing season ET and total GDDair during the growing period and for the grain yield of corn using Origin Pro 2015 (Origin Lab, Northampton, MA, USA). All data reported in the tables and figures are mean values of three replicates, except for precipitation and air temperature.

3. Results

3.1. Soil Moisture

In both years, the soil moisture was significantly higher in PM at all depths at sowing (Figure 2). In 2014, the soil moisture values at V12, R1, and harvest in the 0–40 cm layer in PM were higher than in CK, but the difference between the two treatments had practically vanished by V6 (Figure 2). In the deeper (60–200 cm) layer, the soil moisture was significantly greater in PM than in CK at every growth stage (Figure 2). Over the entire soil profile (0–200 cm layer), soil water storage in the 0–200 cm layer in PM was significantly higher than that in CK, with a value of 477.1 mm at sowing (17.5% greater than that in CK), 472.6 mm at V6 (16.6% greater), 478.7 mm at V12 (35.3% greater), 414.7 mm at R1 (15.4% greater), and 466.4 mm at harvest (18.4% greater) (Figure S2a).
In 2015, the soil moisture in the top (0–20 cm) layer was significantly greater in PM at V4, R1, and harvest, but lower at V12, compared to the levels in CK, and also lower in the next layer (20–40 cm) at each growth stage (Figure 2). In the 40–80 cm layer, the soil moisture in PM was greater than that in CK at V4 and V12 and lower at R1, whereas in the 80–200 cm layer, it was higher at all three stages (Figure 2). At greater depths, the contribution from precipitation during the growing season was smaller: The moisture levels in the 40–200 cm layer in the two treatments were similar at harvest (Figure 2). Over the entire column (0–200 cm), soil water storage in the 0–200 cm layer in PM was 468.0 mm (25.2% greater than that in CK) at sowing, 480.7 mm (24.3% greater) at V4, 441.8 mm (21.8% greater) at V12, 423.8 mm (17.7% greater) at R1, and 314.2 mm (9.3% greater) at harvest time (Figure S2b).

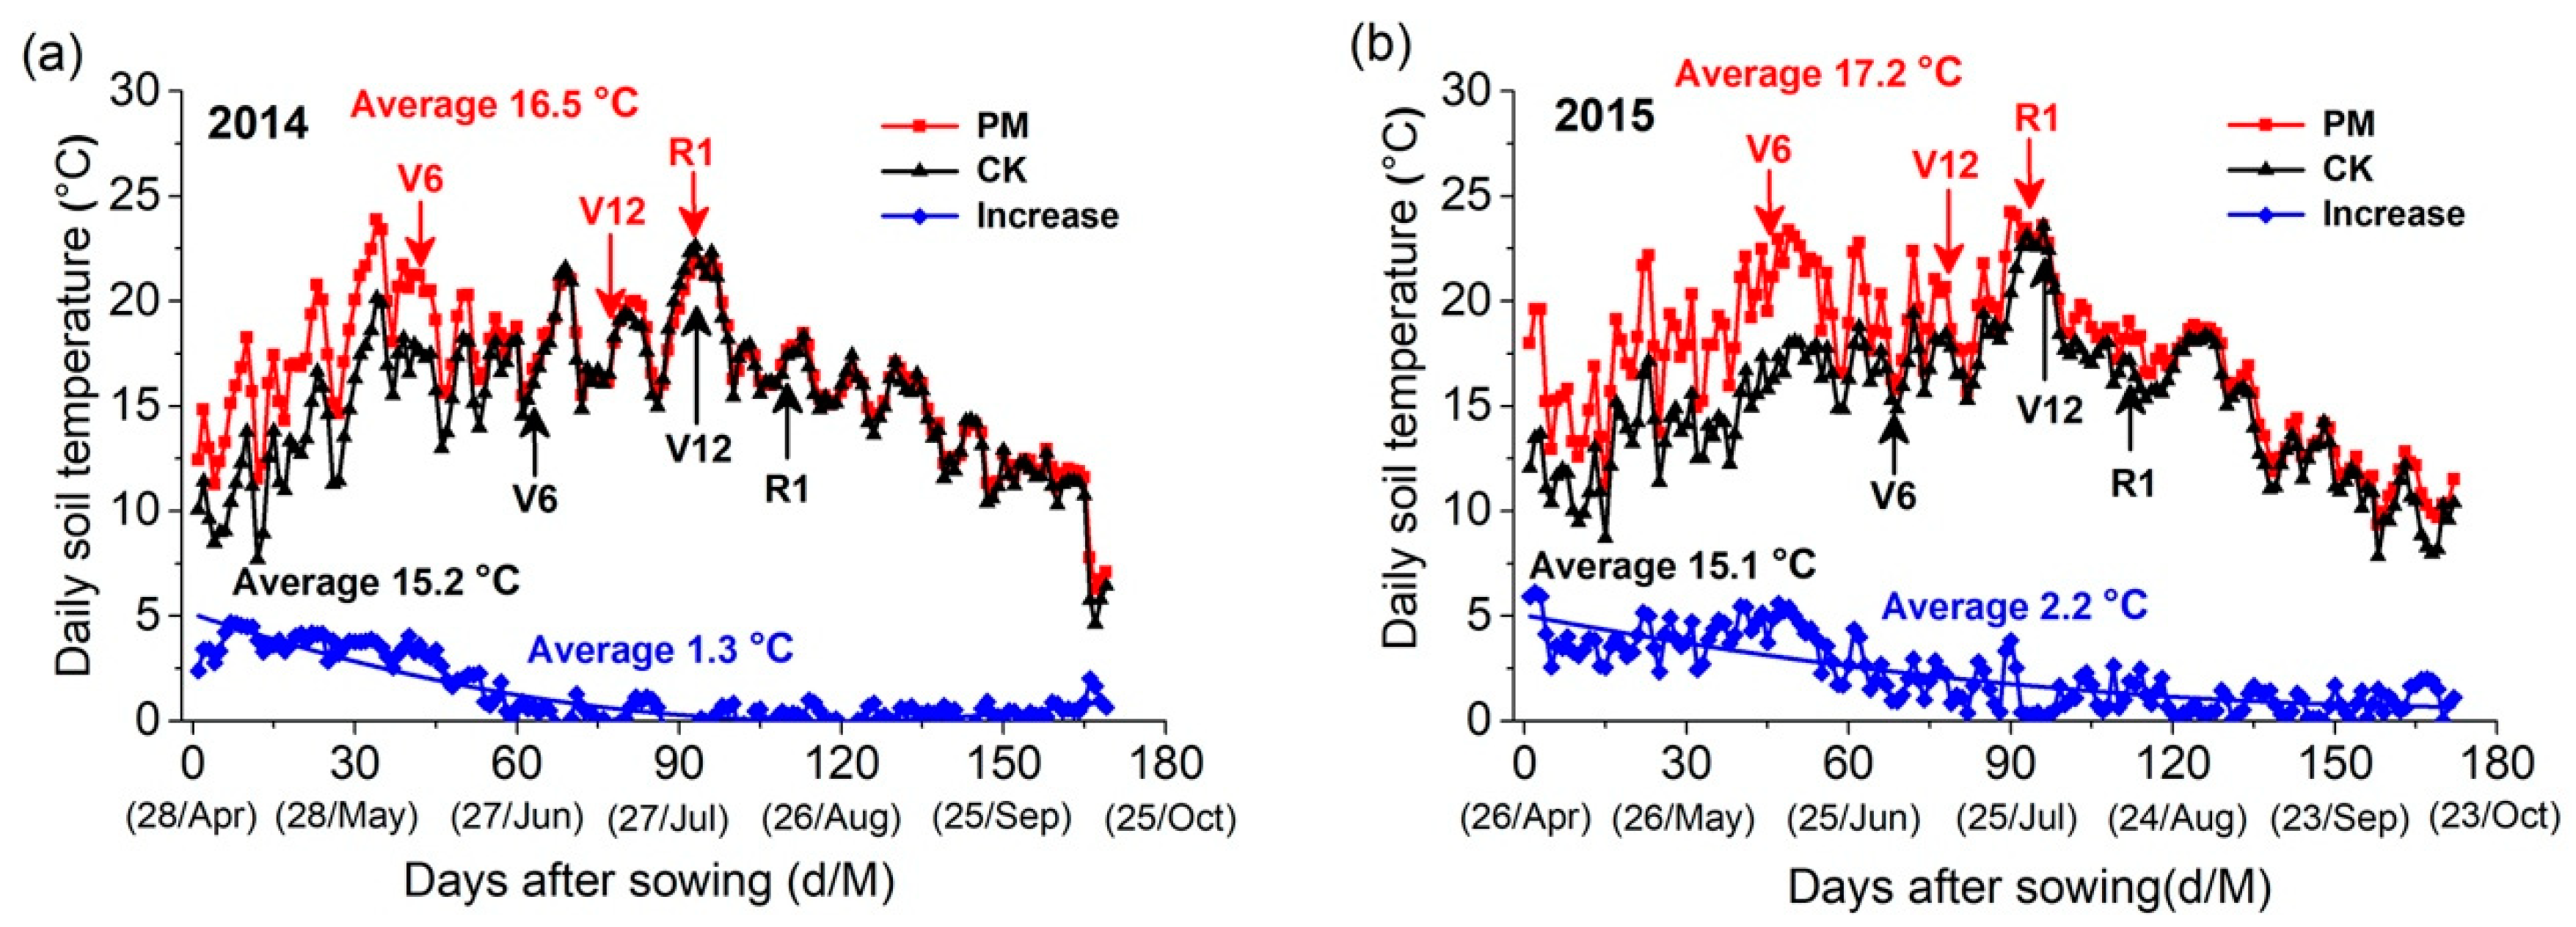
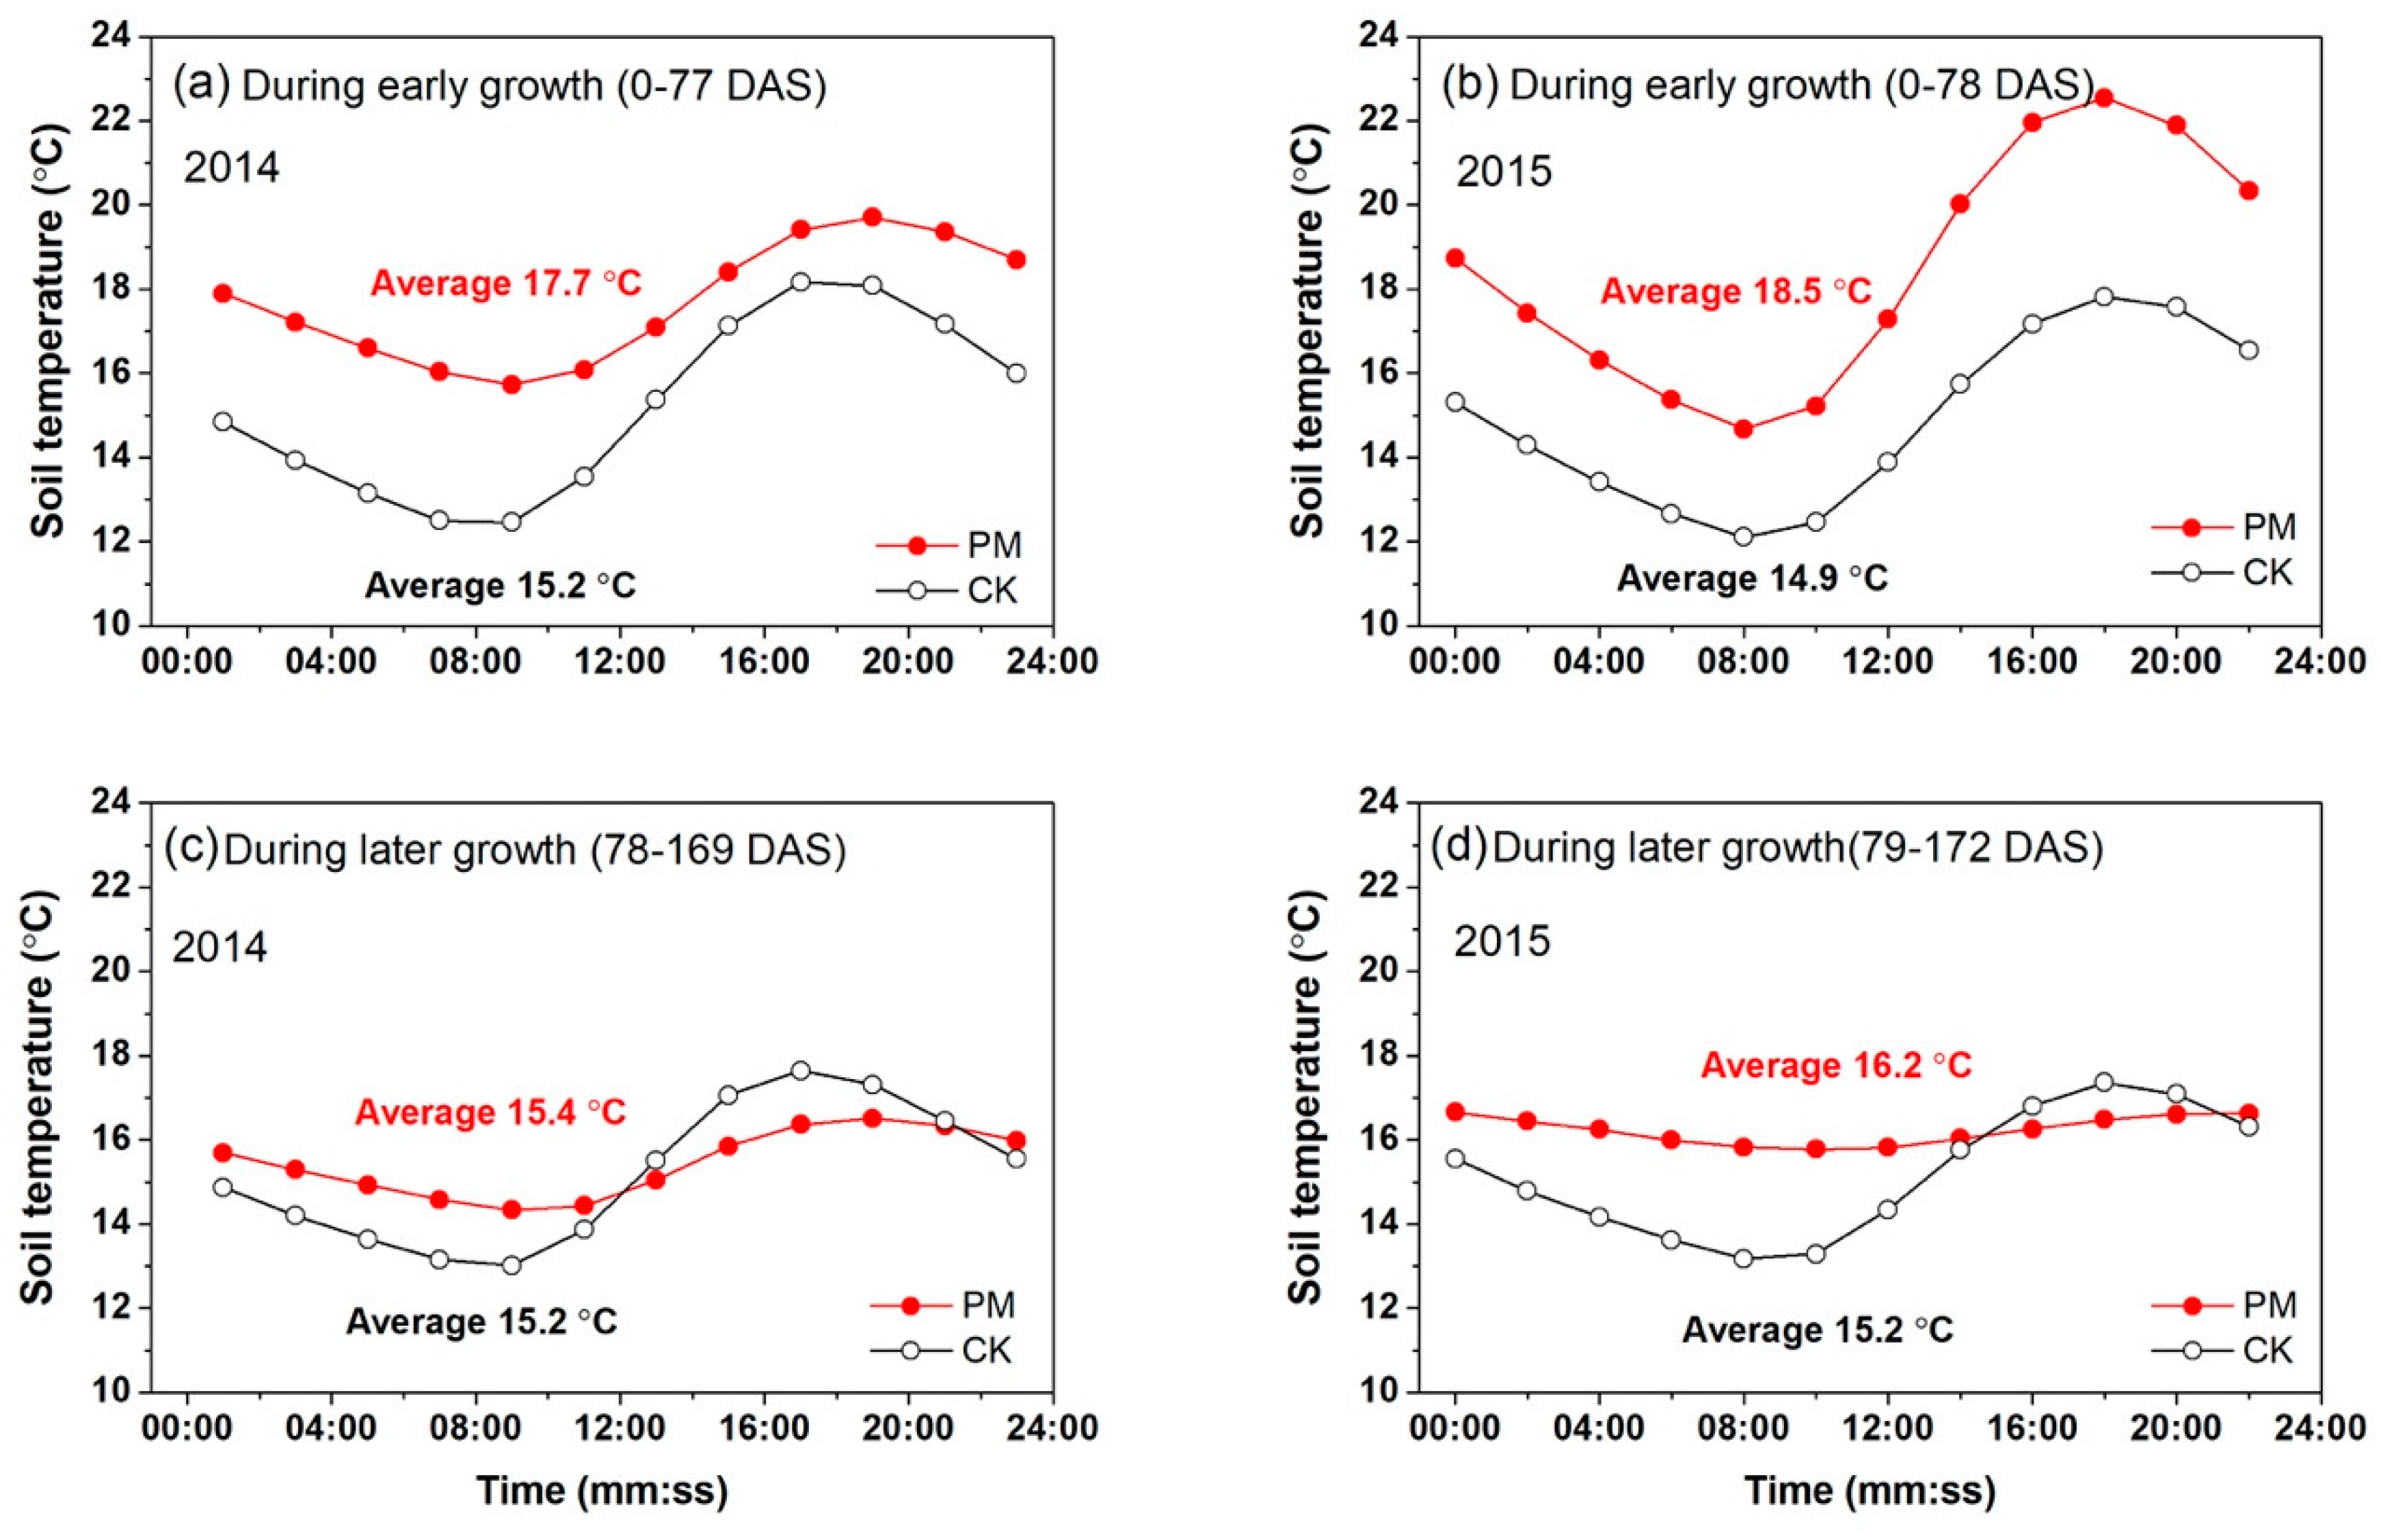
3.2. Soil Temperature

Plastic film mulch significantly increases soil temperatures during the early stages of corn growth and the warming effect, namely the difference in soil temperature between PM and CK, gradually decreased as the plants grew (Figure 3). Before the V12 stage (~78 days after sowing (DAS)), the daily mean soil temperatures for the PM treatment were higher than for CK by 2.5 °C in 2014 and 3.6 °C in 2015. Throughout the whole growing season, the PM treatment had higher soil temperatures than CK, with average differences of 1.3 °C in 2014 and 2.2 °C in 2015.
For the two years, on average, during early growth, the PM treatment had significantly higher soil temperatures than the CK—the daily maximum and minimum soil temperatures were 3.1 °C and 2.9 °C higher than the CK (Figure 4a,b). During later growth, the maximum soil temperature of the PM treatment was 0.9 °C lower than the check, the minimum soil temperature was 1.8 °C higher than the check, and the daily mean soil temperature was 0.6 °C higher than the check (Figure 4c,d). Overall, the PM treatment increased the daily minimum soil temperature throughout the growing season, increased the daily maximum soil temperature during early growth, and decreased the daily maximum soil temperature during later growth, relative to the check.

3.3. Crop Development

3.3.1. Crop Development Stages
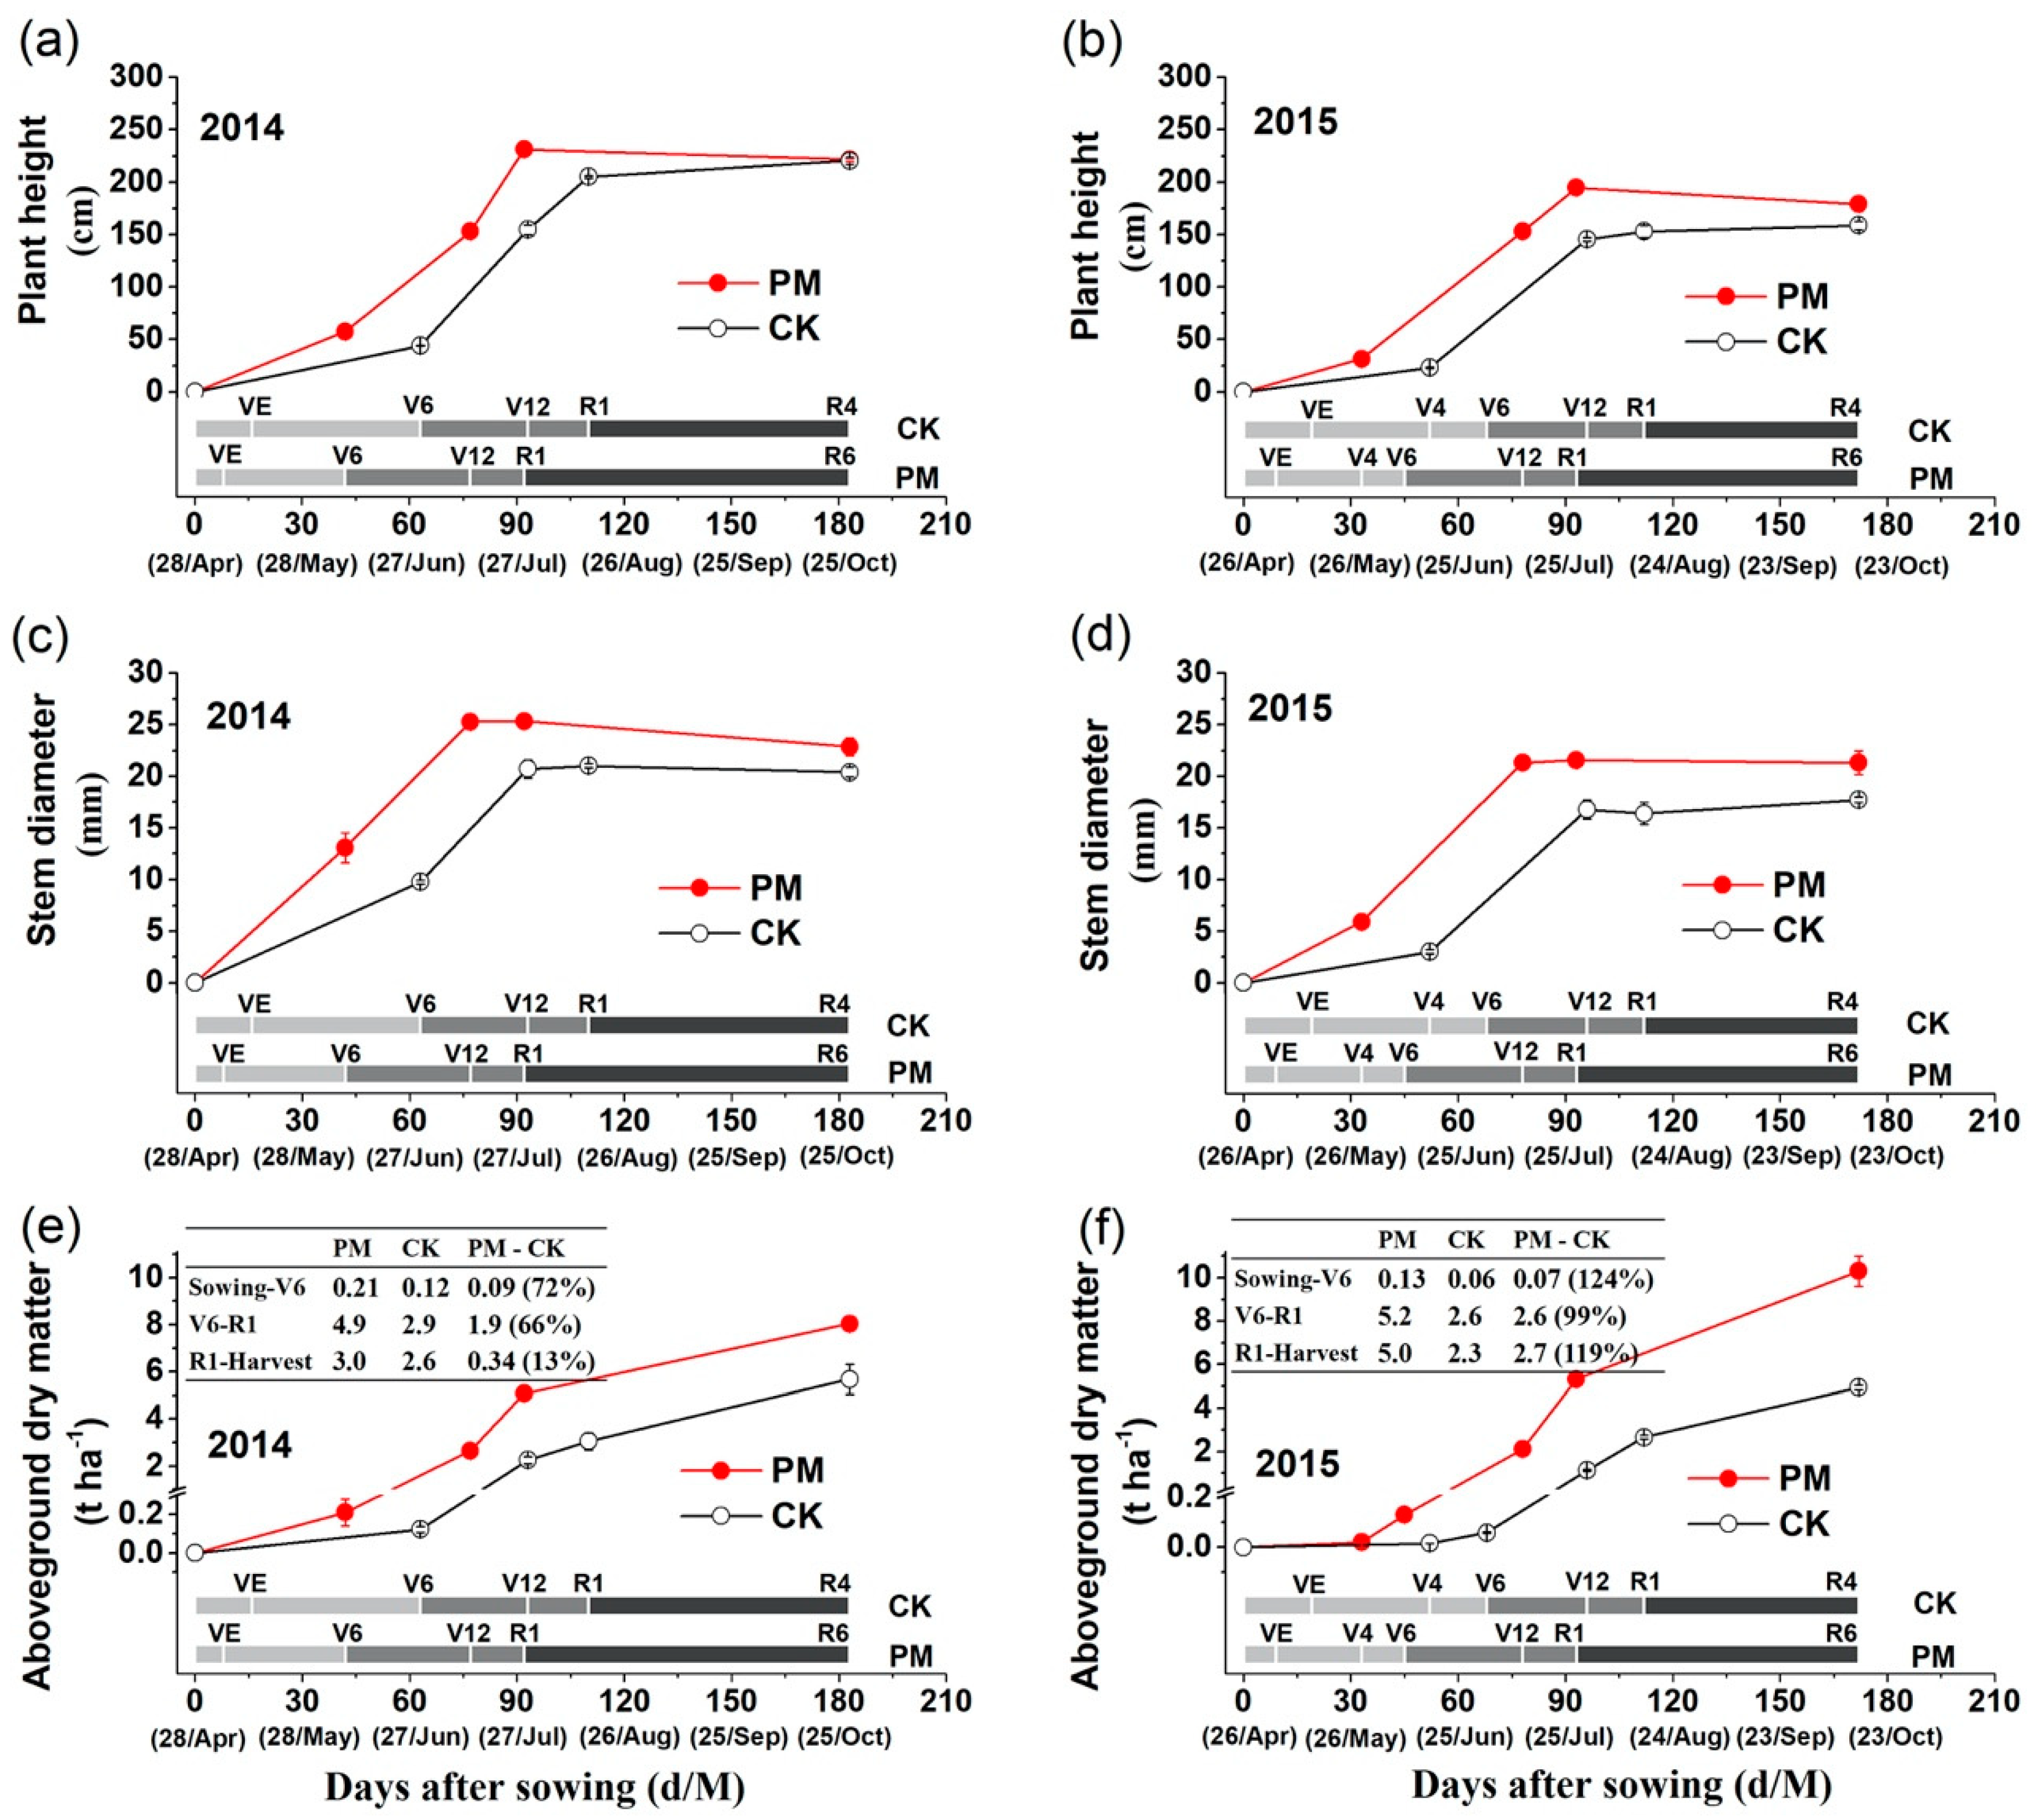
Plastic film mulch significantly advanced specific growth stages of corn in both years (Figure 5). Plants in the PM treatment reached stages VE and V6 sooner than the CK—being 8 and 10 days earlier than the CK for stage VE (at 8 and 9 DAS) in 2014 and 2015, respectively, and 13 days ahead of the CK from stage VE to V6 (34 vs. 47 days in 2014 and 36 vs. 49 days in 2015). Therefore, the duration from sowing to the V6 stage in PM was shorter in PM by 3–4 days than in CK. However, the duration between V6 and R1 for the PM treatment was three and four days longer than for CK in 2014 and 2015, respectively. Compared with CK, corn in the PM treatment reached the V12 stage 16 days earlier in 2014 and 18 days earlier in 2015, and the R1 stage 18 days earlier in 2014 and 19 days earlier in 2015. The minimum air temperature dipped below zero at the end of the growing season in both years. At harvest, the plants with the PM treatment had reached the R6 stage (physiological maturity), while those with the check had barely reached the R4 stage (dough), with no mature grains. Corn is particularly vulnerable to frost, which proved lethal for some plants. The duration from R1 to harvest in the PM treatment was 18 and 19 days longer than the CK in 2014 and 2015, respectively (Figure 5).

3.3.2. Plant Height

In both years, the PM treatment produced significantly taller plants at stage V6 than the CK, by 30.8% in 2014 and 37.3% in 2015 (Figure 5a,b). At V12, the PM plants were, on average, 7.8 cm taller than the CK in 2015, while no significant differences between treatments were observed in 2014. At R1, PM plants were 26.2 cm tall (12.8% taller than CK) in 2014 and 41.5 cm (27.1% taller than CK) in 2015. At harvest, no significant differences between treatments were observed in 2014, but in 2015, PM plants were, on average, 20.3 cm taller than those in CK (Figure 5a,b).

3.3.3. Stem Diameter

At all growth stages and in both years, PM plants had significantly thicker stems than those in CK (Figure 5c,d). In 2014, the stem diameter in PM was 13.1 mm at stage V6 (3.3 mm thicker than CK), 25.3 mm at V12 (4.6 mm thicker), and 25.3 mm at R1 (4.3 mm thicker). In 2015, the stem diameter in PM was greater than that in CK by 2.9 mm at V4, 4.5 mm at V12, and 5.2 mm at R1. At harvest, the stem diameter in PM was 22.9 mm in 2014, or 12.0% thicker than CK, and 21.3 mm in 2015, or 20.3% thicker than CK—the differences were significant in both years (Figure 5c,d).

3.3.4. Aboveground Biomass

The PM treatment produced significantly more aboveground biomass than the CK in both years; 72% at V6, 17% at V12, and 66% at R1 in 2014 (Figure 5e) and 35% at V4, 124% at V6, 87% at V12, and 100% at R1 in 2015 (Figure 5f). At harvest, the differences were significantly greater in both years (Figure 5e,f), by 42% in 2014 and 109% in 2015. In 2014, the PM treatment increased the aboveground biomass by 72% from sowing to the V6 stage, by 66% from V6 to the R1 stage, and by 13% from the R1 stage to harvest (Figure 5e). In 2015, the corresponding values were 124%, 99%, and 119% (Figure 5f).

3.4. Distribution of Evapotranspiration

In 2014, the difference of total evapotranspiration between the two treatments was not significant (Figure 6). However, in 2015, which was a dry year, evapotranspiration in the PM treatment (390.8 mm) was significantly greater than that in CK (323.4 mm). The PM treatment had significantly lower evapotranspiration than CK before the V12 stage, but significantly higher evapotranspiration after the V12 stage, in both years (Figure 6). The PM treatment had a significantly lower ratio of evapotranspiration to total evapotranspiration before the V12 stage than CK. However, after the V12 stage, the PM treatment had a significantly higher ratio of evapotranspiration to total evapotranspiration than CK (Figure 6).

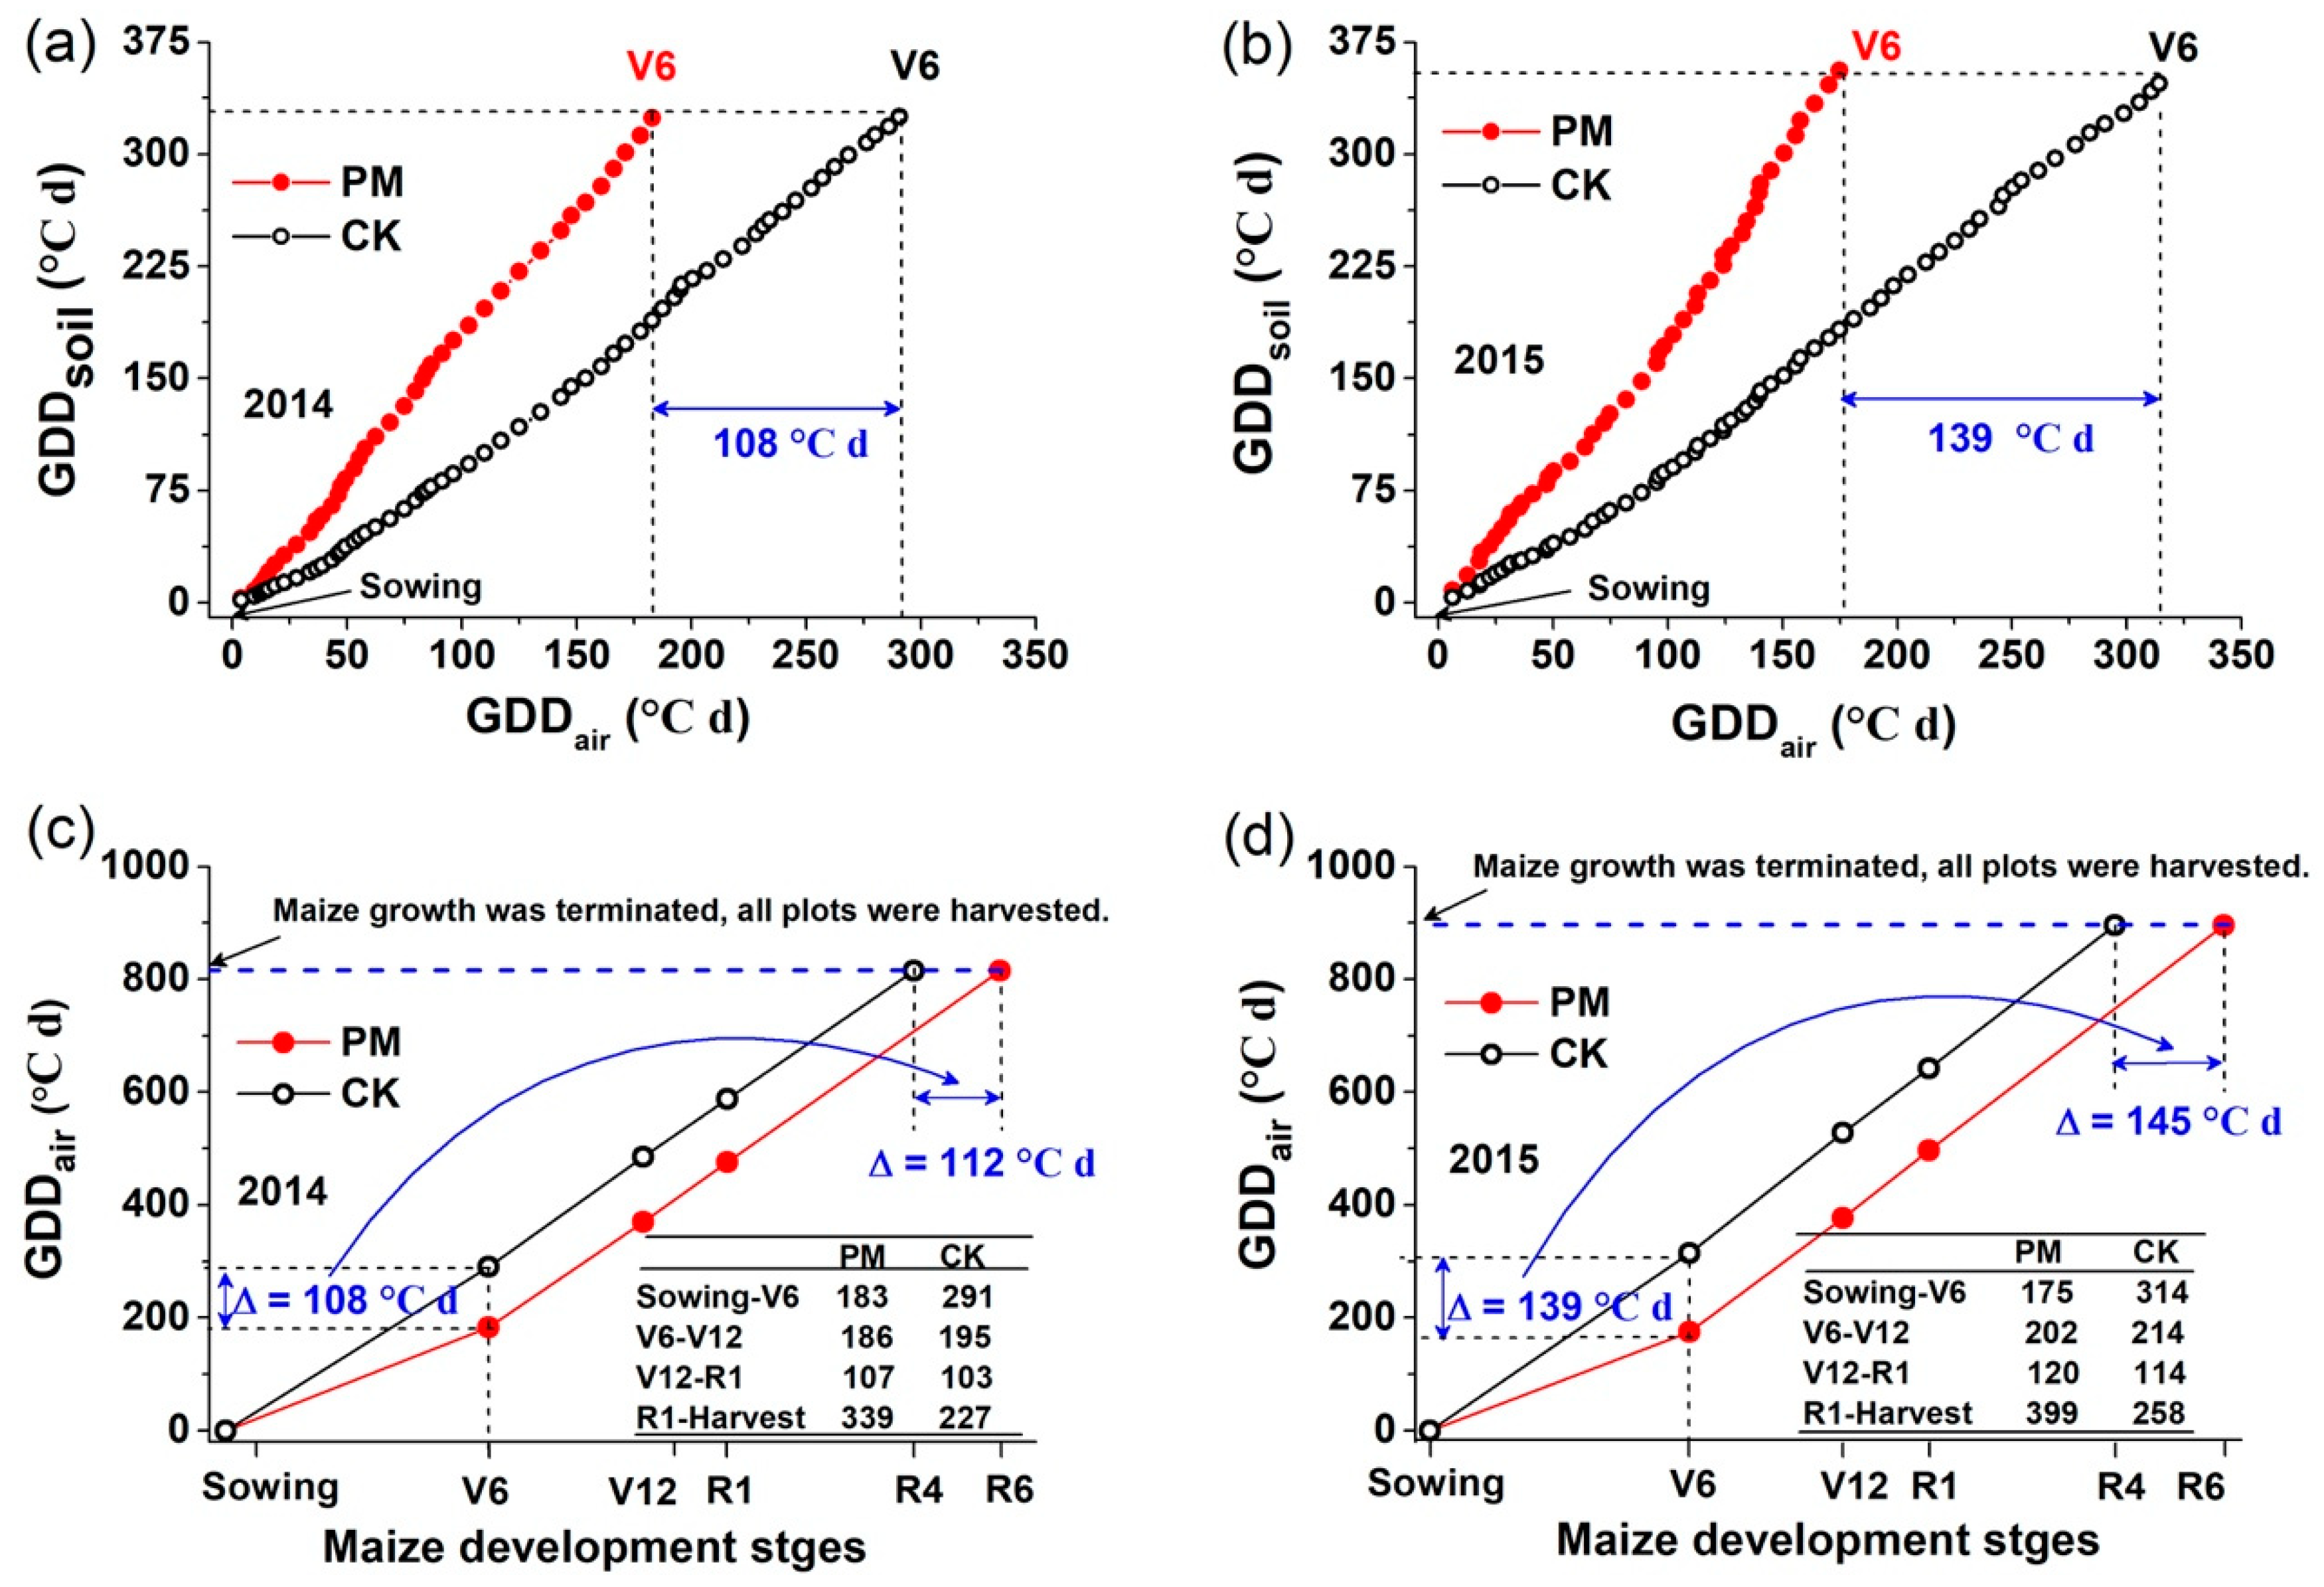
3.5. Distribution of Growing Degree Days

Across the whole growing season, GDDsoil in the PM treatment was 1124 ± 22 °C d in 2014 (168 °C d, or 17.7% more than CK) and 1298 ± 5 °C d in 2015 (350 °C d, or 36.9% more than CK), exhibiting a significant increase each year. The PM and CK treatments had similar GDDair during the growing period in both years. The GDDair value during the growing period was 815 °C d in 2014 and 895 °C d in 2015.
From sowing to the V6 stage in 2014, the crop requirements to reach stage V6 for GDDair were 183 °C d in PM and 291 °C d in CK, and for GDDsoil, were 324 °C d in PM and 325 °C d in CK (Figure 7a). In 2015, the corresponding values were 175 °C d and 314 °C d for GDDair and 356 °C d and 347 °C d for GDDsoil (Figure 7b). Therefore, the crop had similar requirements for reaching stage V6 in both treatments for GDDsoil, but differed for GDDair. The CK treatment had much lower soil temperatures before stage V6 than the PM treatment (Figure 3) and a lower accumulation rate of GDDsoil (Figure 7a,b). As such, the CK crop took longer to reach stage V6 and, therefore, consumed more GDDair than the PM treatment (108 °C d in 2014 and 139 °C d in 2015). The PM treatment consumed lower GDDair than the CK by 108 °C d in 2014 and 139 °C d in 2015. In other words, the PM treatment saved GDDair during this stage (Figure 7a,b).
From the V6 to R1 stage, GDDair in the PM treatment was 293 °C d in 2014 and 322 °C d in 2015. GDDair in the CK treatment did not significantly differ from PM during this period in 2014 or 2015 (Figure 7c,d). However, the corresponding GDDsoil significantly differed, being 415 °C d in 2014 and 504 °C d in 2015 in the PM treatment, or 14 °C d and 126 °C d more than CK, respectively.
From the R1 stage to harvest, GDDair in the PM treatment was 339 °C d in 2014 and 399 °C d in 2015, or 112 °C d and 145 °C d more than the CK in 2014 and 2015, respectively (Figure 7c,d). The size of the increased value in this period was similar to that of the decreased value during sowing to the V6 stage (Figure 7c,d). The GDDsoil in the PM treatment during this period was 386 °C d in 2014 and 434 °C d in 2015, or 157 °C d and 210 °C d more than the CK in 2014 and 2015, respectively.

3.6. Grain Yield and Resource-Use Efficiency

Plastic film mulching significantly increased the grain yields in both years (Table 1), being 4312 kg ha−1 in 2014 (140% more than the CK) and 5400 kg ha−1 in 2015 (179%). We found a negative correlation (R2 = 0.88, p = 0.04) between the grain yield and the ratio of evapotranspiration before the V12 stage to total evapotranspiration, but a positive correlation (R2 = 0.88, p = 0.04) between the grain yield and the ratio of evapotranspiration after the V12 stage to total evapotranspiration (Figure 8a). We also found that the grain yield correlated negatively (R2 = 0.90, p = 0.03) with the GDDair from sowing to the V6 stage, but correlated positively (R2 = 0.98, p = 0.007) during the grain-filling period (from the R1 stage to harvest) (Figure 8b), with no significant correlation from the V6 to R1 stage.
Mulching also significantly increased the aboveground biomass, harvest index, and 100-grain weight. In 2014, the PM treatment increased the aboveground biomass by 2364 kg·ha−1 (41.6%), harvest index by 0.22 (68.8%), and 100-grain weight by 10.94 g (79.8%). In 2015, the corresponding values were 5373 kg·ha−1 (109%), 0.13 (33.3%) and 11.14 g (83.7%) (Table 1). The water-use efficiency significantly improved in PM in both years, relative to that in CK, by 141% in 2014 and 131% in 2015 (Table 1). Similarly, the thermal-use efficiency (TUEair and TUEsoil) was significantly higher in PM (Table 1): TUEair by 139% in 2014 and by 179% in 2015, and TUEsoil by 103% in 2014 and by 114% in 2015.

4. Discussion

4.1. Soil Water Retention and Distribution of Evapotranspiration

Plastic film mulch can significantly increase rainwater infiltration into the soil, reduce soil water evaporation, and increase soil water storage [7,8,29]. In both years, the PM treatment had significantly higher soil moisture in the 0–200 cm layer than CK at most developmental stages (Section 3.1, Figure 2). It has been widely reported that soil water storage increases under film mulch, especially during the early stage of maize growth [8,11]. Some studies have found that soil water storage under film mulch did not significantly increase or slightly decreased in the later growing period due to greater crop transpiration with faster and bigger canopy establishment, yet the yield still increased [3,5,10,11]. In the present study, the PM treatment increased the soil moisture content and soil water storage in the 0–200 cm layer during the whole corn growing period, and the differences between PM and CK did not change significantly throughout the growing period, except at harvest in 2015 due to limited rainfall (Section 3.1, Figure 2).
Before the V12 stage, PM saved soil water due to a significant decrease in evapotranspiration and a shortened growing period by an average of 17 days compared to CK (Section 3.3.1, Figure 6). The soil environment before the V12 stage was cool and dry. The PM treatment significantly increased the soil moisture and temperature during this period, both of which increased the stem thickness and accumulation of aboveground biomass (Section 3.3, Figure 5). This led to an optimal canopy capturing solar radiation and to using soil water efficiently for biomass accumulation [21,30]. The PM treatment produced significantly more aboveground biomass than the CK in both years at the V12 stage, by 17.6% in 2014 and 86.5% in 2015 (Figure 5). Less water consumption in the early stage can avoid a reduction in yield due to water shortage in the later stage. After the V12 stage, evapotranspiration was significantly higher in PM treatment than in CK (Section 3.4, Figure 6), as was the ratio of evapotranspiration to total evapotranspiration due to better establishment of the plant canopy, a longer duration from V12 to harvest, and higher GDDair compared to CK. Many studies have indicated that an increase in water consumption after flowering leads to a greater partitioning of biomass into grains, improving the crop yield [13,14,15,16]. In the present study, the PM treatment significantly increased the harvest index, 100-grain weight, and grain yield in both years, all of which resulted in high-quality grain filling (Section 3.6, Table 1). In brief, film mulch significantly increased soil water storage and optimized the consumption patterns of water, decreased evapotranspiration before the V12 stage, and increased evapotranspiration after the V12 stage. This water consumption pattern is helpful for saving water, improving the water-use efficiency, and ensuring high-yield maize in a cool, semi-arid area.

4.2. Soil Temperature and Distribution of GDD

As usual, plastic film mulch significantly increased soil temperatures in the early corn growing period, and the warming effect gradually decreased as the crop plants grew in the later growing period (Section 3.2, Figure 3) [2,3,5]. This is because, during early growth, the canopy was small, and the topsoil heated up quickly during the day as a result of the ‘greenhouse effect’, with the plastic film acting like a greenhouse. At night, the plastic film and water condensation underneath the film retained the long-wave radiation, thereby slowing soil cooling. Later, the fully-grown canopy reduced the greenhouse effect, more so in the PM treatment, with its earlier and larger canopy [2,6]. Air or soil temperatures mainly affect corn growth and development by controlling the meristem temperature [30,31]. The soil temperature strongly affects corn development before the V6 stage while the meristem is underground. This explains why the development in corn before V6 is dependent on the GDDsoil. Once the meristem emerges away from the soil, the crop development is controlled by the GDDair [30]. In our study, the higher soil temperatures under plastic film mulch accelerated the accumulation rate of GDDsoil, hastened maize growth and development significantly, advanced stage V6 by 21–23 days, and reduced the contemporaneous consumption of GDDair. The advance of stage V6 helps the plant reach the full canopy faster, decreasing soil water consumption. As such, the PM treatment markedly increased the stem length, stem diameter, and aboveground biomass compared to the CK (Section 3.3, Figure 5).
From stage V6 to R1, the requirements of GDDair did not differ between PM and CK in either year, and the duration was longer in PM by 3–4 days than in CK (Section 3.3.1, Figure 5). The more days during this period and bigger plant at the beginning of this period increased biomass accumulation compared with CK, by 66.0% in 2014 and 99.4% in 2015 (Figure 5). PM treatment advanced stage R1; started filling 18/19 days earlier than CK; avoided upcoming frost damage, which resulted in a longer grain-filling period; and increased the corresponding GDDair by 112 °C·d in 2014 and 145 °C·d in 2015 (Figure 5 and Figure 7). The increased GDDair in this period was equivalent to the decreased GDDair from sowing to the V6 stage (Figure 7). The longer duration and the increased heat (GDDair) during the grain-filling period led to a greater assimilation and translocation of dry matter for grain filling, which increased the harvest index and grain yield [11,21,32]. Therefore, the higher the GDDair during the grain-filling period, the higher the grain yield, and the higher the GDDair from sowing to the V6 stage, the lower the grain yield (Figure 8a,b). For CK, more evapotranspiration from sowing to the V12 stage and more GDDair from sowing to the V6 stage led to less water from V12 to harvest and less GDDair from R1 to harvest, resulting in the premature death of crop plants due to upcoming frost damage and a poor yield.

5. Conclusions

In this paper, two years of film mulch, on average, significantly increased the topsoil temperature by 3.9 °C, shortened the period from sowing to the V6 stage by 22 days, decreased contemporaneous GDDair by 124 °C d, and advanced the silking stage by 19 days, which prolonged the period of grain filling, increased GDDair during the grain-filling period by 129 °C d, and avoided upcoming frost damage. Film mulch also decreased evapotranspiration by 71 mm before the V12 stage and increased evapotranspiration by 104 mm after the V12 stage. The higher GDDair and ET supported biomass accumulation during the grain-filling period, becoming the key factors for increasing the corn grain yield in the cool, semi-arid area. These findings deepen our understanding of the mechanism of crop yield increase under film mulch in dry and cool areas and provide a case study for understanding the impact of the temporal distribution of micrometeorological resources on crop yield formation, as well as a new perspective on the relationship between climate warming and the crop yield. However, further research is needed to consider the environmental problems caused by polyethylene film due to the fact that it cannot be easily biodegraded.

Supplementary Materials

The following are available online at https://www.mdpi.com/2073-4395/10/8/1195/s1: Figure S1: Cross-sectional views of planting patterns of (a) check (CK) and (b) plastic film mulching (PM) treatment; Figure S2: Soil water storage within the 0 to 200 cm soil layer in mulched (PM) and check (CK) plots in (a) 2014 and (b) 2015. Vertical bars represent standard errors of the mean.

Author Contributions

Conceptualization, F.-M.L., Y.J., and F.Z.; investigation, M.K., Y.-J.G., and C.-L.H.; resources, Y.J. and X.-Y.S.; formal analysis, Y.J. and M.K.; writing—original draft preparation, M.K.; writing—review and editing, F.-M.L., F.Z., Y.J., K.H.M.S., Y.-J.G., C.-L.H., X.S., and P.Z.; funding acquisition, F.-M.L. and Y.J. All authors have read and agreed to the published version of the manuscript.

Funding

This research was funded by the National Nature Science Foundation of China (31470496), the “111” program (B07051), and the Gansu Provincial Funds of International Cooperation Centre.

Conflicts of Interest

The authors declare no conflict of interest.

References

  1. Liu, C.A.; Jin, S.L.; Zhou, L.M.; Jia, Y.; Li, F.M.; Xiong, Y.C.; Li, X.G. Effects of plastic film mulch and tillage on maize productivity and soil parameters. Eur. J. Agron. 2009, 31, 241–249. [Google Scholar] [CrossRef]
  2. Zhou, L.M.; Li, F.M.; Jin, S.L.; Song, Y.J. How two ridges and the furrow mulched with plastic film affect soil water, soil temperature and yield of maize on the semiarid Loess Plateau of China. Field Crop. Res. 2009, 113, 41–47. [Google Scholar] [CrossRef]
  3. Wang, Y.P.; Li, X.G.; Zhu, J.; Fan, C.Y.; Kong, X.J.; Turner, N.C.; Siddique, K.H.M.; Li, F.M. Multi-site assessment of the effects of plastic-film mulch on dryland maize productivity in semiarid areas in China. Agric. For. Meteorol. 2016, 220, 160–169. [Google Scholar] [CrossRef]
  4. Zhang, F.; Zhang, W.J.; Qi, J.G.; Li, F.M. A regional evaluation of plastic film mulching for improving crop yields on the Loess Plateau of China. Agric. For. Meteorol. 2018, 248, 458–468. [Google Scholar] [CrossRef]
  5. Eldoma, I.M.; Li, M.; Zhang, F.; Li, F.M. Alternate or equal ridge–furrow pattern: Which is better for maize production in the rain-fed semi-arid Loess Plateau of China? Field Crop. Res. 2016, 191, 131–138. [Google Scholar] [CrossRef]
  6. Gan, Y.T.; Siddique, K.H.M.; Turner, N.C.; Li, X.G.; Niu, J.Y.; Yang, C.; Liu, L.P.; Chai, Q. Ridge-furrow mulching systems—An innovative technique for boosting crop productivity in semiarid rain-fed environments. Adv. Agron. 2013, 118, 429–476. [Google Scholar] [CrossRef]
  7. Jiang, X.; Li, X.G. Assessing the effects of plastic film fully mulched ridge–furrow on rainwater distribution in soil using dye tracer and simulated rainfall. Soil Till. Res. 2015, 152, 67–73. [Google Scholar] [CrossRef]
  8. Liu, X.E.; Li, X.G.; Hai, L.; Wang, Y.P.; Li, F.M. How efficient is film fully-mulched ridge–furrow cropping to conserve rainfall in soil at a rainfed site? Field Crop. Res. 2014, 169, 107–115. [Google Scholar] [CrossRef]
  9. Liu, Y.; Li, S.Q.; Chen, F.; Yang, S.J.; Chen, X.P. Soil water dynamics and water use efficiency in spring maize (Zea mays L.) fields subjected to different water management practices on the Loess Plateau, China. Agric. Water Manag. 2010, 97, 769–775. [Google Scholar] [CrossRef]
  10. Zhang, S.L.; Li, P.R.; Yang, X.Y.; Wang, Z.H.; Chen, X.P. Effects of tillage and plastic mulch on soil water, growth and yield of spring-sown maize. Soil Till. Res. 2011, 112, 92–97. [Google Scholar] [CrossRef]
  11. Bu, L.D.; Liu, J.L.; Zhu, L.; Luo, S.S.; Chen, X.P.; Li, S.Q.; Lee Hill, R.; Zhao, Y. The effects of mulching on maize growth, yield and water use in a semi-arid region. Agric. Water Manag. 2013, 123, 71–78. [Google Scholar] [CrossRef]
  12. Li, M.; Zhang, K.; Eldoma, I.M.; Fang, Y.; Zhang, F. Plastic Film Mulching Sustains High Maize (Zea mays L.) Grain Yield and Maintains Soil Water Balance in Semiarid Environment. Agronomy 2020, 10, 600. [Google Scholar] [CrossRef] [Green Version]
  13. Kirkegaard, J.A.; Lilley, J.M.; Howe, G.N.; Graham, J.M. Impact of subsoil water use on wheat yield. Aust. J. Agric. Res. 2007, 58. [Google Scholar] [CrossRef]
  14. Siddique, K.H.M.; Regan, K.L.; Tennant, D.; Thomson, B.D. Water use and water use effciency of cool season grain legumes in low rainfall Mediterranean-type environments. Eur. J. Agron. 2001, 15, 267–280. [Google Scholar] [CrossRef]
  15. Zaman-Allah, M.; Jenkinson, D.M.; Vincent, V. A conservative pattern of water use, rather than deep or profuse rooting, is critical for the terminal drought tolerance of chickpea. J. Exp. Bot. 2011, 62, 4239–4252. [Google Scholar] [CrossRef] [PubMed] [Green Version]
  16. He, J.; Du, Y.-L.; Wang, T.; Turner, N.C.; Yang, R.-P.; Jin, Y.; Xi, Y.; Zhang, C.; Cui, T.; Fang, X.-W.; et al. Conserved water use improves the yield performance of soybean (Glycine max (L.) Merr.) under drought. Agric. Water Manag. 2017, 179, 236–245. [Google Scholar] [CrossRef]
  17. Li, F.-M.; Yan, X.; Wang, J.; Li, S.-Q.; Wang, T.-C. The mechanism of yield decrease of spring wheat resulted from plastic film mulching. Sci. Agric. Sin. 2001, 34, 330–333. [Google Scholar]
  18. Liu, X.E.; Li, X.G.; Hai, L.; Wang, Y.P.; Fu, T.T.; Turner, N.C.; Li, F.M. Film-mulched ridge–furrow management increases maize productivity and sustains soil organic carbon in a dryland cropping system. Soil Sci. Soc. Am. J. 2014, 78, 1434. [Google Scholar] [CrossRef]
  19. Dang, J.; Liang, W.; Wang, G.; Shi, P.; Wu, D. A preliminary study of the effects of plastic film-mulched raised beds on soil temperature and crop performance of early-sown short-season spring maize (Zea mays L.) in the North China Plain. Crop J. 2016, 4, 331–337. [Google Scholar] [CrossRef] [Green Version]
  20. Li, R.; Hou, X.Q.; Jia, Z.K.; Han, Q.F.; Ren, X.L.; Yang, B.P. Effects on soil temperature, moisture, and maize yield of cultivation with ridge and furrow mulching in the rainfed area of the Loess Plateau, China. Agric. Water Manag. 2013, 116, 101–109. [Google Scholar] [CrossRef]
  21. Liu, Y.; Yang, S.J.; Li, S.Q.; Chen, X.P.; Fang, C. Growth and development of maize (Zea mays L.) in response to different field water management practices: Resource capture and use efficiency. Agric. For. Meteorol. 2010, 150, 606–613. [Google Scholar] [CrossRef]
  22. Shim, D.; Lee, K.-J.; Lee, B.-W. Response of phenology-and yield-related traits of maize to elevated temperature in a temperate region. Crop J. 2017, 5, 305–316. [Google Scholar] [CrossRef]
  23. Yang, H.S.; Dobermann, A.; Lindquist, J.L.; Walters, D.T.; Arkebauer, T.J.; Cassman, K.G. Hybrid-maize—A maize simulation model that combines two crop modeling approaches. Field Crop. Res. 2004, 87, 131–154. [Google Scholar] [CrossRef] [Green Version]
  24. Zhang, F.; Li, M.; Zhang, W.J.; Li, F.M.; Qi, J.G. Ridge–furrow mulched with plastic film increases little in carbon dioxide efflux but much significant in biomass in a semiarid rainfed farming system. Agric. For. Meteorol. 2017, 244–245, 33–41. [Google Scholar] [CrossRef]
  25. Ma, Y.-P.; Wang, S.-L.; Li, W.-J. Chilling Disaster Factors in Maize Reproductive Stage Based on Crop Growth Model. Acta Agron. Sin. 2011, 37, 1642–1649. [Google Scholar] [CrossRef]
  26. Abendroth, L.; Elmore, R.W.; Boyer, M.; Marlay, S. Corn Growth and Development; Iowa State University Extension: Ames, IA, USA, 2011. [Google Scholar]
  27. Anandhi, A. Growing degree days—Ecosystem indicator for changing diurnal temperatures and their impact on corn growth stages in Kansas. Ecol. Indic. 2016, 61, 149–158. [Google Scholar] [CrossRef] [Green Version]
  28. McMaster, G.S.; Wilhelm, W.W. Growing degree-days: One equation, two interpretations. Agric. For. Meteorol. 1997, 87, 291–300. [Google Scholar] [CrossRef] [Green Version]
  29. Wu, Y.; Huang, F.; Jia, Z.; Ren, X.; Cai, T. Response of soil water, temperature, and maize (Zea mays L.) production to different plastic film mulching patterns in semi-arid areas of northwest China. Soil Till. Res. 2017, 166, 113–121. [Google Scholar] [CrossRef]
  30. Stone, P.J.; Sorensen, I.B.; Jamieson, P.D. Effect of soil temperature on phenology, canopy development, biomass and yield of maize in a cool-temperate climate. Field Crop. Res. 1999, 63, 169–178. [Google Scholar] [CrossRef]
  31. Swan, J.B.; Schneider, E.C.; Moncrief, J.F.; Paulson, W.H.; Peterson, A.E. Estimating corn growth, yield, and grain moisture from air growing degree days and residue cover. Agron. J. 1987, 79, 53–60. [Google Scholar] [CrossRef]
  32. Mo, F.; Wang, J.Y.; Li, F.M.; Nguluu, S.N.; Ren, H.X.; Zhou, H.; Zhang, J.; Kariuki, C.W.; Gicheru, P.; Kavagi, L.; et al. Yield-phenology relations and water use efficiency of maize (Zea mays L.) in ridge-furrow mulching system in semiarid east African Plateau. Sci. Rep. 2017, 7, 3260. [Google Scholar] [CrossRef] [PubMed] [Green Version]
Figure 1. Precipitation, daily mean air temperature, and daily minimum air temperature during the growth period of corn in (a) 2014 and (b) 2015.
Agronomy 10 01195 g001
Figure 2. Soil moisture content in the 0–200 cm layer in mulched (PM) and check (CK) plots in 2014 and 2015. Sowing: sowing time, V4: four-leaf stage, V6: six-leaf stage, V12: twelve-leaf stage, R1: silking stage, and Harvest: harvest time. Error bars represent standard errors of the mean.
Agronomy 10 01195 g002
Figure 3. Daily soil temperature in mulched (PM) and check (CK) plots and the difference in soil temperature between the PM and CK plot in the (a) 2014 and (b) 2015 growing seasons. V6: six-leaf stage, V12: twelve-leaf stage, and R1: silking stage.
Agronomy 10 01195 g003
Figure 4. Diurnal changes in soil temperature during the (a,b) early growth and (c,d) later growth of corn in mulched (PM) and check (CK) plots in 2014 (left column) and 2015 (right column). DAS: days after sowing.
Agronomy 10 01195 g004
Figure 5. (a,b) Plant height, (c,d) stem diameter, and (e,f) aboveground dry matter in mulched (PM) and check (CK) plots in 2014 (left column) and 2015 (right column). The stacked bar plot in each graph is the duration of stages of corn growth. Vertical bars represent standard errors of the mean. Inset (e,f): The aboveground dry matter increases during three periods. Plants in PM had reached R6, while those in CK had only reached stage R4, and had no mature grains due to the rapidly falling air temperature. VE: seedling emergence, V4: four-leaf stage, V6: six-leaf stage, V12: twelve-leaf stage, R1: silking stage, and R6: physiological maturity.
Agronomy 10 01195 g005
Figure 6. Evapotranspiration (ET) in the mulched (PM) and check (CK) plots in (a) 2014 and (b) 2015. Inset: The ET during different periods and their share of the total ET. V4: four-leaf stage, V6: six-leaf stage, V12: twelve-leaf stage, and R1: silking stage. The different lowercase letters indicate a significant difference among the treatments at p < 0.05.
Agronomy 10 01195 g006
Figure 7. The relationship between air temperature growing degree days (GDDair) and soil temperature growing degree days (GDDsoil) (a,b), and the distribution of GDDair (c,d) in the mulched (PM) and check (CK) plots during the corn growing period in 2014 (left column) and 2015 (right column). V6: six-leaf stage, V12: twelve-leaf stage, R1: silking stage, R4: dough stage, R6: physiological maturity, and ∆: the difference in GDDair between PM and CK. Inset (c,d): The GDDair during four periods. The blue curve arrow (c,d) indicates the saved GDDair in PM before stage V6 that will be used for reproductive growth, as the higher soil temperatures in PM accelerated the accumulation rate of GDDsoil and decreased the consumption of the corresponding GDDair (a,b). The blue dashed line in (c,d) indicates when corn growth terminated; plants in PM had reached R6, while those in CK had only reached stage R4, and had no mature grains due to the rapidly falling air temperature. All plots were harvested at the same time and had the same total GDDair.
Agronomy 10 01195 g007
Figure 8. The relationship between (a) the ratio of evapotranspiration (ET) in different periods to total ET and (b) GDDair in different periods and the grain yield of corn. ** p < 0.01; * p < 0.05.
Agronomy 10 01195 g008
Table 1. Grain yield (kg ha−1), harvest index (HI, kg kg−1), 100-grain weight (g), water-use efficiency (WUE, kg ha−1 mm−1), thermal-use efficiency of air temperature growing degree days (TUEair, kg ha−1 °C−1 d−1), and soil temperature growing degree days (TUEsoil, kg ha−1 °C−1 d−1) of corn in mulched (PM) and check (CK) plots in 2014 and 2015.
YearTreatmentGrain YieldHI100-Grain WeightWUETUEairTUEsoil
2014PM4312 a0.54 a24.6 a12.79 a5.29 a3.84 a
CK1799 b0.32 b13.7 b5.31 b2.21 b1.89 b
2015PM5400 a0.52 a24.5 a13.82 a6.03 a4.36 a
CK1933 b0.39 b13.3 b5.98 b2.16 b2.04 b
Note. Means in the same years within a column followed by different letters differ significantly at the 5% level.

