Article

Phosphorus and Zinc Fertilization Improve Zinc Biofortification in Grains and Straw of Coarse vs. Fine Rice Genotypes

1
Department of Agronomy, The University of Agriculture Peshawar, Peshawar 25130, Pakistan
2
Agriculture Extension Swabi, Khyber Pakhtunkhwa 23020, Pakistan
3
Department of Botany and Microbiology, College of Science, King Saud University, Riyadh 11451, UAE
4
Department of Agriculture, Bacha Khan University, Charsadda 24461, Pakistan
*
Author to whom correspondence should be addressed.
Agronomy 2020, 10(8), 1155; https://doi.org/10.3390/agronomy10081155
Submission received: 20 June 2020 / Revised: 23 July 2020 / Accepted: 5 August 2020 / Published: 7 August 2020
(This article belongs to the Special Issue Phosphorus and Micronutrient Interactions in Soils)

Abstract

:
Continuous cropping of rice (Oryza sativa L.) and wheat (Triticum aestivum L.) deplete soil fertility and reduce crop productivity as well as zinc (Zn) concentrations in rice grains and straw. Low Zn concentrations in rice grains have a negative impact on human health, while low Zn concertation in rice straw creates a nutritional problem for animals. The current high yielding rice varieties and hybrids remove large quantities of Zn from the soils, lowering the residual concentrations of soil Zn for the subsequent crop (e.g., wheat). Field experiments were conducted on farmers field in Malakand with the objective to evaluate the impact of various combinations of phosphorus (0, 40, 80, and 120 kg ha−1) and Zn levels (0, 5, 10, and 15 kg ha−1) on biofortification of Zn in grains and straw of rice genotypes [fine (Bamati-385) vs. coarse (Fakhre-e-Malakand and Pukhraj)]. The results revealed that Zn biofortification in rice genotypes increased with the integrated use of both nutrients (P + Zn) when applied at higher rates (80 and 120 kg P ha−1, and 10 and 15 kg Zn ha−1, respectively). The biofortification of Zn in both grains and straw was higher in the coarse than fine rice genotypes (Pukhraj > Fakhre-e-Malakand > Basmati-385). It was concluded from this study that the application of higher P and Zn levels increased Zn contents in rice parts (grains and straw) under the rice-wheat system. We also concluded from this study that Zn concentrations in rice grains and straw are influenced by plant genetic factors and Zn management practices.

1. Introduction

Rice is the seed of the cereal (grass) species Oryza sativa (Asian rice) or Oryza glaberrima (African rice). Rice is the most widely consumed staple food for a large part of the world′s human population, especially in Asia. Rice has the third-highest worldwide production (741.5 million t in 2014), after sugarcane (1.9 billion t) and maize (1.0 billion t) [1]. Rice is the staple food crop in the diet of about one-half of the world’s population and provides 35–60% of the dietary calories consumed by nearly more than three billion people [2] and this number will increase to 4.6 billion people by 2050. The current production of rice must increase from 520 million t today to at least 880 million t by 2025. It is necessary to produce about 60% more rice than what is currently produced to meet the food needs of a growing world population in 2025 [3].
Zinc is absorbed by plants as a cation (Zn2+) and P is taken up by plants as a phosphate anion (H2PO4−1 or HPO4−2). These cations and anions attract each other, which facilitates the formation of chemical bonds that can form within the soil or the plant. If excess P binds a large quantity of Zn normally available to the plant, the result can be a P-induced Zn deficiency [4]. This generally results in reduced shoot Zn concentration and reduced rice growth [5]. Zinc deficiency is one of the most critical global health problems that affects nearly one-third of the world human population [6,7,8]. Many different types of diseases in humans due to Zn deficiency are reported by many researchers [9,10,11,12,13]. The diseases in humans due to Zn deficiency result in big economic loss each year [14,15,16].
Zn deficiency is a chronic problem among human populations under cereal-based (e.g., rice-wheat) system [4,5,17,18,19,20]. The total number of people estimated to be placed at a new risk of zinc deficiency by 2050 is 138 million. The global burden of disease attributed to zinc deficiency is high, with greater than 100,000 deaths per year from diarrhea and pneumonia in children younger than five years attributable to zinc deficiency.
As Zn deficient soils are widespread in subtropical areas such as India, Pakistan, Latin America, and Turkey [20] mostly due to the rice-wheat system [5]. Therefore, to get good quality rice (higher Zn concentration in rice grains), special consideration should be given to balance Zn content in soil [5,21,22] to increase its bioavailability in rice grains [20]. The recent high yielding rice varieties and hybrids remove large quantities of Zn from the soils and, therefore, the residual concentration of Zn in the soils for the succeeding crops grown after rice declines [5,23]. Our recent publication [5] confirmed that the coarse rice genotypes (Pukkhraj and Fakhr-e-Malakand) took more Zn from soils than the fine rice (Basmati-385) genotype. We suggested from our study that growing wheat after high-yielding coarse genotypes need more Zn application [5] than that grown after the fine rice genotype. The study of [24] revealed that an increase in air CO2 also reduces Zn content in the soils.
Research indicates that Zn deficiency in soils can reduce yield by 40% without the crop showing any Zn deficiency symptoms. The deficiency of Zn in humans is due to growing crops on infertile lands or by the excessive consumption of rice that is inherently low in available Zn [25]. Different soil types including calcareous, heavy clay, alluvial, and sandy soils are low in Zn. Soils low in organic matter and in high pH have Zn deficiency problems. Zinc availability is also reduced by waterlogging and soils where root growth is restricted. Cool wet weather, low light intensity, or high soil nitrogen, phosphorus or copper may intensify the deficiency of Zn in the soils. The soil Zn deficiency reduced both grain yield and quality and may lead to human Zn deficiency, especially in poor countries where foods are mainly cereal-based and deficient in animal proteins [19,26]. A large consumption of cereal-based foods in developing countries under the cereal-based system [4,5] having a low Zn bioavailability (Timmer, 2014) is the major reason for declining human health [19].
Zn availability for plant uptake from the soil is affected by the concentrations of other nutrients especially phosphorus [5], the properties of the soils [27,28], environmental conditions [29], and water availability [30,31]. Application of Zn is very important for crops because it activates different enzymes [32] that promote plant growth [4,30] and improves yield [17,33]. Increasing grain Zn concentration of rice represents an important challenge to be met by (1) breeding and (2) fertilizer application [34]. Maintaining a sufficient concentration of Zn in the Zn-deficient soils is important to achieve desirable Zn concentrations in grains for the improvement of human nutrition [19]. There is a lack of research studying the integrated use of Zn and phosphorus (P) levels on Zn biofortification in grains (important for human health) and straw (important for animal health) of rice under the rice-wheat system. Therefore, this research was designed with the objective to investigate the impact of different rice genotypes and various levels of Zn and P on Zn-biofortification in rice grains and straw under the rice-wheat system.

2. Materials and Methods

2.1. Experimentation, Location, and Soil Information

A field experiment was conducted to investigate the impact of zinc (Zn) and phosphorus (P) levels on the biofortification of Zn in the straw and grains of three rice (Oryza sativa L.) genotypes (G) under the rice-wheat system on a farmers field at Batkhela, Malakand in Northwest Pakistan for two years (Y) during 2011 to 2012 (year 1) and 2012 to 2013 (year 2). Batkhela is located at 34° 37′ 12.00″ N and 71° 58′ 12.00″ E in DMS (degrees minutes seconds) or 34.6167 and 71.9714 (in decimal degrees). The soil of the experimental site is clay loam, slightly alkaline in reaction (pH = 7.3), non-saline (ECe = 1.02 dS m-1), moderately calcareous in nature (CaCO3 = 7.18%), low in soil fertility containing less organic matter (0.71%), extractable P (5.24 mg kg−1), total N (0.51%), exchangeable potassium (AB-DTPA) of 71 (mg kg−1), and Zn (0.93 mg kg−1). Weather data for the experimental period are given in Figure 1.

2.2. Factors and Their Levels Used in the Study

The experiment consisted of three factors and their levels. Factor A: three rice genotypes (Basmati-385, F-Malakand, and Pukhraj), factor B: four P levels (0, 40, 80, and 120 kg ha−1), and factor C: four Zn levels (0, 5, 10, and 15 kg ha−1).

2.3. Experimental Design Used in the Study

The experiment was conducted in a randomized complete block design with a split-plot arrangement using three replications. The combination of factor A (three rice genotypes) and factor B (four P levels) were allotted to main plots, while factor C (four Zn levels) were allotted to subplots. A sub-plot size of 12 m2 (3 × 4 m) having 300 hills per subplot, and a hill to hill distance of 20 cm apart was used.

2.4. Fertilizers Application

A uniform dose of 120 kg N ha−1 of urea and 60 kg K2O ha−1 (SoP (sulfate of potash) or MoP (muriate of potash)) was applied to all treatments. All potassium, phosphorus (triple superphosphate), and Zn (zinc sulfate) were applied at the time of transplanting, while nitrogen was applied in two equal splits i.e., 50% each at transplanting and 30 days after transplanting. The amount of sulfur was maintained constantly in the Zn applied plots by adding additional sulfur using SOP. All subplots were separated by approximately 30 cm ridges to stop the movement of water/nutrients among different treatments. Water to each treatment was separately applied from the water channel.

2.5. Determination of Zinc Concentrations in Grains, Straw, and Rice Plants

After rice harvesting, Zn concentrations in rice grains (without husk), straw, and plants in each treatment were determined according to the standard procedures used by [35].

2.6. Statistical Analysis

Data recorded on Zn concentration in different parts of the rice crop were subjected to analysis of variance (ANOVA) according to the methods described for randomized complete block design with split plot arrangement combined over the years [36], and means between treatments were compared using an LSD (least significant difference) test (p ≤ 0.05).

3. Results and Discussion

3.1. Significant and Non-Significant Data

Zinc concentrations in rice grains were significantly affected by P and Zn levels, genotypes, and years (Table 1). All interactions, except Y × P and P × Zn × G, were found significant for Zn concentrations in rice grains (Table 1). Zinc concentrations in rice straw were significantly affected by P and Zn levels (Table 1). Genotypes, years, and all interactions except Y × Zn, P × Zn, and Zn x G were found significant for Zn concentrations in rice straw (Table 1).

3.2. Effect of Phosphorus Levels on Zinc Concentrations in Rice Grains and Straw

The two-years mean data indicated that maximum Zn concentrations in rice grains (20.04 mg kg−1) were observed with the application of 120 kg P ha−1, while minimum Zn concentrations in grains (16.32 mg kg−1) was observed in P control plots (Table 2). Table 2 also indicated that maximum Zn concentrations in rice straw (21.89 mg kg−1) was observed with 120 kg P ha−1 being on par with 80 kg P ha−1 (21.60 mg kg−1). The minimum Zn concentrations in rice straw (19.72 mg kg-1) were recorded with 40 kg P ha−1 being on par with P control plots (19.77 mg kg−1). The present results demonstrated that Zn concentrations in rice grains and straw were increased with the application of higher P levels (80 and 120 kg P ha−1). In contrast to our results, [37] stated that P application resulted in the decline of Zn in both shoots and roots. The discrepancies between our results and those of [37] could be due to the differences in genotypes used, the soil and environmental conditions. We used two coarse rice genotypes that took more Zn from the soil and it increased with an increase in P level. Moreover, we conducted the experiment in a remote area (Malakand) in a farmer’s field where both P and Zn were deficient, and so the application of higher P levels improved leaf area index [33], dry matter partitioning into various plant parts [31], and increased yield and yield components (data not shown) thus resulted in higher Zn uptake by the rice plants. Increasing the accessibility of rice to phosphorus in the growth medium can bring Zn deficiency in plants by changing soil and plant factors, however, little is known about the exact mechanisms.

3.3. Effect of Zinc Levels on Zinc Concentrations in Rice Grains and Straw

The mean of two-years data indicated that the maximum Zn concentrations in rice grains (22.31 mg kg−1) were recorded with 10 kg Zn ha−1 (Table 3) being on par with 15 kg Zn ha−1 (22.22 mg kg−1). Minimum Zn concentrations in grain (8.03 mg kg−1) were recorded in Zn control plots (Table 3). In the case of rice straw, maximum Zn concentrations in straw (24.57 mg kg−1) were recorded with 15 kg Zn ha−1. Minimum Zn concentrations in rice straw (12.51 mg kg−1) were recorded in zinc control plots (Table 3). Application of higher Zn levels (10 and 15 kg Zn ha−1) increased Zn concentrations in both rice grains and straw. Likewise, [38] reported that Zn concentrations in rice grains and straw improved considerably while rising the Zn level up to the maximum level of 15 kg Zn ha−1. An increase in grain Zn concentration was also reported with the supplementation of the rice crop with Zn fertilizers [39,40]. Zn concentrations as well as its uptake in rice shoots followed a cubic response, but in grains the response was quadratic, and the concentrations and uptake of Zn in shoots were higher with the application of 120 mg Zn kg−1. In our study, we noticed that the grains Zn concentrations were lower than the shoots’ Zn concentration [41]. Zinc contents in rice plants reduced quadratically with the passage of time [42]. They reported that the Zn content in rice shoots at 19 days after sowing was 40 mg kg−1 and reduced to 26 mg kg−1 at maturity. The reduction in Zn contents in rice plants with the progression of plant age is related to an increase in shoot dry weight and the decline in Zn content in annual crops was due to the dilution effect [43]. High Zn application produced a considerable improvement in Zn uptake and Zn contents in shoots, regardless of genotype. Few researchers [44,45,46] are of the view that soil application of Zn had a very little increasing effect on Zn concentrations of brown rice, while foliar Zn application caused greater increases. In the case of the maize crop, [33] reported improvement in growth and yield was observed due to foliar Zn applications especially under water stress conditions. According to [47], the combined application of foliar + soil is superior for both grain yield and grain Zn intake. On the other hand, rice grown under Zn deficient soils not only reduced growth [30] and dry matter partitioning [4], but also reduced yield and yield components (data not shown) and had poor nutritional quality in terms of low Zn concentrations in both grains and straw. Likewise, [48] reported that rice grain yield and quality was reduced in Zn deficient soils.

3.4. Differences in Zinc Concentrations in Grains and Straw of Coarse vs. Fine Rice Genotypes

Among the three rice genotypes under study (Table 4), the coarse genotype “Pukhraj” the hybrid rice, had more Zn in their grains (18.89 mg kg−1), followed by another coarse genotype, F-Malakand (18.29 mg kg−1), while the minimum Zn concentrations in grains (17.78 mg kg−1) was recorded for the fine rice genotype “B-385”. Interestingly, the increase in Zn concentration in rice grains showed a positive relationship with grain yield in this study. However, no significant differences in straw Zn concentrations were observed in the three rice genotypes under study (Table 4). In a screening study including about 1000 rice genotypes by [49], it has been found that there was a significant difference in the grains’ Zn concentrations in different rice genotypes (e.g., 13.5–58.4 mg Zn kg−1). The increase in Zn uptake by rice genotypes could be attributed to the difference in the availability of Zn in the root zone [50]. The greater bioavailability of Zn in the grains of rice is a nice-looking and valuable strategy for solving the Zn deficiency related to health problems globally [51,52]. In the case of wheat crops, [53] found that genotype H6712 was the most tolerant of Zn deficiency, followed by M19, and then X13. Specifically, the genotype H6712 had the highest Zn uptake efficiency among the three wheat genotypes under study. Reference [54] stated that some genotypes had the potential to extract Zn from soil pools that are not freely available. According to [55], high grain Zn uptake by rice genotypes is considered a good quality factor that could increase the nutritional value of the grains for humans. According to [56,57], genetic differences in rice genotypes exist in terms of Zn content, and the higher Zn content in rice grains is very important for human health [17,58,59]. The development of crop genotypes with greater capacity to attain greater amounts of both Zn and P from soil is a cost-effective means to improve nutrient use efficiency in rice.
It is clear from Table 5 that years had a significant effect on the Zn content in rice grains. The mean Zn concentration in rice grain was higher (19.06 mg kg−1) in Y2 compared to Y1 (17.60 mg kg−1). The difference in the Zn concentration in the two years may be attributed to the fluctuation in the temperatures and rainfall data [5]. Moreover, the higher Zn concentration in Y2 may be attributed to more soil Zn in the second year than the first year of the experiment [5]. Likewise, both rice and wheat productivity were higher in Y2 than Y1 and showed a positive relationship with Zn concentration in rice grains.

3.5. Interactions

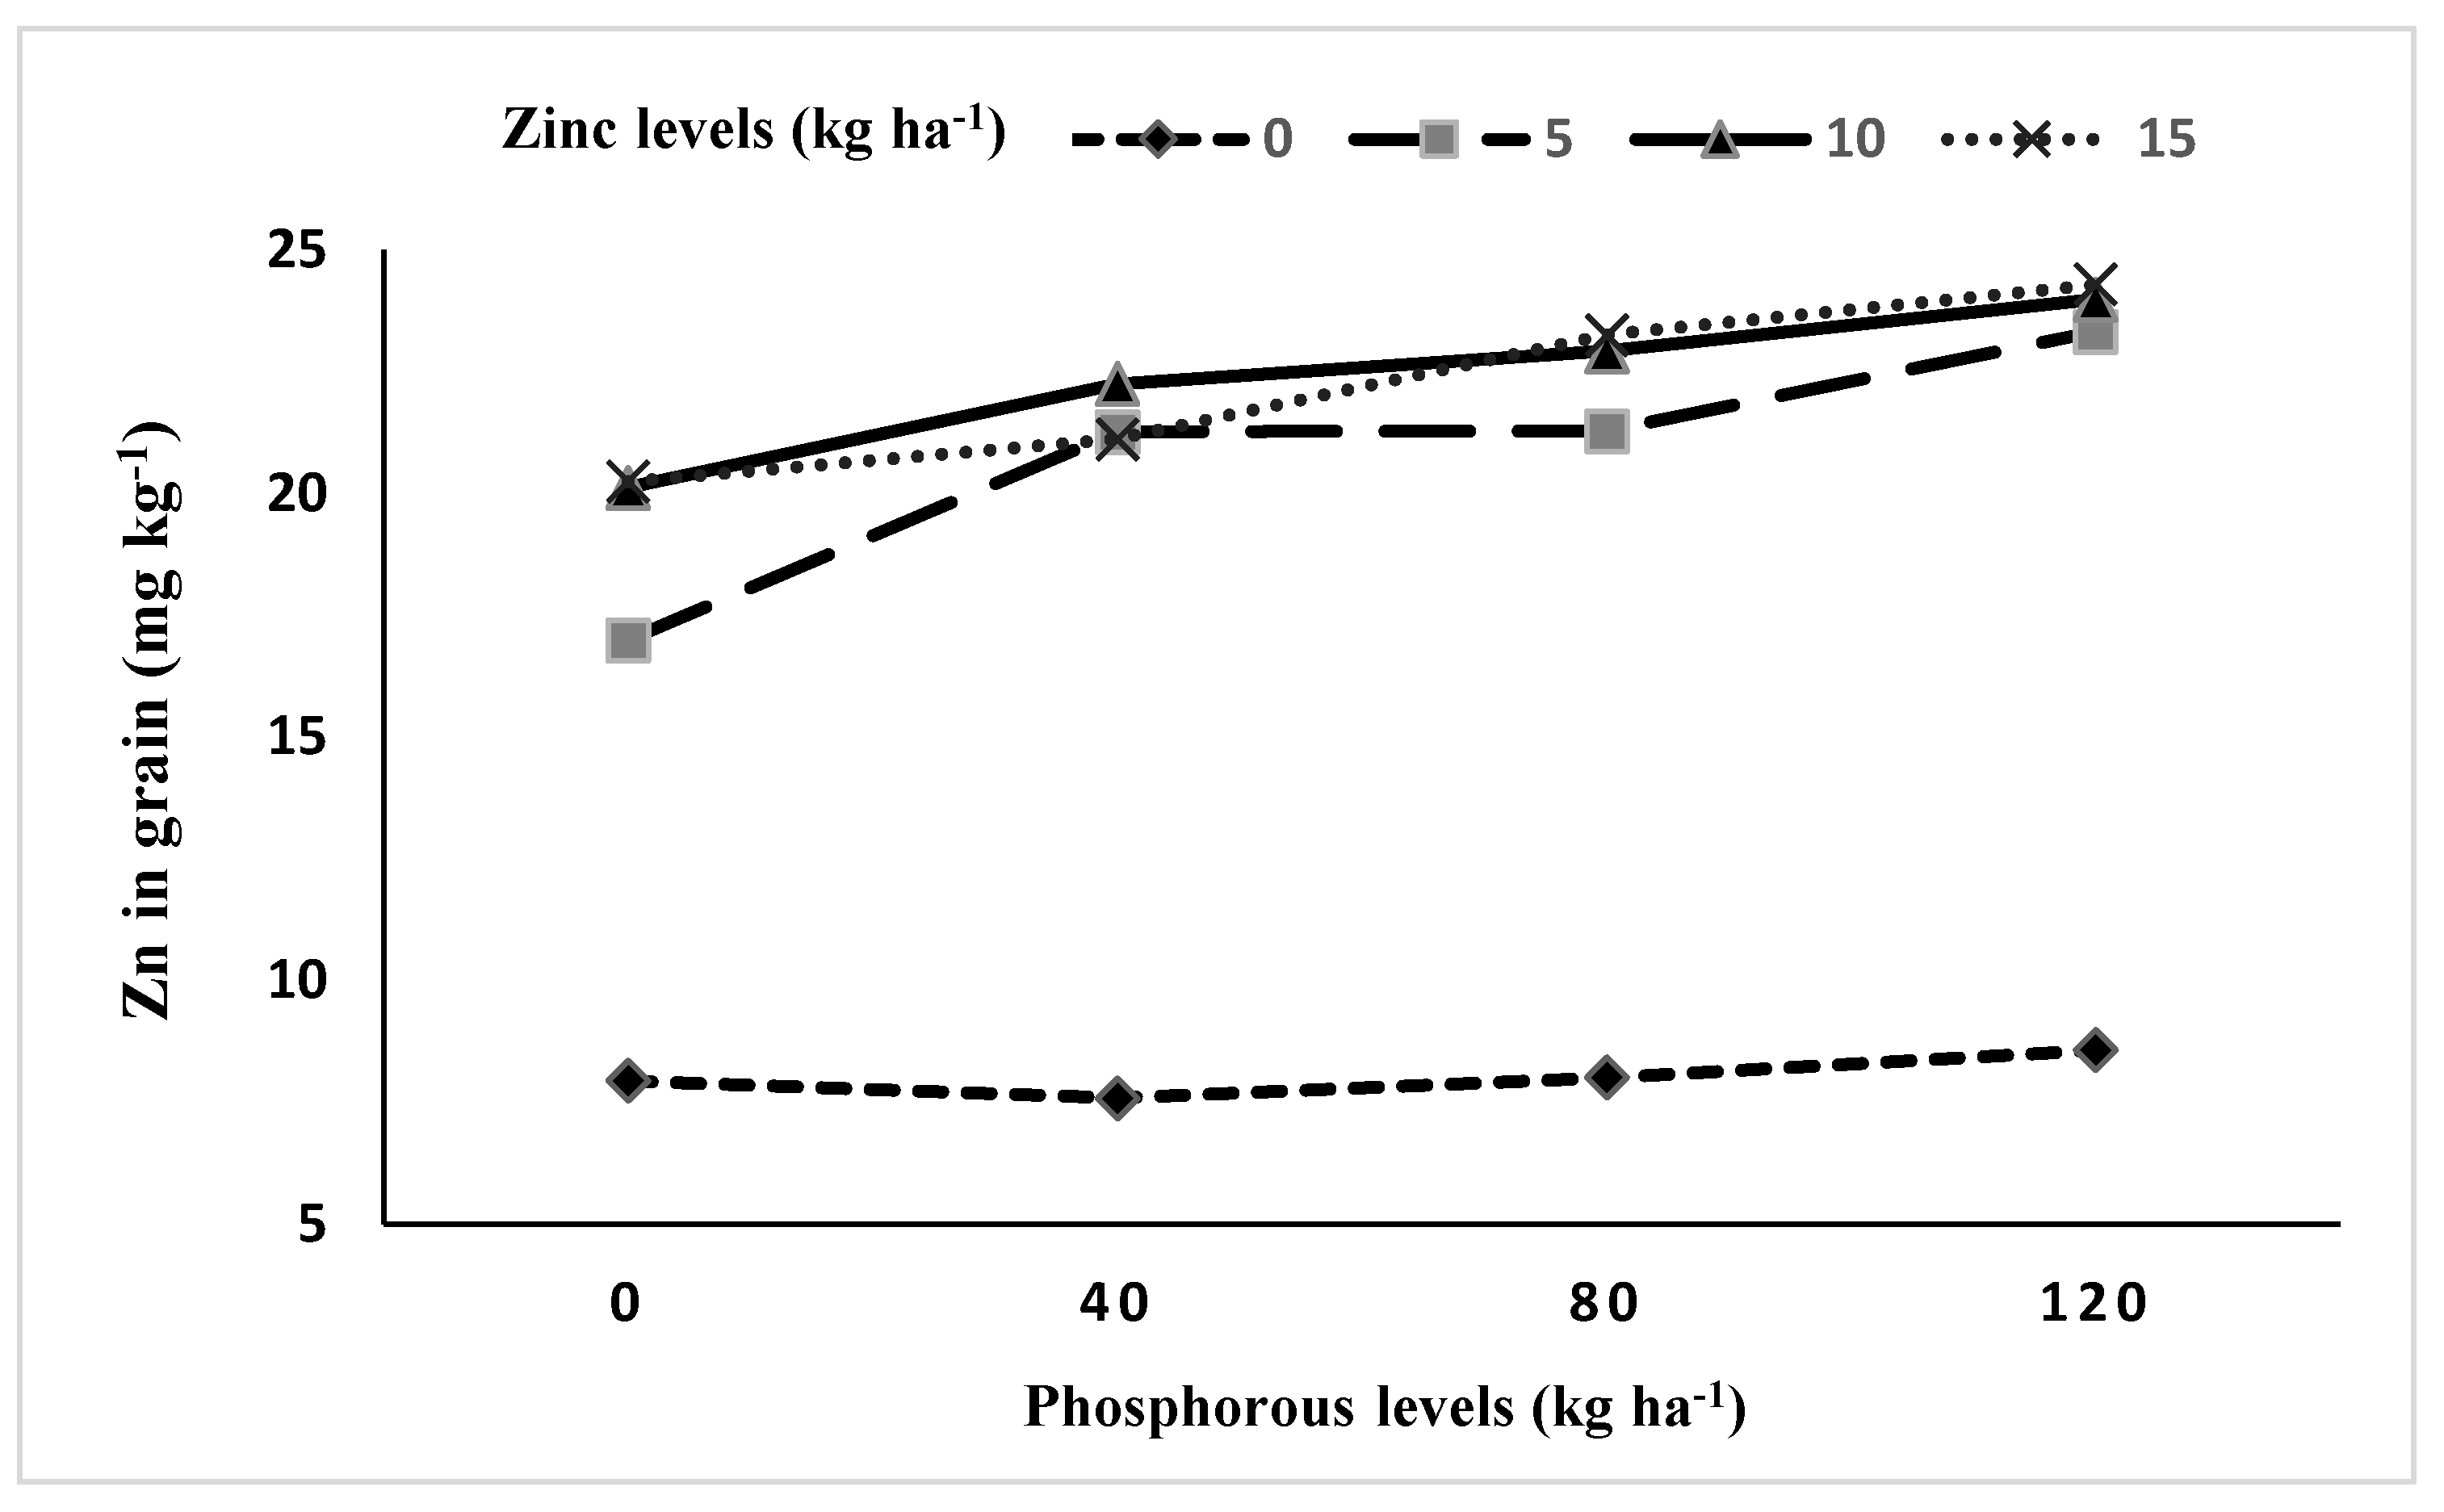
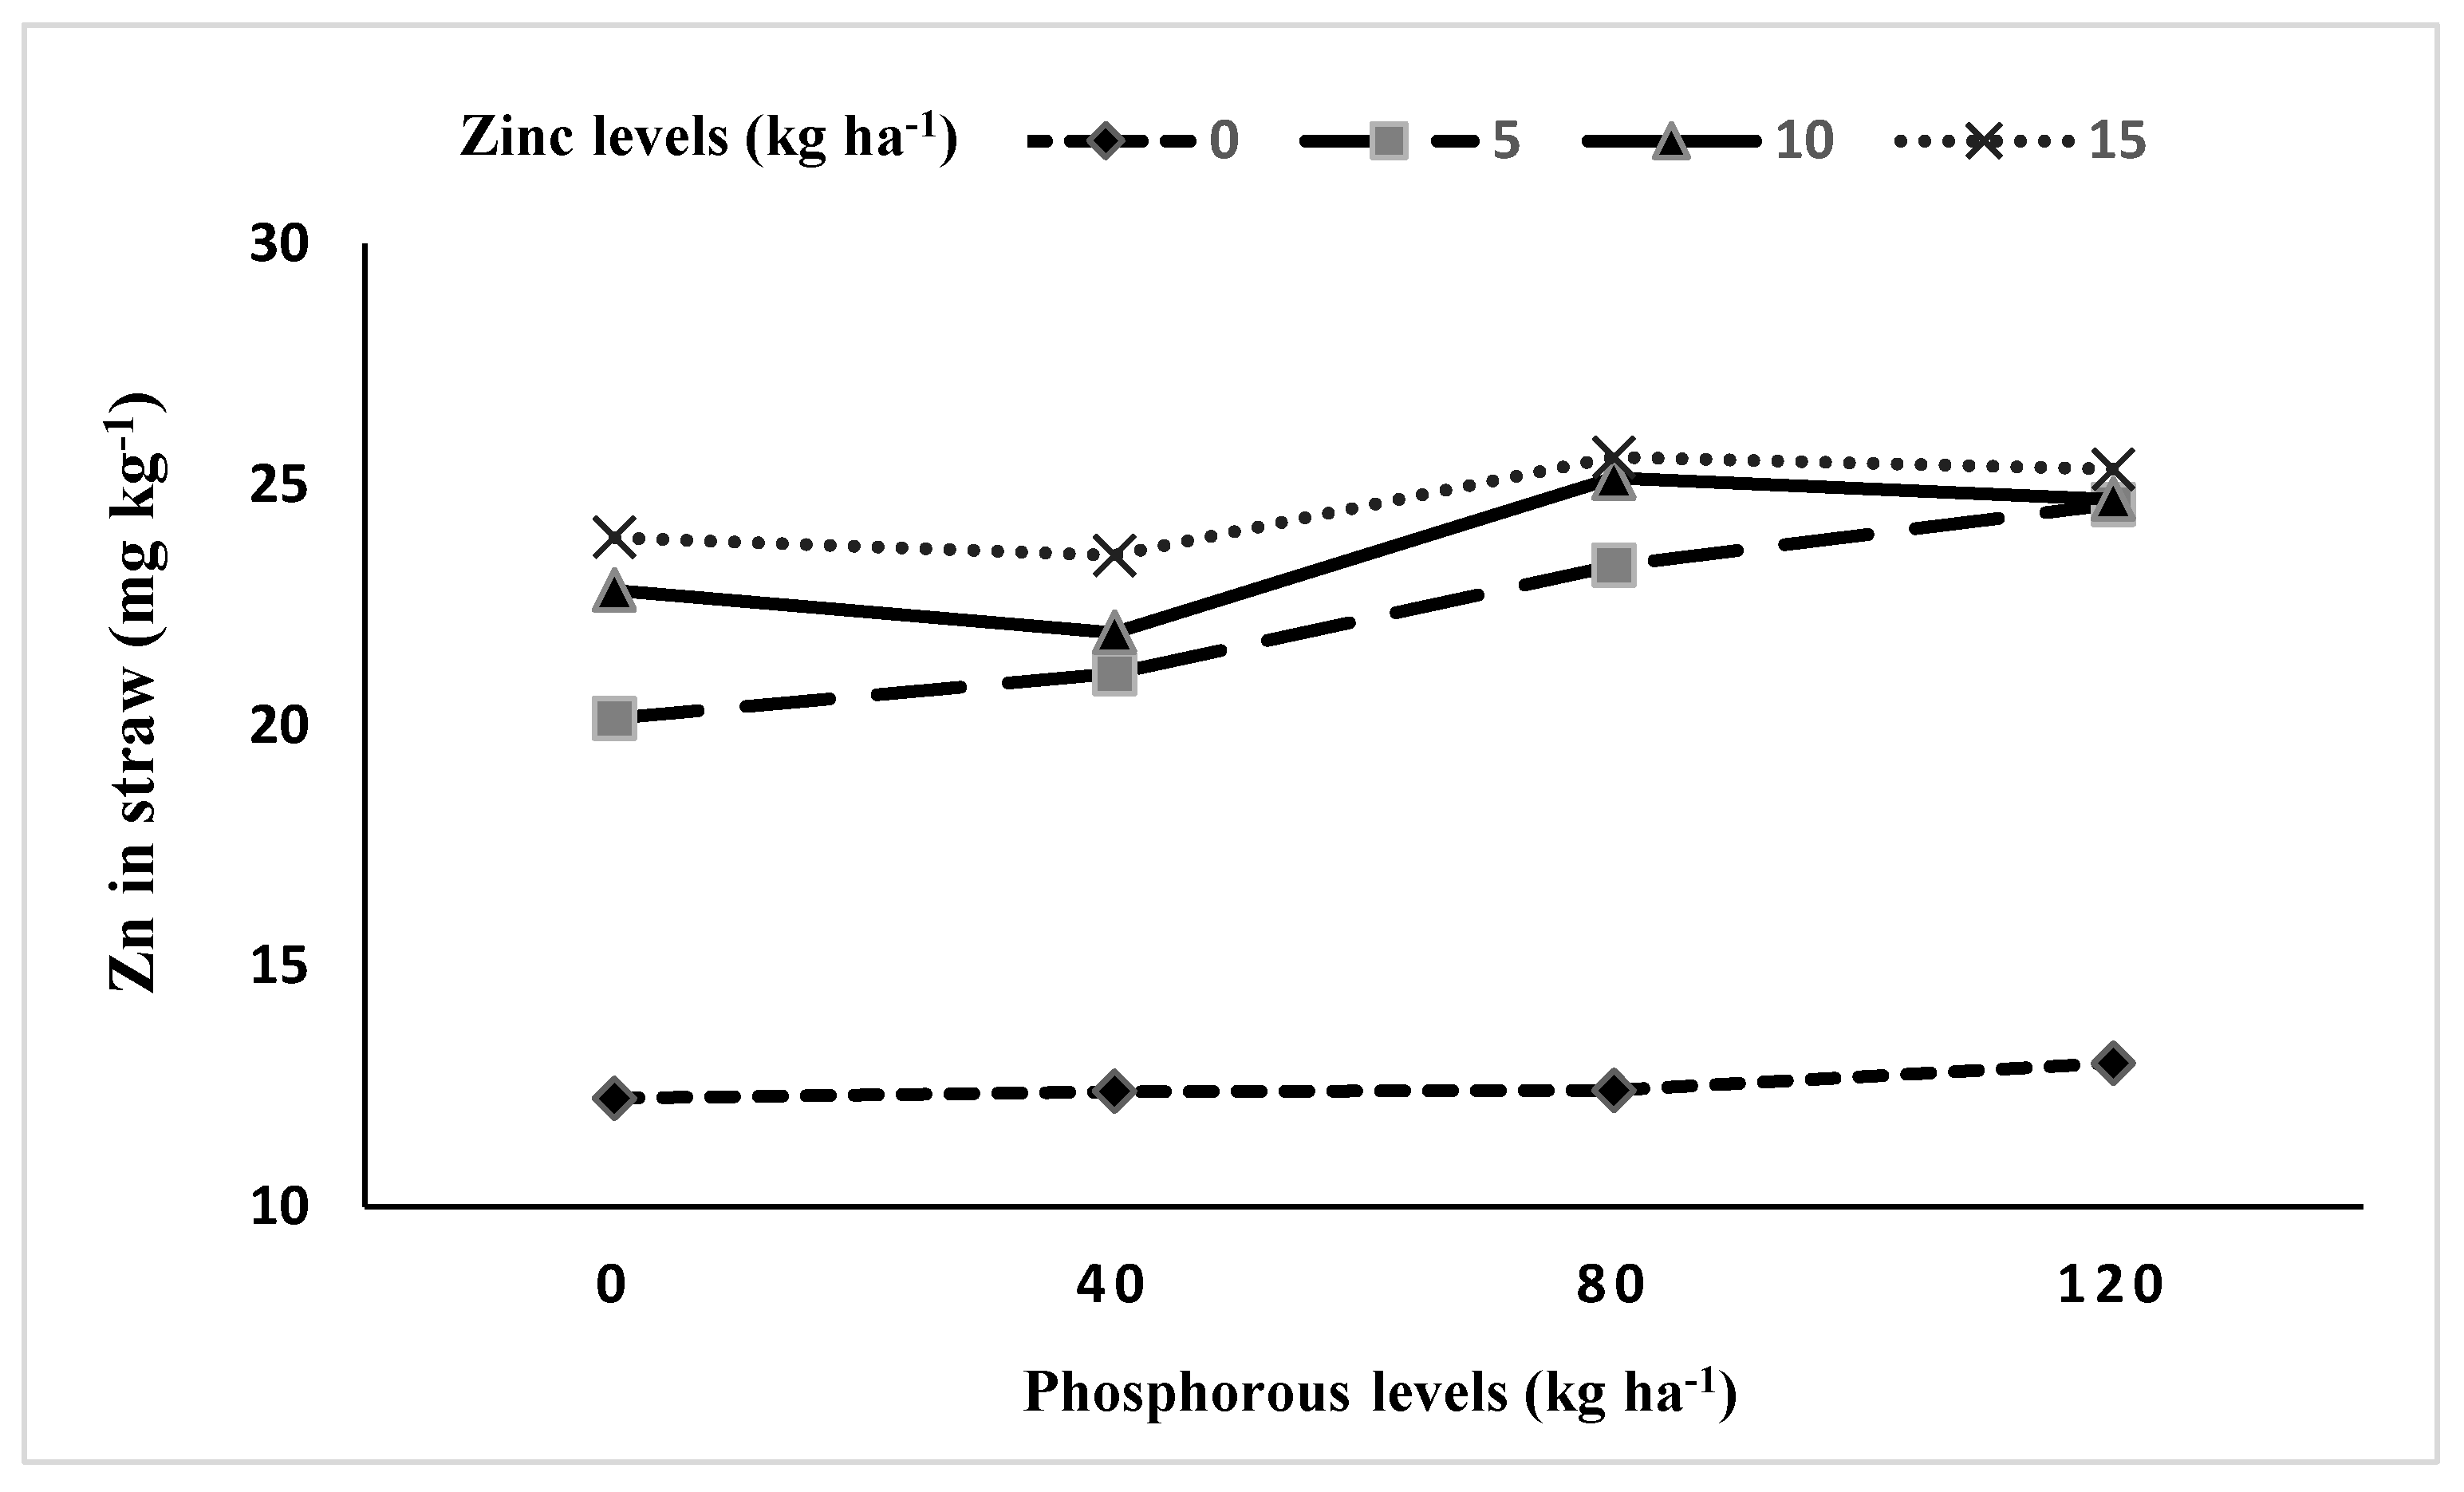
3.5.1. Interaction between Phosphorus and Zinc (P × Zn)

Phosphorus is the most important element that interferes with zinc uptake by plants. Interaction between P × Zn confirmed that the increase in Zn levels and an increase in P level up to 80 kg ha−1 increased Zn concentrations in rice grains (Figure 2). The Zn concentrations were significantly reduced at all applied P levels when Zn was not applied. The increase in Zn level to the highest level while increasing P levels up to 80 kg ha−1 increased Zn concentrations in rice straw (Figure 3). The application of P to soil caused a reduction in shoot Zn concentrations in maize and sunflower; however, in brassica applied P caused a considerable increase in shoot Zn concentrations. Large amounts of P fertilizers applied to soils without Zn addition can reduce tissue Zn contents [60,61]. Reduction in Zn concentrations due to high P supply will reduce food quality [62] and will spread the Zn deficiency in humans [63]. There is evidence for the precipitation of Zn by high P in plants being the primary mechanism responsible for the syndrome of Zn deficiency leading to the formation of P toxicity. An increase in P level improved plant growth and yield [64,65]; it may slow down Zn uptake by the plants [66]. According to [67], the N, P, and K concentrations in rice increased with NPK, FYM, and Zn, but there was a major decrease in P contents with Zn application. Zinc concentrations were higher in those plots where Zn, and Zn + P were applied along with NPK fertilizer. Zn availability in soil has a negative correlation with higher levels of phosphate and pH values, which caused the Zn deficiency problem in rice [68]. Likewise, the research of [69] also confirmed that the application of higher rates of macronutrients increased the Zn availability to plants. The development of crop genotypes with greater capacity to attain both Zn and P from soil and chemical fertilizer sources is a cost-effective means for improving nutrient use efficiency in rice [70]. According to [38], straw and paddy yield showed an increasing trend with integrated use of 120 kg N + 90 kg P2O5 + 9 kg Zn ha−1. Our results published from the same study confirmed that combined application of both P + Zn at higher rates improved the leaf area index [31], increased dry matter partitioning into various plant parts, increased yield components and grain yield, and thus increased Zn uptake by rice plants. Reference [71] reported that Zn and P application either alone or in combination showed a significantly positive effect on the grain and straw yield of rice (in press). Similarly, [72] found that grain yield and biomass yield in rice reached a maximum level with the combined application of 33 kg P + 12 kg Zn ha−1.

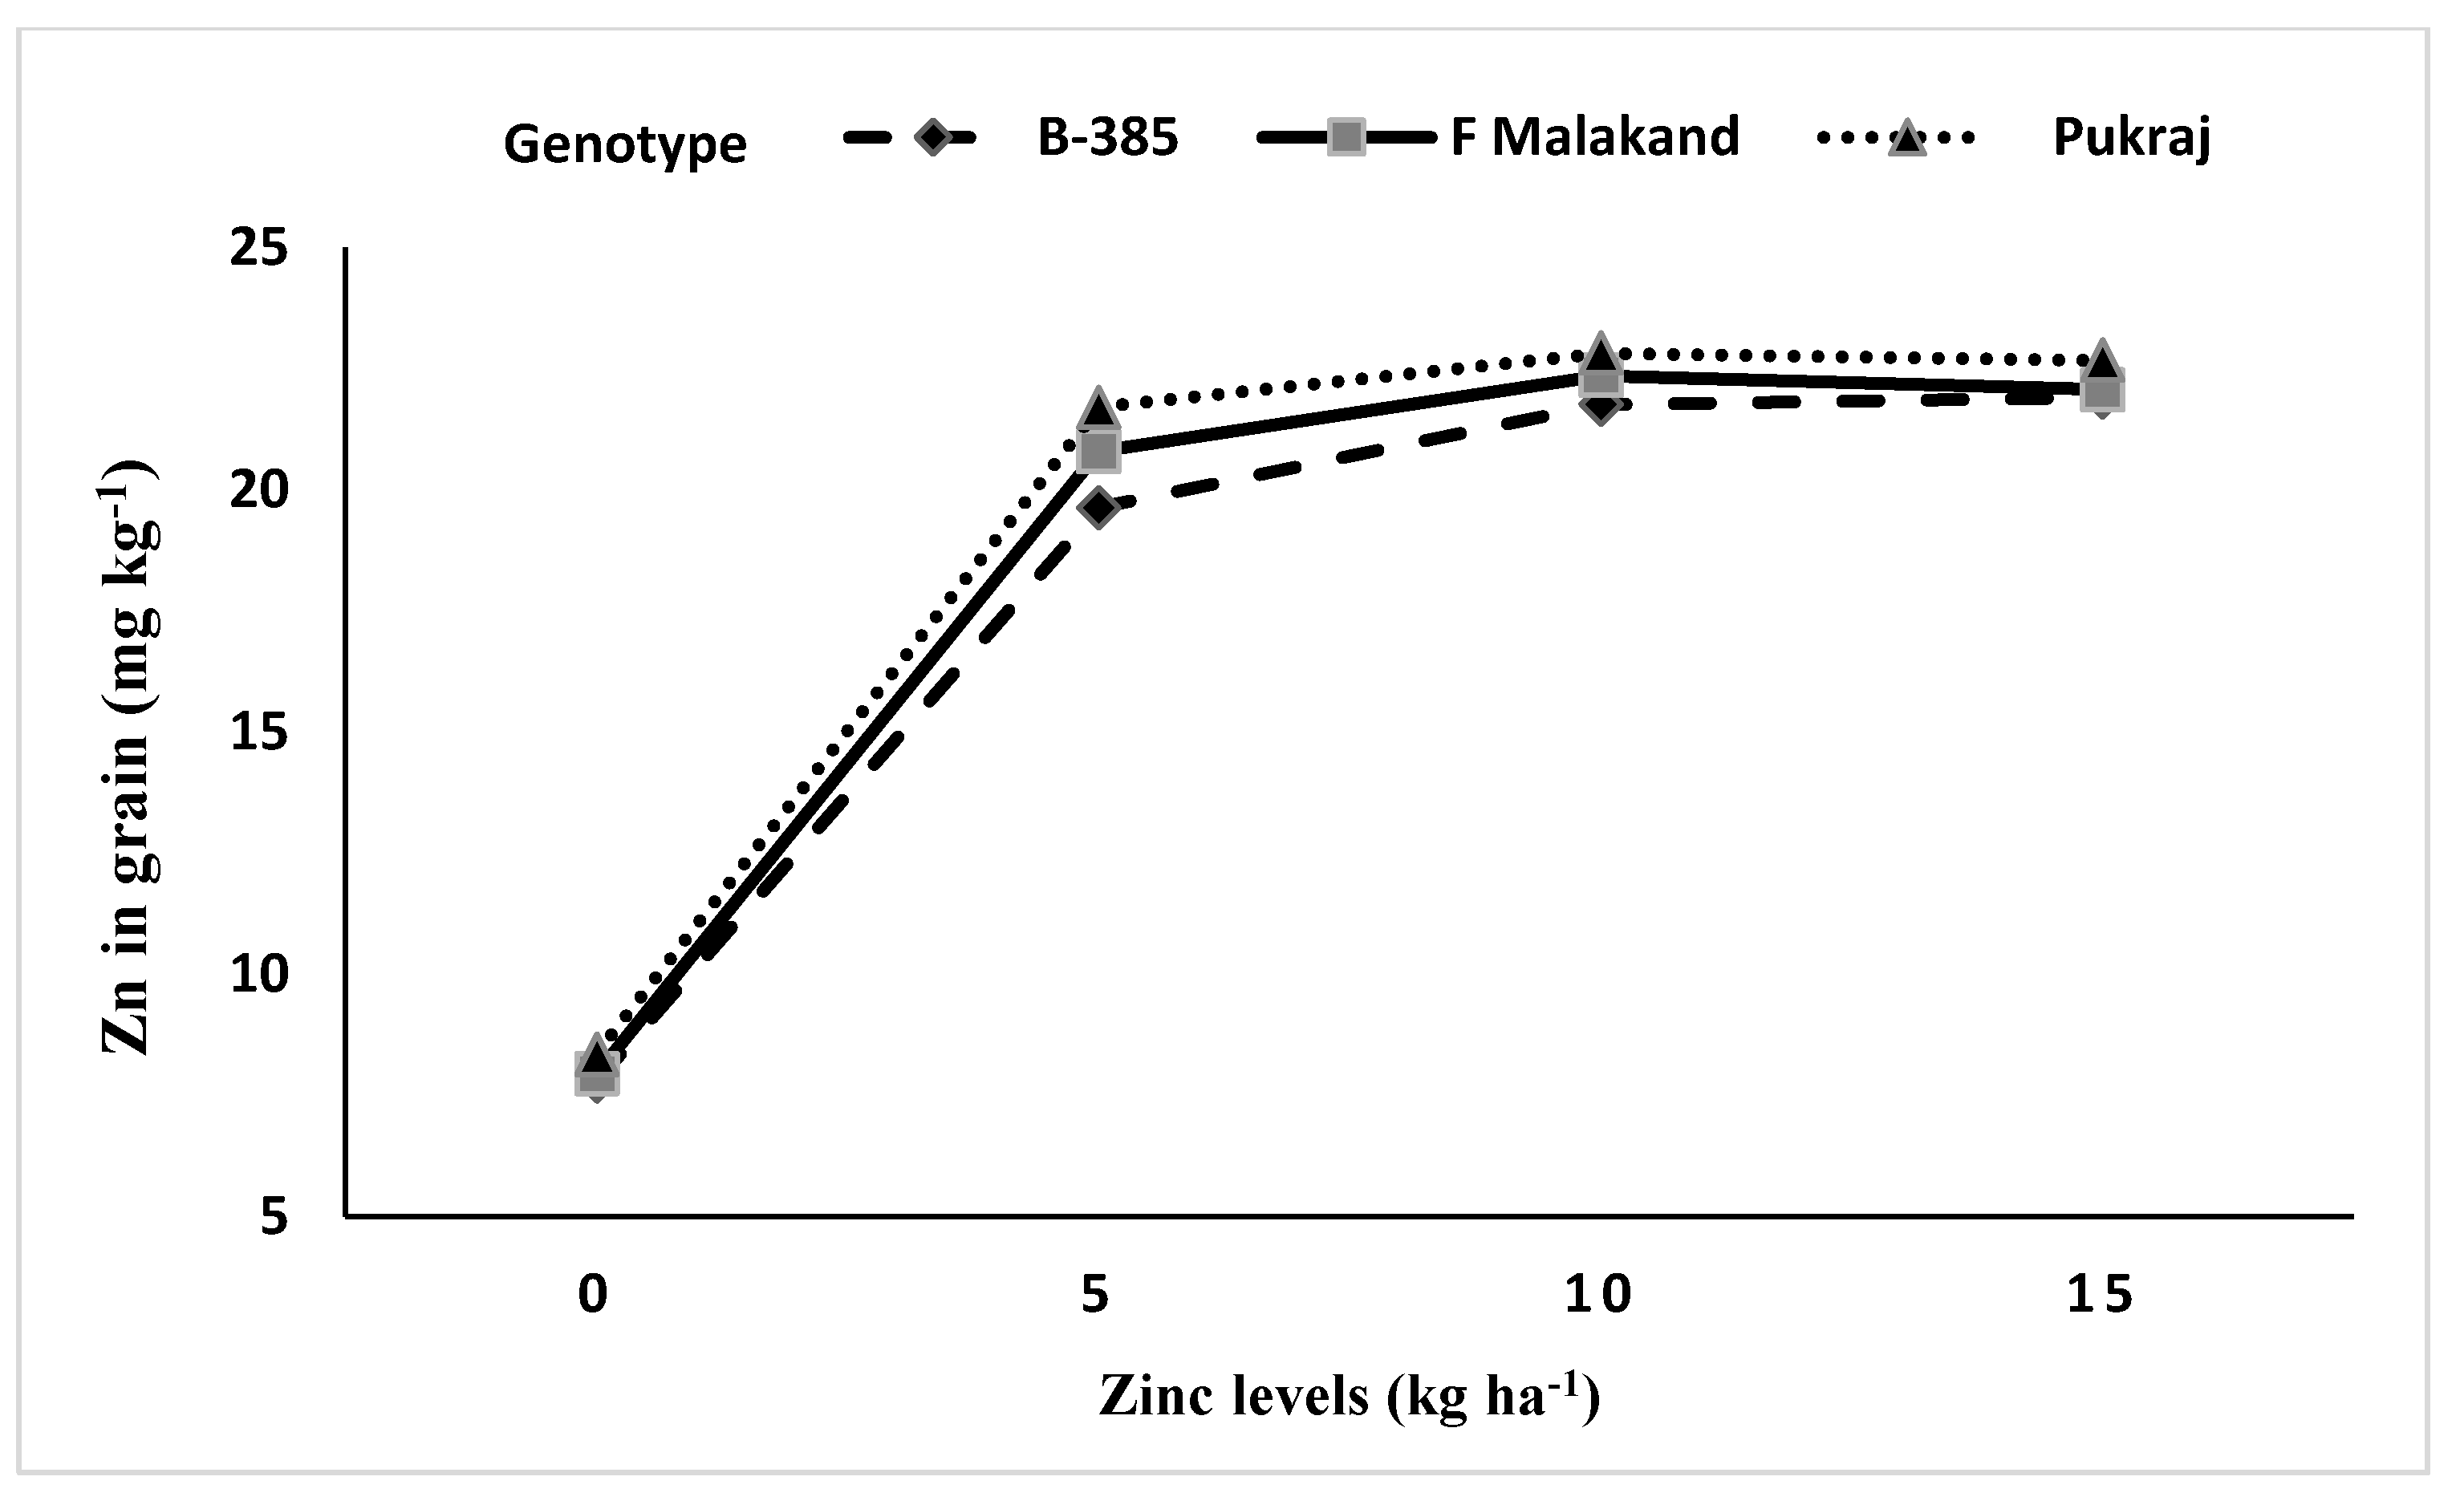
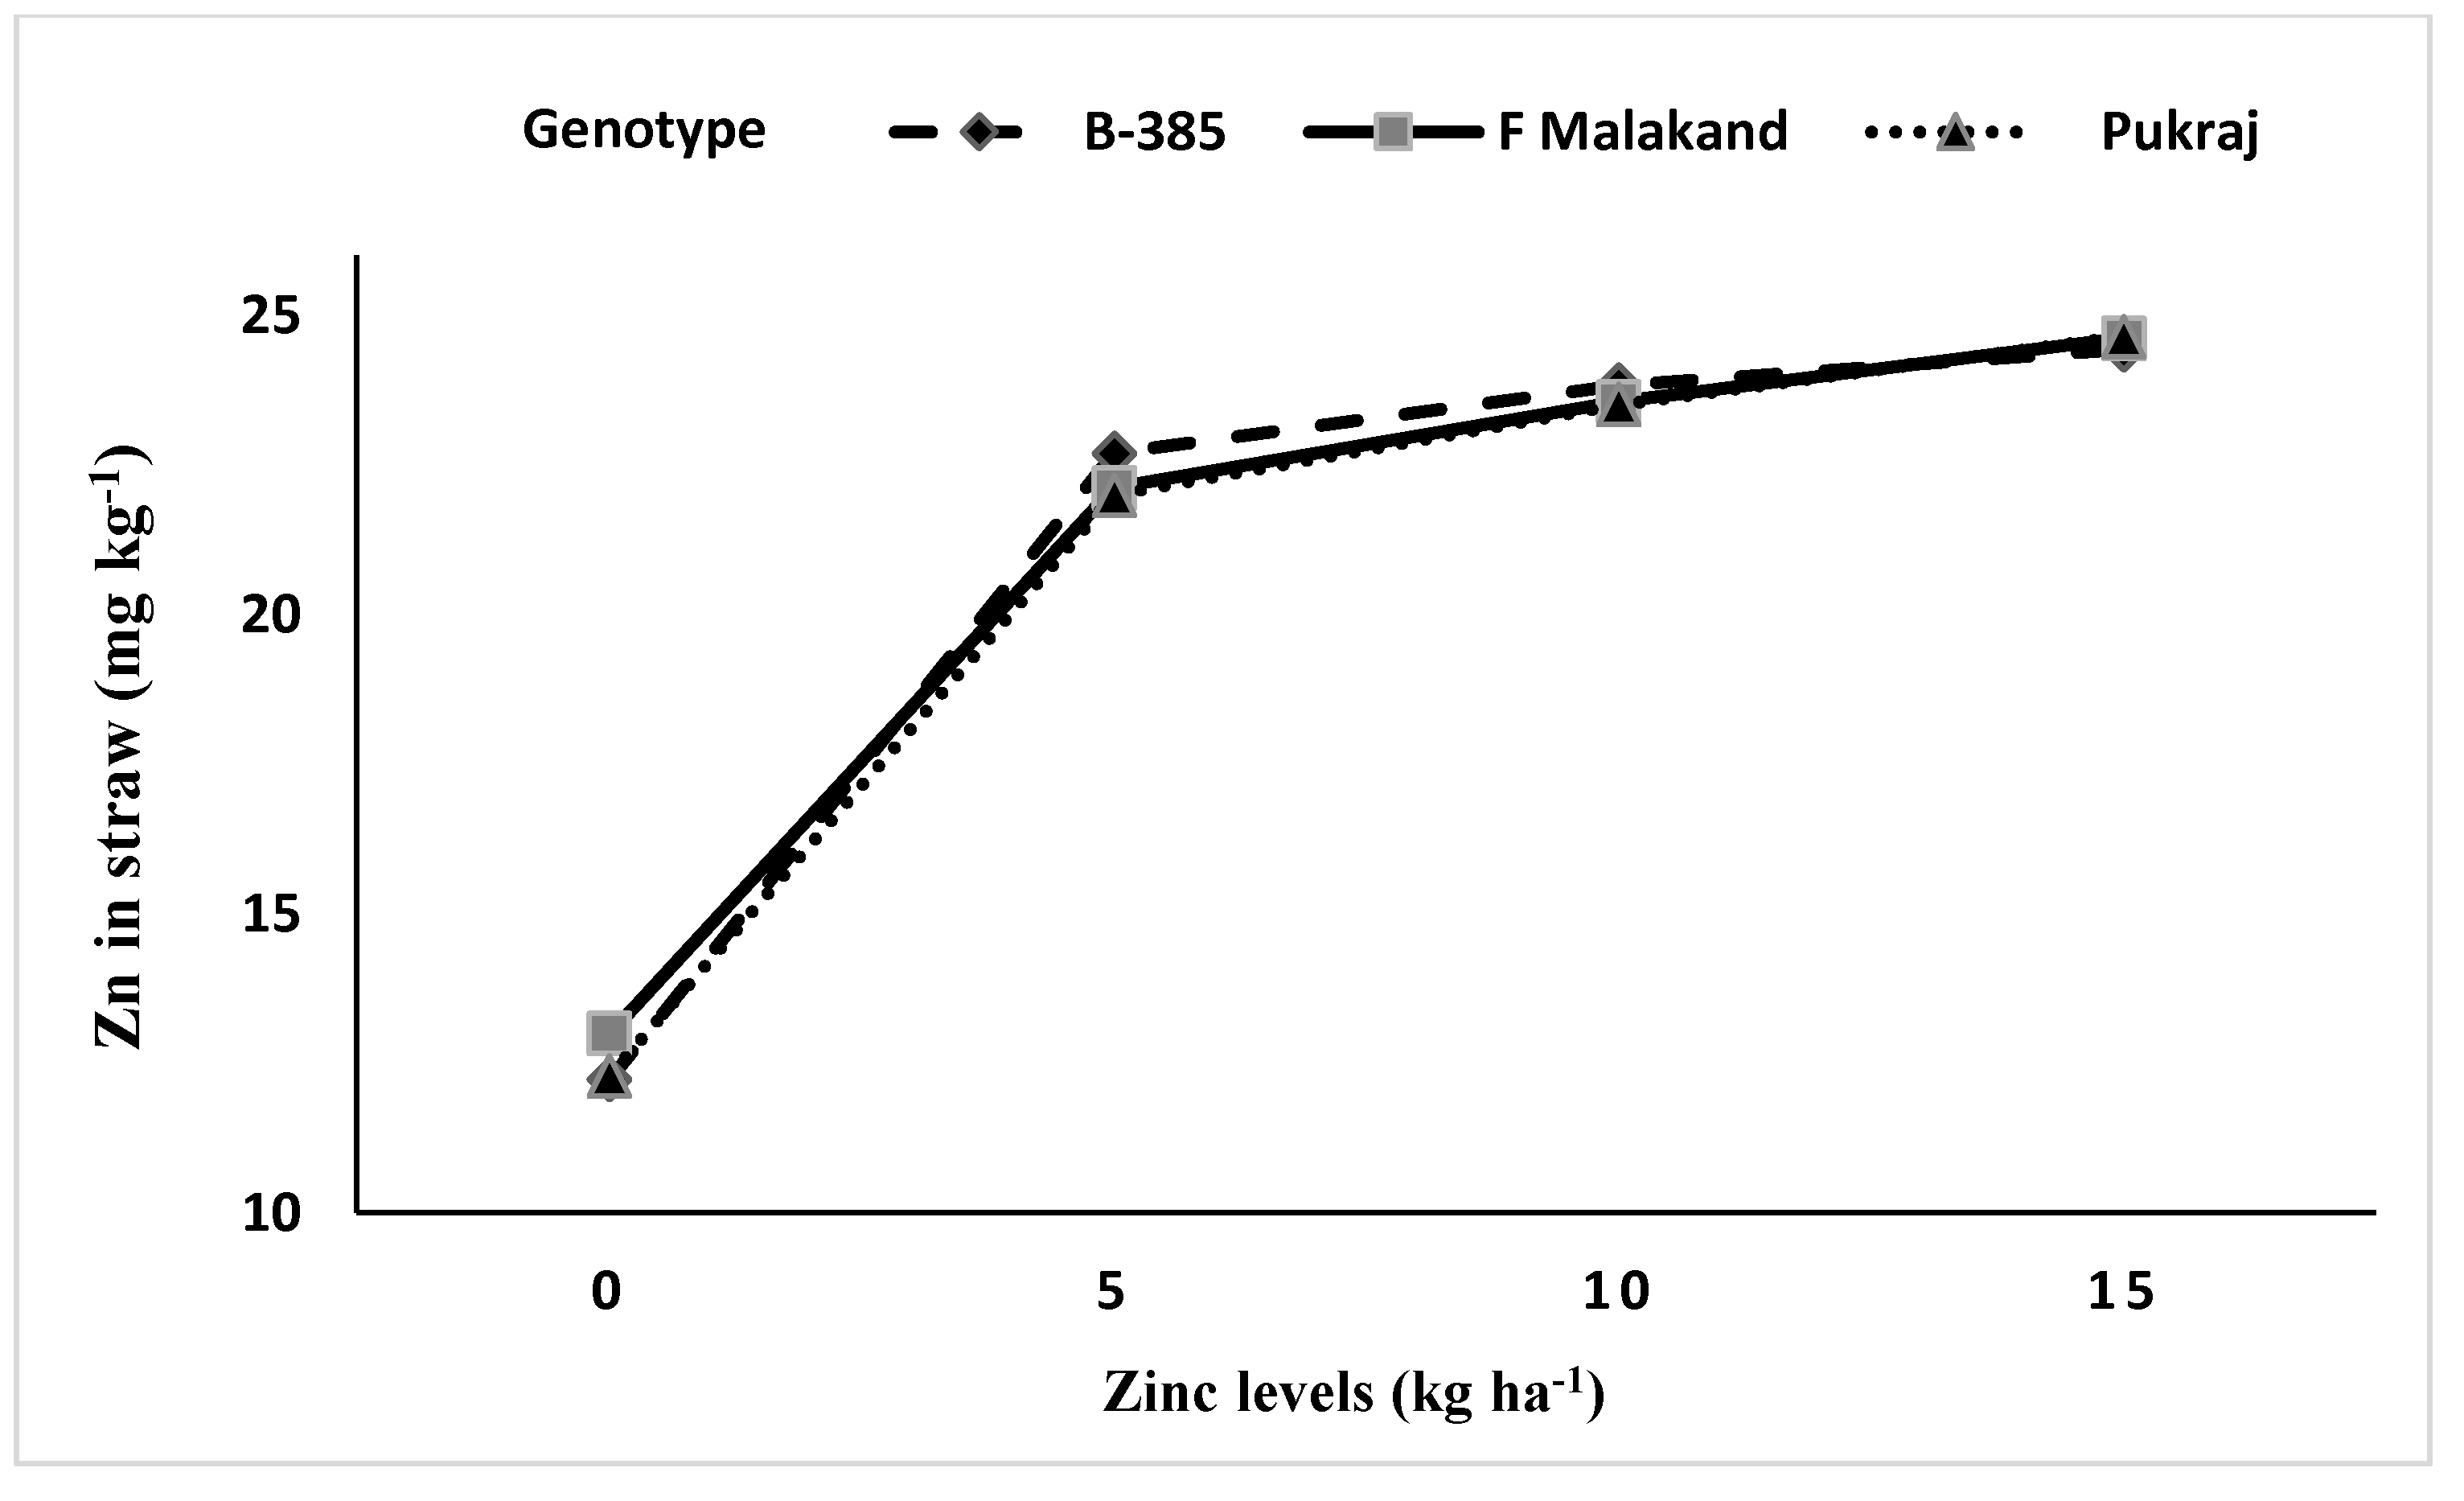
3.5.2. Interaction of Genotypes with Phosphorus (P × G) and Zinc (Zn × G)

Interaction between P × G revealed that an increase in P level increased Zn concentrations in grains of all three rice genotypes under study (Figure 4). The hybrid rice “Pukhraj” had produced higher grain Zn concentrations when P was not applied when compared with the other two genotypes. Interaction between Zn × G indicated that an increase in the Zn level up to 10 kg ha−1 increased Zn concentrations in grains of all genotypes (Figure 5). In the case of rice straw, Zn concentrations in rice straw of all three genotypes increased with an increase in Zn levels resulting in significant Zn × G interaction (Figure 6). The Zn concentrations in rice straw of all three genotypes were drastically reduced with no application of Zn (Figure 6). Agronomic biofortification has shown inconsistent results but a combination of genetic and agronomic biofortification strategies may be more effective [73] for increasing Zn content in rice grains. Our findings are supported by [74] by reporting an increase in Zn uptake with an increase in Zn levels while growing higher-yielding rice genotypes. The large increase in growth [4,75] and yield (in press) of high yielding coarse rice genotypes, however, have caused considerable decreases in the concentrations of Zn in the soils [5] and Zn concentration in plants due to the dilution effect [19,73].

3.6. Years Interaction with Phosphorus (Y × P), Zinc (Y × Zn) and Genotypes (Y × G)

Interaction between years and phosphorus (Y × P) indicates that an increase in P level increased rice Zn concentrations (grains and straw) in both years (Table 2). Interaction between Y × Zn revealed that in year two Zn concentrations in grains and straw (Table 3) increased with an increase in Zn level compared to Y1 resulting in significant Y × Zn interactions. However, Zn concentrations drastically reduce in the control plots (Zn not applied) and the reduction was more in year two than in year one resulting in significant Y × Zn interactions (Table 2 and Table 3). The differences in P and Zn concentrations in the two years probably may be due to the change in the weather data, and soil P and Zn availability [5]. Reference [46] also reported a significant variation in rice grain Zn concentrations (8 to 47 mg kg−1) under different soil environments. According to [6], rice grain Zn concentration is affected by many plant and environmental factors.
Interaction between Y × G (Table 4) indicated that Zn concentrations in grains of all three rice genotypes increased in Y2 as compared with Y1. However, the increase was more in coarse genotypes (Pukhraj and F-Malakand) than in fine genotypes (B-385). Mean data for years revealed that more Zn concentrations in grains (19.04 mg kg−1) were calculated in Y2 than Y1 (17.60 mg kg−1) as shown in Table 5. According to [17], the genetic and environmental factors decrease grain Zn content in cereal crops, which are responsible for poor human health. While [6] reported that better management of genetic and environmental factors could increase Zn content in grain crops. The differences in Zn concentration in different years (Table 5) due to changes in Zn levels may be due to the change in the weather data of both years [5]. The differences in Zn concentration in different years due to change in genotypes (coarse vs. fine) probably may be due to the difference in the genetic makeup, the difference in the Zn uptake efficiency of genotypes, and availability plant nutrients especially Zn in the soils [33]. These results indicate that a change in environmental conditions has significant impact on rice grain Zn concentrations. The mechanisms of Zn mobilization, uptake, translocation remobilization, and grain loading in different environments are reported earlier by [76,77,78]. According to [79], both plant and soil factors are important in determining Zn bioavailability under rice-based systems.

4. Conclusions

Based on our results, we concluded that Zn biofortification in different parts of rice plants could be achieved: (A) through plant breeding programs and (B) through best management practices e.g., (1) application of higher rates of zinc and phosphorus fertilization under P and Zn deficient soils and (2) combined application of phosphorus and zinc under P and Zn deficient soils. Increasing grain Zn concentration is important for human nutrition but increasing straw Zn concentration in rice straw may be most important for animals’ health because rice straw is a major feed for animals in the rice-based system globally. The differences in the two-years data suggested that (1) for different agroecological zones, different rice genotypes screening is needed and (2) for different agroecological zones, study on different rates of phosphorus and zinc as the sole application and in various combinations is needed. Future research to study the interaction between P × Z on the biofortification of Zn in grains and straw of other cereals crops (wheat, barley, maize, sorghum, etc.) is needed in different environmental conditions.

Author Contributions

A. designed and supervised the research project, drafted and revised the manuscript, and I. (Inamullah) carried out the lab and field studies. All others M.S.A., M.S.E., J.A., A.M., S.K., I. (Imran), M.A., N.K., S.U., and I.A. checked and reviewed the graphs, tables, and text. All authors have read and agreed to the published version of the manuscript.

Funding

This research was conducted for the PhD degree requirement of Mr. Inamullah and none of the donor agencies sponsored this research project.

Acknowledgments

We are highly thankful to Paigham Shah, The University of Agriculture Peshawar (retired) for the statistical analysis of the data. We are also thankful to the Department of Agronomy, The University of Agriculture Peshawar, Pakistan for helping and encouraging us to conduct this research work at a farmer’s field in Malakand (Batkhela). The authors extend their appreciation to the researchers supporting project number (RSP-2020/173) of King Saud University, Riyadh, Saudi Arabia.

Conflicts of Interest

The authors declare that they have no conflict of interest.

References

  1. FAOSTAT. Crops/Regions/World List/Production Quantity (Pick Lists), Rice (Paddy), 2014; Corporate Statistical Database; UN Food and Agriculture Organization: Rome, Italy, 2017. [Google Scholar]
  2. Fageria, N.K.; Slaton, N.A.; Baligar, V.C. Nutrient Management for Improving Lowland Rice Productivity and Sustainability. Adv. Agron. 2003, 80, 63–152. [Google Scholar]
  3. Fageria, N.K. Yield physiology of rice. J. Plant Nutr. 2007, 30, 843–879. [Google Scholar] [CrossRef]
  4. Amanullah; Inamullah. Dry matter partitioning and harvest index differ in rice genotypes with variable rates of phosphorus and zinc nutrition. Rice Sci. 2016, 23, 78–87. [Google Scholar] [CrossRef] [Green Version]
  5. Amanullah; Inamullah. Residual phosphorus and zinc influence wheat productivity under rice–wheat cropping system. SpringerPlus 2016, 5, 255. [Google Scholar] [CrossRef] [PubMed] [Green Version]
  6. Welch, R.M.; Graham, R.D. Breeding crops for enhanced micronutrient content. Plant Soil 2004, 245, 205–214. [Google Scholar] [CrossRef]
  7. Hotz, C.; Brown, K.H. Assessment of the risk of Zn deficiency in populations ando ptions for its control. Food Nutr. Bull. 2004, 25, S91–S204. [Google Scholar]
  8. Boonchuay, P.; Cakmak, I.; Rerkasem, B.; Prom-U-Thai, C. Effect of different foliar zinc application at different growth stages on seed zinc concentration and its impact on seedling vigor in rice. Soil Sci. Plant Nutr. 2013, 59, 180–188. [Google Scholar] [CrossRef] [Green Version]
  9. Barnett, J.B.; Hamer, D.H.; Meydani, S.N. Low zinc status: A new risk factor for pneumonia in the elderly? Nutr. Rev. 2010, 68, 30–37. [Google Scholar] [CrossRef]
  10. Graham, R.D.; Knez, M.; Welch, R.M. How much nutritional iron deficiency in humans globally is due to underlying zinc deficiency? Adv. Agron. 2012, 115, 1–40. [Google Scholar] [CrossRef]
  11. Das, S.; Green, A. Importance of zinc in crops and human health. J. SAT Agric. Res. 2013, 11, 1–7. [Google Scholar]
  12. Foster, M.; Samman, S. Zinc and redox signaling: Perturbations associated with cardio vascular disease and diabete smellitus. Antioxid. Redox Signal. 2010, 13, 1549–1573. [Google Scholar] [CrossRef] [PubMed]
  13. Krebs, N.F.; Miller, L.V.; Hambridge, K.M. Zinc deficiency in infants and children: A review of its complex and synergistic interactions. Paediatr. Int. Child Health 2014, 34, 279–288. [Google Scholar] [CrossRef] [PubMed]
  14. Stein, A.J. Rethinking the measurement of under nutrition in a broader health context. Glob. Food Secur. 2014, 3, 193–199. [Google Scholar] [CrossRef] [Green Version]
  15. Behera, S.K.; Shukla, A.K.; Singh, M.V.; Wanjari, R.H.; Singh, P. Yield and zinc, copper, manganese and iron concentration in maize (Zea mays L. ) grown on vertisol as influenced by zinc application from various zinc fertilizers. J. Plant Nutr. 2015, 38, 1544–1557. [Google Scholar] [CrossRef]
  16. FAO (2018). Available online: www.fao.org/docrep/006/y4011e/y4011e04.htm (accessed on 17 July 2018).
  17. Nakandalage, N.; Nicolas, M.; Norton, R.M.; Hirotsu, N.; Milham, P.J.; Seneweera, S. Improving Rice Zinc Biofortification Success Rates Through Genetic and Crop Management Approaches in a Changing Environment. Front. Plant Sci. 2016, 7, 764. [Google Scholar] [CrossRef] [Green Version]
  18. Impa, S.M.; Johnson-Beebout, S.E. Mitigating zinc deficiency and achieving high grain Zn in rice through integration of soil chemistry and plant physiology research. Plant Soil 2012, 361, 3–41. [Google Scholar] [CrossRef]
  19. Cakmak, I.; Kutman, U.B. Agronomic biofortification of cereals with zinc: A review. Eur. J. Soil Sci. 2017, 69, 172–180. [Google Scholar] [CrossRef] [Green Version]
  20. Cakmak, I. Enrichment of cereal grains with zinc: Agronomic or genetic bio-fortification. Plant Soil 2008, 302, 1–17. [Google Scholar] [CrossRef]
  21. Amanullah; Khalid, S.; Imran; Khan, H.A.; Arif, M.; Altawaha, A.R.; Adnan, M.; Fahad, S.; Parmar, B. Organic Matter Management in Cereals Based System: Symbiosis for Improving Crop Productivity and Soil Health. In Sustainable Agriculture Reviews 29: Sustainable Soil Management: Preventive and Ameliorative Strategies; Lal, R., Francaviglia, R., Eds.; Springer: Cham, Germany, 2019. [Google Scholar]
  22. Amanullah; Iqbal, A.; Khan, A.; Khalid, S.; Shah, A.; Parmar, B.; Muhammad, A.; Amanullah. Integrated Management of Phosphorus, Organic Sources, and Beneficial Microbes Improve Dry Matter Partitioning of Maize. Commun. Soil Sci. Plant Anal. 2019, 50, 2544–2569. [Google Scholar] [CrossRef]
  23. De Steur, H.; Mogendi, J.B.; Blancquaert, D.; Lambert, W.; Van Der Straeten, D.; Gellynck, X. Genetically modified rice with health benefits as a means to reduce micronutrient malnutrition. Global status, consumer preferences, and potential health impacts of rice biofortification. In Wheat and Rice in Disease Prevention and Health; Watson, R.R., Preedy, V.R., Zibadi, S., Eds.; Academic Press: Cambridge, UK, 2014; pp. 283–299. [Google Scholar] [CrossRef] [Green Version]
  24. Fernando, N.; Panozzo, J.; Tausz, M.; Norton, R.M.; Neumann, N.; Fitzgerald, G.J. Elevated CO2 alters grain quality of two bread wheat cultivars grown under different environmental conditions. Agric. Ecosyst. Environ. 2014, 185, 24–33. [Google Scholar] [CrossRef]
  25. Mao, H.; Wang, J.; Wang, Z.; Zan, Y.; Lyons, G.; Zou, C. Using agronomic biofortification to boost zinc, selenium, and iodine concentrations of food crops grown on the loess plateau in China. J. Soil Sci. Plant Nutr. 2014, 14, 459–470. [Google Scholar] [CrossRef] [Green Version]
  26. Wessells, K.R.; Brown, K.H. Estimating the global prevalence of zinc deficiency: Results based on zinc availability in national food supplies and the prevalence of stunting. PLoS ONE 2012, 7, e50568. [Google Scholar] [CrossRef] [PubMed] [Green Version]
  27. Fageria, N.K.; Moraes, M.F.; Ferreira, E.P.B.; Knupp, A.M. Biofortification of trace elements in food crops for human health. Commun. Soil Sci. Plant Anal. 2012, 43, 556–570. [Google Scholar] [CrossRef]
  28. Hafeez, B.; Khanif, Y.M.; Saleem, M. Role of zinc in plant nutrition-A review. Am. J. Exp. Agric. 2013, 3, 374–391. [Google Scholar] [CrossRef]
  29. Fernando, N.; Panozzo, J.; Tausz, M.; Norton, R.M.; Fitzgerald, G.J.; Myers, S. Intra-specific variation of wheat grain quality in response to elevated [CO2] at two sowing times under rain-fed and irrigation treatments. J. Cereal Sci. 2014, 59, 137–144. [Google Scholar] [CrossRef]
  30. Karim, M.R.; Rahman, M.A. Drought risk management for increased cereal production in Asian least developed countries. Weather Clim. Extrem. 2015, 7, 24–35. [Google Scholar] [CrossRef] [Green Version]
  31. Amanullah; Inamullah, Z.S.; Khalil, S.K. Phosphorus and zinc interaction influence leaf area index in fine versus coarse rice (Oryza sativa L.) genotypes in Northwest Pakistan. J. Plant Stress Physiol. 2016, 2, 1–8. [Google Scholar]
  32. Begum, M.C.; Islam, M.; Sarkar, M.R.; Azad, A.S.; Huda, A.K.M.N.; Kabir, A.H. Auxin signaling is closely associated with Zn efficiency in rice (Oryza sativa L.). J. Plant Interact. 2016, 11, 124–129. [Google Scholar] [CrossRef]
  33. Amanullah; Saleem, A.; Iqbal, A.; Fahad, S. Foliar phosphorus and zinc application improve growth and productivity of maize (Zea mays L.) under moisture stress conditions in semi-arid climates. Microb. Biochem. Technol. 2016, 8, 433–439. [Google Scholar] [CrossRef] [Green Version]
  34. Phattarakul, N.; Rerkasem, B.; Li, L.J.; Wu, L.H.; Zou, C.Q.; Ram, H.; Cakmak, I. Biofortification of rice grain with zinc through zinc fertilization in different countries. Plant Soil 2012, 361, 131–141. [Google Scholar] [CrossRef]
  35. Soltanpour, P.N. Use of AB-DTPA to evaluate elements availability and toxicity. Comm. Soil Sci. Plant Anal. 1985, 16, 323–338. [Google Scholar] [CrossRef]
  36. Steel, R.G.D.; Torrie, J.H.; Dickey, D. Principles and Procedures of Statistics; McGraw-Hill: New York, NY, USA, 1996. [Google Scholar]
  37. Haldar, M.; Mandal, L.N. Effect of phosphorus and zinc on the growth and phosphorus, zinc, copper, iron and manganese nutrition of rice. Plant Soil 1981, 59, 415–425. [Google Scholar] [CrossRef]
  38. Khan, P.; Memon, M.Y.; Imtiaz, M.; Depar, N.; Aslam, M.; Memon, M.S.; Shah, J.A. Determining the zinc requirements of rice genotype sarshar evolved at NIA Tandojam. Sarhad J. Agric. 2012, 28, 1–7. [Google Scholar]
  39. Ishimaru, Y.; Bashir, K.; Nishizawa, N.K. Zn uptake and translocation in rice plants. Rice 2011, 4, 21–27. [Google Scholar] [CrossRef] [Green Version]
  40. Rengel, Z. Availability of Mn, Zn and Fe in the rhizosphere. J. Soil Sci. Plant Nutr. 2015, 15, 397–409. [Google Scholar] [CrossRef] [Green Version]
  41. Fageria, N.K.; Dos Santos, A.B.; Cobucci, T. Zinc nutrition of lowland rice. Commun. Soil Sci. Plant Anal. 2011, 42, 1719–1727. [Google Scholar] [CrossRef]
  42. Fageria, N.K.; Filho, M.P.B.; Santos, A.B. Growth and zinc uptake and use efficiency in food crops. Commun. Soil Sci. Plant Anal. 2008, 39, 2258–2269. [Google Scholar] [CrossRef]
  43. Fageria, N.K.; Baligar, V.C.; Jones, C.A. Growth and Mineral Nutrition of Field Crops, 2nd ed.; Marcel Dekker, Inc.: New York, NY, USA, 1997. [Google Scholar]
  44. Wissuwa, M.; Ismail, A.M.; Graham, R.D. Rice grain zinc concentrations as affected by genotype, native soil-zinc availability, and zinc fertilization. Plant Soil 2007, 306, 37–48. [Google Scholar] [CrossRef]
  45. Fang, Y.; Wang, L.; Xin, Z.; Zhao, L.; An, X.; Hu, Q. Effect of foliar application of zinc, selenium, and iron fertilizers on nutrients concentration and yield of rice grain in China. J. Agric. Food Chem. 2008, 56, 2079–2084. [Google Scholar] [CrossRef] [PubMed]
  46. Jan, M.; Anwar-ul-Haq, M.; Tanveer-ul-Haq, A.A.; Wariach, E.A. Evaluation of soil and foliar applied Zn sources on rice (Oryza sativa L.) genotypes in saline environments. Int. J. Agric. Biol. 2016, 18, 643–648. [Google Scholar] [CrossRef]
  47. Gomez-Coronado, F.; Poblaciones, M.J.; Almeida, A.S.; Cakmak, I. Zinc concentration of bread wheat grown under Mediterranean conditions as affected by genotype and soil/foliar Zn application. Plant Soil 2015, 401, 331–346. [Google Scholar] [CrossRef]
  48. Impa, S.M.; Morete, M.J.; Ismail, A.M.; Schulin, R.; Johnson-Beebout, S.E. Zn uptake, translocation, and grain Zn loading in rice (Oryza sativa L.) genotypes selected for Zn deficiency tolerance and high grain Zn. J. Exp. Bot. 2013, 64, 2739–2751. [Google Scholar] [CrossRef] [PubMed]
  49. Graham, R.; Senadhira, D.; Beebe, S.; Iglesias, C.; Monasterio, I. Breeding for micronutrient density in edible portions of staple food crops: Conventional approaches. Field Crop. Res. 1999, 60, 57–80. [Google Scholar] [CrossRef]
  50. Chaudhary, S.K.; Singh, N.K. Effect of levels of nitrogen and zinc on grain yield and their uptake in transplanted rice. ORYZA Int. J. Rice 2007, 44, 44–47. [Google Scholar]
  51. Yosefi, K.M.; Galavi, M.; Ramrodi, S.R.M. Effect of bio-phosphate and chemical phosphorus fertilizer accompanied with micronutrient foliar application on growth, yield and yield components of maize (Single Cross 704). Aust. J. Crop Sci. 2011, 5, 175–180. [Google Scholar]
  52. Abd El-Baky, M.M.H.; Ahmed, A.A.; El-Nemr, M.A.; Zaki, M.F. Effect of potassium fertilizer and foliar zinc application on yield and quality of sweet potato. Res. J. Agric. Biol. Sci. 2010, 6, 386–394. [Google Scholar]
  53. Mai, W.; Tian, X.; Gale, W.J.; Yang, X.; Lu, X. Tolerance to Zn deficiency and P-Zn interaction in wheat seedlings cultured in chelator-buffered solutions. J. Arid Land. 2011, 3, 206–213. [Google Scholar] [CrossRef]
  54. Sakal, R.; Verma, M.K.; Singh, A.P. Relative susceptibility of selected rice varieties to zinc deficiency in relation to utilization of different pools of soil zinc from calcareous soil. Annu. Agric. Res. 1989, 10, 243–248. [Google Scholar]
  55. Cakmak, I.; Yilmaz, A.; Kalayci, M.; Ekiz, H.; Touun, B.; Erenoglu, B.; Braaun, H.J. Zinc deficiency as a critical problem in wheat production in central Anatolia. Plant Soil 1996, 180, 165–172. [Google Scholar] [CrossRef]
  56. Anuradha, K.; Agarwal, S.; Batchu, A.K.; Prasad, B.A.; Mallikarjuna, S.B.P.; Longvah, T. Evaluating rice germplasm for iron and zinc concentration in brown rice and seed dimensions. J. Phytol. 2012, 4, 19–25. [Google Scholar]
  57. Velu, G.; Ortiz-Monasterio, I.; Cakmak, I.; Hao, Y.; Singh, R. Biofortification strategies to increase grain zinc and iron concentrations in wheat. J. Cereal Sci. 2014, 59, 365–372. [Google Scholar] [CrossRef]
  58. Kant, S.; Seneweera, S.; Rödin, J.; Materne, M.; Burch, D.; Rothstein, S.J.; Spangenberg, G. Improving yield potential in crops under elevated CO2: Integrating the photosynthetic and nitrogen utilization efficiencies. Front. Plant Sci. 2012, 3, 162. [Google Scholar] [CrossRef] [Green Version]
  59. Myers, S.S.; Zanobetti, A.; Kloog, I.; Huybers, P.; Leakey, A.D.; Bloom, A.J. Increasing CO2 threatens human nutrition. Nature 2014, 510, 139–142. [Google Scholar] [CrossRef] [PubMed]
  60. Robson, A.D.; Pitman, M.G. Interactions between nutrients in higher plants. In Encyclopedia of Plant Physiology, 15A. New Series; Lauchli, A., Bieleski, R.L., Eds.; Springer: Berlin, Germany; New York, NY, USA, 1983; pp. 287–312. [Google Scholar]
  61. Gianquinto, G.; Abu-Rayyan, A.; Di Tola, L.; Piccotino, D.; Pezzarossa, B. Interaction effects of phosphorus and zinc on photosynthesis, growth and yield of dwarf bean grown in two environments. Plant Soil 2000, 220, 219–228. [Google Scholar] [CrossRef]
  62. Cakmak, I. Plant nutrition research: Priorities to meet human needs for food in sustainable ways. Plant Soil 2002, 247, 3–24. [Google Scholar] [CrossRef]
  63. Buerkert, A.; Haake, C.; Ruckwied, M.; Marschner, H. Phosphorus application’ affects the nutritional quality of millet grain in the Sahel. Field Crop. Res. 1998, 57, 223–235. [Google Scholar] [CrossRef]
  64. Loneragan, J.F.; Webb, M.J. Interactions between Zinc and Other Nutrients Affecting the Growth of Plants. In Zinc in Soils and Plants; Robson, A.D., Ed.; Kluwer Academic Publishers: Dordrecht, The Netherlands, 1993; pp. 119–134. [Google Scholar]
  65. Fageria, N.K. Mineral Nutrition of Rice; CRC Press: Boca Raton, FL, USA, 2013. [Google Scholar] [CrossRef]
  66. Alloway, B.J. Zinc in Soils and Crop Nutrition; IZA and IFA: Brussels, Belgium, 2008. [Google Scholar]
  67. Ranjha, A.M.; Ahmed, I.; Iqbal, M.; Ahmed, M.J. Rice response to applied phosphorus, zinc and farmyard manure. Int. J. Agri. Biol. 2001, 3, 197–198. [Google Scholar]
  68. Sadeghzadeh, B. A review of Zn nutrition and plant breeding. J. Soil Sci. Plant Nutr. 2013, 13, 905–927. [Google Scholar]
  69. Guo, J.; Feng, X.M.; Hu, X.Y.; Tian, G.L.; Ling, N.; Wang, J.H.; Shen, Q.R.; Guo, S.W. Effects of soil zinc availability, nitrogen fertilizer rate and zinc fertilizer application method on zinc biofortification of rice. J. Agric. Sci. 2015, 154, 584–597. [Google Scholar] [CrossRef]
  70. Ismail, A.M.; Heuer, S.; Thomson, M.; Wissuwa, M. Genetic and genomic approaches to develop rice germplasm for problem soils. Plant Mol. Biol. 2007, 65, 547–570. [Google Scholar] [CrossRef]
  71. Rahman, K.M.M.; Chowdhury, M.A.K.; Sharmeen, F.; Sarkar, A.; Hye, M.A.; Biswas, G.C. Effect of zinc and phosphorus on yield of Oryza sativa (cv. br-11). Bangladesh Res. Pub. J. 2011, 5, 351–358. [Google Scholar]
  72. Lal, B.; Majumdar, B.; Venkatesh, M.S. Individual and interactive effects of phosphorus and zinc in lowland rice. Indian J. Hill Farming 2000, 13, 44–46. [Google Scholar]
  73. Shewry, P.R.; Pellny, T.K.; Lovegrove, A. Is modern wheat bad for health? Nat. Plants 2016, 2, 1–3. [Google Scholar] [CrossRef] [PubMed]
  74. Yadi, R. Role of Zinc Fertilizer on Grain Yield and Some Qualities Parameters in Iranian Rice Genotypes. Ann. Biol. 2012, 3, 4519–4527. [Google Scholar]
  75. Amanullah; Inamullah. Preceding rice genotypes, residual phosphorus and zinc influence harvest index and biomass yield of subsequent wheat crop under rice-wheat system. Pak. J. Bot. 2015, 47, 265–273. [Google Scholar]
  76. Cakmak, I.; Pfeiffer, W.H.; McClafferty, B. Review: Biofortification of durum wheat with zinc and iron. Cereal Chem. J. 2010, 87, 10–20. [Google Scholar] [CrossRef] [Green Version]
  77. Schulin, R.; Tandya, S.; Thonarb, C.; Grütera, R.; Costeroussea, B.; Müllera, I.; Helfensteina, J.; Dürr-Austera, T.; Aghilia, F.; Dorostkarc, V.; et al. Zinc Biofortification of Wheat through Soil Organic Matter Management of Abstracts. p. 42. Available online: https://www.ethz.ch/content/dam/ethz/special-interest/dual/world food system center dam/WFS%20 Conference/Presentations/Session%2012-5%20Rainer%20Schulin.pdf (accessed on 6 August 2020).
  78. Zaman, Q.U.; Aslam, Z.; Yaseen, M.; Ihsan, M.Z.; Khaliq, A.; Fahad, S.; Bashir, S.; Ramzani, P.M.A.; Naeem, M. Zinc biofortification in rice: Leveraging agriculture to moderate hidden hunger in developing countries. Arch. Agron. Soil Sci. 2017, 64, 147–161. [Google Scholar] [CrossRef]
  79. Gao, X.; Hoffland, E.; Stomph, T.; Grant, C.A.; Zou, C.; Zhang, F. Improving zinc bioavailability in transition from flooded to aerobic rice. A review. Agron. Sustain. Dev. 2011, 32, 465–478. [Google Scholar] [CrossRef] [Green Version]
Figure 1. Rainfall and temperature data at the experimental site for the two growing seasons of the rice-wheat cropping system.
Agronomy 10 01155 g001
Figure 2. Zinc concentrations in rice grains (mg kg−1) were significantly affected by phosphorus into zinc (P × Zn) interaction at the 0.1% level of probability using the LSD test, see Table 1 and Table 2).
Agronomy 10 01155 g002
Figure 3. Zinc concentrations in rice straw (mg kg−1) were significantly affected by phosphorous into zinc (P × Zn) interaction at the 0.1% level of probability using the LSD test, see Table 1 and Table 3).
Agronomy 10 01155 g003
Figure 4. Zinc concentrations in rice grains (mg kg−1) were significantly affected by phosphorus into genotype (P × G) interaction at the 1% level of probability using the LSD test, see Table 1 and Table 2).
Agronomy 10 01155 g004
Figure 5. Zinc concentrations in rice grains (mg kg−1) were significantly affected by zinc into genotype (Zn × G) interaction at the 1% level of probability using the LSD test, see Table 1 and Table 2).
Agronomy 10 01155 g005
Figure 6. Zinc concentrations in rice straw (mg kg−1) were significantly affected by zinc into genotype (Zn × G) interaction at the 1% level of probability using the LSD test, see Table 1 and Table 3).
Agronomy 10 01155 g006
Table 1. Analysis of variance for the amount of zinc (Zn) content in rice grains and straw (mg kg-1) in rice genotypes (fine vs. coarse) as affected by P and Zn levels at Batkhela, Malakand during the summer of 2011 (year one) and 2012 (year two).
Source of VarianceDegree of FreedomZn in GrainsZn in Straw
Years (Y)1***ns
Rep. (within years)4***ns
Genotypes2***ns
Y × G2*ns
Phosphorus (P)3******
Y × P3nsns
P × G6** ns
Y × P × G6nsns
Pooled Error-I44
Zinc (Zn)3******
Y × Zn3******
Zn × G6** **
Y × Zn × G6nsns
P × Zn9*** ***
Y × P × Zn9**ns
P × Zn × G18nsns
Y × P × Zn × G18nsns
Pooled Error-II144
Total287
CV of main plots6.14.8
CV of sub-plots6.43.9
where: ns stands for non-significant, while *, **, and *** stand for significance at the 5, 1, and 0.1% levels of probability.
Table 2. Zinc concentrations in rice grains and straw (mg kg−1) of rice (average over three genotypes) as affected by phosphorus levels.
Phosphorus
(kg P ha−1)
Grains Zn Content (mg kg−1)Straw Zn Content (mg kg−1)
20112012Mean20112012Mean
015.3317.3116.32 d19.5420.0019.77 b
4016.8619.2518.05 c19.4120.0419.72 b
8018.2219.5018.86 b21.7821.4321.60 a
12019.9920.0920.04 a21.9421.8321.89 a
LSD0.050.290.260.330.310.260.32
Means of the same category followed by different levels are significantly different at the 5% level of probability using the LSD test.
Table 3. Zinc concentrations in rice grains and straw (mg kg−1) of rice (average over three genotypes) as affected by zinc levels.
Zinc
(kg Zn ha−1)
Grains Zn Content (mg kg−1)Straw Zn Content (mg kg−1)
20112012Mean20112012Mean
08.427.648.03 c12.8712.1512.51 d
519.3622.0620.71 b21.6722.8722.27 c
1021.4523.1822.31 a23.3923.8723.63 b
1521.1823.2722.22 a24.7324.4124.57 a
LSD0.050.270.250.280.250.260.24
Means of the same category followed by different levels are significantly different at the 5% level of probability using the LSD test.
Table 4. Zinc concentrations in grains and straw (mg kg−1) of different rice genotypes (fine vs. coarse types).
Rice Genotypes
(Cultivars)
Grains Zn Content (mg kg−1)Straw Zn Content (mg kg−1)
20112012Mean20112012Mean
B-385 (fine)16.7718.7817.78 c20.6420.9620.80
F-Malakand (coarse)17.6918.8918.29 b20.7220.9320.83
Pukhraj (coarse)18.3419.4318.89 a20.6320.5920.61
LSD0.050.170.150.28ns0.04ns
Means of the same category followed by different levels are significantly different at the 5% level of probability using the LSD test. Where: ns stands for non-significant data at the 5 % level of probability.
Table 5. Zinc concentrations in grains and straw (mg kg-1) in two different years (Y1 vs. Y2).
YearsGrains Zn Content (mg kg−1)Straw Zn Content (mg kg−1)
2011 (Y1)
2012 (Y2)
17.60 b
19.04 a
20.67
20.83
Significance0.05*ns
Means of the same category followed by different levels are significantly different at the 5% level of probability using the LSD test. Where: ns stands for non-significant, while * stands for significant at the 5 % level of probability.

