Article

Effect of Oxytetracycline and Chlortetracycline on Bacterial Community Growth in Agricultural Soils

by
Vanesa Santás-Miguel
1,
Manuel Arias-Estévez
1,2,
Montserrat Díaz-Raviña
3,
María José Fernández-Sanjurjo
4,
Esperanza Álvarez-Rodríguez
4,
Avelino Núñez-Delgado
4 and
David Fernández-Calviño
1,2,*
1
Área de Edafoloxía e Química Agrícola, Departamento de Bioloxía Vexetal e Ciencia do Solo, Facultade de Ciencias, Universidade de Vigo, Campus As Lagoas, s/n 32004 Ourense, Spain
2
CITACA-Clúster de Investigación y Transferencia Agroalimentaria del Campus, Auga, Universidad de Vigo, 32004 Ourense, Spain
3
Departamento de Bioquímica del Suelo, Instituto de Investigaciones Agrobiológicas de Galicia (IIAG-CSIC), Apartado 12, Avda Vigo s/n, 15780 Santiago de Compostela, Spain
4
Departamento de Edafoloxía e Química Agrícola, Escola Politécnica Superior de Enxeñaría, Universidade de Santiago de Compostela, Campus Universitario, s/n 27002 Lugo, Spain
*
Author to whom correspondence should be addressed.
Agronomy 2020, 10(7), 1011; https://doi.org/10.3390/agronomy10071011
Submission received: 17 June 2020 / Revised: 30 June 2020 / Accepted: 9 July 2020 / Published: 14 July 2020
(This article belongs to the Special Issue Soil Healthy in Agro-ecosystems)

Abstract

:
Toxicity on soil bacterial community growth caused by the antibiotics oxytetracycline (OTC) and chlortetracycline (CTC) was studied in 22 agricultural soils after 1, 8 and 42 incubation days. The leucine incorporation method was used with this aim, estimating the concentration of each antibiotic which caused an inhibition of 50% in bacterial community growth (log IC50). For OTC, the mean log IC50 was 2.70, 2.81, 2.84 for each of the three incubation times, while the values were 2.05, 2.22 and 2.47 for CTC, meaning that the magnitude of OTC toxicity was similar over time, whereas it decreased significantly for CTC with incubation time. In addition, results showed that the toxicity on bacterial community growth due to CTC is significantly higher than when due to OTC. Moreover, the toxicity on bacterial community growth due to both antibiotics is dependent on soil properties. Specifically, an increase in soil pH and silt content resulted in higher toxicity of both antibiotics, while increases in total organic carbon and clay contents caused decreases in OTC and CTC toxicities. The results also show that OTC toxicity can be well predicted by means of specific equations, using the values of pH measured in KCl and those of effective cation exchange capacity as input variables. CTC toxicity may be predicted (but with low precision) using pH measured in KCl and total organic carbon. These equations may help to predict the negative effects caused by OTC and CTC on soil bacteria using easily measurable soil parameters.

1. Introduction

Veterinary antibiotics have been widely used in farms throughout several decades for the treatment and prevention of animal diseases. In addition, they were used as nutritional supplements to enhance animal growth, although they are now banned in several countries [1,2]. Most of the antibiotics provided to livestock do not suffer metabolic changes in the digestive track of those animals. As a consequence, between 30 and 90% of these antibiotics can be found later in the excrements [3]. These veterinary antibiotics enter into the agro-systems through repeated applications of manure to agricultural soils [4]. In addition, the use of veterinary antibiotics is increasing worldwide. Specifically, 63,151 tons of antimicrobial compounds were administered to livestock during 2010, and an increase of 67% is estimated for 2030, to reach up to 105,596 tons [5]. Furthermore, veterinary antibiotics are potentially dangerous for non-target organisms present in the environment, such as soil bacterial communities. In this regard, previous studies have reported that the increase in antibiotic concentrations in agricultural soils may cause changes in soil bacterial communities, modifying bacterial growth, enzymatic activities, and/or biodiversity [6,7,8].
Tetracycline antibiotics are one of the groups most widely used at the veterinary level, ranking second place worldwide [9], mainly due to their cost, effectivity, broad spectrum, and high solubility in water. Within tetracycline antibiotics, tetracycline (TC), oxytetracycline (OTC) and chlortetracycline (CTC) are the most used. A previous work [10] showed the potential of TC to cause toxicity in soil bacterial communities. However, the effects of OTC and CTC have not been studied in this regard. In fact, few studies have focused on the effect of tetracycline antibiotics on soil bacterial communities [11,12,13], and are very scarce, especially those including estimations of inhibition curves, i.e., the concentration of antibiotics which may cause negative effects on bacterial activities.
In this study we hypothesize that OTC and CTC may cause toxic effects on soil bacterial communities and that these toxic effects will be different in soils with different characteristics. With this in mind, the aims of the current research are to elucidate the effects of OTC and CTC toxicity on soil bacterial community growth, as well as to determine the effects of soil properties on the toxicity exerted by OTC and CTC on the growth of soil bacterial communities, and specifically which soil properties could be modified to effectively reduce the negative effects of OTC and CTC on soil bacterial communities. For this purpose, 22 soils with different characteristics (mainly regarding organic matter content and pH) were selected. The soils were spiked with different concentrations of the antibiotics, and the bacterial community growth was estimated after three incubation periods, using the leucine incorporation technique. The results of this research could increase the knowledge of the undesirable effects of tetracycline antibiotics on bacterial communities, as well as the eventual efficacy of alternatives to reduce it, which could be of relevance as regards environmental and public health.

2. Material and Methods

2.1. Chemicals

Oxytetracycline hydrochloride (CAS. 2058-46-0; ≥95% in purity) and chlortetracycline hydrochloride (CAS. 64-72-2; ≥97% in purity), supplied by Sigma–Aldrich (Steinheim, Germany), were used for the oxyetracycline and chlortetracycline toxicity assessment.

2.2. Soil Samples and General Characterization

Twenty-two soil samples were selected among the soils previously described by Conde-Cid et al. [14] in order to cover a wide range of pH and total organic carbon values (Table S1, Supplementary material). Briefly, these soils presented a sand content ranging from 20 to 70%, a silt content from 12 to 61%, and a clay content from 17 up to 34%. Soil pH (measured in water) varied between 4.1 and 7.4, while pHKCl (measured in 0.1 M KCl) was between 3.7 and 6.6. Total organic carbon varied between 1.1 and 10.9%, whereas dissolved organic carbon (DOC) ranged between 211 and 773 mg kg−1, and total nitrogen between 0.09 and 0.84%. The effective cation exchange capacity (ECEC) ranged from 4.1 to 23.2 cmolc kg−1. Additionally, these soils presented low concentrations of tetracycline antibiotics [15].

2.3. Experimental Design

Air-dried soil samples were rewetted up to 60–80% of water holding capacity, and incubated at 22 °C during one week, in order to reactivate the bacterial activity in the 22 soils, taking into account that this period of time would allow stabilization of soil bacterial community growth after moisture adjustment [16]. Then, oxytetracycline (OTC) and chlortetracycline (CTC) were added (in triplicate) to the soil samples, separately, in different doses, to achieve the following gradient of concentrations for each soil and antibiotic: 0, 0.49, 1.95, 7.81, 31.25, 125, 500 and 2000 mg kg−1. These concentrations were selected in order to obtain dose–response curves as suitable tools to estimate toxicity [17]. Both antibiotics were added to the soils using talc powder as a carrier for equalizing the amount of dry material added to each microcosm and facilitating the mixture with the soil [18]. The mixtures resulted in a total of 1056 microcosms, 528 per antibiotic. All microcosms were incubated at 22 °C in the dark, and the bacterial community growth was estimated after 1, 8 and 42 incubation days (short, medium and long-term for the bacterial communities’ adaptation to a toxicant).

2.4. Estimation of Bacterial Community Growth

The bacterial community growth was estimated using the leucine incorporation technique [19,20]. Briefly, 1 g of soil (fresh weight) was mixed with 10 mL of distilled water using a multivortex shaker at maximum intensity for 3 min, followed by low-speed centrifugation at 1000× g for 10 min, to create a bacterial suspension in the supernatant. Then, an aliquot of this bacterial suspension (1.5 mL) was transferred to a 2 mL microcentrifugation tube, and 2 μL [3H]Leu (3.7 MBq mL−1 and 0.574 TBq mmol−1; Perkin Elmer, Waltham, MA, USA) were added together with non-labeled Leu to each tube, resulting in 275 nM Leu in the bacterial suspensions. Then, the microtubes were incubated for 2 h at 22 °C in the dark, and the growth stopped with 75 μL of 100% trichloroacetic acid after the incubation period. Later, the bacteria in the tubes were washed as described by [20]. Finally, 3H radioactivity was determined using scintillation liquid counting (Tri-Carb 2810 TR, Perkin Elmer, Waltham, MA, USA).

2.5. Data Analysis

The resulting inhibition curves obtained for each soil and antibiotic were subjected to modelling by using a logistic model (1), which allowed the estimation of IC50 values (antibiotic concentration inhibiting 50% of bacterial community growth).
Y = c/[1 + eb(aX)]
where Y is the leucine incorporation (bacterial community growth) for each concentration of antibiotic added, X is the logarithm of the concentration of antibiotic added, a is the value of log IC50, b is a parameter related to the slope of the inhibition curve, and c is the bacterial growth rate of the control (sample without antibiotic). High values obtained for log IC50 indicate low antibiotic toxicity, while low values of log IC50 indicate high antibiotic toxicity.
In addition, values for log IC10 (antibiotic concentration inhibiting 10% of bacterial community growth) were calculated using the following equation:
log IC10 = a − (Ln((c/0.9) − 1))/b
with a, b and c parameters being the same as in the logistic model (1).
Differences among log IC50 or log IC10 values at different incubation times were checked using a paired t-test, whereas the effects of soil properties on OTC and CTC toxicity on bacterial community growth were studied using Pearson correlations and linear multiple regression analyses. All statistical analyses were performed using IBM SPSS Statistics 21 software. Figures were drawn using Synergy Software KaleidaGraph software.

3. Results and Discussion

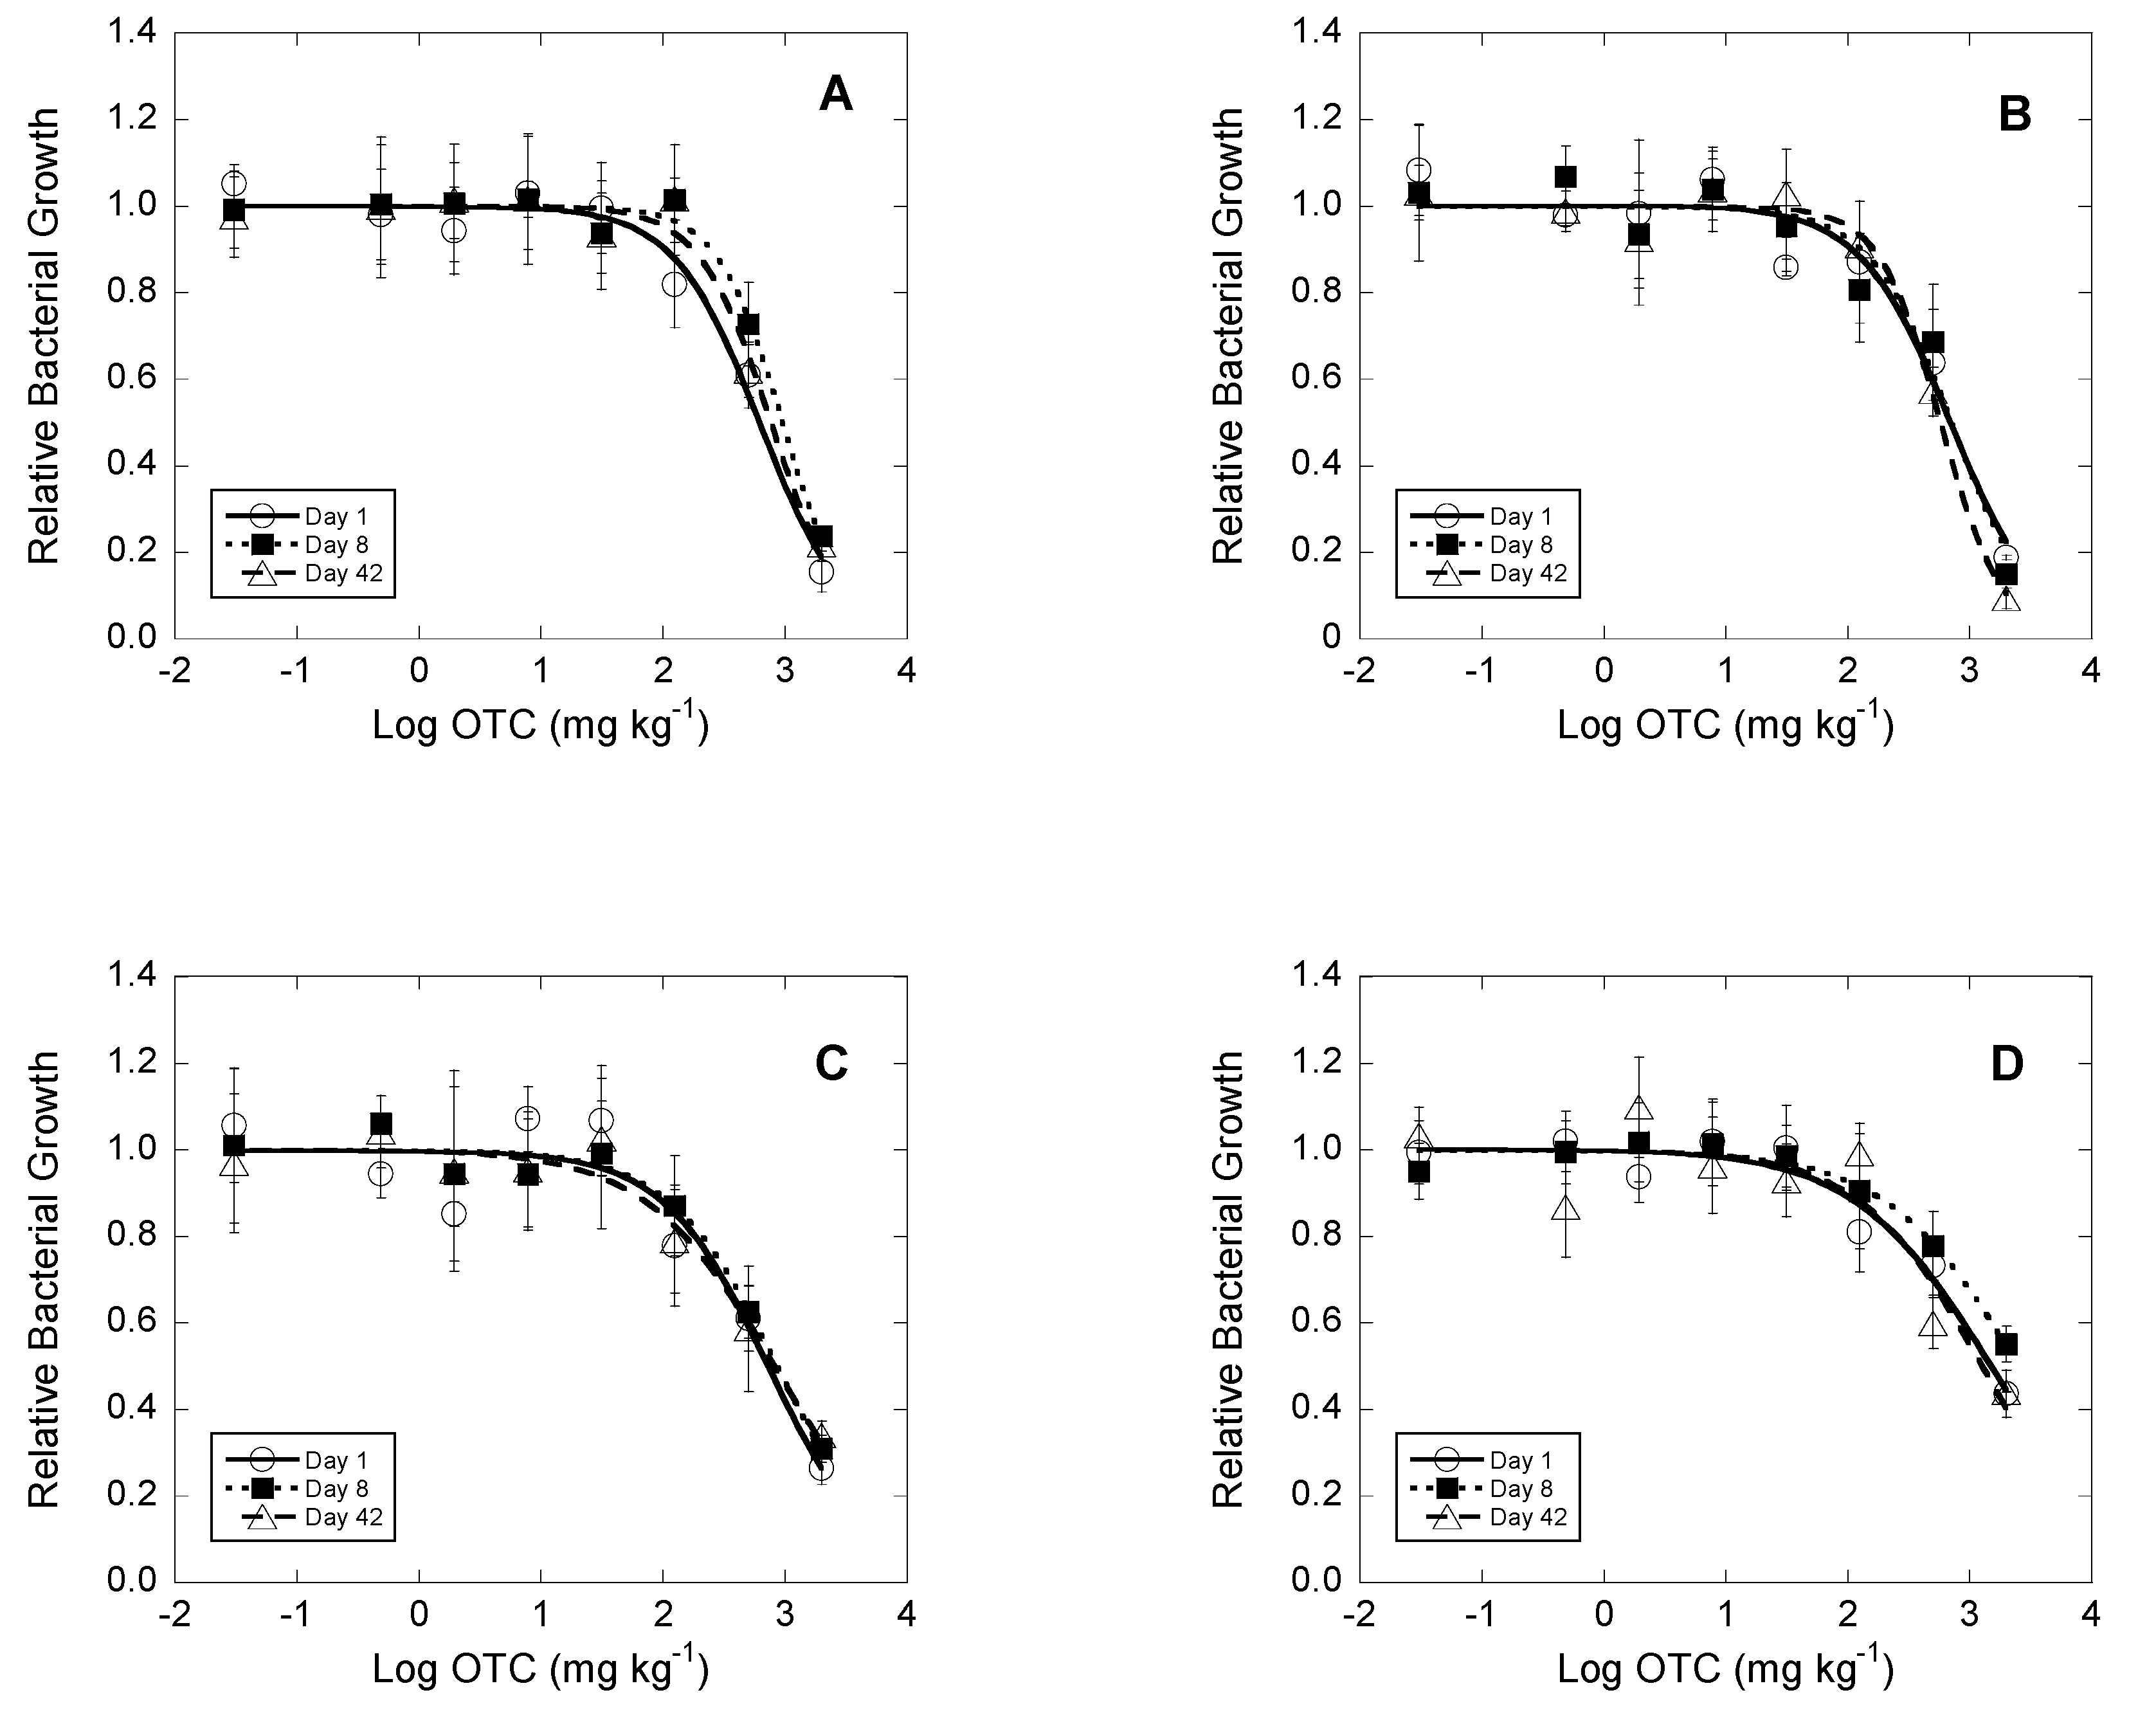
3.1. Bacterial Growth Dose-Response Curves after OTC and CTC Addition to Soils

The bacterial community growth response after the addition of OTC (Figure 1) and CTC (Figure 2) to the soils, after 1, 8 and 42 incubation days, showed clear dose–response curves, which are sigmoid type. These curves are similar to those found by Rousk et al. [21] for antibiotics (streptomycin, oxytetracycline and bronopol), or by other authors for fungicides [22,23] and phenols [24].
As a general trend, OTC (Figure 1 and Figure S1 (Supplementary material)) did not show apparent differences between 1, 8 and 42 days of incubation. However, CTC toxicity (Figure 2 and Figure S2 (Supplementary material)) was still present after 42 incubation days, but apparently decreased in relation to the results corresponding to 1 and 8 incubation days (the curves moved to the right with time). Additional details and a deeper analysis of potential incubation time effects on OTC and CTC toxicity are shown in the next section below.
For all soils, the dose–response curves were generally well described by the logistic model, for both OTC and CTC, and for all three incubation times (R2 ≥ 0.86 in all cases, mean 0.96; Table 1 and Table 2). The log IC50 values obtained for OTC (Table 1) after 1 day of incubation ranged between 1.93 ± 0.09 and 3.31 ± 0.20 (mean = 2.70); for 8 days of incubation ranged between 2.18 ± 0.21 and 3.41 ± 0.07 (mean = 2.81); for 42 days of incubation were between 2.14 ± 0.12 and 3.48 ± 0.14 (mean = 2.84). In view of that, OTC toxicity would have decreased with time. In the case of CTC (Table 2), log IC50 values after 1 day of incubation ranged from 1.11 ± 0.11 to 2.89 ± 0.06 (mean = 2.05); from 1.66 ± 0.17 to 2.89 ± 0.05 (mean = 2.22) for 8 days of incubation; lastly, from 1.60 ± 0.12 up to 4.25 ± 0.50 (mean = 2.47) for 42 days of incubation. As for OTC, these results would suggest that CTC toxicity decreased with time.
The values of log IC10 obtained for OTC (Table 1) after 1 incubation day ranged between 0.73 and 4.40 (mean = 1.71); after 8 incubation days ranged between 0.65 and 2.51 (mean = 1.81); after 42 incubation days between 1.13 and 3.10 (mean = 2.02). Regarding the values of log IC10 obtained for CTC (Table 2), after 1 incubation day they varied between −0.75 and 2.09 (mean = 0.74); after 8 incubation days were between −0.02 and 1.99 (mean = 0.95); finally, after 42 incubation days between 0.17 and 2.43 (mean = 1.25). For both OTC and CTC, the time–course evolution of log IC10 mean values was consistent with that of log IC50, showing a slight decrease with time.
Winckler and Grafe [25] theoretically predicted that the concentration of tetracycline antibiotics present in agricultural soils, as a function of manure regulation should, range between 0.5 and 0.9 mg kg−1. However, the concentrations of tetracycline antibiotics that are present in soils vary between different regions. Thus, Hu et al. [26] found concentrations of tetracycline, chlortetracycline, and oxytetracycline up to 0.11, 1.08, and 2.68 mg kg−1, respectively. In the north of Turkia, Karcı and Balcıoğlu [27] found oxytetracycline concentrations up to 0.5 mg kg−1. In cultivable soils in Italy, OTC concentrations were between 0.13 and 0.22 mg kg−1 [28], while Andreu et al. [29] examined TC residues in soil samples from Spain and observed that the most commonly detected antibiotic was OTC, with values of 0.02–0.11 mg kg−1. Finally, Conde-Cid et al. [15] detected values of TC and OTC in Galicia (NW of Spain) reaching up to 0.6 mg kg−1 and 0.2 mg kg−1, respectively. Since the minimum log IC50 values found in the present work were 1.11 (IC50 13 mg kg−1) for CTC and 1.93 (IC50 85 mg kg−1) for OTC, the current values found in agricultural soils worldwide (as those reported by [15,26,27,28,29]) are far from causing high negative effects on the growth of bacterial communities. However, according to minimum log IC10 values found for CTC (−0.02; IC50 1 mg kg−1), the current values of tetracycline antibiotic found worldwide are in the limit for causing the appearance of negative effects on the growth of bacterial communities. As a result, the presence of these antibiotics in agricultural soils may lead to future disruptions of natural environmental processes, like recycling of nutrients and organic matter in soils [3].

3.2. Time–Course Evolution of Toxicity Due to OTC and CTC

To check the statistical significance of eventual decreases in the OTC and CTC toxicities with the incubation time, paired t-tests were performed using log IC50 and log IC10 values (considering significance at p < 0.05). Log IC50 analysis showed no significant differences between the different incubation times for OTC. The results obtained using log IC10 values also showed no significant differences with incubation, but one exception was found for log IC10 values between 1 and 42 days of incubation, with significant differences in this case (t = −2.149; p < 0.05). For CTC, the paired t-test showed a significant difference for the log IC50 values between 1 and 8 days of incubation (t = −2.566; p < 0.05); between 8 and 42 days of incubation (t = −2.796; p < 0.05); as well as between 1 and 42 days of incubation (t = −4.688; p < 0.05). A similar trend was found for log IC10 values, with significant differences between 8 and 42 days (t = −2.193; p < 0.05), and between 1 and 42 days of incubation (t = −3.571; p < 0.05). However, there were no significant differences between the values of log IC10 on day 1 and 8.
The results showed that OTC and CTC toxicities were quite persistent during the incubation time. However, there was an important difference between OTC and CTC, taking into account that OTC toxicity presented a similar magnitude over time, whereas the CTC toxicity magnitude decreased with time. This CTC toxicity behavior was similar to that previously found for tetracycline (TC) [10]. The persistence (in the case of OTC), or semi-persistence (in the case of CTC) of toxicity over time may be attributed to the slow degradation suffered by these antibiotics in soils [30,31,32], especially at high antibiotic concentrations [30,33]. In addition, Danilova et al. [34] showed that the effects of OTC on the microbial community remain longer than the presence of antibiotics in soils. However, bacterial growth recovered over time in the presence of CTC, which may be attributed to ageing processes [35] or a bacterial community tolerance to antibiotics [36,37,38], but, further analysis is needed to clarify these possible mechanisms.

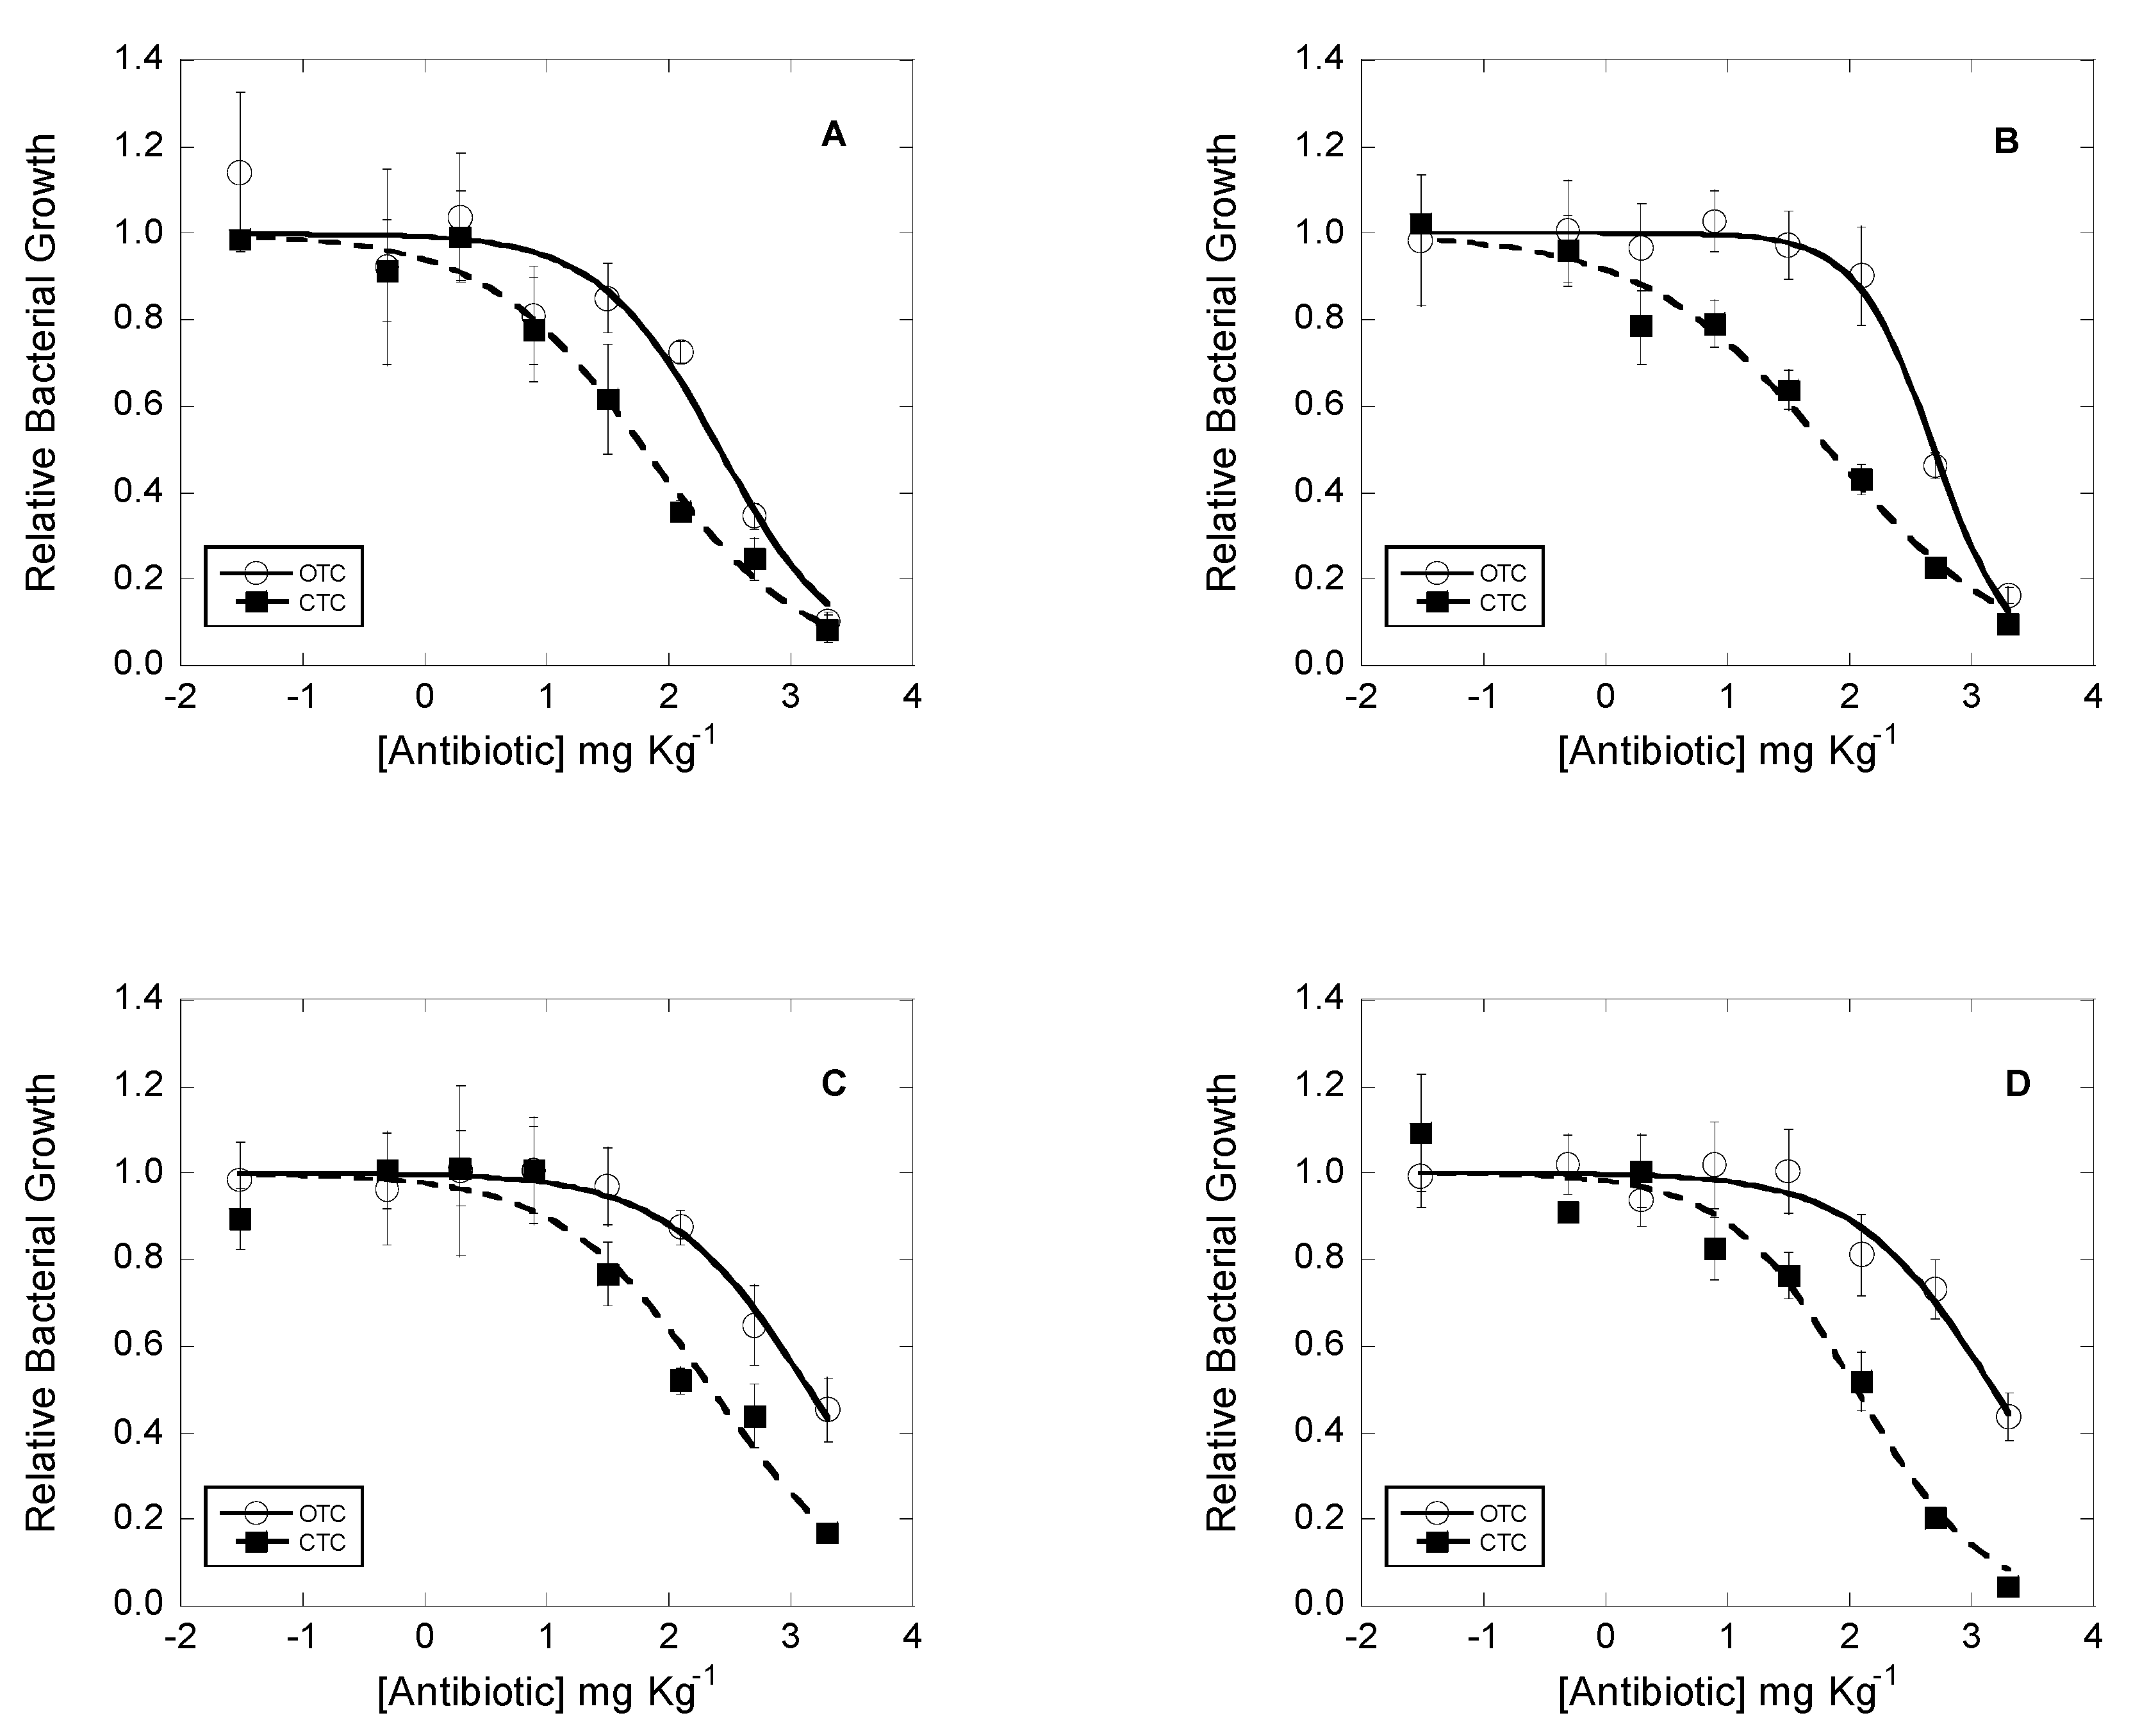
3.3. Differences between the Toxicities of OTC and CTC

Figure 3 shows the dose–response curves obtained for OTC and CTC in four representative soils after 1 day of incubation. In general, the dose–response curves for OTC suffered a displacement to the right with respect to dose–response curves for CTC, suggesting that OTC would be less toxic than CTC for bacterial communities. In order to check significant differences between OTC and CTC toxicities, log IC50 and log IC10 values obtained after one incubation for OTC and CTC were compared using a paired t-test. For log IC50 values, the paired t-test showed significant differences between OTC and CTC (t = 8.672; p < 0.05). For log IC10 values, significant differences between OTC and CTC were also found (t = 4.339; p < 0.05). Therefore, it is clear that CTC is significantly more toxic than OTC for bacterial community growth. In a previous work [10], the effect of tetracycline (TC) on bacterial growth was studied in the same 22 agricultural soils, providing values for log IC50 and log IC10, which were used in the current work to compare OTC, CTC and TC toxicities to bacterial growth via paired t-test analysis. This statistic test showed no significant differences between OTC and TC using both log IC50 values and log IC10 values. However, significant differences between CTC and TC were found for log IC50 (t = −8.962; p < 0.05) and log IC10 (t = −7.813; p < 0.05) values. Therefore, the resulting overall sequence of toxicity would be CTC >> OTC ≥ TC.

3.4. Relations among OTC and CTC Toxicities and Soils Characteristics

Table 3 shows the Pearson correlation coefficients between selected soil properties and OTC toxicity (log IC50 and log IC10 values) after 1, 8 and 42 days of incubation. After 1 incubation day, log IC50 values were significantly and negatively correlated with soil pH (measured in water and in KCl) and with silt content. Moreover, log IC50 values were significantly and positively correlated with total carbon and clay content. After 1 day, log IC10 only showed a significant and positive correlation with clay. After 8 days of incubation, both log IC50 and log IC10 were significantly and positively correlated with sand content and significantly and negatively correlated with silt content. Also, log IC10 was significantly and negatively correlated with soil pH (measured in water). After 42 incubation days, none of the studied soil characteristics were correlated with log IC50 or log IC10. These results suggest that soil characteristics have an important effect on the toxicity exerted by OTC on bacterial growth, but this effect disappears with incubation time. Looking at the results obtained through the Pearson correlation test, at acidic pH OTC was less toxic for soil bacteria than at neutral pH values. These differences may be explained by different OTC availability in soils in response to pH modifications. Thus, the adsorption of OTC to different soil compounds is strongly dependent on pH [39,40,41]. At acidic pH, the adsorption of OTC to the different soil compounds is favored by the cationic/zwiterrionic form in which OTC is found [39,41]. Regarding basic pH, OTC speciation does not favor the adsorption onto the soil colloids. Pinck et al. [42] and Sithole and Guy [43] observed that the OTC adsorption capacities of illite and bentonite decreased when solution pH was increased. Moreover, Ter Laak et al. [44] observed that the sorption coefficients of anionic species of OTC were significantly lower than the zwitterionic and cationic species. The soils studied here showed pH values between 4.1−7.4, showing that the way in which OTC is mainly found is in cationic/zwitterionic forms at acid pH values, and in zwitterionic/anionic forms at pH values greater than 7 (Table S2, Supplementary material). Additionally, the higher the clay content was, the lower the OTC toxicity on soil bacteria. These results are consistent with those previously found by other authors, showing a high OTC adsorption on the clay’s surface at neutral and acid pH [39,45]. In addition, for increased carbon content in soils, the toxicity of OTC on soil bacteria decreased. These results are in agreement with previous works that observed a positive role of soil organic matter on the adsorption of OTC on soils [44,46,47,48,49]. The negative correlations found between silt, log IC50 and log IC10 in some cases may be explained by taking into account the close correlation between this variable and soil pH measured in water (r = 0.835; p < 0.01), as no clear reason allows to associate a higher OTC toxicity to increased silt content in soils.
Table 4 shows Pearson correlations between soil properties and CTC log IC50 and log IC10 values, after 1, 8 and 42 incubation days. After 1 incubation day, log IC50 values were significantly and negatively correlated with soil pH (measured in water and in KCl) and silt, and significantly and positively correlated with total carbon, sand and clay. After 8 and 42 incubation days, log IC50 was significantly correlated with the same variables with the same sign, except for clay after 8 days (no significant correlation was found). The same correlation trend was found for log IC10, but it was not significantly correlated with total carbon and clay for any time, and also not significantly correlated with soil pH after 1 and 8 incubation days. These results indicated that the effect of soil properties on the toxicity exerted by CTC on bacterial growth was persistent with time, with a clear effect due to soil textural fractions (specifically sand and silt).
The correlation between CTC toxicity and the properties of the studied soils (Table 4) was very similar to that observed for OTC when the incubation time was short (1 day). The effect of the soil pH on CTC may be justified with the same arguments used for OTC (see above), as both have similar speciation as a function of pH (Table S3, Supplementary material). Also, those properties showing the highest correlations with CTC toxicity on bacterial community growth were carbon and clay contents; in fact, the higher the amount of these compounds was in the soil, the lower the toxicity of OTC on soil bacterial community growth. This behavior is in accordance with previous literature, where it was reported that the presence of clays and organic matter in the soil favored CTC adsorption [50]. In relation to the effects caused by textural fractions (sand and silt), it could be explained by being correlated with pH, as in the case of OTC. However, since correlation coefficients between silt and sand contents and CTC toxicity were higher than those found for pH, more research is needed to clarify the potential effect of texture on CTC toxicity on bacterial community growth.

3.5. Prediction of OTC and CTC Toxicity

Log IC50 values determined after 1 incubation day for OTC and CTC, as direct toxicity proxies, were subjected to stepwise regression analysis in order to find an equation based on general soil characteristics, which would allow to predict OTC and CTC toxicities in soils. For OTC, a significant equation (Equation (1)) relating log IC50 with pHKCl and eCEC was found, explaining 61.3% of the log IC50 variance. By plotting estimated log IC50 values versus measured log IC50 values (Figure S3, Supplementary material) a high quality of the predictive model was observed, indicating that it can be an adequate tool to predict OTC toxicity in soils.
log IC50 = (4.60 ± 0.37) − (0.55 ± 0.09) × pHKCl + (0.08 ± 0.02) × eCEC
where R2 = 0.613; all the parameters in the equation were significant (p < 0.05) eCEC expressed in cmolc kg−1.
For CTC, a significant equation (Equation (2)) was also found relating log IC50 and two parameters: pHKCl and total soil carbon (C), explaining 42.6% of the log IC50 variance. The plotting of estimated log IC50 values versus measured log IC50 values (Figure S4, Supplementary material) shows that the prediction of log IC50 values fail for low values, while it gives a good prediction for the higher ones.
log IC50 = (2.90 ± 0.47) + (0.09 ± 0.03) × C − (0.24 ± 0.09) × pHKCl
where R2 = 0.426; all the parameters in the equation were significant (p < 0.05). C expressed in %.

4. Conclusions

Oxytetracycline (OTC) and chlortetracycline (CTC) antibiotics may present toxicity effects on soil bacterial community growth at high concentrations. For OTC, the toxicity was persistent during the whole incubation period (42 days), whereas for CTC was semi-persistent, i.e., the CTC toxicity magnitude slightly decreased with time. The effect that OTC and CTC exerted on the bacterial communities’ growth was highly dependent on soil properties. High organic carbon and clay contents in the soil decreased OTC and CTC toxicities, while increases in soil pH from acid to neutral values increased both OTC and CTC toxicity. Finally, equations developed to predict OTC and CTC toxicity on bacterial communities using general soil characteristics showed good results.

Supplementary Materials

The following are available online at https://www.mdpi.com/2073-4395/10/7/1011/s1, Table S1: General characteristics of the studied soils (n = 22), Table S2: Percentages of different oxytetracycline species for each pH measured in the whole set of studied soils (n = 22), Table S3: Percentages of different chlortetracycline species for each pH measured in the whole set of studied soils (n = 22), Figure S1: Relative bacterial community growth in response to oxytetracycline (OTC) addition to the soil samples after 1, 8 and 42 incubation days in 18 soil samples studied remaining, Figure S2: Relative bacterial community growth in response to chlortetracycline (CTC) addition to the soil samples studied after 1, 8 and 42 incubation days in 18 soil samples studied remaining, Figure S3: Oxytetracycline log IC50 values estimated using Equation. (1) after 1 incubation day versus measured log IC50 values, calculated using the logistic model. Continuous line represents a 1:1 relation, whereas discontinuous lines represent 10% deviation from the 1:1 line, Figure S4: Chlortetracycline log IC50 values estimated using Equation. (1) after 1 incubation day versus measured log IC50 values, calculated using the logistic model. Continuous line represents a 1:1 relation, whereas discontinuous lines represent 10% deviation from the 1:1 line.

Author Contributions

Conceptualization, M.A.-E., A.N.-D. and E.Á.-R.; methodology, M.D.-R., D.F.-C.; formal analysis, V.S.-M. and M.J.F.-S.; investigation, V.S.-M. and D.F.-C.; writing—original draft preparation, V.S.-M. and M.D.-R.; writing—review and editing, A.N.-D. and D.F.-C.; funding acquisition, M.A.-E., M.J.F.-S., E.Á.-R. and A.N.-D. All authors have read and agreed to the published version of the manuscript.

Funding

This study has been funded by the Spanish Ministry of Economy and Competitiveness through the projects CGL2015-67333-C2-1-R and -2-R (FEDER Funds), and by Xunta de Galicia via CITACA Strategic Partnership (ED431E 2018/07) and BV1 research group (ED431C 2017/62-GRC). David Fernández Calviño holds a Ramón y Cajal contract (RYC-2016-20411) financed by the Spanish Ministry of Economy, Industry and Competitiveness. Vanesa Santás Miguel holds a pre-doctoral fellowship founded by the University of Vigo.

Conflicts of Interest

The authors declare no conflict of interest. The funders had no role in the design of the study; in the collection, analyses, or interpretation of data; in the writing of the manuscript, or in the decision to publish the results.

References

  1. Tasho, R.P.; Cho, J.Y. Veterinary antibiotics in animal waste, its distribution in soil and uptake by plants: A review. Sci. Total Environ. 2016, 563, 366–376. [Google Scholar] [CrossRef]
  2. Hanna, N.; Sun, P.; Sun, Q.; Li, X.W.; Yang, X.W.; Ji, X.; Zou, H.Y.; Ottoson, J.; Nilsson, L.E.; Berglund, B.; et al. Presence of antibiotic residues in various environmental compartments of Shandong province in eastern China: Its potential for resistance development and ecological and human risk. Environ. Int. 2018, 114, 131–142. [Google Scholar] [CrossRef] [PubMed]
  3. Sarmah, A.K.; Meyer, M.T.; Boxall, A.B. A global perspective on the use, sales, exposure pathways, occurrence, fate and effects of veterinary antibiotics (VAs) in the environment. Chemosphere 2006, 65, 725–759. [Google Scholar] [CrossRef] [PubMed]
  4. Pan, M.; Chu, L.M. Leaching behavior of veterinary antibiotics in animal manure-applied soils. Sci. Total Environ. 2017, 579, 466–473. [Google Scholar] [CrossRef]
  5. Van Boeckel, T.P.; Brower, C.; Gilbert, M.; Grenfell, B.T.; Levin, S.A.; Robinson, T.P.; Teillant, A.; Laxminarayan, R. Global trends in antimicrobial use in food animals. Proc. Natl. Acad. Sci. USA 2015, 112, 5649–5654. [Google Scholar] [CrossRef] [PubMed] [Green Version]
  6. Thiele-Bruhn, S.; Beck, I.C. Effects of sulfonamide and tetracycline antibiotics on soil microbial activity and microbial biomass. Chemosphere 2005, 59, 457–465. [Google Scholar] [CrossRef]
  7. Zielezny, Y.; Groeneweg, J.; Vereecken, H.; Tappe, W. Impact of sulfadiazine and chlorotetracycline on soil bacterial community structure and respiratory activity. Soil Biol. Biochem. 2006, 38, 2372–2380. [Google Scholar] [CrossRef]
  8. Demoling, F.; Nilsson, L.O.; Bååth, E. Bacterial and fungal response to nitrogen fertilization in three coniferous forest soils. Soil Biol. Biochem. 2008, 40, 370–379. [Google Scholar] [CrossRef]
  9. Bansal, O.P. A laboratory study on degradation studies of tetracycline and chlortetracycline in soils of Aligarh district as influenced by temperature, water content, concentration of farm yield manure, nitrogen and tetracyclines. Proc. Natl. Acad. Sci. India Sect. B Biol. Sci. 2012, 82, 503–509. [Google Scholar] [CrossRef]
  10. Santás-Miguel, V.; Arias-Estévez, M.; Díaz-Raviña, M.; Fernández-Sanjurjo, M.J.; Álvarez-Rodríguez, E.; Núñez-Delgado, A.; Fernández-Calviño, D. Interactions between soil properties and tetracycline toxicity affecting to bacterial community growth in agricultural soil. Appl. Soil Ecol. 2020, 147, 103437. [Google Scholar] [CrossRef]
  11. Thiele-Bruhn, S. Microbial inhibition by pharmaceutical antibiotics in different soil-dose–response relations determined with the iron(III) reduction test. Environ. Toxicol. Chem. 2005, 24, 869–876. [Google Scholar] [CrossRef]
  12. Yang, Q.; Zhang, J.; Zhang, W.; Wang, Z.; Xie, Y.; Zhang, H. Influence of tetracycline exposure on the growth of wheat seedlings and the rhizosphere microbial community structure in hydroponic culture. J. Environ. Sci. Heal. B 2010, 45, 190–197. [Google Scholar] [CrossRef] [PubMed]
  13. Song, J.; Rensing, C.; Holm, P.E.; Virta, M.; Brandt, K.K. Comparison of metals and tetracycline as selective agents for development of tetracycline resistant bacterial communities in agricultural soil. Environ. Sci. Technol. 2017, 51, 3040–3047. [Google Scholar] [CrossRef] [PubMed]
  14. Conde-Cid, M.; Fernández-Calviño, D.; Nóvoa-Muñoz, J.C.; Núñez-Delgado, A.; Fernández-Sanjurjo, M.J.; Arias-Estévez, M.; Álvarez-Rodríguez, E. Experimental data and model prediction of tetracycline adsorption and desorption in agricultural soils. Environ. Res. 2019, 177, 108607. [Google Scholar] [CrossRef]
  15. Conde-Cid, M.; Álvarez-Esmorís, C.; Paradelo-Núñez, R.; Nóvoa-Muñoz, J.C.; Arias-Estévez, M.; Álvarez-Rodríguez, E.; Fernández-Sanjurjo, M.J.; Núñez-Delgado, A. Occurrence of tetracyclines and sulfonamides in manures, agricultural soils and crops from different areas in Galicia (NW Spain). J. Clean Prod. 2018, 197, 491–500. [Google Scholar] [CrossRef]
  16. Meisner, A.; Bååth, E.; Rousk, J. Microbial growth responses upon rewetting soil dried for four days or one year. Soil Biol. Biochem. 2013, 66, 188–192. [Google Scholar] [CrossRef]
  17. Fox, D.R.; Landis, W.G. Don’t be fooled—A no-observed-effect concentration is no substitute for a poor concentration–response experiment. Environ. Toxicol. Chem. 2016, 35, 2141–2148. [Google Scholar] [CrossRef] [Green Version]
  18. Rousk, J.; Demoling, L.A.; Bahr, A.; Bååth, E. Examining the fungal and bacterial niche overlap using selective inhibitors in soil. FEMS Microbiol. Ecol. 2008, 63, 350–358. [Google Scholar] [CrossRef] [Green Version]
  19. Bååth, E. Thymidine and leucine incorporation in soil bacteria with different cell size. Microb. Ecol. 1994, 27, 267–278. [Google Scholar] [CrossRef]
  20. Bååth, E.; Pettersson, M.; Söderberg, K.H. Adaptation of a rapid and economical microcentrifugation method to measure thymidine and leucine incorporation by soil bacteria. Soil Biol. Biochem. 2001, 33, 1571–1574. [Google Scholar] [CrossRef]
  21. Rousk, J.; Demoling, L.A.; Bååth, E. Contrasting short-term antibiotic effects on respiration and bacterial growth compromises the validity of the selective respiratory inhibition technique to distinguish fungi and bacteria. Microb. Ecol. 2009, 58, 75–85. [Google Scholar] [CrossRef] [PubMed]
  22. Milenkovski, S.; Bååth, E.; Lindgren, P.E.; Berglund, O. Toxicity of fungicides to natural bacterial communities in wetland water and sediment measured using leucine incorporation and potential denitrification. Ecotoxicology 2010, 19, 285–294. [Google Scholar] [CrossRef] [PubMed]
  23. Fernández-Calviño, D.; Rousk, J.; Bååth, E.; Bollmann, U.E.; Bester, K.; Brandt, K.K. Ecotoxicological assessment of propiconazole using soil bacterial and fungal growth assays. Appl. Soil Ecol. 2017, 115, 27–30. [Google Scholar] [CrossRef]
  24. Demoling, L.A.; Bååth, E. The use of leucine incorporation to determine the toxicity of phenols to bacterial communities extracted from soil. Appl. Soil Ecol. 2008, 38, 34–41. [Google Scholar] [CrossRef]
  25. Winckler, C.; Grafe, A. Use of veterinary drugs in intensive animal production. J. Soils Sediments 2001, 1, 66. [Google Scholar] [CrossRef]
  26. Hu, X.; Zhou, Q.; Luo, Y. Occurrence and source analysis of typical veterinary antibiotics in manure, soil, vegetables and groundwater from organic vegetable bases, northern China. Environ. Pollut. 2010, 158, 2992–2998. [Google Scholar] [CrossRef]
  27. Karcı, A.; Balcıoğlu, I.A. Investigation of the tetracycline, sulfonamide, and fluoroquinolone antimicrobial compounds in animal manure and agricultural soils in Turkey. Sci. Total Environ. 2009, 407, 4652–4664. [Google Scholar] [CrossRef]
  28. Brambilla, G.; Patrizii, M.; De Filippis, S.P.; Bonazzi, G.; Mantovi, P.; Barchi, D.; Migliore, L. Oxytetracycline as environmental contaminant in arable lands. Anal. Chim. Acta 2007, 586, 326–329. [Google Scholar] [CrossRef] [Green Version]
  29. Andreu, V.; Vazquez-Roig, P.; Blasco, C.; Picó, Y. Determination of tetracycline residues in soil by pressurized liquid extraction and liquid chromatography tandem mass spectrometry. Anal. Bioanal. Chem. 2009, 394, 1329–1339. [Google Scholar] [CrossRef] [Green Version]
  30. Walters, E.; McClellan, K.; Halden, R.U. Occurrence and loss over three years of 72 pharmaceuticals and personal care products from biosolids–soil mixtures in outdoor mesocosms. Water Res. 2010, 44, 6011–6020. [Google Scholar] [CrossRef] [Green Version]
  31. Cycoń, M.; Mrozik, A.; Piotrowska-Seget, Z. Antibiotics in the Soil Environment—Degradation and Their Impact on Microbial Activity and Diversity. Front. Microbiol. 2019, 10, 338. [Google Scholar] [CrossRef]
  32. Menz, J.; Olsson, O.; Kümmerer, K. Antibiotic residues in livestock manure: Does the EU risk assessment sufficiently protect against microbial toxicity and selection of resistant bacteria in the environment? J. Hazard. Mater. 2019, 379, 120807. [Google Scholar] [CrossRef] [PubMed]
  33. Fang, H.; Han, L.; Cui, Y.; Xue, Y.; Cai, L.; Yu, Y. Changes in soil microbial community structure and function associated with degradation and resistance of carbendazim and chlortetracycline during repeated treatments. Sci. Total Environ. 2016, 572, 1203–1212. [Google Scholar] [CrossRef] [PubMed]
  34. Danilova, N.; Galitskaya, P.; Selivanovskaya, S. Veterinary antibiotic oxytetracycline’s effect on the soil microbial community. J. Ecol. Environ. 2020, 44, 1–9. [Google Scholar] [CrossRef]
  35. Lueking, A.D.; Huang, W.; Soderstrom-Schwarz, S.; Kim, M.; Weber, W.J. Relationship of soil organic matter characteristics to organic contaminant sequestration and bioavailability. J. Environ. Qual. 2000, 29, 317–323. [Google Scholar] [CrossRef]
  36. Hund-Rinke, K.; Simon, M.; Lukow, T. Effects of tetracycline on the soil microflora: Function, diversity, resistance. J. Soils Sediment. 2004, 4, 11. [Google Scholar] [CrossRef]
  37. Schmitt, H.; Martinali, B.; Van Beelen, P.; Seinen, W. On the limits of toxicant-induced tolerance testing: Cotolerance and response variation of antibiotic effects. Environ. Toxicol. Chem. 2006, 25, 1961–1968. [Google Scholar] [CrossRef] [Green Version]
  38. Fang, H.; Han, Y.; Yin, Y.; Pan, X.; Yu, Y. Variations in dissipation rate, microbial function and antibiotic resistance due to repeated introductions of manure containing sulfadiazine and chlortetracycline to soil. Chemosphere 2014, 96, 51–56. [Google Scholar] [CrossRef]
  39. Kulshrestha, P.; Giese, R.F.; Aga, D.S. Investigating the molecular interactions of oxytetracycline in clay and organic matter: Insights on factors affecting its mobility in soil. Environ. Sci. Technol. 2004, 38, 4097–4105. [Google Scholar] [CrossRef]
  40. Figueroa, R.A.; MacKay, A.A. Sorption of oxytetracycline to iron oxides and iron oxide-rich soils. Environ. Sci. Technol. 2005, 39, 6664–6671. [Google Scholar] [CrossRef]
  41. Sassman, S.A.; Lee, L.S. Sorption of three tetracyclines by several soils: Assessing the role of pH and cation exchange. Environ. Sci. Technol. 2005, 9, 7452–7459. [Google Scholar] [CrossRef] [PubMed]
  42. Pinck, L.A.; Holton, W.F.; Allison, F.E. Antibiotics in soils: 1. Physico-chemical studies of antibiotic-clay complexes. Soil Sci. 1961, 91, 22–28. [Google Scholar] [CrossRef]
  43. Sithole, B.B.; Guy, R.D. Models for tetracycline in aquatic environments. Water Air Soil Poll. 1987, 32, 303–314. [Google Scholar] [CrossRef]
  44. Ter Laak, T.L.; Gebbink, W.A.; Tolls, J. Estimation of soil sorption coefficients of veterinary pharmaceuticals from soil properties. Environ. Toxicol. Chem. 2006, 25, 933–941. [Google Scholar] [CrossRef] [PubMed]
  45. Figueroa, R.A.; Leonard, A.; MacKay, A.A. Modeling tetracycline antibiotic sorption to clays. Environ. Sci. Technol. 2004, 38, 476–483. [Google Scholar] [CrossRef] [PubMed]
  46. Gu, C.; Karthikeyan, K.G.; Sibley, S.D.; Pedersen, J.A. Complexation of the antibiotic tetracycline with humic acid. Chemosphere 2007, 66, 1494–1501. [Google Scholar] [CrossRef]
  47. Zhao, Y.; Gu, X.; Gao, S.; Geng, J.; Wang, X. Adsorption of tetracycline (TC) onto montmorillonite: Cations and humic acid effects. Geoderma 2012, 183, 12–18. [Google Scholar] [CrossRef]
  48. Zhang, D.; Yang, S.; Wang, Y.; Yang, C.; Chen, Y.; Wang, R.; Wang, Z.; Yuan, X.; Wang, W. Adsorption characteristics of oxytetracycline by different fractions of organic matter in sedimentary soil. Environ. Sci. Pollut. Res. 2019, 26, 5668–5679. [Google Scholar] [CrossRef] [PubMed]
  49. Liu, X.; Zhang, H.; Luo, Y.; Zhu, R.; Wang, H.; Huang, B. Sorption of oxytetracycline in particulate organic matter in soils and sediments: Roles of pH, ionic strength and temperature. Sci. Total Environ. 2020, 714, 136628. [Google Scholar] [CrossRef]
  50. Pils, J.R.; Laird, D.A. Sorption of tetracycline and chlortetracycline on K-and Ca-saturated soil clays, humic substances, and clay−humic complexes. Environ. Sci. Technol. 2007, 41, 1928–1933. [Google Scholar] [CrossRef]
Figure 1. Relative bacterial community growth in response to the oxytetracycline (OTC) addition to the soil after 1, 8 and 42 incubation days in four soil samples (used as example). (AD), represent soil samples 2, 7, 18 and 21 (Table S1, Supplementary material).
Agronomy 10 01011 g001
Figure 2. Relative bacterial community growth in response to chlortetracycline (CTC) addition to the soil after 1, 8 and 42 incubation days in 4 soil samples (used as example). (AD) represent soil samples 3, 10, 11 and 20 (Table S1, Supplementary material).
Agronomy 10 01011 g002
Figure 3. Comparison of oxytetracycline (OTC) and chlortetracycline (CTC) toxicity for four soils (used as example) after 1 incubation day. (AD) represent soil samples 1, 9, 12 and 22 (Table S1, Supplementary material).
Agronomy 10 01011 g003
Table 1. Oxytetracycline toxicity on soil bacterial community growth estimated as log IC10 and log IC50 values (mean ± standard error, n = 3) after 1, 8, and 42 incubation days. R2 values represent the coefficients of determination for the logistic model.
Day 1Day 8Day 42
log IC50log IC10R2log IC50log IC10R2log IC50log IC10R2
12.42 ± 0.171.330.9352.82 ± 0.082.250.9492.65 ± 0.051.860.989
22.79 ± 0.072.020.9782.98 ± 0.042.390.9872.88 ± 0.062.250.978
32.45 ± 0.101.410.9702.72 ± 0.141.400.9413.14 ± 0.052.710.964
42.51 ± 0.151.280.9472.99 ± 0.082.330.9492.77 ± 0.081.720.971
53.31 ± 0.203.310.8863.04 ± 0.121.830.9623.29 ± 0.052.940.871
63.12 ± 0.180.760.9452.49 ± 0.191.300.9572.47 ± 0.101.470.986
72.84 ± 0.102.030.9532.85 ± 0.092.110.9532.76 ± 0.042.210.986
82.73 ± 0.101.920.9563.03 ± 0.112.420.9013.10 ± 0.072.440.946
92.69 ± 0.042.000.9922.71 ± 0.052.250.9772.65 ± 0.052.330.972
102.99 ± 0.240.760.9102.86 ± 0.091.600.9672.93 ± 0.081.500.979
113.09 ± 0.132.150.8993.18 ± 0.112.350.9003.06 ± 0.092.420.920
123.15 ± 0.064.400.9842.84 ± 0.031.950.9942.82 ± 0.112.080.933
132.15 ± 0.090.970.9832.30 ± 0.101.490.9712.14 ± 0.121.130.969
142.19 ± 0.081.300.9852.45 ± 0.051.560.9912.62 ± 0.032.020.994
152.38 ± 0.150.860.9572.56 ± 0.091.690.9712.60 ± 0.031.720.997
161.93 ± 0.090.830.9862.18 ± 0.210.820.9732.50 ± 0.051.500.993
172.05 ± 0.150.730.9652.59 ± 0.180.990.9312.25 ± 0.041.460.995
182.86 ± 0.141.910.9052.94 ± 0.061.960.9782.91 ± 0.091.750.966
192.34 ± 0.121.020.9702.62 ± 0.160.650.9623.17 ± 0.151.520.935
203.03 ± 0.032.160.9943.06 ± 0.101.790.9573.06 ± 0.122.410.877
213.18 ± 0.101.950.9573.41 ± 0.072.200.9793.10 ± 0.172.000.856
223.30 ± 0.082.460.9393.33 ± 0.112.510.8913.48 ± 0.143.100.943
Table 2. Chlortetracycline toxicity on soil bacterial community growth estimated as log IC10 and log IC50 values (mean ± standard error, n = 3) after 1, 8, and 42 incubation days. R2 values represent the coefficients of determination for the logistic model.
Day 1Day 8Day 42
log IC50log IC10R2log IC50log IC10R2log IC50log IC10R2
11.81 ± 0.110.360.9852.49 ± 0.130.560.9772.68 ± 0.012.030.999
22.66 ± 0.042.090.9902.61 ± 0.081.980.9722.53 ± 0.051.880.989
31.73 ± 0.140.710.9671.88 ± 0.190.470.9692.38 ± 0.171.090.953
42.39 ± 0.101.140.9622.78 ± 0.121.970.9392.78 ± 0.121.870.946
52.12 ± 0.190.650.9561.72 ± 0.18−0,020.9722.67 ± 0.220.540.935
62.89 ± 0.061.750.9852.89 ± 0.051.990.9863.10 ± 0.042.100.988
72.44 ± 0.071.230.9872.25 ± 0.201.220.9182.54 ± 0.091.450.975
82.23 ± 0.031.280.9972.56 ± 0.141.470.9452.60 ± 0.101.680.966
91.82 ± 0.130.140.9832.19 ± 0.121.220.9712.18 ± 0.160.580.971
102.65 ± 0.051.650.9922.56 ± 0.061.630.9893.01 ± 0.012.430.998
111.60 ± 0.17−0,170.9772.03 ± 0.170.490.9632.80 ± 0.082.250.952
122.46 ± 0.111.090.9762.44 ± 0.260.510.9212.73 ± 0.070.810.991
131.84 ± 0.100.560.9861.91 ± 0.090.750.9911.85 ± 0.250.540.961
141.11 ± 0.11−0,750.9941.96 ± 0.170.610.9601.60 ± 0.120.170.986
151.97 ± 0.130.480.9801.86 ± 0.090.540.9901.96 ± 0.100.670.985
161.37 ± 0.130.280.9761.66 ± 0.170.480.9591.69 ± 0.150.450.971
171.25 ± 0.23−0,530.9701.81 ± 0.110.320.9861.63 ± 0.070.320.995
182.05 ± 0.090.790.9871.75 ± 0.160.150.9742.04 ± 0.260.370.930
191.81 ± 0.110.480.9852.04 ± 0.120.990.9722.18 ± 0.080.620.991
202.31 ± 0.081.300.9842.29 ± 0.071.280.9882.63 ± 0.151.870.945
212.05 ± 0.120.920.9742.51 ± 0.131.640.9512.52 ± 0.061.520.989
222.48 ± 0.200.810.9332.70 ± 0.090.710.9874.25 ± 0.502.220.873
Table 3. Pearson correlation coefficients between properties of the studied soils (n = 22) and log IC50 and log IC10 estimated for oxytetracycline after 1, 8 and 42 incubation days.
pHwpHKCleCECCSandSiltClayDOC
log IC50 1 day−0.465 *−0.436 *0.1570.574 **0.371−0.507 *0.554 **0.367
log IC50 8 days−0.317−0.2760.1750.2560.440 *−0.438 *0.0930.134
log IC50 42 days−0.178−0.1770.1050.3450.249−0.3140.2800.345
log IC10 1 day−0.243−0.301−0.074−0.0170.213−0.3240.430 *0.065
log IC10 8 days−0.425 *−0.400−0.184−0.0370.656 **−0.605 **−0.023−0.196
log IC10 42 days−0.224−0.232−0.0560.1760.348−0.4080.2870.246
pHW, pH measured in water; pHKCl, pH measured in 0.1 M KCl; eCEC, effective cation exchange capacity; C, total carbon; DOC, dissolved organic carbon. ** p < 0.01. * p < 0.05.
Table 4. Pearson correlation coefficients between properties of the studied soils (n = 22) and log IC50 and log IC10 estimated for chlortetracycline after 1, 8 and 42 incubation days.
pHwpHKCleCECCSandSiltClayDOC
log IC501 day−0.489 *−0.499 *−0.0440.531 *0.475 *−0.584 **0.486 *0.256
log IC508 days−0.506 *−0.560 **−0.1660.470 *0.647 **−0.682 **0.2710.047
log IC5042 days−0.461 *−0.485 *−0.0120.610 **0.467 *−0.564 **0.442 *0.338
log IC101 day−0.397−0.395−0.0290.4150.484 *−0.553 **0.3480.193
log IC108 days−0.384−0.391−0.1110.3750.549 **−0.539 **0.093−0.017
log IC1042 days−0.549 **−0.548 **−0.1490.3950.703 **−0.687 **0.1060.125
pHW, pH measured in water; pHKCl, pH measured in 0.1 M KCl; eCEC, effective cation exchange capacity; C, total carbon; DOC, dissolved organic carbon. ⁎⁎ p < 0.01. p < 0.05.

