Article

Different Ground Vegetation Cover Management Systems to Manage Cynodon dactylon in an Irrigated Vineyard

by
Francisco Valencia-Gredilla
1,
Aritz Royo-Esnal
1,*,
Alejandro Juárez-Escario
2 and
Jordi Recasens
1
1
Departament of Hortofruticulture, Botany and Landscaping, Agrotecnio, University of Lleida, Alcalde Rovira Roure 191, 25198 Lleida, Spain
2
Departament of Plant Production and Forest Science, Agrotecnio, University of Lleida, Alcalde Rovira Roure 191, 25198 Lleida, Spain
*
Author to whom correspondence should be addressed.
Agronomy 2020, 10(6), 908; https://doi.org/10.3390/agronomy10060908
Submission received: 5 June 2020 / Revised: 18 June 2020 / Accepted: 22 June 2020 / Published: 25 June 2020
(This article belongs to the Special Issue Weed Management & Sustainable Agriculture)

Abstract

:
Ground cover management in vineyards in Spain is focused on minimizing soil erosion and compaction. Such practices have influenced the weed community structure in the inter-rows, contributing to the spread of the high noxious weed Cynodon dactylon (L.) Pers. This fact highlights the need for further investigation of the interaction between ground cover practices and weed control techniques. In this study, the effect of four different ground cover managements (M) in the inter-rows on C. dactylon population dynamics (changes in coverage and frequency) was assessed over three seasons (2015–2017): (M1) a no-till spontaneous vegetation ground cover managed by shredding; (M2) a no-till spontaneous vegetation ground cover managed by shredding plus herbicide application, (M3) tilled soil and spontaneous vegetation growing; and (M4) tilled soil and a barley cover crop seeded (Hordeum vulgare L.). Cynodon dactylon and the other weeds responded differently to the various weed control methods. After three seasons, the barley cover crop was the most efficient management system to control C. dactylon and other weeds. Final soil cover in barley cover crop and tilled soil with spontaneous vegetation were 0.5% and 1.1%, respectively, compared to 3.7% and 7.7% obtained by spontaneous vegetation shredded with and without herbicide application, respectively. In addition, total weed frequency varied from 9.7% for barley cover crop to 45.8% for spontaneous vegetation only shredded. Weed community composition changed due to the pressure exerted by each management and the adaptive strategy of the different species. This study highlights the importance of knowledge of how vegetation management influences weed flora to improve the sustainability of wine grape production systems.

1. Introduction

Grapes are one of the most important and profitable crops in the world. Wine production has increased 17% from 2017 to 2018, with 292 million hL (global wine production in 2018), and the global vineyard cover is about 7.4 million hectares in 2018 [1]. However, grape production can be reduced due to the presence of weeds, which negatively affect the productivity of crops [2] by competing for water and nutrients. Weed control in vineyards has been usually carried out by tillage or herbicide applications; however, the establishment of ground covers has gained interest and has been implemented for different reasons [3,4]. In general, vineyard soil management involves different procedures focused on organic matter improvement, water availability, biodiversity enhancement, reduction of soil erosion, vine vigor, or weed control [5]. However, tillage and herbicide applications have been changing over time for different reasons. On one hand, leaving the soil surface without any ground cover increases the erosion risk, with vineyards being one of the most affected crops [6,7]. On the other hand, the use of herbicides as the main tool for the control of weeds not only contaminates the environment, but it can also negatively affect vines by reducing root mycorrhization or altering nutrient composition in grapevine roots, leaves, or grape juice [8]. The reiterative use of herbicide increases the risk of evolving weed herbicide resistance, many of which appear in vineyards, such as C. bonariensis, Lolium rigidum, or Amaranthus retroflexus, among others [9]. In addition, environmentally friendly agronomic techniques are desired because wine consumers and producers are more aware of the environmental impacts of wine and consumers have a positive image of organic cultivation methods [10,11].
Ground covers are alternative soil managements to mechanical cultivation or herbicide applications. Spontaneous ground covers or sowed cover crops are sustainable floor management techniques that offer a variety of agronomic and environmental advantages, i.e., reduction of soil erosion and water runoff or increasing of organic matter, nutrient availability, or benefiting soil biota [12,13,14]. Moreover, weed management practices that promote higher plant diversity and density have shown to favor arthropod weed seed predators, promoting beneficial entomofauna and contributing to weed growth suppression [15,16,17,18]. Cover crops can compete with weeds for resources, but they can also release allelochemicals that interfere with their growth [19,20], which can be implemented to control difficult to manage weed species, which is the case of Cynodon dactylon L. (Pers).
Cynodon dactylon is a stoloniferous and rhizomatous perennial grass considered as one of the world’s worst weeds [21]. Its water stress tolerance makes it a very efficient species in water and nutrient use, and its vegetative structures contribute to the colonization of new areas, especially when soil is disturbed [22,23,24]. The base temperature (in soil) for bud sprouting is 10 °C [25], below which the weed becomes dormant and control measures are less effective. Cynodon dactylon (variety “princess 77”) had been reported not to be controlled after a single glyphosate (N-(phosphonomethyl) glycine) application (36% at 4 L ha−1), although different phytotoxic effects were observed [26], but different applications can reduce weed biomass and groundcover in more than 99% during the warm season with glyphosate (48.7% at 9 L ha ha−1) [27]. Tillage can be performed to control C. dactylon, but this tool could be ineffective because, besides possibly requiring several interventions, it contributes to the fragmentation and dispersal of its rhizomes and stolons, and from them, new plants can be formed [28,29]. On the contrary, shading can reduce C. dactylon infestations due to the lack of tolerance to the shade of this weed [23,25].
When the establishment and management of the ground vegetation cover are focused on C. dactylon control, it should bring a dense canopy to cover this shade-intolerant species. In addition, because the ground cover management can influence weed flora composition [15], it is essential to select the most appropriate management (type of cover and the combination with other tools such as herbicide applications or tillage) to avoid the proliferation of other problematic weeds in vineyards, such as C. bonariensis or Bassia scoparia [30].
Due to the different efficacy of tillage or herbicide applications over C. dactylon, its integration with a ground cover could improve the control of this noxious weed. Based on the hypothesis that the presence of a vegetation cover exerts a competitive effect against C. dactylon, the objective of this work is to study the effect of such cover, either natural (spontaneous) or implemented (barley, as a representative cover crop), in combination with tools as shredding, tillage, and herbicide applications. Since some weeds can benefit from particular control methods against a specific weed, a second objective was considered to study the effect of the different managements on the weed community composition.

2. Materials and Methods

2.1. Study Area

The experiment was conducted in a commercial wine grape vineyard in Raimat (Lleida, NE Spain) from 2015 to 2017. The climate is semi-arid Mediterranean with an annual rainfall of 342 mm and a mean annual temperature of 15 °C [31]. The vineyard was established in May 1988 with Cabernet Sauvignon (Vitis vinifera L.). Rows were separated by 3 m and vine spacing of 1.5 m. Vines were trained as bilateral cordons and were drip irrigation.
The traditional soil management in the farm consists of shredding the inter-rows spontaneous flora 2–3 times per season and 4–5 herbicide intra-row applications across the season. The applied herbicides were glyphosate (36% at 3.5 L ha−1), twice in winter and once in summer, plus a mixture of glyphosate (36% at 3.5 L ha−1) and oxyfluorfen (24% at 3 L ha−1), once in spring and once in summer. Herbicide applications were carried out with a tractor-mounted crop-sprayer with two fan-type nozzles. Initially, there was an important infestation, both intra- and inter-row of C. dactylon, and that was estimated between 4% and 10% at the beginning of the experiment.

2.2. Experimental Design

A completely randomized design was carried out, with four different soil management systems (treatments) placed in different inter-rows of 100 m long by 2 m wide (Table 1) with four replications.
  • Management 1 (M1): a no-till spontaneous vegetation ground cover managed by shredding. The cover was shredded three times per season (May, July, and September). Shredding was performed when the spontaneous vegetation reached a height that could interfere with the vine growth. The exact shredding dates varied as the accumulated biomass of this spontaneous vegetation varied with the climatic conditions each season.
  • Management 2 (M2): a no-till spontaneous vegetation ground cover managed by shredding plus regular herbicide application focused on C. dactylon (glyphosate 36% at 3.5 L ha−1). Each season the ground cover was shredded three times as in M1, and two herbicide applications were performed, one in May, when the weed was actively growing and other in November, when the plant stopped its development after the mean temperature dropped under 10 °C. Applications were focused in the areas where C. dactylon was present. Herbicide was applied with a tractor-mounted crop-sprayer with five low drift nozzles (HARDI LD–110, ILEMO HARDI S.A.U., Lleida, Spain) when the weed was actively growing and more susceptible to the treatments.
  • Management 3 (M3): inter-row tilling. In April 2015, the ground cover was shredded and the soil was sub-soiled and tilled. The spontaneous cover was shredded in July and October and tilled in October. In 2016, the cover was shredded twice (June and October) and tilled once (October). In 2017, the ground cover was also shredded twice (June and October) but not tilled, because the trial ended. Tillage was performed with a chisel plow at a soil depth of 20 cm.
  • Management 4 (M4): inter-row tilling and barley cover crop (Hordeum vulgare L.) sowed in autumn. Management activities were similar to M3, but barley var. Meseta was sowed as cover crop at a rate of 150 kg ha−1 in November 2015 and 2016. This variety was selected for its good coverage, with low height and high tillering capacity [32]. Barley was shredded when its life cycle finished in June 2016 and 2017, providing a mulch of straw. Seed-bed preparation was performed with a chisel plow at a soil depth of 20 cm, and barley was sown with a vineyard seeder. No fertilization was applied.

2.3. Weed Sampling

Cynodon dactylon coverage was monitored in sixteen 2 × 10 m2 plots (four for each management) situated in the center of the inter-rows, covering the area occupied by the ground cover. To carry out the surveys, each plot was subdivided into 80 subplots of 0.5 × 0.5 m. The weed coverage of each subplot and weed frequency were recorded. For the weed coverage, the mean of the 80 subplots was considered for each repetition, while for the frequency, it was just the percentage of subplots with the presence of C. dactylon. Samplings were performed in March (previous to the management implementation) and July 2015, February, May, and September 2016, and February, June, and September 2017. In order to understand the effect of each management as a whole, the final change on the percentage of coverage and frequencies were analyzed. For each management, these final changes are the percentage of increase or decrease observed at the end of the experiment (September 2017) for the corresponding variable considering their respective initial value (March 2015).
With the aim to reflect the spatial and temporal dynamics of C. dactylon in the experiment, one plot of each ground management was represented using the graph builder of JMP Pro 14 software with the option “contour: shows regions of data density” (SAS Institute 2010. SAS Campus Drive, Cary, NC 27513, USA. SAS Institute, Inc.).
At the end of the experiment, weed surveys were performed in the plots in April of 2017.

2.4. Statistical Analyses

Cynodon dactylon percentages of coverage and frequencies between managements and sampling dates, and their final change, were compared by several one-way ANOVAs and Tukey’s honestly significant difference (HSD) (p < 0.05). Since field operations (till versus no till, herbicide versus no herbicide, and so on) affected C. dactylon coverage and frequency, it was decided to compare these variables separately for each management by date, and between managements for each date, discarding a two-way ANOVA. The original data were log or square-root transformed if needed to achieve normality and homoscedasticity. In the case of heteroscedasticity, data were subjected to the Kruskal–Wallis H test and post-hoc Dunn’s test at p ≤ 0.05. Analyses and graphs were performed with JMP Pro 14 software (SAS Institute 2010. SAS Campus Drive, Cary, NC 27513, USA. SAS Institute, Inc.) and SigmaPlot 11.0 (Systat Software, San Jose, CA, USA). In order to evaluate differences in weed species composition among the four management systems, based on the gradient of the variability in the species-plot response data (2.8 SD units), which showed a linear method to be the best option, a redundancy analysis (RDA) was performed. The response data were first log-transformed and centered by species, and a Monte Carlo permutation test was conducted in all constrained axes In addition, as a supplement of the RDA analysis, an analysis of the diagnostic species for each management system was performed, using the phi (ϕ) coefficient of association, which is independent of the number of samples, and it is little affected by the relative size of the sample unit [33]. Both analyses were performed with CANOCO 5.0 [34].

3. Results

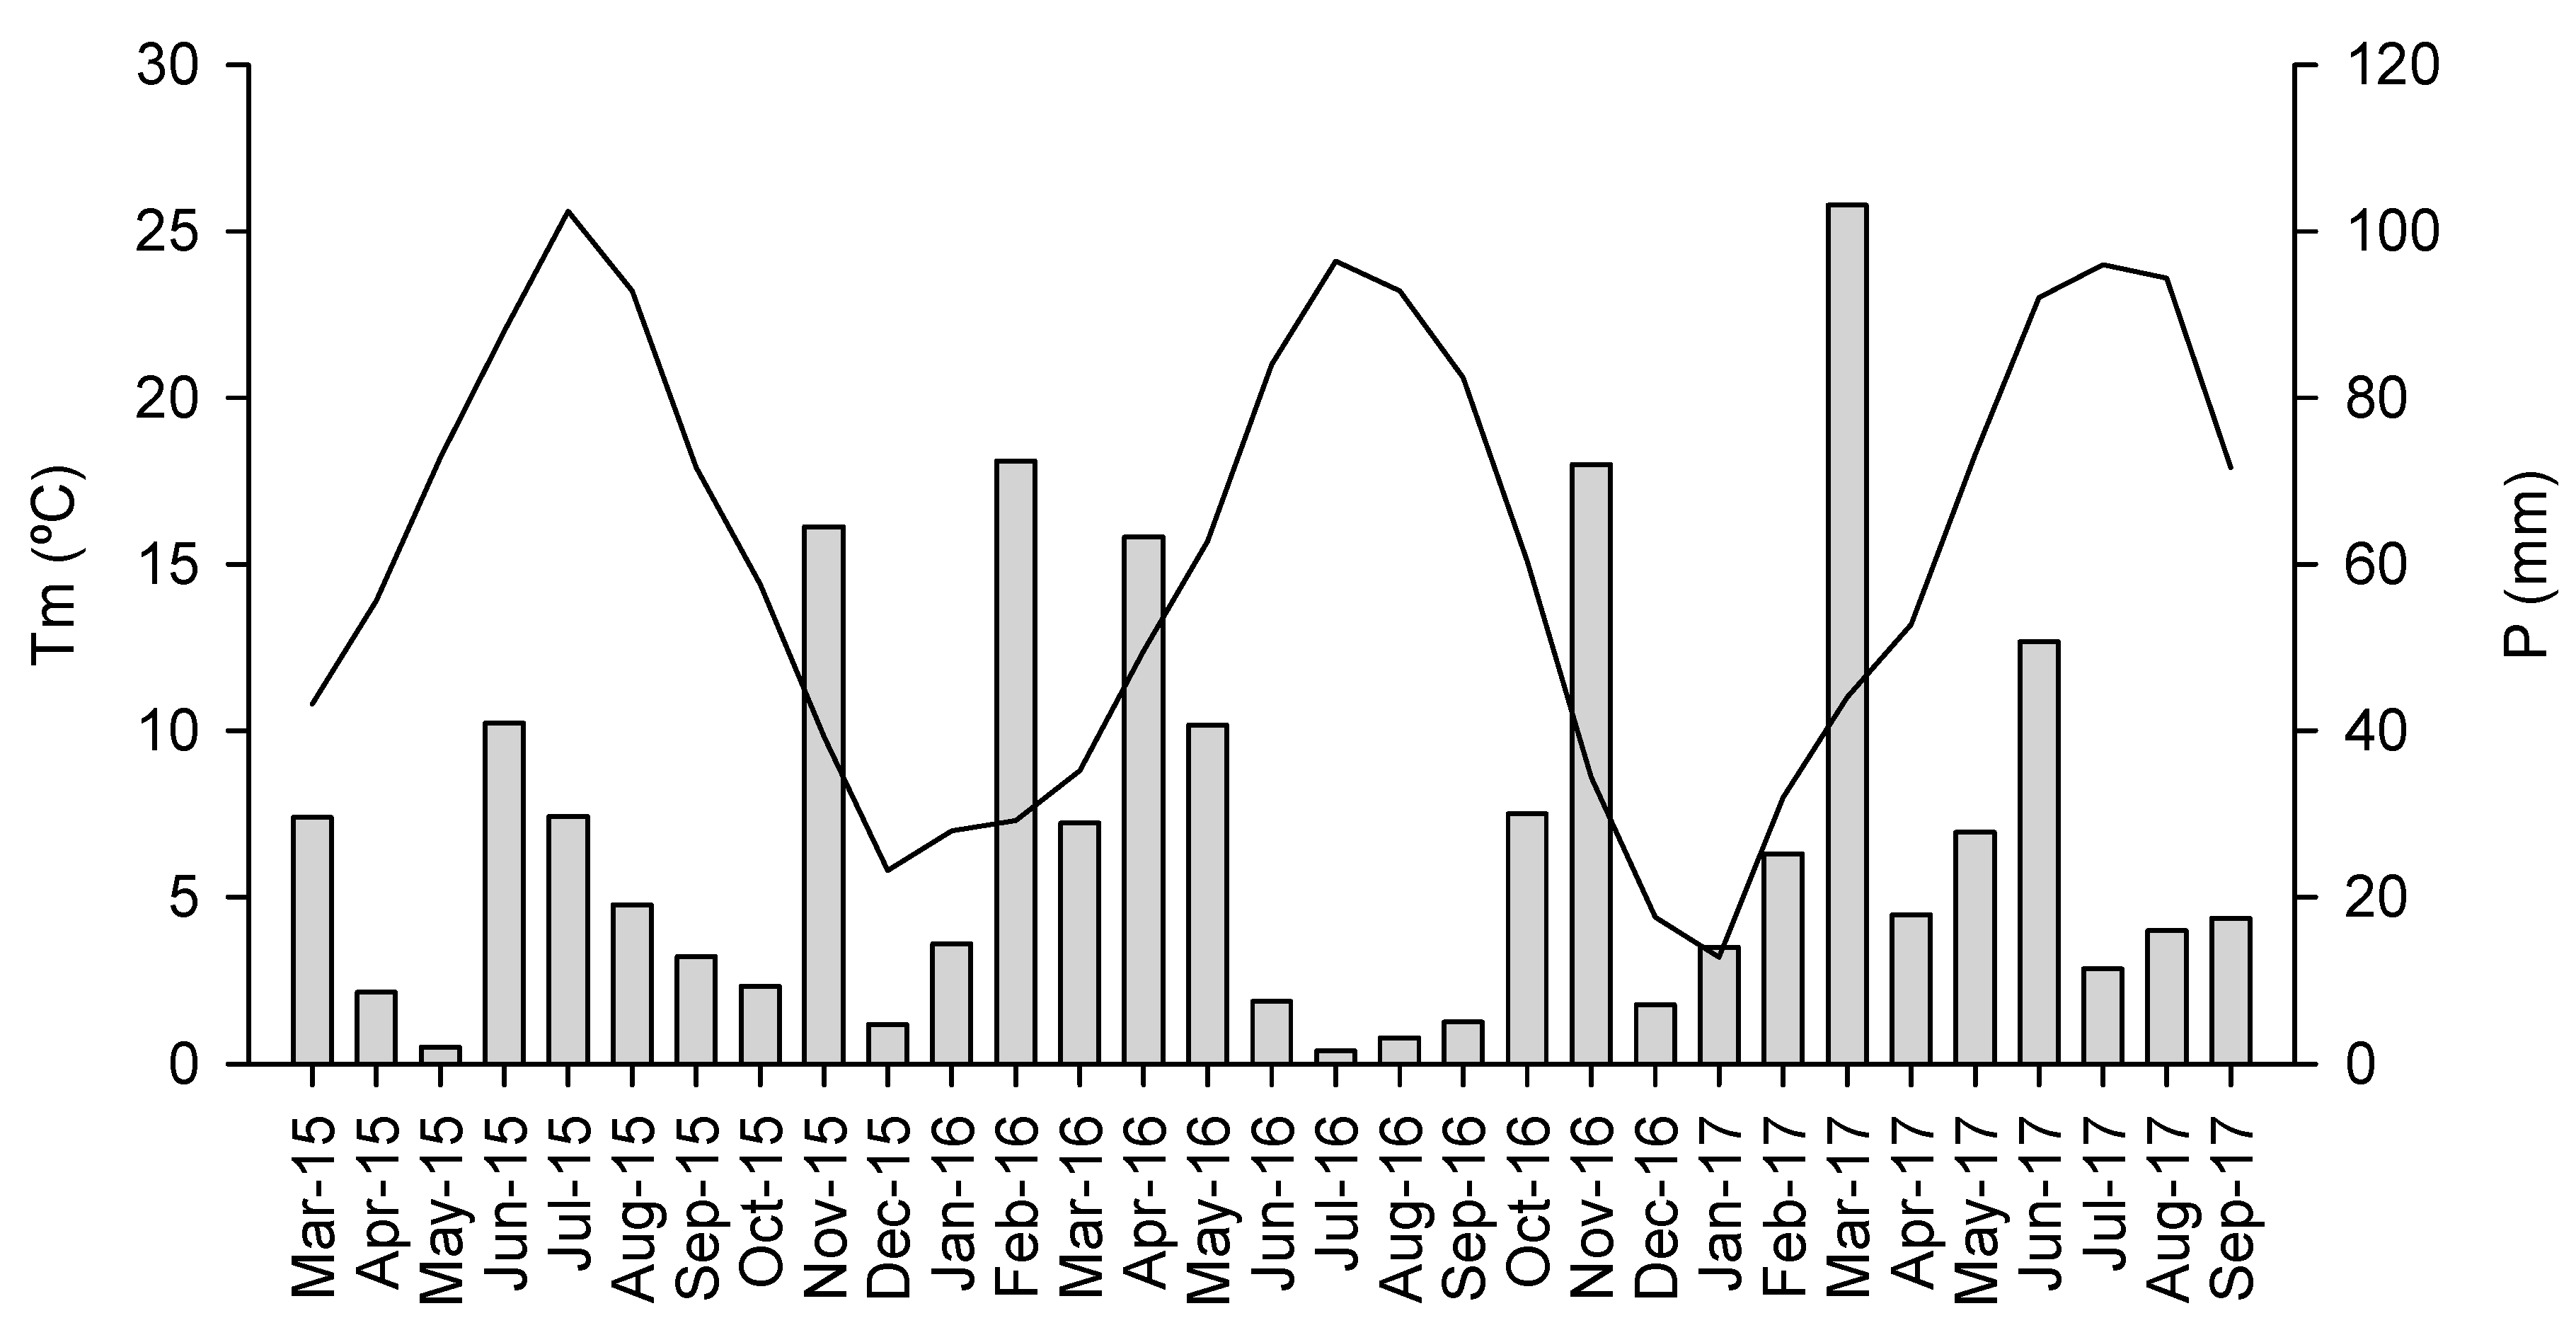
3.1. Climatic Conditions

Average monthly temperatures were similar during the period when C. dactylon was actively growing (temperatures above 10 °C), but precipitations differed (Figure 1). Temperatures averaged 12–14 °C between March and May (spring); 23–24 °C between June and August (summer); 14–15 °C between September and November (autumn); and 5–7 °C between December and February (winter). Total spring precipitation was lower in 2015 (40 mm) than 2016 and 2017 (133 and 149 mm, respectively). During summer, 2015 presented the highest precipitation (90 mm) followed by 2017 (78 mm), and being lowest in 2016 (12 mm). In autumn, 87 mm were registered in 2015 and 107 mm was registered in 2016. It must be pointed out that autumn rains were concentrated in November, falling 64.5 mm and 72.0 mm, respectively in 2015 and in 2016. Winter precipitation in 2015–2016 doubled that from 2016–2017 (92 mm versus 46 mm) (Figure 1).

3.2. Cynodon Dactylon Response to Management

Infestation levels of C. dactylon varied among managements and sampling dates, both in percentages of soil coverage and frequency (Table 2 and Table 3; Figure 2).
Barley cover crop (M4) significantly reduced the C. dactylon coverage from 7.4% to 0.5%, which results in a 93.9% reduction (Table 2). The spontaneous tilled cover also obtained a high reduction effect, with an initial 6.6% of coverage that decreased until 1.1% at the last sampling date (82.2% of coverage reduction). The spontaneous cover crop plus herbicide application management (M2) obtained a 62.4% of reduction (coverage values that varied from 9.7% to 3.7%). In the case of M1, no-till spontaneous vegetation ground cover was managed by shredding, and the initial weed coverage value (4.2%) increased until 7.7%, which results in an 82.5% of increase, a value that is significantly different to those obtained by the managements with soil disturbance (M3 and M4) (Table 2).
Managements affected weed coverage differently across the three seasons. Before management implementation, there were no significant differences (March 2015) among the plots selected for the four management systems. In July 2015, after tillage for M3 and M4, significant differences were observed between M1 and M2 (>3.2%) and M3 and M4 (≤0.5%). In February 2016, there were statistical differences between M1 (2.9%) and M4 (0%), which were maintained in May 2016 (7.4% and 0.1%, respectively for M1 and M4). One year after the barley cover crop establishment (September 2016), M3 and M4 maintained significantly lower infestation levels (0.6%) than M1 (5.9%) but not M2 (4.9%). These differences were maintained until June 2017, but in September 2017, M4 showed the lowest C. dactylon coverage (0.5%), which was statistically similar to M3 (1.1%), and different from M2 (3.7%) and M1 (7.7%).
Regarding the percentage of C. dactylon frequency, it particularly decreased in those managements with soil disturbance (M3 and M4) (Table 3). The comparison between the first and the last sampling dates along the three seasons showed a decrease of the presence of C. dactylon in M2 (14.6% frequency reduction), M3 (52%), and M4, which varied from 36.3% to 9.75%, showing the only significant decrease (73.3%). In no-till spontaneous vegetation ground cover managed by shredding (M1), the presence of C. dactylon increased by 89.7%.
Before management implementation (March 2015), the frequency of C. dactylon was similar among the plots selected. In July 2015, after tillage for M3 and M4, the weed frequency was highly reduced for M3 and M4, with low values that were maintained until the last sampling date. At the end of the experiment (September 2017), shredding (M1) and shredding plus herbicide applications (M2) showed the highest percentages of frequency (45.8% and 36.6% respectively), followed by M3 (15.3%). The lowest value was obtained by barley cover crop management, with 9.7%.

3.3. Weed Flora Response to Management

Excluding C. dactylon, a total of 39 weed species were recorded in the weed flora surveys, with 31 species in M1, 14 in M2, 23 in M3, and 6 in M4. The RDA analyses showed a variance of 46.6% on the weed community composition after three years of management (Figure 3). The first axis clearly separates those managements based on shredding from those based on soil disturbance, leading to the selection of different weed communities. Shredding (M1) favored the dominance of perennial species, such as Trifolium repens, Crepis vesicaria, or Convolvulus arvensis. Bromus rubens and Crepis sancta, among others, were related to M2, where shredding and herbicide applications were performed; while soil disturbance (M3 and M4) selected, in general, annual species, such as Papaver rhoeas, Cerastium glomeratum, B. scoparia, or Diplotaxis erucoides (Figure 3).
The species diagnostic for individual management showed that some problematic species for crop yield, such as C. bonariensis, C. arvensis, or Malva sylvestris had not any preferred group. None of the species showed preference to M4 (Barley cover crop) (Table 4).

4. Discussion

The coverage and frequency of C. dactylon varied depending on the management system. Shredding solely (M1) was not only ineffective for controlling this weed, but also increased weed infestation. However, the other strategies (herbicide, tillage, or sowing a barley cover crop) partially controlled C. dactylon. Nevertheless, significant fluctuations of the weed coverage and frequency were observed over time (Table 2 and Table 3).
The inconsistent effect of shredded spontaneous ground cover (M1) can be explained by C. dactylon’s characteristics and by the removal of other weeds that compete with C. dactylon. On one hand, shredding cannot disturb the underground rhizomes and the ground stolons that spread horizontally to the soil surface. On the other hand, this management decreases the presence of other species (whether beneficial or not for vineyard) that could generate more shading, especially in spring and summer. As a consequence, light could reach more efficiently the soil surface, benefiting horizontal growing species, such as C. dactylon [23].
The combination of shredding and herbicide applications (M2) slightly reduced C. dactylon coverage (62.4%), but not its frequency (14.6% of reduction). As described before, shredding alone increased weed infestation, and some authors had reported different weed control levels after glyphosate applications: Abdullahi [28] reported a relatively good control (60%) of this species by glyphosate application at 2.16 kg ha−1 in summer (when the weed is actively growing), its effect remaining for up to 16 weeks, and although Gómez de Barreda et al. [26] observed some phytotoxic effects, it did not control C. dactylon (var “princess 77”) after a single application (36% at 4 L ha−1). Bryson and Wills [35] showed variations in the effectiveness of glyphosate application between rates (1.12 and 2.24 kg ha−1) across 17 different C. dactylon biotypes and observed that 13 weeks after application, the highest rate maintained 70% of control. These results are in accordance with our results and highlight the need to combine herbicide applications with other strategies or to perform more herbicide applications. Farthing et al. [27] observed 72.1% of C. dactylon canopy cover reduction with a single glyphosate application during the warm season (48.7% at 9 L ha ha−1) and biomass and groundcover reduction of more than 98.6% after multiple applications (with or without previous shredding). Mau-Crimmins [36] also reported the effectiveness of glyphosate on C. dactylon removal but that herbicide applications increased other noxious weeds species.
Several factors can affect the herbicide efficacy; for example, the timing of herbicide application is crucial because the weed becomes dormant below 10 °C [25] and herbicide applications are not so effective. In the present study, glyphosate caused phytotoxic effects on C. dactylon, but the weed recovered and the infestation level was unaffected. This result could, again, be explained by the death of the rest of the spontaneous cover species, which reduced the competition against C. dactylon. On the other hand, in sugarcane, Campbell [37] reported that glyphosate applications without tillage, at rates between 1.14 and 2.88 kg ha−1, obtained more than 80% of control 20 weeks after treatment, but when combined with a previous tillage, the control was reduced down to 60%, even at 2.88 kg ha−1.
Tillage is known to be effective in reducing weed infestations level, as it happened in M3 and M4, where its coverage was reduced below 1% after three seasons. This result agrees with the recommendations of Spanish Ministry of Agriculture (MAGRAMA) [38], suggesting soil tillage so that rhizomes and stolons are fragmented as small as possible, while remaining within or close to the soil surface.
Guglielmini and Satorre [24] reported that mechanical cultivation cut and spread the structures of the weed, and although these fragments are then dispersed, only a small proportion of them (which are in contact with the soil) were able to survive and establish. In our case, the fragments that survived tillage also had to face the spontaneous vegetation competition. On the other hand, Dalley et al. [39] reported in sugarcane that conventional tillage (four cultivations of row sides each spring) and reduced tillage (two cultivations) significantly reduced C. dactylon coverage compared to no-till (no cultivation), with mean ground cover values of 60%, 70%, and 90%, respectively. These results agree with Phillips [40] in sorghum crop, who observed that treatments with winter and spring double-ploughing reduced C. dactylon regrowth by 60% and that double spring ploughing reduced additional 33% compared to a single pass.
The management where tillage was combined with barley cover crop (M4) was the most effective in reducing the coverage and frequency (93.9% and 73.3% respectively) of C. dactylon. In this situation, an additive effect seems to be created by seedbed preparation (tillage) with a competitive pressure exerted by barley. At the end of the experiment, there were no significant differences between M3 and M4, but the different percentages, 1.1% and 0.5% respectively (very low in both cases) can be explained by the higher and more homogeneous biomass production obtained with barley than with the spontaneous vegetation. Moreover, barley is a winter cereal that produces a dense shading canopy when C. dactylon begins its growing activity, creating more unfavorable conditions for weed development. The influence of the shade provided by the cover crop could be a crucial factor in the weed management. This factor has previously been reported to reduce C. dactylon infestation [23].
Dong and De Kroon [41] studied the influence of light and nutrients availability in C. dactylon development in terms of morphology plasticity and biomass allocation. They observed that under low light and nutrients level, stolon and rhizome branching was reduced, which can be explained by the influence of barley when competing for light, nutrients, and other resources and consequently reducing weed infestation levels.
Shade treatments have been reported to obtain plants that produced leaves twice as long as the unshaded ones [41]. These aspects could explain part of our results. Barley provides shadow to C. dactylon during some moths, and during this time, the weed can change its growth pattern, producing more orthotropic buds instead of lateral stolons [41], which can make C. dactylon more susceptible to shredding. Dong and De Kroon [41] also reported that plants under low-intensity light, which could have been achieved in our experiment by the vegetation cover canopy, failed developing rhizomes, and stolons biomass allocation was slightly lower. Other cover crop species have been shown to affect C. dactylon development, as reported by Farthing et al. [27], who observed that shredding C. dactylon and overseeding Vicia villosa reduced weed biomass by 50%, although canopy cover was not decreased.
In addition to the shade and competition exerted by the cover crop, the effect on weed suppression can be explained by allelochemicals releasing and by a physical mulch effect once the cover crop is shredded. Ormeño-Núñez et al. [42] reported that rye (Secale cereale L.) mulch on the vine rows reduced 82% of C. dactylon dry matter compared to chemical plus mechanical control. The weed suppression effect by different species implemented as mulch or cover crop has been studied for other authors in vineyards: DeVetter et al. [43] obtained better weed control with straw and living mulch of Festuca rubra L. Pennlawn than with cultivation and herbicides. Steinmaus et al. [44] also obtained good results in weed control by different mulched cover crops. The bioassay study revealed several weeds’ germination and growth reduction, including Echinochloa crus-galli (L.) P.Beauv. and Setaria verticillata (L.) P.Beauv., by extracts of barley and other cereals usually implemented as cover crops in Mediterranean areas [45], while this suppressive effect of barley (and rye) cover crops has also been observed on Solanum ptychanthum Dun. and Setaria glauca (L.) P.Beauv. in the United States [46].
The effect of the different cover crops species to suppress weeds development described in that studies are in agreement, in part, with our results: barley cover crop (M4) has been the management with the lowest number of registered weed species (6 versus 32, 15 and 29 for M1, M2, and M3, respectively. This result is also in accordance with Gago et al. [15], who observed a higher number of weed species in unsown plots than in those sown with cereals. Barley cover crop (M4) and spontaneous ground cover plus herbicide applications (M2) were related with lower species richness than shredding (M1) or tilling a spontaneous cover crop (M3). High amounts of hemicryptophyte species, such as Taraxacum officinale or Trifolium repens, were related to shredding (M1), as described in Figure 3, showing that the weed community was really influenced by the different three-year managements. The amount of species related to M1 is also found in orchards and can be explained because shredding can favor seedling recruitment, the survival, and the reproductive ability of the species [47,48]. In addition, the diagnostic species for individual management classes demonstrated that none of the recorded species showed any preference for barley cover crop (M4), which reinforces the implementation of this cover crop as the most appropriate management for weed control. The lack of preference to any group by some of the most problematic weeds (C. bonariensis, C. avernsis, or M. sylvestris) indicates that none of these species are favored by any management and that their implementation is not discouraged in the presence of these species. Focusing on B. scoparia, which is a very problematic species, the diagnostic species showed M3 as a preferred group. In this case, this result could be explained because B. scoparia is a very fast growing species that can overcome the cover in few days if the cover is not competitive and vigorous enough. Therefore, in the presence of this species, M3 is not recommended or more shredding could be required in order to stop its growth.
Among all managements, only shredding a spontaneous ground cover (M1) has been ineffective, but its combination with other tools, such as herbicide applications or tilling, increased the control of the C. dactylon, although the best management was the implementation of a barley cover crop. In this study, the cover crop has been limited to the inter-row, but in some vineyards, the cover crop is implemented intra-row, with an effective weed control with cover crops species such as Trifolium fragiferum L. [49]. The installation and management of the cover crop under the vines can be crucial for the management of C. dactylon, where this weed frequently gets shelter. Further installation of the cover crop in intra-row areas would reduce herbicide applications and inter-vine interventions, providing easier soil management.
Considering cover crops are non-chemical alternatives for weed management, our results enhance their implementation in a vineyard, which is in accordance with the Directive 2009/128/EC [50] where Integrated Pest Management is promoted.

5. Conclusions

Cover crop implementation can be a useful tool in weed management. In the vineyards that soil maintenance is carried out through vegetation ground covers, it is important to know the weed species that are present to carry out a proper management of the field. If C. dactylon is present, repeated use of the shredder is discouraged, because it not only does not control this weed, but also encourages its development and expansion. For this species, this work demonstrates that the best control strategy is to perform a mechanical intervention that disturbs the soil, such as tillage, combined with the implementation of a vegetation cover. The species selected for this purpose must meet several characteristics, such as rapid implementation and generate a large amount of biomass so that enough shade is provided before C. dactylon organs become active in spring. In this sense, despite the good results with the spontaneous cover, the species composition determines the amount of produced biomass, and this is uncertain. Therefore, sowing an already known species after tillage is the most appealing strategy. On the other hand, the quick effect of the implemented managements on the species composition has been demonstrated. For this reason, a previous study of the weed species present in the field is advisable to consider those that may become problematic in the near future.

Author Contributions

Conceptualization, J.R. and F.V.-G.; methodology, J.R. and F.V.-G.; investigation, J.R., A.R.-E. and F.V.-G.; formal analysis, F.V.-G. and A.J.-E.; resources, J.R.; data curation, F.V.-G.; writing—original draft preparation, F.V.-G.; writing—review and editing, F.V.-G., A.R.-E., A.J.-E., J.R.; project administration, J.R. All authors have read and agreed to the published version of the manuscript.

Funding

This work was funded by the Spanish Ministry of Economy and Competitiveness (AGL2014-52465-C4-2-R and AGL2017-83325-C4-2-R). The first author obtained a PhD grant from the University of Lleida (PhD grants).

Acknowledgments

We would like to acknowledge Codorníu S.A. for allowing and supporting the experiments in their vineyard as well as Maria Casamitjana for the fieldwork support.

Conflicts of Interest

The authors declare no conflict of interest.

Abbreviations

hLHectoliter
FebFebruary
JunJune
AugAugust
SepSeptember
NovNovember
DecDecember
vs.versus

References

  1. OIV (Organisation Internationale de la Vigne et du Vin). Statistical Report on World Vitiviniculture. April 2019. Available online: http://www.oiv.int/public/medias/6782/oiv-2019-statistical-report-on-world-vitiviniculture.pdf (accessed on 27 September 2019).
  2. Oerke, E. Crop losses to pests. J. Agric. Sci. 2006, 144, 31–43. [Google Scholar] [CrossRef]
  3. Pardini, A.; Faiello, C.; Longhi, F. Cover crop species and their management in vineyards and olive groves. Adv. Hortic. Sci. 2002, 16, 225–234. [Google Scholar]
  4. García, L.; Celette, F.; Gary, C.; Ripoche, A.; Valdés-Gómez, H.; Metay, A. Management of service crops for the provision of ecosystem services in vineyards: A review. Agric. Ecosyst. Environ. 2018, 251, 158–170. [Google Scholar] [CrossRef] [Green Version]
  5. Guerra, B.; Steenwerth, K. Influence of floor management technique on grapevine growth, disease pressure, and juice and wine composition: A review. Am. J. Enol. Vitic. 2012, 63, 149–164. [Google Scholar] [CrossRef]
  6. Cerdan, O.; Govers, G.; Le Bissonnais, Y.; Van Oost, K.; Poesen, J.; Saby, N.; Gobin, A.; Vacca, A.; Quinton, J.; Auerwald, K.; et al. Rates and spatial variations of soil erosion in Europe: A study based on erosion plot data. Geomorphology 2010, 122, 167–177. [Google Scholar] [CrossRef]
  7. Prosdocimi, M.; Cerdà, A.; Tarolli, P. Soil water erosion on Mediterranean vineyards: A review. Catena 2016, 141, 1–21. [Google Scholar] [CrossRef]
  8. Zaller, J.G.; Cantelmo, C.; Santos, G.M.; Muther, S.; Gruber, E.; Pallua, P.; Mandl, K.; Friedrich, B.Q.; Hofstetter, I.; Schmuckenschlager, B.; et al. Herbicides in vineyards reduce grapevine root mycorrhization and alter soil microorganisms and the nutrient composition in grapevine roots, leaves, xylem sap and grape juice. Environ. Sci. Pollut. Res. Int. 2018, 25, 23215–23226. [Google Scholar] [CrossRef] [Green Version]
  9. Heap, I. The International Survey of Herbicide Resistant Weeds. Available online: www.weedscience.org (accessed on 8 January 2020).
  10. Viers, J.H.; Williams, J.N.; Nicholas, K.A.; Barbosa, O.; Kotzé, I.; Spence, L.; Leanne, B.W.; Merenlender, A.; Reynolds, M. Vinecology: Pairing wine with nature. Conserv. Lett. 2013, 6, 287–299. [Google Scholar] [CrossRef]
  11. Stolz, H.; Schmid, O. Organic Viticulture and Wine-Making: Development of Environment and Consumer Friendly Technologies for Organic Wine Quality Improvement and Scientifically Based Legislative Framework. Deliverable: D 2.7 Public Report about First Round Qualitative Consumer Research and Market Needs. 2007. Available online: https://orgprints.org/10608/1/stolz-schmid-2007-ORWINE_d2.7_consumers_research.pdf (accessed on 27 September 2019).
  12. Le Bissonnais, Y.; Lecomte, V.; Cerdan, O. Grass strip effects on runoffand soil loss. Agronomie 2004, 24, 129–136. [Google Scholar] [CrossRef]
  13. Steenwerth, K.; Belina, K.M. Cover crops enhance soil organic matter, carbon dynamics and microbiological function in a vineyard agroecosystem. Appl. Soil Ecol. 2008, 40, 359–369. [Google Scholar] [CrossRef]
  14. Vukicevich, E.; Lowery, T.; Bowen, P.; Úrbez-Torres, J.R.; Hart, M. Cover crops to increase soil microbial diversity and mitigate decline in perennial agriculture. A review. Agron. Sustain. Dev. 2016, 36, 48. [Google Scholar] [CrossRef] [Green Version]
  15. Gago, P.; Cabaleiro, C.; García, J. Preliminary study of the effect of soil management systems on the adventitious flora of a vineyard in northwestern Spain. Crop Prot. 2007, 26, 584–591. [Google Scholar] [CrossRef]
  16. Sanguankeo, P.; León, R. Weed management practices determine plant and arthropod diversity and seed predation in vineyards. Weed Res. 2011, 51, 404–412. [Google Scholar] [CrossRef]
  17. Miglécz, T.; Valkó, O.; Török, P.; Deák, B.; Kelemen, A.; Donkó, Á.; Drexler, D.; Tóthmérész, B. Establishment of three cover crop mixtures in vineyards. Sci. Hortic. 2015, 197, 117–123. [Google Scholar] [CrossRef]
  18. Sáenz-Romo, M.G.; Veas-Bernal, A.; Martínez-García, H.; Campos-Herrera, R.; Ibáñez-Pascual, S.; Martínez-Villar, E.; Pérez-Moreno, I.; Marco-Mancebón, V.S. Ground cover management in a Mediterranean vineyard: Impact on insect abundance and diversity. Agric. Ecosyst. Environ. 2019, 283, 106571. [Google Scholar] [CrossRef]
  19. Farooq, M.; Jabran, K.; Cheema, Z.; Wahid, A.; Siddique, K. The role of allelopathy in agricultural pest management. Pest. Manag. Sci. 2011, 67, 493–506. [Google Scholar] [CrossRef]
  20. Sturm, D.J.; Peteinatos, G.; Gerhards, R. Contribution of allelopathic effects to the overall weed suppression by different cover crops. Weed Res. 2018, 58, 331–337. [Google Scholar] [CrossRef]
  21. Holm, L.G.; Plucknett, D.L.; Pancho, J.V.; Herberger, J.P. The World’s Worst Weeds. In Distribution and Biology; University of Hawaii Press: Honolulu, HI, USA, 1977. [Google Scholar]
  22. Kim, C.; Lemke, C.; Paterson, A.H. Functional dissection of drought- responsive gene expression patterns in Cynodon dactylon L. Plant Mol. Biol. 2009, 70, 1–16. [Google Scholar] [CrossRef]
  23. Guglielmini, A.C.; Satorre, E.H. Shading effects on spatial growth and biomass partitioning of Cynodon dactylon. Weed Res. 2002, 42, 123–134. [Google Scholar] [CrossRef]
  24. Guglielmini, A.C.; Satorre, E.H. The effect of non-inversion tillage and light availability on dispersal and spatial growth of Cynodon dactylon. Weed Res. 2004, 44, 366–374. [Google Scholar] [CrossRef]
  25. McCarty, L.B.; Miller, G. Managing Bermudagrass Turf. E.; Ann Arbor Press: Chelsea, MI, USA, 2002; pp. 67–86. [Google Scholar]
  26. Gómez de Barreda, D.; Izquierdo, D.; de Luca, V. Evaluación del comportamiento de 20 materias activas herbicidas sobre la cespitosa “Cynodon dactylon” en diferentes épocas climáticas del año. In Proceedings of the XVI Congreso de la Sociedad Española de Malherbología, Pamplona-Iruña, España, 25–27 October 2017; pp. 245–250. [Google Scholar]
  27. Farthing, T.S.; Muir, J.P.; Falk, A.; Murray, D. Efficacy of seven invasive Bermudagrass removal strategies in three Texas ecoregions. Ecol. Restor. 2018, 36, 306–314. [Google Scholar] [CrossRef]
  28. Abdullahi, A.E. Cynodon dactylon control with tillage and glyphosate. Crop Prot. 2002, 21, 1093–1100. [Google Scholar] [CrossRef]
  29. Fernandez, O.N. Establishment of Cynodon dactylon from stolon and rhizome fragments. Weed Res. 2003, 43, 130–138. [Google Scholar] [CrossRef]
  30. Recasens, J.; Valencia, F.; Montull, J.M.; Taberner, A. Malas hierbas problemáticas en viñedos con cubiertas vegetales y métodos químicos para su control. Vida Rural 2018, 444, 48–58. [Google Scholar]
  31. Agencia Estatal de Meteorología (AEMET). Ministerio para la Transición Ecológica. Gobierno de España. Available online: www.aemet.es/es/serviciosclimaticos/datosclimatologicos/valoresclimatologicos (accessed on 2 March 2020).
  32. Ibáñez, S. Mantenimiento del Suelo en el Viñedo Mediante Cubiertas Vegetales; Consejería de Agricultura, Ganadería y Medio Ambiente: Gobierno de La Rioja, Logroño, Spain, 2015; p. 167.
  33. Chytrý, M.; Tichý, L.; Holt, J.; Botta-Dukát, Z. Determination of Diagnostic Species with Statistical Fidelity Measures. J. Veg. Sci. 2002, 13, 79–90. [Google Scholar] [CrossRef]
  34. Ter Braak, C.F.; Smilauer, P. Canoco Reference Manual and User’s Guide: Software for Ordination, Version 5.0; Microcomputer Power: Ithaca, NY, USA, 2012. [Google Scholar]
  35. Bryson, C.; Wills, G. Susceptibility of Bermudagrass (Cynodon dactylon) Biotypes to Several Herbicides. Weed Sci. 1985, 33, 848–852. [Google Scholar] [CrossRef]
  36. Mau-Crimmins, T.M. Effects of removing Cynodon dactylon from a recently abandoned agricultural field. Weed Res. 2007, 47, 212–221. [Google Scholar] [CrossRef]
  37. Campbell, P.L. Efficacy of glyphosate, alternative post-emergence herbicides and tillage for control of Cynodon dactylon. S. Afr. J. Plant Soil 2008, 25, 220–228. [Google Scholar] [CrossRef]
  38. Ministerio de Agricultura, Alimentación y Medio Ambiente (MAGRAMA). Guía de Gestión Integrada de Plagas. Uva de Transformación. Ministerio de Agricultura; Alimentación y Medio Ambiente: Madrid, Spain, 2014.
  39. Dalley, C.D.; Viator, R.P.; Richard, E.P. Integrated Management of Bermudagrass (Cynodon dactylon) in Sugarcane. Weed Sci. 2013, 61, 482–490. [Google Scholar] [CrossRef]
  40. Phillips, M.C. Use of tillage to control Cynodon dactylon under small-scale farming conditions. Crop Prot. 1993, 12, 267–272. [Google Scholar] [CrossRef]
  41. Dong, M.; De Kroon, H. Plasticity in morphology and biomass allocation in Cynodon dactylon, a grass species forming stolons and rhizomes. Oikos 1994, 70, 99–106. [Google Scholar] [CrossRef] [Green Version]
  42. Ormeño-Núñez, J.; Pino-Rojas, G.; Garfe-Vergara, F. Inhibition of yellow nutsedge (Cyperus esculentus L.) and bermudagrass (Cynodon dactylon (L.) Pers.) by a mulch derived from rye (Secale cereale L.) in grapevines. Chil. J. Agric. Res. 2008, 68, 238–247. [Google Scholar]
  43. DeVetter, L.W.; Dilley, C.A.; Nonnecke, G.R. Mulches reduce weeds, maintain yield, and promote soil quality in a continental-climate vineyard. Am. J. Enol. Viticult. 2015, 66, 54–64. [Google Scholar] [CrossRef]
  44. Steinmaus, S.; Elmore, C.L.; Smith, R.J.; Donaldson, D.; Weber, E.A.; Roncoroni, J.A.; Miller, P.R.M. Mulched cover crops as an alternative to conventional weed management systems in vineyards. Weed Res. 2008, 48, 273–281. [Google Scholar] [CrossRef] [Green Version]
  45. Dhima, K.V.; Vasilakoglou, I.B.; Eleftherohorinos, I.G.; Lithourgidis, A.S. Allelopathic Potential of Winter Cereals and Their Cover Crop Mulch Effect on Grass Weed Suppression and Corn Development. Crop Sci. 2006, 46, 345–352. [Google Scholar] [CrossRef]
  46. Creamer, N.G.; Bennett, M.A.; Stinner, B.R.; Cardina, J.; Regnier, E.E. Mechanisms of Weed Suppression in Cover Crop-based Production Systems. HortScience 1996, 31, 410–413. [Google Scholar] [CrossRef]
  47. Mas, M.T.; Poggio, S.L.; Verdú, A.M.C. Weed community structure of mandarin orchards under conventional and integrated management in northern Spain. Agric. Ecosyst. Environ. 2007, 119, 305–310. [Google Scholar] [CrossRef]
  48. Juárez-Escario, A.; Conesa, J.A.; Solé-Senan, X.O. Management as a driver of functional patterns and alien species prominence in weed communities of irrigated orchards in Mediterranean areas. Agric. Ecosyst. Environ. 2017, 249, 247–255. [Google Scholar]
  49. Abad, F.J.; Cibriáin, F.; Santesteban, L.G.; Marín, D.; Sagüés, A. Manejo del suelo bajo la línea de cultivo de viñedo sin empleo de herbicida ni laboreo. In Proceedings of the III Jornadas del Grupo de Viticultura, Universitat de les Illes Balears, Palma, Illes Balears, Spain, 28–29 November 2018; pp. 164–167. [Google Scholar]
  50. European Union. Directive 2009/128/EC of the European Parliament and of the Council of 21 October 2009. Establishing a Framework for Community Action to Achieve the Sustainable Use of Pesticides. Off. J. Eur. Union 2009, L309, 71–86. Available online: https://eurlex.europa.eu/LexUriServ/LexUriServ.do?uri=OJ:L:2009:309:0071:0086:en:PDF (accessed on 5 September 2019).
Figure 1. Climatic conditions for the experiment period (March 2015 to September 2017). The gray bars show total precipitation (P), and the black line indicates the mean monthly temperature (Tm) in each month [31].
Agronomy 10 00908 g001
Figure 2. Soil coverage variation of Cynodon dactylon of a selected plot for each management across the different sampling dates. Each plot is divided with two white lines in each lateral to differentiate the central part (the inter-rows), where the management is completely done from the borders (the intra-rows), and where management is not complete and also mixed with intra-rows herbicide applications.
Agronomy 10 00908 g002
Figure 3. Redundancy analysis of species composition. Black labels denote managements abbreviated. Arrows showed the weed species present in the analysis. Weed species abbreviations are listed in Table 4.
Agronomy 10 00908 g003
Table 1. Timing of agricultural practices in the inter-rows for each management.
201520162017
SPRSUMAUTSPRSUMAUTSPRSUMAUT
M1SdSdSdSdSdSdSdSdSd
M2Sd + HSdSd + HSd + HSdSd + HSd + HSdSd + H
M3Sd + Sb + TSdSd + T SdSd + T SdSd
M4Sd + Sb + TSdSd + T + So SdSd + T + So SdSd
Abbreviations: SPR: Spring, SUM: Summer, AUT: Autumn, Sd: shredding, H: Herbicide, Sb: Subsoiling, T: Tilling, So: Sowing, M1: a no-till spontaneous vegetation ground cover managed by shredding, M2: a no-till spontaneous vegetation ground cover managed by shredding plus herbicide application, M3: tilled soil and spontaneous vegetation growing, and M4: tilled soil and a barley cover crop seeded (Hordeum vulgare L.).
Table 2. Soil covered (%) by C. dactylon in each management across the different sampling dates. Mean values of soil covered ± standard errors of the mean. Manag., management; Mar., March; Jun., June; Jul., July; Feb., February; Sep., September; 15, 2015; 16, 2016; 17, 2017.
Manag.Mar. 15Jul. 15Feb. 16May 16Sep. 16Feb. 17Jun. 17Sep. 17Final Change
M14.2 ± 0.9 Aa5.5 ± 0.7 Aa2.9 ± 0.7 Aa7.4 ± 1.6 Aa5.9 ± 0.8 Aa4.2 ± 1.4 Aa6.9 ± 1.6 Aa7.7 ± 2.1 Aa82.5 ± 82.6 a
M29.7 ± 2.5 Aa3.2 ± 1.2 Aa1.8 ± 1.1 Aab1.3 ± 0.5 Aab4.9 ± 2.4 Aab4.3 ± 2.1 Aa3.7 ± 1.2 Aa3.7 ± 1.1 Aa−62.4 ± 9.6 ab
M36.6 ± 3.2 Aa0.5 ± 0.1 Ab0.1 ± 0.1 Aab0.6 ± 0.2 Aab0.6 ± 0.4 Ab0.4 ± 0.2 Aab1.2 ± 0.6 Aab1.1 ± 0.8 Aab−82.6 ± 11.1 b
M47.4 ± 1.3 Aa0.4 ± 0.1 BCb0.0 ± 0.0 Cb0.1 ± 0.0 BCb0.6 ± 0.2 Bb0.1 ± 0.0 BCb0.8 ± 0.3 Bb0.5 ± 0.1 BCb−93.9 ± 2.3 b
Different letters represent significant differences at p < 0.05; capital letters: differences among sampling dates; lowercase letters: differences among managements.
Table 3. Frequency (%) of C. dactylon in each management across the different dates. Mean values of number of subplots with presence ± standard errors of the mean. Manag., management; Mar., March; Jun., June; Jul., July; Feb., February; Sep., September; 15, 2015; 16, 2016; 17, 2017.
Manag.Mar. 15Jul. 15Feb. 16May 16Sep. 16Feb. 17Jun. 17Sep. 17Final Change
M124.2 ± 3.6 Aa37.1 ± 8.6 Aab18.8 ± 3.3 Aa38.3 ± 7.9 Aa37.9 ± 7.9 Aa24.6 ± 4.6 Aa40.9 ± 6.7 Aa45.8 ± 9.9 Aa89.7 ± 23.4 a
M242.8 ± 11.5 Aa46.3 ± 10.4 Aa12.9 ± 5.2 Aab23.8 ± 10.5 Aab34.1 ± 9.2 Aab28.5 ± 10.7 Aa33.8 ± 11.2 Aa36.6 ± 9.5 Aab−14.6 ± 17.6 ab
M331.9 ± 16.4 Aa10.9 ± 3.1 Ab2.5 ± 1.4 Abc13.8 ± 3.8 Aab9.1 ± 4.8 Ab14.1 ± 6.0 Aa13.8 ± 4.6 Aa15.3 ± 7.3 Aab−52.0 ± 16.7 b
M436.3 ± 5.7 Aa7.8 ± 0.6 Bb0.6 ± 0.6 Cc3.1 ± 1.7 BCb9.7 ± 0.6 Bab3.8 ± 1.5 BCa12.8 ± 3.6 Ba9.7 ± 3.0 Bb−73.3 ± 12.6 b
Percentage calculated as the number of the 80 subunits of each plot with the presence of C. dactylon. Different letters in the same column mean significant differences at p < 0.005; capital letters, differences among initial and final dates; lowercase letters, differences among managements.
Table 4. Plant species analyzed in Figure 2 and diagnostic species for individual management classes. Abbr: Abbreviation; PG: Preferred Group (management).
Abbr.NamePGAbbr.NamePG
ATRPRAtriplex prostrata Boucher ex DC.M3PICHIPicris hieracioides Sibth. & Sm.M2
AVEBAAvena barbata Pott ex LinkM1PLACOPlantago coronopus L.-
BASSCBassia scoparia (L.) A.J.ScottM3PLALAPlantago lanceolata L.-
BRODIBromus diandrus RothM2POAANPoa annua L.-
BROMABromus madritensis L.M1POAPRPoa pratensis L.M1
BRORUBromus rubens L.M2PODLAPodospermum laciniatum (L.) DC.M1
CAPBUCapsella bursa-pastoris. (L.) Medik-SCAATScabiosa atropurpurea L.M1
CERGLCerastium glomeratum Thuill.M3SCLRIScleropoa rigida (L.) Griseb.M1
CERPUCerastium pumilum CurtisM1SENVUSenecio vulgaris L.-
CONARConvolvulus arvensis L.-SHEARSherardia arvensis L.-
CONBOConyza bonariensis (L.) Cronquist-SINARSinapis arvensis L.M3
CRESACrepis sancta (L.) Bornm.-SONASSonchus asper (L.) HillM2
CREVECrepis vesicaria L.M1SONOLSonchus oleraceus L.M3
DIPERDiplotaxis erucoides (L.) DC.M3TAROFTaraxacum officinale WeberM1
GALPAGalium parisiense L.M2TRIRETrifolium repens L.M1
HORMUHordeum murinum L.-VEROFVerbena officinalis L.M1
KOEPLKoeleria phleoides (Vill.) Pers.M1VERARVeronica arvensis L.M2
MALSYMalva sylvestris L.-VERPEVeronica persica Poir.M2
PAPRHPapaver rhoeas L.-VULCIVulpia ciliata Dumort.-
PICECPicris echioides L.M1

