Article

Metabolomic Analysis for Compositional Differences of Bush Tea (Athrixia phylicoides DC.) Subjected to Seasonal Dynamics

1
Department of Agriculture and Animal Health, College of Agriculture and Environmental Sciences, University of South Africa, Private Bag X6, Florida 1710, South Africa
2
ARC-Roodeplaat, Vegetable and Ornamental Plant, Private Bag X293, Pretoria 0001, South Africa
3
School of Agricultural, Earth and Environmental Sciences, University of KwaZulu Natal, Scottsville, Pietermaritzburg 3201, South Africa
*
Author to whom correspondence should be addressed.
Agronomy 2020, 10(6), 892; https://doi.org/10.3390/agronomy10060892
Submission received: 24 May 2020 / Revised: 17 June 2020 / Accepted: 19 June 2020 / Published: 23 June 2020

Abstract

:
Bush tea (Athrixia phylicoides DC.) is a South African indigenous herbal tea rich in secondary metabolites with medicinal significance. However, studies on the effects of seasonal changes on bush tea and quantification of its metabolites using untargeted approach have not been explored. Therefore, this study’s objective was to investigate the effects of seasonal variation on the metabolites of bush tea using LC-MS/MS (Liquid Chromatography with Tandem Mass Spectrometry) and 1H NMR (High-Resolution Proton Nuclear Magnetic Resonance) techniques. Bush tea leaves were plucked once in each season namely, autumn (March to May), winter (June to August), spring (September to November), and summer (December to February). The primary metabolites including non-essential amino acids, organic acids, and vitamins in bush tea were predominantly elevated during summer and spring. The 1H NMR-based metabolomic analysis revealed that bush tea metabolome was strongly affected by seasonal variations, using the partial least squares-discriminant analysis (PLS-DA) which demonstrated four distinct groups of seasons. Similarly, the 1H NMR based metabolic profiling of bush tea subjected to different seasons resulted in putative annotation of six phenolic compounds which included rutin, 4-(hydroxyphenyl) propyl coumarate, caffeic acid, hymenoxin, quercetin, and kaempferol. The phenolics and primary metabolites differed remarkably per season with enhanced accumulation observed in the summer and spring harvested bush tea. The LC-MS and 1H NMR metabolomics analysis suggests that summer and spring can be recommended as preferred plucking seasons for bush tea leaves and twigs.

1. Introduction

Bush tea (Athrixia phylicoides DC.) is a South African indigenous aromatic and perennial, leafy shrub which has a distinguished history of usage by the native people for decades [1]. Although scientific studies have demonstrated the potential of bush tea as an herbal tea comprising secondary metabolites with beneficial effect and pharmacological properties [2,3], its commercialization is still at its infancy. Bush tea has been reported to contain several polyphenols, sesquiterpenes, coumarins, flavonoids, alkaloids, polysaccharides, amino acids, lipids, vitamins, and inorganic elements [4,5].
Tea metabolome has shown to be influenced by both abiotic and biotic factors [6]. The presence of active compounds and the therapeutic efficacy of tea plants are associated with changing climatic conditions resulting from seasonal variations [7,8]. Seasonal fluctuations expose plants to different temperature levels [9], light intensity, and precipitation [6], which affect concentrations of tea phytochemicals and metabolic pathways responsible for the enhancement of metabolites [10]. Environmental factors such as light, influence the biosynthesis of phenolic compounds like catechin in black tea (Camellia sinensis) [6]. Low temperature induced the biosynthesis of catechins [8] while high temperature accelerated leaf growth, diluting the contents of secondary metabolites [9]. Precipitation was found to be negatively associated with the accumulation of all catechin fractions in C. sinensis [6]. In bush tea, Mudau et al. [11] demonstrated seasonal variation effects on selected phytochemicals, reporting that the plant’s total antioxidants content were increased during summer and winter, condensed tannins during autumn (4.82%), while total polyphenols were increased in winter (51.1 mg·g−1).
Seasonal changes induce different stresses in plants; the thermal stress during warmer seasons enhanced the antioxidant properties and availability of carbohydrates [12], while the solar radiation stress was found to influence the production of phenolic compounds [13]. Consequently, these stresses influence secondary metabolic products of tea plants since they are synthesized under stressful conditions to protect the plant cells from oxidation, protein denaturation, and damage [14]. It is therefore critical to assess teas harvested at different seasons to identify appropriate plucking seasons when the plants have accumulated optimum concentrations of secondary metabolites with pharmaceutical significance [15,16].
Several studies have demonstrated the use metabolomics analysis through proton nuclear magnetic resonance spectroscopy (1H NMR) [17,18], gas chromatography-mass spectrometry (GC-MS) [19], and ultra-performance liquid chromatography quadrupole-time of flight mass spectrometry (UPLCQ-TOF MS) in various teas [20,21]. These metabolomics studies coupled with chemometrics showed a more comprehensive representation of associations between the environmental factors [20,22,23], growing conditions [24], and tea processing conditions [25] with tea chemical profile. However, data on seasonal effects on metabolites accumulation in bush tea are lacking. The lack of data is accentuated by the fact that bush tea is traditionally picked from the wild. Trials on a small scale are underway since the concept of domesticating wild plant to balance the biodiversity became a norm due to biodiversity laws in many parts of the world. The herbal teas are becoming a thriving business since the demand is exceeding the supply. Hence, the objective of the study was to determine the effects of seasonal changes on the metabolites of bush tea using LC-MS/MS and 1H NMR techniques under cultivated environment.

2. Materials and Methods

2.1. Experimental Site

The trial was conducted at the Agricultural Research Council, Vegetable and Ornamental Plant Institute, situated about 25 km north of central Pretoria on the Moloto/KwaMhlanga Road (R573), GPS coordinate 25° 59″ S; 28° 35″ E, 1168 m altitude. The farm covers approximately 4000 ha, of which only 650 ha is under irrigation. The bush tea was grown under 40% shade net and drip irrigation at a frequency of 3.78 liters per hour for every 15 s (3 times a day) throughout the study.

2.2. Experimental Design and Treatments

One-year-old pruned bush tea plants were grown under shade net in three parallel blocks of 11 m. The tea plants were plucked once in each season in a one-year cycle and the seasons included autumn/fall (March to May), winter (June to August), spring (September to November), and summer (December to February).

2.3. Sample Preparation

Mature leaf and twig samples were harvested from bush tea plants and air-dried at room temperature in the shade to constant weight [26] (Samples were then ground to a powder using a benchtop grinder and stored in glass vials below −50 °C until extraction.

2.4. LC-MS/MS Triple Quadrupole Mass Spectrometer

Fifty milligrams of each sample (five replicates for each treatment) were weighed into a 2 mL Eppendorf tube. One milliliter of the solvent (75% LC-MS grade methanol) was added to the samples and vortexed for one minute, and then sonicated for 30 min. Samples were then centrifuged for 15 min at 10,000 rpm. Seven hundred microliters of the supernatant were then pipetted into HPLC (High Performance Liquid Chromatography) vials, and metal caps with rubber septa were secured with a crimper.
The supernatant was injected into an ultra-high-performance liquid chromatography (UHPLC coupled to a high-resolution triple quadrupole MS (Shimadzu Model 8040, Shimadzu, Kyoto, Japan). Metabolites were separated and detected using ultra C18 AQC column (100 mm × 2.1 mm i.d., 3 µm particle) and maintained at 35 °C. The mobile phase consisted of 0.1% formic acid in water (solvent A) and LC-MS grade methanol (solvent B), at a flow rate of 0.3 mL/min. Gradient elution applied was: 85% A: 15% B to 65% A: 35% B in 4 min, changed to 50% A: 50% B for 2 min, then to 20% A: 80% B for 1 min, and back to the initial ratio (85% A: 15% B to 65% A: 35% B) for 0.5 min. Furthermore, the UHPLC system was interfaced with a Xevo G2 QT of MS (Shimadzu, Kyoto, Japan), then applied with a source—ESI positive mode; capillary voltage—3 kV; cone voltage 30 V; calibration—sodium formate; lock spray—leucine enkephalin, and mass scan range at 200–1500 m/z. The data acquisition was performed using LabSolutions software LC-MS Ver.5.82 (Shimadzu, Kyoto, Japan) and LabSolutions database.

2.5. 1H NMR Data Acquisition

Nuclear magnetic resonance spectral data were obtained using a 600 MHz NMR spectrometer (Varian, Inc., Palo Alto, CA, USA), with 20 scans recorded. The sample preparation, data acquisition, analysis, mining, and processing were done as described by Maree and Viljoen [27]. The powdered bush tea samples (50 mg) were weighed into 2 mL Eppendorf tube for extraction and analysis. A 1.0 mL solvent mixture of 1:1 methanol D4 and deuterium oxide (D2O) (pH 6.0) was added. The mixture was vortexed at room temperature for 1 min and ultra-sonicated for 15 min to break the cell membranes, and then centrifuged for 5 min. Approximately 0.5 mL of the supernatant was transferred into NMR tubes for analysis.
All 1H spectra were subjected to baseline and phase correction using MestReNova 12.0 (Mestrelab Research S.L., Santiago de Compostela, Spain). The spectral regions (0–10.00 ppm) were divided into 0.04 ppm bins, converted to American Standard Code for Information Interchange (ASCII) format and imported to Microsoft® Excel 2010 (Microsoft Corporation, Redmond, Washington). MetaboAnalyst with Pareto scaling method was used to perform the multivariate data analysis.

2.6. Statistical Analysis

Data were subjected to one-way analysis of variance (ANOVA), carried out using STATISTICA (StaSoft Inc., Tulsa, OK, USA) package (2011) to analyze the integrated peak area. Mean separation was done using Tukey’s Honest Significant Difference (HSD) at p < 0.05. The supervised partial least squares-discriminant analysis (PLS-DA) was carried out using MetaboAnalyst 4.0 (http://metaboanalyst.ca). The heatmap was constructed using hierarchical cluster analysis (Euclidean distance and clustering algorithms as Ward’s linkage) in MetaboAnalyst software.

3. Results

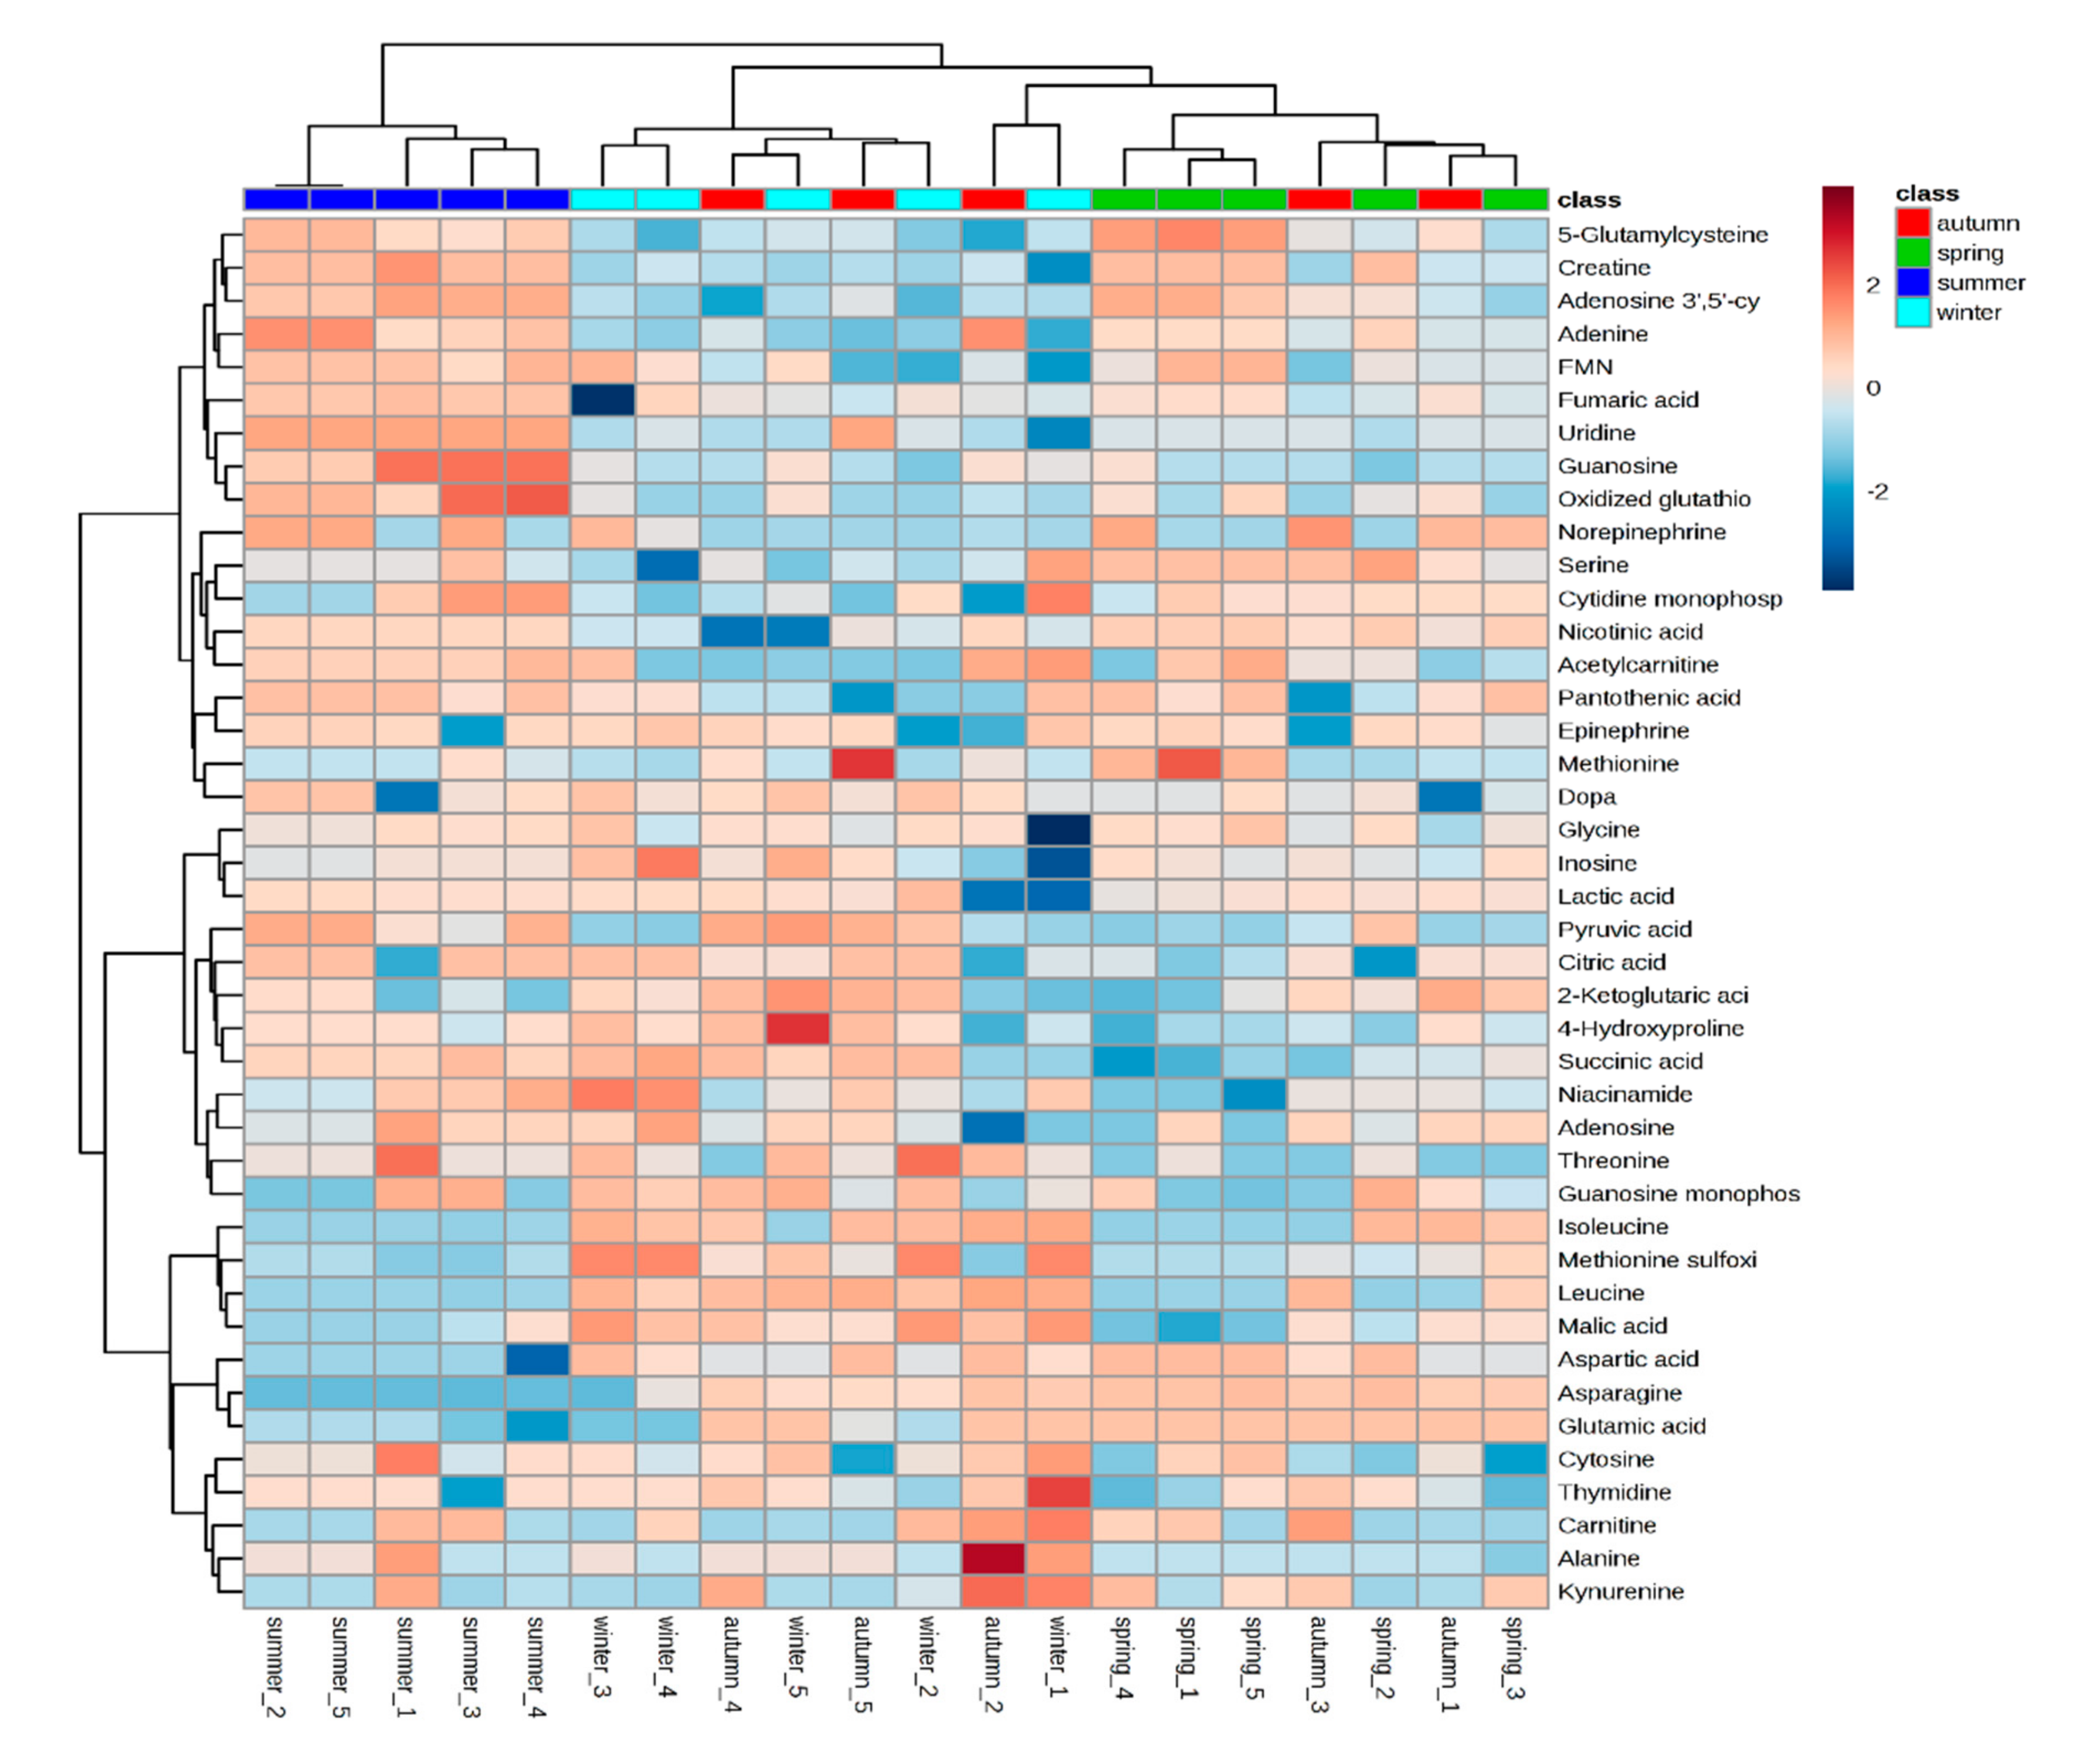
3.1. Seasonal Variation on Bush Tea Primary Metabolites Using LC-MS/MS

The heatmap revealed distinct groups of primary metabolites of bush tea harvested at different seasons indicating that tea metabolome patterns are dependent on seasonal changes. The heatmap comprises of two main clusters with the second cluster further divided into two. Bush tea harvested in summer grouped in the first cluster on the left. The second cluster was divided into two groups, and the autumn and winter plucked bush tea gathered together in one sub-cluster while spring plucked bush tea clustered and dominated the sub-cluster on the right (Figure 1).
The LC-MS/MS Triple Quadrupole detected different groups of primary metabolites and statistical analysis of their integrated peak revealed significant differences among the seasons (Table 1). For essential amino acids, the summer harvested bush tea samples significantly exhibited the highest threonine peak area (8.73 × 10⁵), and the lowest area was recorded in the autumn bush tea plants with 3.29 × 10⁵ peak area. Harvested leaves and twigs exhibited higher methionine sulfoxide in winter (2.80 × 10⁵) and low in autumn (1.45 × 10⁵). Both leucine and isoleucine were high in the winter and low in the summer bush tea leaves and twigs.
Non-essential amino acids were also evaluated for their accumulation in each season (Table 1). The spring harvested bush tea samples showed high integrated peak area of asparagine (1.51 × 10⁶) while summer exhibited low peak area (0.0). The intensity of aspartic acid was high in the spring (3.23 × 10⁵), followed by summer (1.65 × 10⁵) and autumn (1.46 × 10⁵) bush tea plants, and low in the winter (1.27 × 10⁵) harvested tea plants. A similar trend was observed with compound serine. Alanine was found to be high in the summer (11.93 × 10⁵), followed by spring (9.91 × 10⁵), then autumn (5.16 × 10⁵) and low area under peak were recorded in the winter samples (4.42 × 10⁵).
The conditional amino acids were also evaluated, and the high peak area of glutamic acid was recorded in the spring samples with 2.46 × 10⁶ and low in the winter harvested bush tea samples with 1.32 × 10⁶. Bush tea harvested during spring exhibited high peak area of glycine (2.57 × 10⁴) while low peak area (0.99 × 10³) was detected in the autumn sampled plants. Proline area under peak was high in the spring samples with 10.99 × 10⁷ and low in the winter samples with 2.75 × 10⁷.
Malic acid was high in winter with the peak area of 13.95 × 10⁵ and low in the autumn bush tea leaves and twigs with rea of 7.72 × 10⁵. A similar trend was observed on pyruvic acid, lactic acid, citric acid, fumaric acid and succinic acid, where all the mentioned organic acids were high in summer and low in autumn.
Nicotinic acid, also known as vitamin B3 showed high peak area in spring, followed by summer and autumn but low in autumn. Niacinamide (NAA), another form of vitamin B3, was high in the summer samples (15.00 × 10⁴) and low in the winter bush tea samples (6.84 × 10⁴). The high intensity of pantothenic acid (vitamin B5) was detected in the spring plucked leaves and twigs (6.92 × 10⁴) low area under peak was recorded in the autumn (2.19 × 10⁴) (Table 1).

3.2. The Effect of Harvest Season on Bush Tea Metabolome Using 1H NMR

The 1H NMR metabolites peak intensities of bush tea harvested in four different seasons (autumn, winter, spring, and summer) were clearly distinguished using a co-variance of data the PLS-DA (Figure 2). The seasons differentiated from each other on the first two-component PLS-DA scores plot by the principal component t(1) (70.9%), principal component t(2) (2.8%), and principal component t(3) (13.9%). The PLS-DA revealed four distinct groups, bush tea harvested in winter grouped at the top towards the right side of the PLS-DA score plot while the autumn plucked bush tea aligned together towards the right. The summer harvested bush tea clustered together in the middle of the PLS-DA score plot while the spring plucked grouped toward the bottom right side.

3.3. Annotation of Bush Tea Metabolites from 1H NMR Spectrum

Figure 3 presents representative one dimensional 1H NMR fingerprints of bush tea samples collected over four seasons. The spectra allow for the annotation of phenolic compounds 1–6 upon the comparison of their respective chemical shifts with literature values. The annotated compounds included rutin with peaks at δH 7.64, 6.38, 6.18, 3.34, and 3.82 ppm (rutinose sugar peaks) and 1.06 ppm (rhamnose-CH3), which was supported with the anomeric protons observed as doublets at δH 4.55 and 5.09 ppm [28,29]. Peaks corresponding to (4-hydroxyphenyl) propyl coumarate (δH 7.54 (J = 15.9 Hz), 7.51, 6.76, 6.68, 6.32 (J = 15.9 Hz), 4.08, 2.69, and 2.01 ppm) [30] and caffeic acid (7.62 ppm (J = 15.78 Hz), 7.03, 6.99, 6.92, and 6.38 ppm (J = 15.78 Hz) [31] were also observed. In addition, the polymethoxylated flavone, hymenoxin (δH 7.59, 7.44, 7.06, 6.60, 4.05, 4.02, 3.99, and 3.97 ppm) [32], quercetin (7.66, 7.54, 6.88, 6.41, and 6.20 ppm) [33] and kaempferol (8.08, 6.92, 6.45, and 6.19 ppm) were also identified [34]. The strong doublet at 5.41 (J = 3.84 Hz) is characteristic of sucrose while the upfield resonance around δH 0.87 is characteristic of the terminal methyl groups of fatty acids. This is further supported by δH 1.25, 1.30 ppm which are assignable to repeating methylene and δH 2.00 ppm for allylic methylene units of the fatty acids [35,36].
To evaluate seasonal variations of the selected compounds, characteristic chemical shifts of compounds were selectively plotted against their respective intensities (Figure 4), due to overlaps in the basic resonances of the phenolic protons and those of the coumaric acid derivatives.

4. Discussion

Determination of the best harvesting periods or seasons yielding maximum concentrations of phytochemicals is fundamental for improved tea quality. Data that compares seasonal responses on metabolites in bush tea is lacking. Hence, this study investigated the dependence of bush tea metabolites on seasonal changes through metabolomics approach and found differences in the accumulation of various metabolites in each season. The essential amino acids were highly accumulated in the winter harvested bush tea. This could be attributed to the acclimation of tea plants to cold winter season as a mechanism for cold tolerance. The synthesis of proteins (conditional and non-essential amino acids) were favored by spring conditions while the production of organic acids and vitamins (vitamin B3 and B5) in bush tea plants were enhanced by summer conditions. Thermal stress, known to influence metabolic regulation [37,38], could be responsible for higher proteins and vitamins during spring and summer season.
The 1H NMR-based metabolomics method is a convenient means to explore the link between tea metabolome and climatic variables [24]. Hence, there was a need to ascertain the metabolic dependence of bush tea on seasonal dynamics through the 1H NMR chemometrics data analysis. The strong dependence of bush tea on seasons were illustrated in the PLS-DA and the heatmap. The changing phytochemical pattern in tea plants is based on the metabolic regulation within the cell, which is affected by many factors, including temperature and water.
The annotated phenolic compounds namely rutin, (4-hydroxyphenyl) propyl coumarate, caffeic acid, quercetin, kaempferol, and hymenoxin have been previously isolated from bush tea extracts [2,3,30]. Therefore, this study provides a novel discovery of how each of the select compounds is affected by seasonal dynamics to understand the picking windows of bush tea in South Africa.
The selected phenolic peaks of bush tea flavonols (rutin, kaempferol, and quercetin) were significantly influenced by seasonal changes (Figure 4). Rutin and quercetin were elevated in summer while kaempferol was increased in spring. The biosynthesis of these phenolic compounds in summer harvested bush tea leaves could be induced by warmer temperatures, stronger sunlight, and longer daytime length [9,39]. Hence, the autumn and winter harvested bush tea recorded low intensities of rutin, kaempferol, and quercetin.
The leaves and twigs of bush tea plucked in winter, which is a slow-growing or dormant period had higher intensity of caffeic acid and lower in autumn. The cold stress during winter might have effectively stimulated the production of this phenolic compound in tea plant cells [14]. Hence, there was a significant increase during the lower temperature season. This is consistent with findings by Król et al. [40] who reported an increased caffeic acid in grapevine under cold stress. The intensities of 4-(Hydroxyphenyl) propyl coumarate were elevated in the summer plucked bush tea leaves and twigs and reduced in the autumn harvested bush tea. Accumulation of this coumarate during summer may be attributed to the higher precipitation levels and warmer temperatures which are known to enhance induction of the biosynthesis of total phenolics [41]. Hymenoxin was increased in the spring plucked bush tea leaves and twigs and reduced in autumn. In the experimental site, spring climatic conditions are also characterized by warm to hot temperature and low to high rainfall levels and day length, thus, the accumulation of hymenoxin in this season could be a result of precipitation and sunlight exposure which is associated with elevation of concentration of phenolic compounds [42].
Seasonal comparison of the 1H NMR chemical shifts peak intensities of the sugars and fatty acids were also analyzed statistically. Generally, fatty acids were higher in the spring and summer plucked bush tea leaves and lower in the autumn plucked bush tea leaves. Our study suggests that summer and spring enhanced primary and secondary metabolites, and this is consistent with previous studies which recommended summer as the best season for enhanced total antioxidants [11] and polyphenolic content [43].

5. Conclusions

The study demonstrated that changes in the chemical profile pattern of bush tea are associated with seasonal variations influenced by climatic conditions in each season. Concentrations of non-essential amino acids, organic acids and vitamins in bush tea were increased in summer and spring, respectively. The PLS-DA further confirmed the dependence bush teas secondary metabolites on seasons. The six phenolic compounds annotated in this study include rutin, 4-(hydroxyphenyl) propyl coumarate, caffeic acid, hymenoxin, quercetin, and kaempferol. The intensities of the selected phenolics, sugars and fatty acids varied significantly per season with higher intensities in the summer and spring plucked bush tea leaves and twigs. Based on the LC-MS and 1H NMR metabolomics analysis, summer and spring can be recommended as preferred plucking seasons for bush tea leaves and twigs. A further study is, however, recommended to quantitatively determine the seasonal variation of the full spectrum of the bush tea compounds.

Author Contributions

Conceptualization, F.N.M. and H.T.A.; data curation, K.C.M., and O.B.; formal analysis, K.C.M., and O.B.; funding acquisition, F.N.M.; investigation, K.C.M.; methodology, K.C.M., and O.B.; resources, H.T.A., and F.N.M.; supervision, F.N.M.; writing–original draft, K.C.M.; writing–review & editing, K.C.M.; O.B., H.T.A., and F.N.M. All authors have read and agreed to the published version of the manuscript.

Funding

This research was funded by the University of South Africa, Agriculture and Animal Health Departmental operation funds GUN number 200100.

Acknowledgments

The authors would like to thank the Agricultural Research Council-VOPI for their technical support and facilities.

Conflicts of Interest

The authors declare no conflict of interest.

References

  1. Nchabeleng, L.; Mariga, I.K.; Ngezimana, W.; Mudau, F.N. Bush tea (Athrixia phylicoides DC.) success stories in South Africa: A review. ESci. J. Crop Prod. 2013, 2, 37–43. [Google Scholar]
  2. McGaw, L.J.; Bagla, V.; Steenkamp, P.A.; Fouche, G.; Olivier, J.; Eloff, J.N.; Myer, M.S. Antifungal and antibacterial activity and chemical composition of polar and non-polar extracts of Athrixia phylicoides determined using bioautography and HPLC. BMC Complement. Altern. Med. 2013, 13, 356. [Google Scholar] [CrossRef] [PubMed] [Green Version]
  3. Malongane, F.; McGaw, L.J.; Nyoni, H.; Mudau, F. Metabolic profiling of four South African herbal teas using high resolution liquid chromatography-mass spectrometry and nuclear magnetic resonance. Food Chem. 2018, 257, 90–100. [Google Scholar] [CrossRef]
  4. Lerotholi, L.; Chaudhary, S.; Combrinck, S.; Viljoen, A.M. Bush tea (Athrixia phylicoides): A review of the traditional uses, bioactivity and phytochemistry. South Afr. J. Bot. 2017, 110, 4–17. [Google Scholar] [CrossRef]
  5. Tshivhandekano, I.; Ntushelo, K.; Ngezimana, W.; Tshikalange, T.E.; Mudau, F. Chemical compositions and antimicrobial activities of Athrixia phylicoides DC. (bush tea), Monsonia burkeana (special tea) and synergistic effects of both combined herbal teas. Asian Pac. J. Trop. Med. 2014, 7, 448–453. [Google Scholar] [CrossRef] [Green Version]
  6. Wang, Y.; Gao, L.; Shan, Y.; Liu, Y.; Tian, Y.; Xia, T. Influence of shade on flavonoid biosynthesis in tea (Camellia sinensis (L.) O. Kuntze). Sci. Hortic. 2012, 141, 7–16. [Google Scholar] [CrossRef]
  7. Mudau, F.N.; Ngele, A.; Mashela, P.W.; Soundy, P. Seasonal variation of tannin content in wild bush tea. Med. Aromat. Plant Sci. Biotechnol. 2007, 1, 74–76. [Google Scholar]
  8. Wei, K.; Wang, L.; Zhou, J.; He, W.; Zeng, J.-M.; Jiang, Y.-W.; Cheng, H. Comparison of catechins and purine alkaloids in albino and normal green tea cultivars (Camellia sinensis L.) by HPLC. Food Chem. 2012, 130, 720–724. [Google Scholar] [CrossRef]
  9. Yao, L.; Caffin, N.; D’Arcy, B.; Jiang, Y.; Shi, J.; Singanusong, R.; Liu, X.; Datta, N.; Kakuda, Y.; Xu, Y. Seasonal Variations of Phenolic Compounds in Australia-Grown Tea (Camellia sinensis). J. Agric. Food Chem. 2005, 53, 6477–6483. [Google Scholar] [CrossRef]
  10. Selmar, D.; Kleinwächter, M. Stress Enhances the Synthesis of Secondary Plant Products: The Impact of Stress-Related Over-Reduction on the Accumulation of Natural Products. Plant Cell Physiol. 2013, 54, 817–826. [Google Scholar] [CrossRef]
  11. Mudau, F.; Mogotlane, I.; Mashela, P.; Soundy, P. Seasonal Variation of Total Antioxidant Contents of Wild Bush Tea. Acta Hortic. 2008, 802, 273–276. [Google Scholar] [CrossRef]
  12. Morison, J.I.L.; Lawlor, D.W. Interactions between increasing CO2concentration and temperature on plant growth. Plant Cell Environ. 1999, 22, 659–682. [Google Scholar] [CrossRef] [Green Version]
  13. Grace, S.C.; Logan, B.A. Energy dissipation and radical scavenging by the plant phenylpropanoid pathway. Philos. Trans. R. Soc. B Boil. Sci. 2000, 355, 1499–1510. [Google Scholar] [CrossRef] [PubMed] [Green Version]
  14. Kranner, I.; Beckett, R.; Wornik, S.; Zorn, M.; Pfeifhofer, H.W. Revival of a resurrection plant correlates with its antioxidant status. Plant J. 2002, 31, 13–24. [Google Scholar] [CrossRef] [PubMed] [Green Version]
  15. Kale, V.S. Variable rates of primary and secondary metabolites during different seasons and physiological stages in Convolvulus, Withania and Datura. Asian J. Exp. Biol. Sci. 2010, 10, 50–53. [Google Scholar]
  16. Szakiel, A.; Pączkowski, C.; Henry, M. Influence of environmental abiotic factors on the content of saponins in plants. Phytochem. Rev. 2010, 10, 471–491. [Google Scholar] [CrossRef]
  17. Lee, J.-E.; Lee, B.-J.; Hwang, J.-A.; Ko, K.-S.; Chung, J.-O.; Kim, E.-H.; Lee, S.-J.; Hong, Y.-S. Metabolic Dependence of Green Tea on Plucking Positions Revisited: A Metabolomic Study. J. Agric. Food Chem. 2011, 59, 10579–10585. [Google Scholar] [CrossRef]
  18. Kellogg, J.J.; Graf, T.; Paine, M.F.; McCune, J.S.; Kvalheim, O.M.; Oberlies, N.H.; Cech, N.B. Comparison of Metabolomics Approaches for Evaluating the Variability of Complex Botanical Preparations: Green Tea (Camellia sinensis) as a Case Study. J. Nat. Prod. 2017, 80, 1457–1466. [Google Scholar] [CrossRef] [Green Version]
  19. Vuwani, M.K.; Nkomo, M.; Ngezimana, W.; Makunga, N.P.; Mudau, F. Response of Phytochemicals in Bush Tea (Athrixia phylicoides DC.) as Influenced by Selected Micronutrients. HortScience 2017, 52, 965–971. [Google Scholar] [CrossRef]
  20. Zhang, Q.; Shi, Y.; Ma, L.; Yi, X.; Ruan, J. Metabolomic Analysis Using Ultra-Performance Liquid Chromatography-Quadrupole-Time of Flight Mass Spectrometry (UPLC-Q-TOF MS) Uncovers the Effects of Light Intensity and Temperature under Shading Treatments on the Metabolites in Tea. PLoS ONE 2014, 9, e112572. [Google Scholar] [CrossRef]
  21. Jing, J.; Shi, Y.-Z.; Zhang, Q.; Wang, J.; Ruan, J. Prediction of Chinese green tea ranking by metabolite profiling using ultra-performance liquid chromatography–quadrupole time-of-flight mass spectrometry (UPLC–Q-TOF/MS). Food Chem. 2017, 221, 311–316. [Google Scholar] [CrossRef] [PubMed]
  22. Chen, Y.; Jiang, Y.; Duan, J.; Shi, J.; Xue, S.; Kakuda, Y. Variation in catechin contents in relation to quality of ‘Huang Zhi Xiang’ Oolong tea (Camellia sinensis) at various growing altitudes and seasons. Food Chem. 2010, 119, 648–652. [Google Scholar] [CrossRef]
  23. Lee, J.-E.; Lee, B.-J.; Chung, J.-O.; Hwang, J.-A.; Lee, S.-J.; Lee, C.-H.; Hong, Y.-S. Geographical and Climatic Dependencies of Green Tea (Camellia sinensis) Metabolites: A1H NMR-Based Metabolomics Study. J. Agric. Food Chem. 2010, 58, 10582–10589. [Google Scholar] [CrossRef]
  24. Lee, J.-E.; Lee, B.-J.; Chung, J.-O.; Kim, H.-N.; Kim, E.; Jung, S.; Lee, H.; Lee, S.-J.; Hong, Y.-S. Metabolomic unveiling of a diverse range of green tea (Camellia sinensis) metabolites dependent on geography. Food Chem. 2015, 174, 452–459. [Google Scholar] [CrossRef] [PubMed]
  25. Tan, J.; Dai, W.; Lu, M.; Lv, H.; Guo, L.; Zhang, Y.; Zhu, Y.; Peng, Q.; Lin, Z. Study of the dynamic changes in the non-volatile chemical constituents of black tea during fermentation processing by a non-targeted metabolomics approach. Food Res. Int. 2016, 79, 106–113. [Google Scholar] [CrossRef]
  26. Mudau, F.N.; Ngezimana, W. Effect of different drying methods on chemical composition and antimicrobial activity of bush tea (Athrixia phylicoides). Int. J. Agric. Biol. 2014, 16, 1011–1014. [Google Scholar]
  27. Maree, J.; Viljoen, A.M. Phytochemical distinction between Pelargonium sidoides and Pelargonium reniforme—A quality control perspective. South Afr. J. Bot. 2012, 82, 83–91. [Google Scholar] [CrossRef] [Green Version]
  28. Selvaraj, K.; Chowdhury, R.; Bhattacharjee, C. Isolation and structural elucidation of flavonoids from aquatic fern Azolla microphylla and evaluation of free radical scavenging activity. Int. J. Pharm. Pharm. Sci. 2013, 5, 743–749. [Google Scholar]
  29. Georgeta SPana, P.I.; Tunde, H.; Sanda, B. The isolation and identification of rutin from pharmaceutical products. Analele Univ. Din. Oradea Fasc. Ecotoxicol. Zooteh Si Tehnol. Ind. Aliment. 2016, 16, 109–113. [Google Scholar]
  30. Padayachee, K. The Phytochemistry and Biological Activities of Athrixia Phylicoides. M.Sc. Thesis, University of Witwatersrand, Johannesburg, South Africa, 2011. Available online: http://wiredspace.wits.ac.za/handle/10539/10667 (accessed on 11 August 2017).
  31. Exarchou, V.; Troganis, A.; Gerothanassis, I.P.; Tsimidou, M.Z.; Boskou, D. Identification and quantification of caffeic and rosmarinic acid in complex plant extracts by the use of variable-temperature two-dimensional nuclear magnetic resonance spectroscopy. J. Agric. Food Chem. 2001, 49, 2–8. [Google Scholar] [CrossRef]
  32. Hayashi, T.; Uchida, K.; Hayashi, K.; Niwayama, S.; Morita, N. A cytotoxic flavone from Scoparia dulcis L. Chem. Pharm. Bull. 1988, 36, 4849–4851. [Google Scholar] [CrossRef] [Green Version]
  33. Sambandam, B.; Thiyagarajan, D.; Ayyaswamy, A.; Raman, P.; Kulasekaran, J.; Venkatasamy, H. Extraction and isolation of flavonoid quercetin from the leaves of Trigonella foenum-graecum and their anti-oxidant activity. Int. J. Pharm. Pharm. Sci. 2016, 8, 120–124. [Google Scholar]
  34. Lin, L.-J.; Huang, X.-B.; Lv, Z.-C. Isolation and identification of flavonoids components from Pteris vittata L. SpringerPlus 2016, 5, 1649. [Google Scholar] [CrossRef] [PubMed] [Green Version]
  35. Caligiani, A.; Palla, G.; Maietti, A.; Cirlini, M.; Brandolini, V. 1H NMR Fingerprinting of Soybean Extracts, with Emphasis on Identification and Quantification of Isoflavones. Nutrients 2010, 2, 280–289. [Google Scholar] [CrossRef] [PubMed] [Green Version]
  36. Gogna, N.; Hamid, N.; Dorai, K. Metabolomic profiling of the phytomedicinal constituents of Carica papaya L. leaves and seeds by 1H NMR spectroscopy and multivariate statistical analysis. J. Pharm. Biomed. Anal. 2015, 115, 74–85. [Google Scholar] [CrossRef]
  37. Crawford, R.M. Seasonal differences in plant responses to flooding and anoxia. Can. J. Bot. 2003, 81, 1224–1246. [Google Scholar] [CrossRef]
  38. Hare, P.; Cress, W. Metabolic implications of stress-induced proline accumulation in plants. Plant Growth Regul. 1997, 21, 79–102. [Google Scholar] [CrossRef]
  39. Harbowy, M.E.; Balentine, D.A. Tea chemistry. Crit. Rev. Plant Sci. 1997, 16, 415–480. [Google Scholar] [CrossRef]
  40. Krol, A.; Amarowicz, R.; Weidner, S. The effects of cold stress on the phenolic compounds and antioxidant capacity of grapevine (Vitis vinifera L.) leaves. J. Plant Physiol. 2015, 189, 97–104. [Google Scholar] [CrossRef]
  41. Erturk, Y.; Ercisli, S.; Sengul, M.; Eser, Z.; Haznedar, A.; Turan, M. Seasonal variation of total phenolic, antioxidant activity and minerals in fresh tea shoots (Camellia sinensis var. sinensis). Pak. J. Pharm. Sci. 2010, 23, 69–74. [Google Scholar]
  42. Gololo, S.S.; Shai, L.J.; Agyei, N.M.; Mogale, M.A. Effect of seasonal changes on the quantity of phytochemicals in the leaves of three medicinal plants from Limpopo province, South Africa. J. Pharmacogn. Phytother. 2016, 8, 168–172. [Google Scholar]
  43. Mudau, F.; Soundy, P.; Du Toit, E.; Olivier, J. Variation in polyphenolic content of Athrixia phylicoides (L.) (bush tea) leaves with season and nitrogen application. South Afr. J. Bot. 2006, 72, 398–402. [Google Scholar] [CrossRef] [Green Version]
Figure 1. The heatmap for seasonal variation of bush tea primary metabolites identified from LC-MS/MS (Liquid Chromatography with Tandem Mass Spectrometry) triple quadrupole on bush tea (A. phylicoides DC.) using unsupervised hierarchical clustering. The row represents the primary metabolites and column represent seasons.
Agronomy 10 00892 g001
Figure 2. Partial least squares-discriminant analysis (PLS-DA) component score plot for 1H NMR (High-Resolution Proton Nuclear Magnetic Resonance) peak intensities of 20 bush tea (A. phylicoides DC.) samples subjected to seasonal variation.
Agronomy 10 00892 g002
Figure 3. (A–C) 1H NMR spectra (600 MHz; TSP = 0.00 ppm) of bush tea harvested in four seasons showing annotated compounds: 1) rutin, 2) (4-hydroxyphenyl) propyl coumarate, 3) hymenoxin, 4) caffeic acid, 5) quercetin, 6) kaempferol, sucrose, and fatty acids.
Agronomy 10 00892 g003
Figure 4. The effect of season on peak intensities of compounds annotated from bush tea. Peak intensity values per chemical shift with the same letters are not significantly different at p ≤ 0.05 using Tukey’s Honest Significant Test, ns = non-significant. The error bars on the figure represent mean standard error.
Agronomy 10 00892 g004
Table 1. Effects of seasonal variations on peak intensities of primary metabolites from bush tea (A. phylicoides DC.).
SeasonAutumnWinterSpringSummer
(Peak Intensities)
Essential amino acids
Threonine3.29 × 105 ± 0.42 × 10⁵ b3.83 × 105 ± 0.75 × 10⁵ b8.73 × 105 ± 1.34 × 10⁵ a8.65 × 105 ± 0.41 × 10⁵ a
Methionine sulfoxide1.45 × 105 ± 0.28 × 10⁵ c2.80 × 105 ± 0.47 × 10⁵ a2.20 × 105 ± 0.13 × 10⁵ b1.54 × 105 ± 0.07 × 10⁵ c
Isoleucine3.24 × 104 ± 1.13 × 10⁴ a3.58 ×104 ± 0.93 ×10⁴ a2.01 ×104 ± 0.13 × 10⁴ b0.0 ± 0.0 c
Leucine3.49 × 104 ± 1.28 × 10⁴ b3.85 ×104 ± 0.39 × 10⁴ a0.59 ×104 ± 0.04 × 10⁴ c0.0 ± 0.0 d
Conditional and non-essential amino acids
Asparagine0.37 × 106 ± 0.06 × 10⁶ b0.11 × 106 ± 0.02 × 10⁶ c1.51 × 106 ± 0.22 × 10⁶ a0.0 ± 0.0 d
Aspartic acid1.46 × 105 ± 0.19 × 10⁵ bc1.27 × 105 ± 012 × 105 c3.23 × 105 ± 0.43 × 10⁵ a1.65 × 105 ± 0.09 × 10⁵ b
Serine1.46 × 105 ± 0.21 × 10⁵ c0.99 × 105 ± 0.09 × 10⁵ d3.82 × 105 ± 0.41 × 10⁵ a2.06 × 105 ± 0.12 × 10⁵ b
Alanine5.16 × 105 ± 0.77 × 10⁵ c4.42 × 105 ± 0.61 × 10⁵ c9.91 × 105 ± 1.34 × 10⁵ b11.93 × 105 ± 2.47 × 10⁵ a
Glutamic acid1.42 × 106 ± 0.21 × 10⁶ c1.32 × 106 ± 0.16 × 10⁶ c2.46 × 106 ± 0.27 × 10⁶ a1.69 × 106 ± 0.14 × 10⁶ b
Glycine0.99 × 104 ± 0.09 × 10⁴ c1.16 × 104 ± 0.34 × 10⁴ c2.57 × 104 ± 0.29 × 10⁴ a1.63 × 104 ± 0.58 × 10⁴ b
Proline3.48 × 107 ± 0.07 × 10⁷ b2.75 × 107 ± 0.47 × 10⁷ c10.99 × 107 ± 1.69 × 10⁷ a9.87 × 107 ± 0.56 × 10⁷ a
Organic acids
Malic acid7.71 × 105 ± 1.71 × 10⁵ c13.95 × 105 ± 2.93 x10⁵ a10.25 ×105 ± 0.79 × 10⁵ b11.28 × 105 ± 0.85 × 10⁵ b
Pyruvic acid1.06 × 103 ± 0.47 × 10³ c1.30 × 103 ± 0.82 x10³ b1.01 ×103 ± 0.66 × 10³ c1.78 × 103 ± 0.41 × 10³ a
Lactic acid4.83 × 104 ± 1.41 × 10⁴ c7.99 × 104.4 ± 3.1 x10⁴ b7.03 × 104 ± 1.34 × 10⁴ b12.28 × 104 ± 1.05 × 10⁴ a
Citric acid14.22 × 104 ± 4.85 × 10⁵ c22.34 × 105 ± 6.45 x10⁵ b15.41 × 105 ± 2.52 × 10⁵ c36.27 × 105 ± 7.59 × 10⁵ a
Succinic acid2.78 × 104 ± 0.83 × 10⁴ c4.04 × 104 ± 1.28 x10⁴ b2.69 × 104 ± 0.23 × 10⁴ c5.62 × 104 ± 0.35 × 10⁴ a
Fumaric acid4.20 × 104 ± 1.33 × 10⁴ c4.65 × 104 ± 2.19 x10⁴ c10.03 × 104 ± 2.38 ×10⁴ b20.97 × 104 ± 1.32 × 10⁴ a
Vitamins
Nicotinic acid1.98 × 104 ± 0.56 × 10⁴ b1.21 × 104 ± 0.46 x10⁴ c9.25 × 104 ± 1.51 × 10⁴ a8.60 × 104 ± 0.65 × 10⁴ a
Niacin amide6.84 × 104 ± 1.49 × 10⁴ c9.54 × 104 ± 1.86 x10⁴ b9.49 × 104 ± 0.84 × 10⁴ b15.00 × 104 ± 1.65 × 10⁴ a
Pantothenic acid2.19 × 104 ± 0.41 × 10⁴ c2.91 × 104 ± 0.69 x10⁴ b6.92 × 104 ± 1.21 × 10⁴ a6.74 × 104 ± 0.57 × 10⁴ a
Values are means ± standard errors. Means in the same row with different letters are significantly (p < 0.05) different using Tukey’s Honest Significant Test.

