1. Introduction
For more than a century, it has been recorded that some substances at low doses can be beneficial, while in higher doses they are lethal [
1]. According to Southam and Ehrlich [
2], hormesis is proposed to define a stimulatory effect of sub-inhibitory concentrations of any toxic substance on any organism. This is the case with compounds such as pharmaceuticals used for their beneficial effects as well as with pesticides commonly used as toxicants [
1]. Calabrese and Baldwin [
3] found more than 9000 examples of hormesis induced by medications, pesticides or radiation treatments, and all results depended on the dose used for each substance.
Various studies conducted both under laboratory and field conditions showed that some herbicides can stimulate plant growth when applied at low doses (<50% of EC
50) [
4], and this growth-stimulating phenomenon of herbicides is known as herbicide hormesis [
5]. Herbicide hormesis depends upon the type of herbicide, time of applications, dose, crop or weed species, and other practices [
6]. In some studies using three plant species and 10 different herbicides, 687 dose–response curves were included, which discovered that sub-lethal doses of herbicides produced hormetic responses in 25–76% cases, depending upon the plant species [
5]. Plants can have contact with low rates of herbicides by unwanted drift deposition, contact of the crop leaves with treated weeds, absorption of low doses from the soil, especially after soil degradation or immobilisation [
7]. Also, they can be applied at low doses intentionally, to regulate growth, modify the composition of plant biomass, or accumulate specific compounds. Herbicide-induced hormesis can play an important role in herbicide resistance. Although sub-lethal levels of herbicides are sometimes used to stimulate certain desired crop responses, the unpredictability of hormesis makes it too risky for general crop production [
8].
Herbicides as inhibitors of biosynthetic processes, like lipid, carotenoid, and amino acid synthesis, are good candidates for uses in sub-lethal doses, because their application can change the concentration of many compounds in plants [
4]. For most herbicides, the effect of stimulation is 15–30% under laboratory conditions and slightly less under field conditions, although there are cases where there is no detectable or significant hormesis and others where the effect is much more than 30% [
8]. Although there is an increasing number of studies of herbicide hormesis, the most widely used herbicide in the world, glyphosate, seems to be the one that consistently induces this growth response [
9].
Glyphosate, a systemic herbicide, was introduced in 1974 by Monsanto (Roundup) for use in agriculture and ruderal or industrial vegetation control and also in waterways for aquatic plants [
10]. The herbicidal action of glyphosate is based on the inhibition of the enzyme 5-enolpyruvylshikimate 3-phosphate synthase (EPSPS) which results in reduced biosynthesis of aromatic amino acids and changes in protein metabolism [
11]. The shikimic acid pathway is responsible for the production of tryptophan, phenylalanine, tyrosine, and some other phenolic compounds which may represent up to 35% of plant biomass and 20% of the carbon fixed by photosynthesis [
12]. In glyphosate-treated plants, shikimate accumulates to a high level as a result of the inhibition of EPSPS, and even at subtoxic doses, shikimate levels increase in most plant species [
4], since shikimate is a precursor for semisynthesis of oseltamivir [
13], an antiviral drug used to control nonresistant strains of virus. The process shows that glyphosate could be of interest to the pharmaceutical industry [
14] or to enhance production in species, such as star anise, from which it is commercially extracted.
The stimulatory effect of glyphosate applied at low doses has been reported for many species, including crops and weeds, such as soybean, maize, barley, lettuce, eucalyptus, coffee, sugarcane, pine, and
Arabidopsis thaliana [
1,
15], where the doses applied enchanced plant growth and different physiological parameters [
9]. The only example of efficient commercial use of a sub-lethal dose of glyphosate was in sugarcane to enhance sugar production [
16]. At low doses, glyphosate stimulates photosynthesis by increasing the CO
2 efficacy and, in that way, it increases the growth of that crop species [
17]. Also, it causes sustainable hormesis on crop growth and increases seed yield [
18]. In general, glyphosate hormesis is more reproducible and more pronounced than hormesis with some other herbicides [
19]. Understanding the effect of low glyphosate doses on plants is important because of the enormous amountsof its usage and the fact that target and non-target species are exposed to subtoxic doses of herbicide [
15].
This study aimed to test the effects of sub-lethal doses of glyphosate onconventional soybean and Amaranthus retroflexus L. in order to establish crop stimulation and weed control.
The results from the literature [
1,
15,
18] indicate that glyphosate hormesis could play a significant role in altering crop/weed competition. Balkan, as the most commonly sown soybean variety in Serbia, was suitable for research in order to determine whether accidental drift can have a hormesis effect. At the same time, theinfluence on the weed species
A. retroflexus was investigated, because the possibilities of controlling this weed with sub-lethal amounts could be applied in the anti-resistance strategy.
2. Materials and Methods
Two experiments were conducted for this study. The first was carried out under greenhouse conditions to evaluate the biological response (i.e., phytotoxicity, root length, and fresh weight) of soybean (Glycine max (L.) Merr.) and A. retroflexus to different sub-lethal doses of glyphosate. The second experiment was under controlled conditions to determine the content of chlorophyll a, b, and carotenoids in acetone solution and to determine the ratio of shikimate concentration after herbicide application. The experimental study was conducted at Bačka Topola, Serbia (45°48′55″ N; 19°38′13″ E; altitude 110), and the experiment was carried out a the Laboratory for Biological Research and Pesticides, Department of Phytomedicine and Environment Protection of Faculty of Agriculture, University of Novi Sad, Serbia.
2.1. Determination of Phytotoxicity, Root Length, and Fresh Weight
The experiment was conducted in a greenhouse during May and June of 2016, with temperatures ranging 24–30°C and with relative humidity 60–70%. Both species were sown and grown in plastic pots (V 10.5 B) using a commercial substrate Humovit (pH 4–7; O.M min 20%; P2O5 min 0.1%; N min 0.30%). Water was provided for the growth and development of the plants as well as treatment with some protective agents. For the purpose of testing the hormesis effect, the herbicide glyphosate (Glifol, Galenika–Fitofarmacija, Belgrade, Serbia) was used. Different amounts of glyphosate were applied to soybean and
A. retroflexus. Soybean plants were sprayed with glyphosate at the doses 1.8, 3.6, 7.2, 36, 180, and 720 g ha
−1, while
A. retroflexus plants were sprayed with doses of 7.2, 36, 180, 720, 1440, and 2880 g ha
−1. Next to commercial concentration of herbicides (720 g ha
−1), an experiment was applied with higher amounts (i.e., 1440 and 2880 g ha
−1) for
A. retroflexus and lower amounts (i.e., 1.8 and 3.6 g ha
−1) for soybean. Four concentrations (7.2, 36, 180, and 720 g ha
−1) was applied to the crops and weed, because in that range were determined hormesis effects according to the literature [
4,
15,
19]. Glyphosate was applied using a hand-sprayer Einhell (type BG-PS 1.5/1) with a working pressure of 2 kPa. Treatment applications were performed when the soybean plants were at the V2 (second trifoliate) growth stage, and the
A. retroflexus plants at the 2–4 leaf stage. Each trial was set-up in four repetitions and also included untreated controls. The efficacy of the treatments were determined by observing symptoms of visual injury on the leaf at 4, 7, and 45 days after application (DAT), assigning values ranging from 0% to 100% according to the phytotoxicity scale (0–5) [
20].
The effect of the applied sub-lethal doses of glyphosate was observed through measurements of the morphological parameters: root length and fresh weight. Parameters relating to the root length and fresh mass of the plants represent the mean values. Forty-five days after treatment, the percentage of fresh plant mass and root length in relation to the control were calculated.
2.2. Determination of Photosynthetic Pigments
Photosynthetic pigments, chlorophyll a, chlorophyll b, and carotenoids were determined spectrophotometrically in acetone extract of freshly picked leaves, according to the method of Von Wettstein [
21], 45 DAT. First, 0.5 g of plant material was measured and then homogenized in a mortar. To obtain a homogeneous sample, a smaller amount of sand was added and CaCO
3 to remove the acidity of the sample. Then, in a mortar, 5–10 mL of acetone was added and the homogeneous sample was transferred and filtered using a vacuum pump. The wavelengths at which the filtrate was read on a spectrophotometer were 662, 644, and 440 nm. The content of chlorophyll determinations (mg L
−1) was based on methods and equations (Equations(1)–(4)) according to Von Wettstein [
21] and Holm [
22].
where A is absorbance at the wavelength indicated. The values in the formula 9.784, 21.426, and others represent the molar absorption coefficients.
After calculating the concentration (mg L
−1), the amount of pigments C (mg g
−1) in plant material was determined according to the following equation (Equation (5)):
where C
1 is pigment concentration (mg/L), V is volume of extract (mL), R is dilution (if any), G is measured fresh plant material (g), and 1000 is factor to convert g to mg.
2.3. Determination of Shikimate in Plant Samples
The analytical standard of shikimic acid (99%) was purchased from Sigma–Aldrich, while all other chemicals (HCl, NaOH and Na2SO3) were obtained from J.T.Baker (Darmstadt, Germany).
For the analysis of shikimate concentration in leaf samples, the spectrophotometric method was applied [
23]. For the extraction, leaf samples (15 mg) were macerated, transferred into centrifuge tubes, with the addition of 2 mL of 0.25 N HCl to each tube, and placed in an ultrasound bath for 30 min. In addition, the samples were centrifuged for 5 min at 4000 rpm. In the next step, the mixture of supernatant (200 μL), deionized water (1250 μL), and 0.5% periodic acid (1250 μL) was shaken during 45 min at 37 °C. Then, 2.5 mL of solution of 0.6 M NaOH and 0.22 M Na
2SO
3 (3:2, v/v) was added and analyzed by Shimadzu UVmini-1240 spectrophotometer at a wavelength of 380 nm.
2.4. Statistical Analysis
All measured parameters, including phytotoxicity, root length, and fresh weight (% of control), 4, 7, and 45 DAT were subjected to a non-linear regression analysis using the four-parameter log-logistic model [
24,
25].
where Y is the response (e.g., % of phytotoxicity), C is the lower limit, D is the upper limit, B is the slope of the line at the inflection point, X is the glyphosate dose, and E is the dose resulting in a 50% response between the upper and lower limit (also known as an inflection point, I
50 or ED
50). This model is not symmetric around any point, so if in the four-parameter model (Equation (6)), the lower limit c=0, then Equation (6) becomes Equation (7) as a three-parameter model [
26].
All statistical analyses and graphs were performed with the open-source statistical software R 3.1.1. [
27], utilizing the dose–response curves statistical add-on package.
3. Results and Discussion
In crop species and weeds, glyphosate hormesis is observed with optimal hormetic doses, usually varying from 1.8 to 3.6 g ha
−1. The optimal dose of glyphosate for hormesis differs with plant species, age, and physiological status of the plants, time after application, and environmental factors [
19].
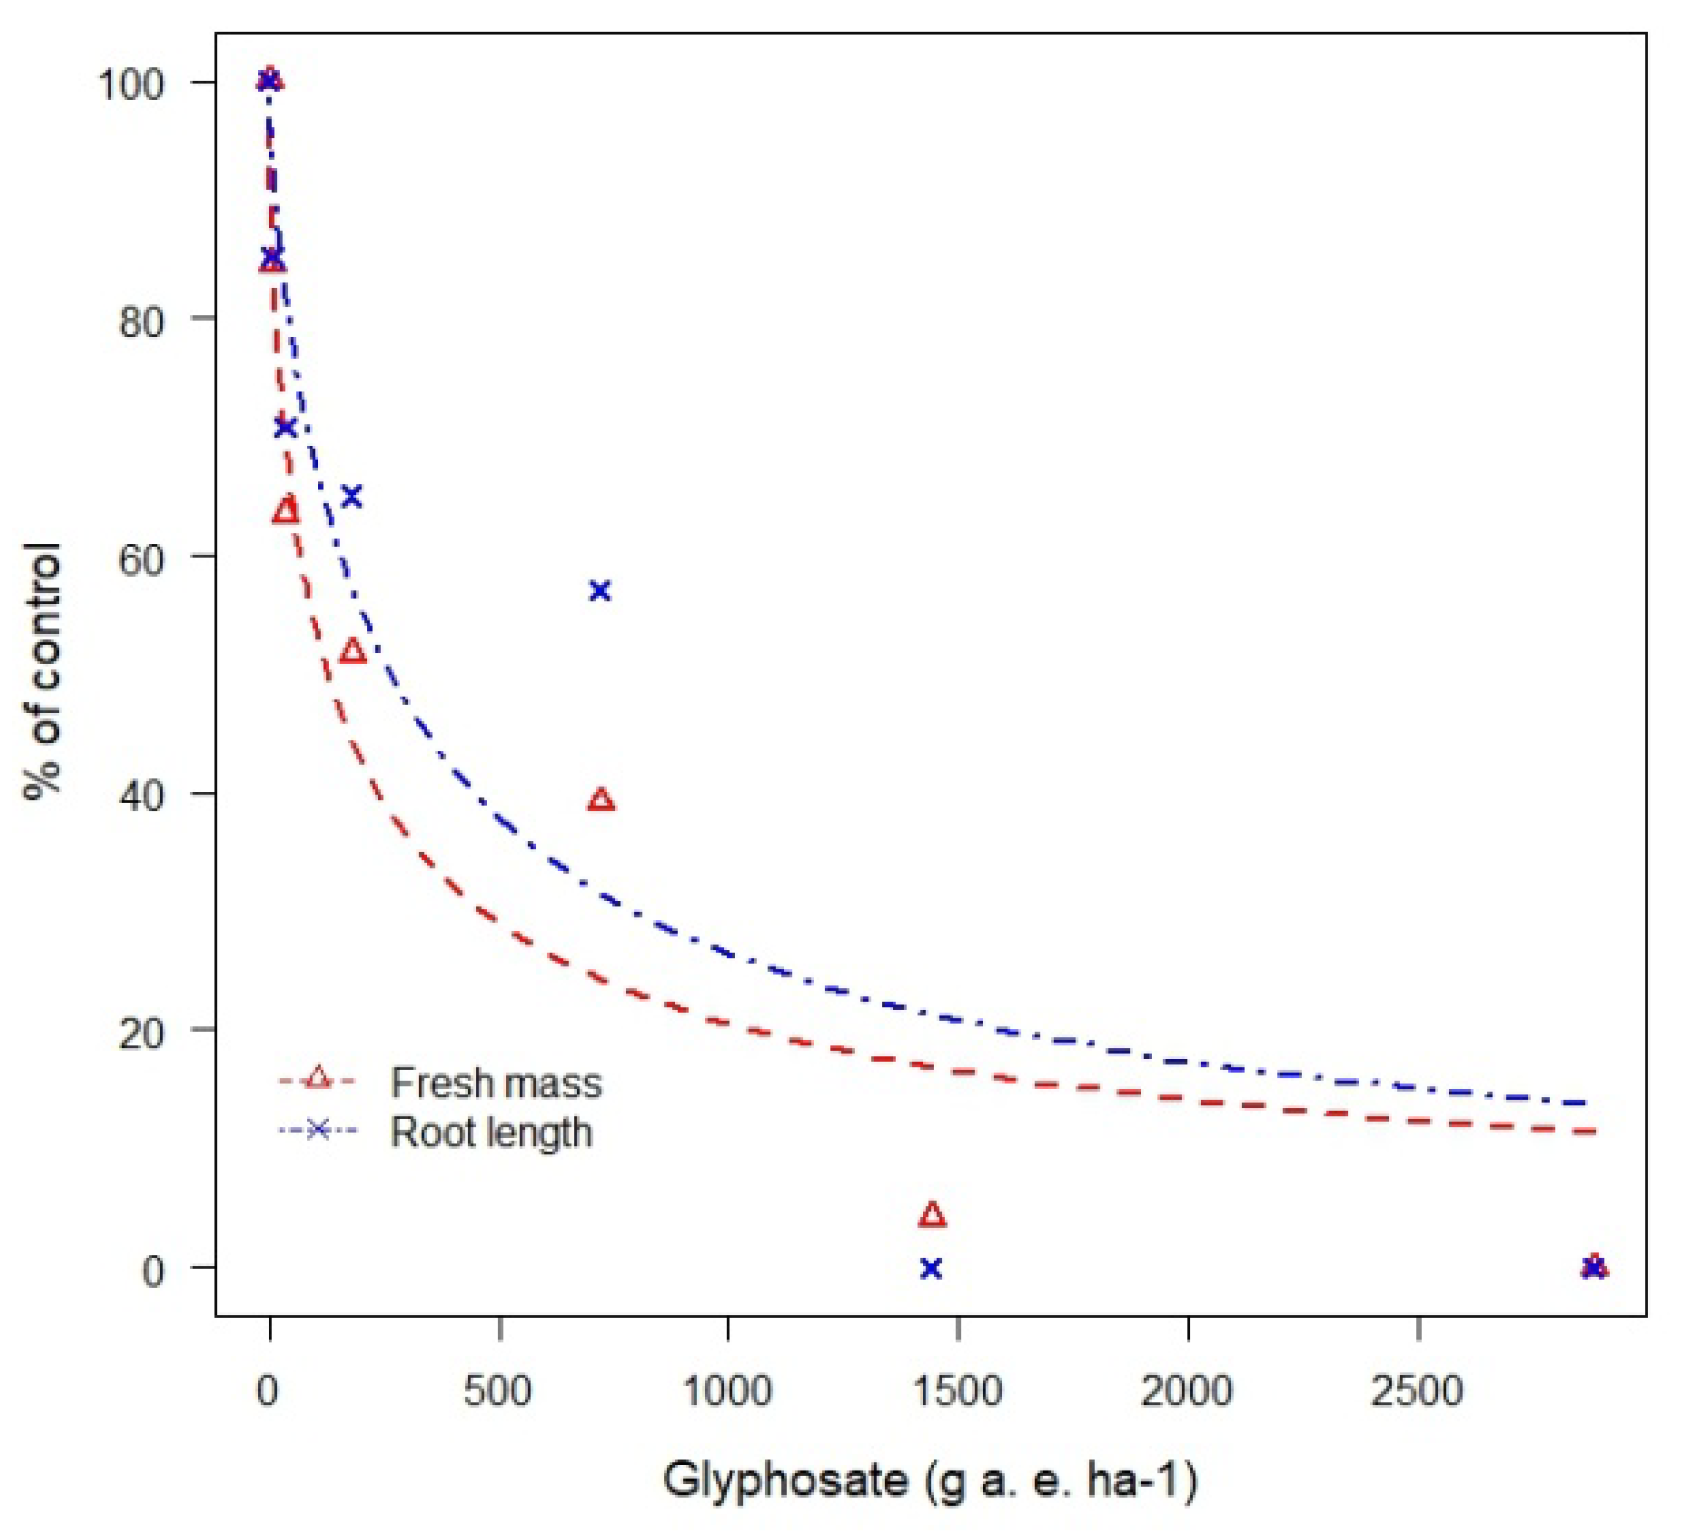
Doses of glyphosate in the range of 1.8 to 2880 g ha
−1 inhibited all measured parameters of soybean and
A. retroflexus. All sub-lethal amounts (7.2; 36; 180; 720; 1440; 2880 g ha
−1) had an inhibitory effect on
A. retroflexus root growth in the range of 31.59% to 100%, while the fresh aboveground mass at doses of 1440 and 2880 g ha
−1 had a total inhibition of 100% (
Figure 1). Nadeem et al. [
18] found that glyphosate in the range of 65–250 g ha
−1 stimulated the germination and growth of all tested broadleaf weeds, while at 500 g ha
−1 inhibition was observed.
Low doses of glyphosate (1.8; 3.6; 7.2; 36; 180; 720 g ha
−1) after application showed a lower effect on soybean than on
A. retroflexus (
Figure 2). Fresh soybean mass was reduced at all applied herbicide doses in the range of 13.31–72.16%, while root length was inhibited in the range 15.04 to 37.66%. The result of herbicide treatment can best be explained by the amounts of glyphosate in both cases, at doses of 7.2, 36, 180, and 720 g ha
−1. According to the obtained data, the fresh mass of
A. retroflexus in a glyphosate amount of 7.2 g ha
−1 was inhibited by 80.8%, while at the same amount the fresh mass of soybean was reduced by 6.36%. Herbicide dose at 36 g ha
−1also affected the fresh mass of weed and soybean, in weed it caused 76.31% of inhibition, and in soybean 19.26%. Root length of all tested species was also significantly affected by different doses of glyphosate. Testing the sensitivity of
A. retroflexus to glyphosate in an amount of 36 g ha
−1, the root length was reduced by 54.6%, and at the same amount, the root length of soybean was reduced by 40.84%. Results also revealed that glyphosate at other amounts caused inhibition of fresh mass and root length.
3.1. Phytotoxicity, Root Length, and Fresh Weight Assessment
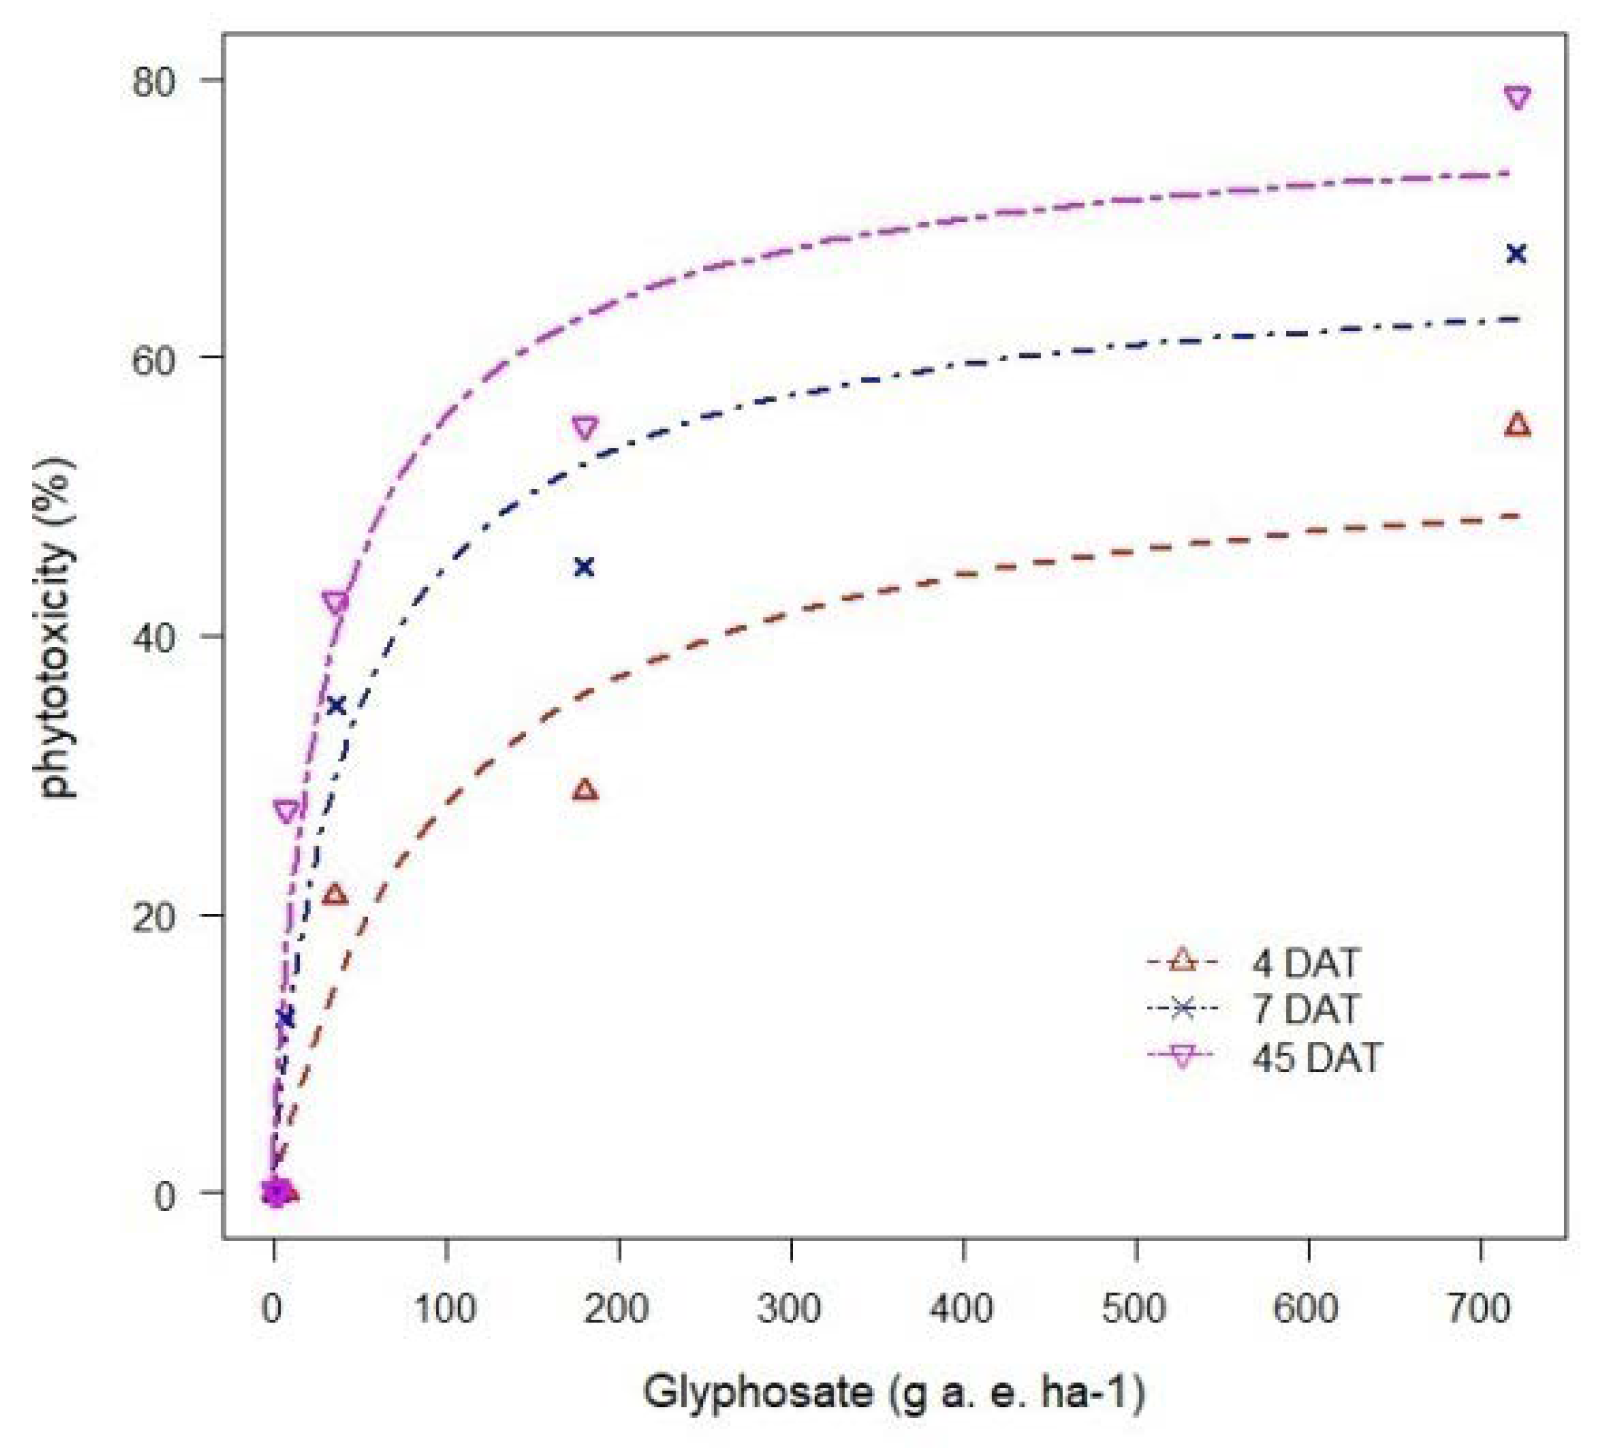
By visual assessment of the efficacy of glyphosate on soybean leaves, after 4 DAT a small appearance of necrotic and chlorotic spots (25%) were detected in theamount of 36 and 180 g ha
−1, while in theamount of 720 g ha
−1 changes in leaf mass were 50% when compared to the control (
Table 1). The plants were again evaluated and 7 DAT the lowest dose of glyphosate did not show any changes in leaf mass. The mmountof 720 g ha
−1 caused a visible decay of leaves (75%), and the damage was expressed in the form of chlorosis and necrosis. No changes were observed 45 DAT compared to the previous assessment (
Figure 3). The regression lines (
Figure 2 and
Figure 3) were plotted using Equation (7), and the values of the parameters are shown in
Table 1.
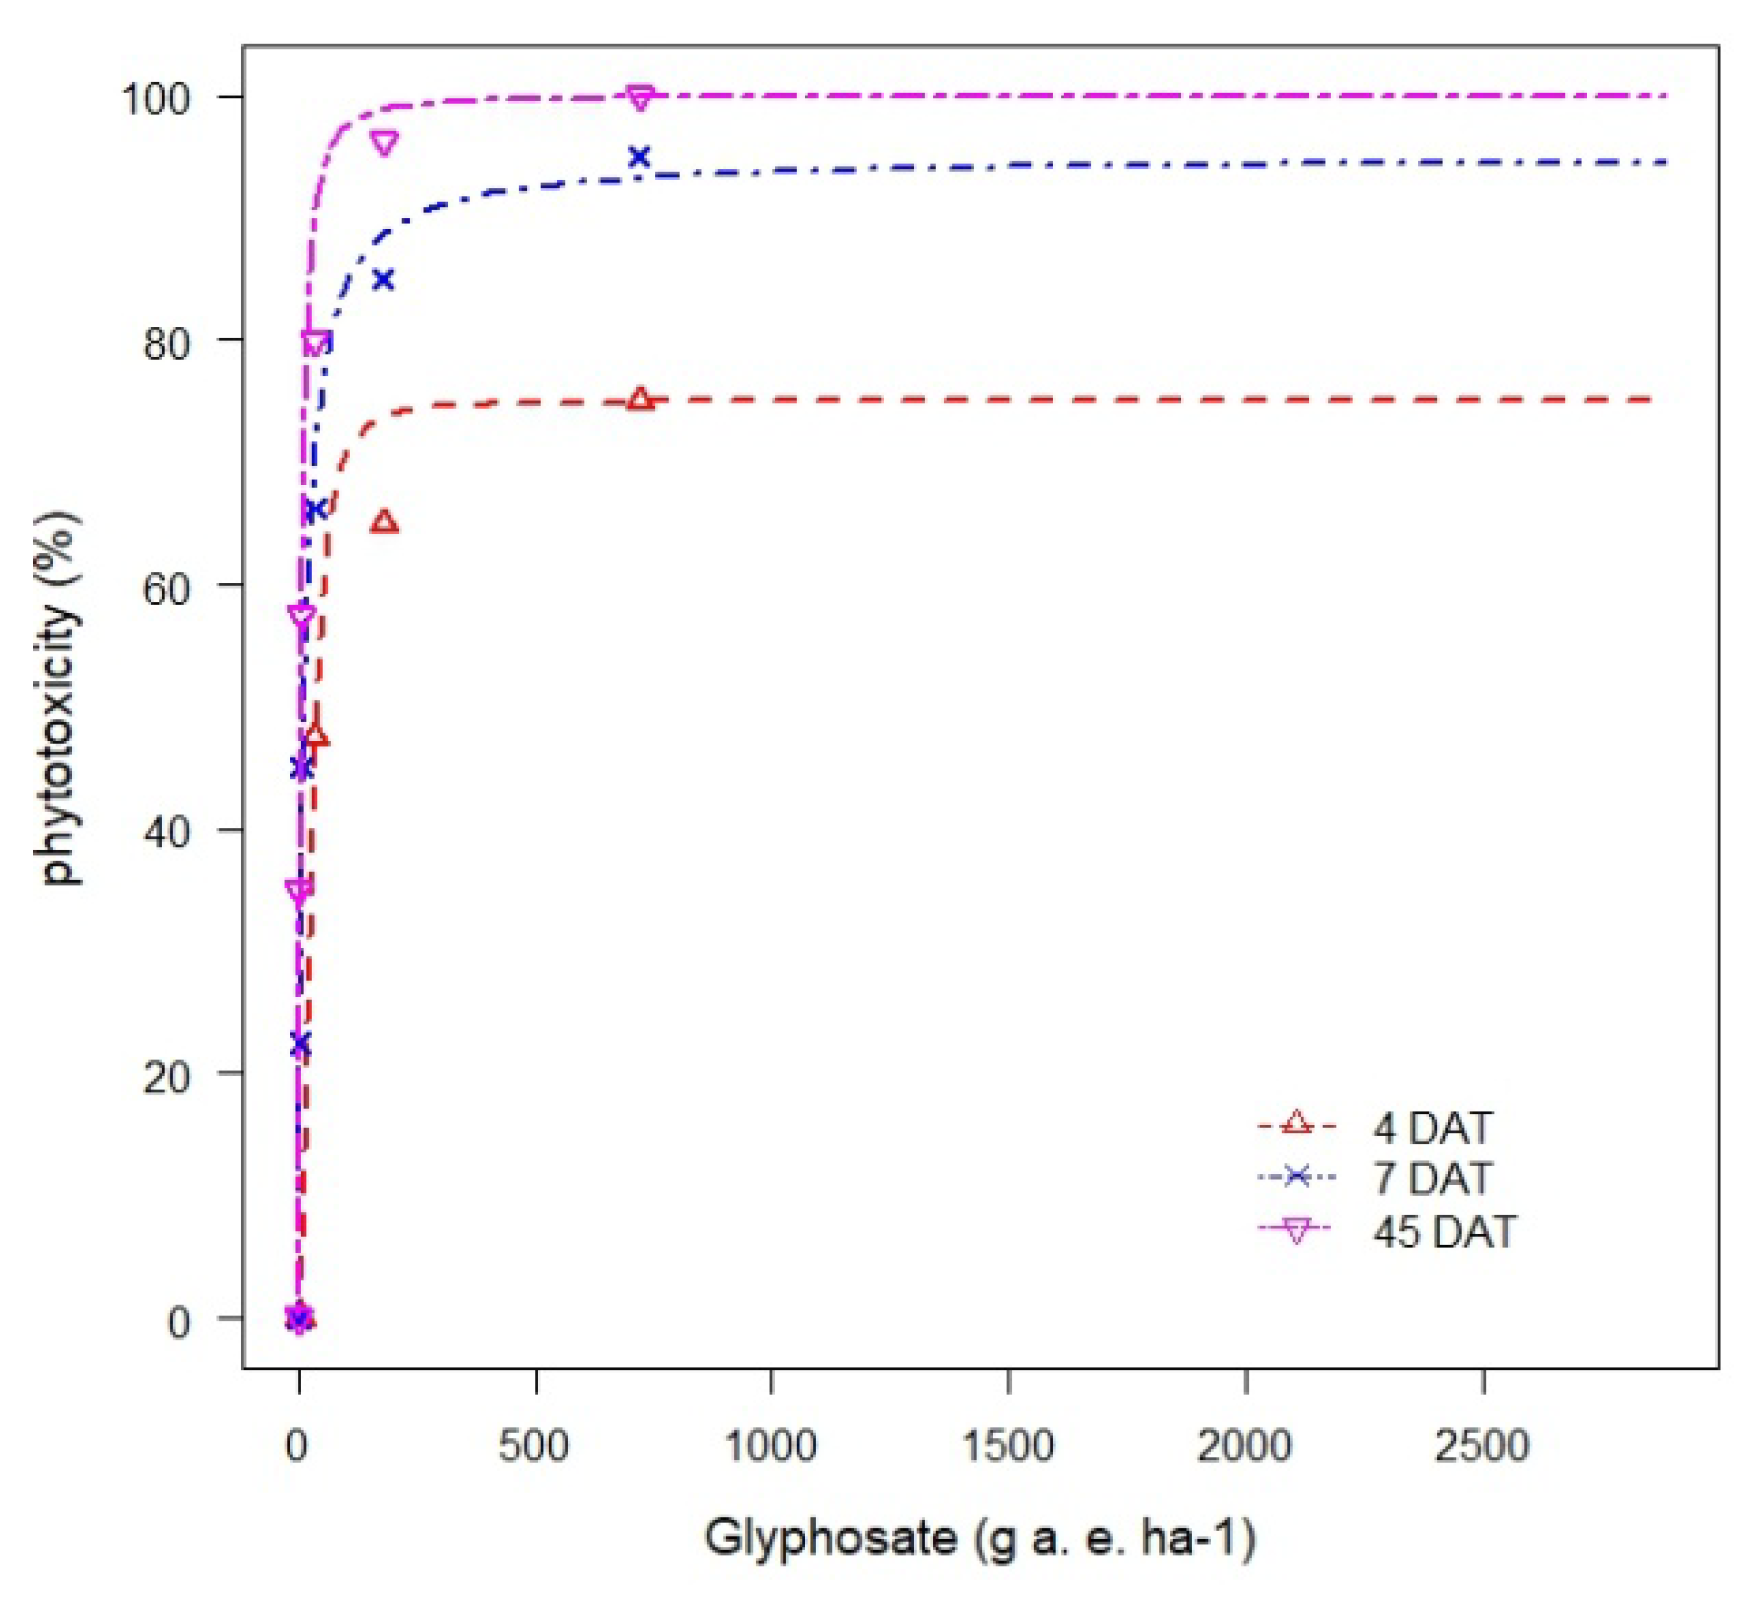
After the first assessment (4 DAT), 2880 and 1440 g ha
−1 showed chlorotic and necrotic spots on ¾ leaf mass of
A. retroflexus and damage more than 75%. Low doses of glyphosate 7.2, 36, 180 g ha
−1 did not cause any changes on the weed leaves (
Table 2). In the second assessment, 7 DAT, doses of 2880 and 1440 g ha
−1caused total decay of
A. retroflexus (100%). On
A. retroflexus, 45 DAT, no visible injury were observed compared to the previous assessment of phytotoxicity (
Figure 4).
In many studies where hormesis effect is mentioned, plant stimulation was different. Silva et al. [
15] reported that the lowest dose of glyphosate (1.8 g ha
−1) stimulated the growth of soybean, where dry root mass was 14%, and a dry mass of shoots was 99% higher than control. Total dry mass increased by 44%, which is similar to the 28% increase reported by Velini et al. [
4] but with lower amount of glyphosate (14.2 g ha
−1). The same authors did not observe a hormetic effect of glyphosate on resistant soybean to glyphosate, while in the conventional soybeans notable stimulation was observed, where total dry weight increased by 22% at the dose of 23 g ha
−1.
When it comes to the parameters of fresh mass and root length, according to the mean values for
A. retroflexus and soybean, determining the dose-response model, the following data were presented for
A. retroflexus (
Figure 1), and for soybean (
Figure 2).
The regression lines (
Figure 1 and
Figure 4) are plotted using Equation (7), and values of the parameter are shown in
Table 2.
The doses of herbicide at 36 and 180 g ha
−1 expressed the same percentage of damage on soybean and
A. retroflexus, whereby 36 g ha
−1 of glyphosate caused 25% of chlorotic and necrotic spots, while 180 g ha
−1 caused 50% damage to the leaf mass of both species (
Figure 2).
3.2. Determination of Shikimate Concentration
When low doses of glyphosate were studied, changes induced by shikimate concentration in the plant were not consistent. The application of sub-lethal doses of glyphosate induced a change in shikimate concentration. Schrübbers et al. [
28] reported higher concentrationsof shikimate in coffee after application of glyphosate at a dose of 86 g ha
−1 up to 7 DAT.
Shikimate was quantified by measuring optical density at 380 nm against a shikimate standard curve (R2= 0.998). Standard solutions were prepared by adding known amounts of shikimic acid to the HCl solution (1.25 M).
In this study, the highest concentration of shikimate (153.1 µg/g) in soybean leaves was found after the application of 180 g a.e. glyphosate ha
−1, and at 720 g ha
−1 the concentration of shikimate was 113.53 µg/g. According to the results, the increase of glyphosate concentration did not lead to an increase of the shikimate concentration on soybean leaves. For the evaluation of shikimate accumulation, a regression analysis was performed (
Table 3). The regression coefficient (
R2 = 0.367) indicated that there was no linear correlation between glyphosate concentration and accumulated shikimate. The accumulation of shikimate in
A. retroflexus tended to increase in the application of glyphosate doses lower of 180 g ha
−1. However, after the application of the highest dose (720 g ha
−1), the concentration of shikimate decreased (51.7 µg g
−1). Regression analysis showed an absence of correlation between shikimate concentrationin
A. retroflexus and applied doses of glyphosate, either using glyphosate concentration (
R2 = 0.235). However, regression analysis performed using the logarithm of glyphosate concentration showed a moderate correlation between applied doses of glyphosate and concentration of shikimate in soybean (
R2 = 0.568) and
A. retroflexus(
R2 = 0.699).
Analyzing the concentration of shikimate 45 DAT of glyphosate, it was found that a dose of 180 g ha
−1 caused a 231% increase of shikimate concentration in soybean, while the highest dose led to an increase of 145.58% shikimate when compared to the control. The lowest dose of glyphosate (1.8 g ha
−1) reduced the concentration of shikimate for 1.03%. Measuring the concentration of shikimate in
A. retroflexus treated with the lowest amount of glyphosate revealed a 22.57% increase in shikimate compared to the control. The dose of 720 g ha
−1 caused an increase in shikimate concentration of 58.86% and a dose of 180 g ha
−1 increase of 42.72%. Application rates of glyphosate in highest amounts of 1440 and 2880 g ha
−1 led to the complete decay of
A. retroflexus weeds. Investigating the effect of glyphosate on the concentration of shikimate, Velini et al. [
4] reported that the concentration of shikimate in soybean shoots were increased by low doses of glyphosate, showing that glyphosate was inhibiting EPSPS in the plants.
3.3. Effect of Glyphosate on the Content of Photosynthetic Pigments
Changes in contents of chlorophyll a and b after herbicide application have been shown in several experiments [
29,
30].
During a biological test, the amounts of chlorophylls a, b, and carotenoids in treated plants with sub-lethal doses of glyphosate (1.8, 3.6, 7.2 g ha
−1) were determined. These different amounts of herbicide have led to changes in the content of chlorophyll a, b, and carotenoids in soybean when compared to the control (
Figure 5). The chlorophyll a contents were decreased by different doses of glyphosate and were not higher than the control value. In addition, the reduction in content of chlorophyll b was more pronounced as the glyphosate doses increased, which also promoted changes in carotenoids contents compared to the control. All applied doses have led to an increase in the content of chlorophyll a, with the highest concentration being at doses of 7.2 and 180 g ha
−1, which brings a statistically significant difference when compared to the control. Kitchen et al. [
31] reported that chlorophyll content in soybean plants were reduced 44% by glyphosate after 4 days following treatment. Cedergreen and Olesen [
6] found that low doses of glyphosate can stimulate photosynthesis in barley plants for up to 1 week after application.
At higher doses it can inhibit photosynthesis, reducing the activity of ribulose bisphosphate carboxylase from 3-phosphoglycerate, decreasing the synthesis of chlorophyll and interfering with organisation of the photosynthetic apparatus [
32]. The decrease of chlorophyll content may be due to the increase in chlorophyll degradation or to a decrease in synthesis. Previously, it was reported that herbicide stress induced a reduction in the number of chloroplasts [
33].
The concentrations of chlorophyll a were increased in leaves of
A. retroflexus by herbicide exposure at different doses (
Figure 6). Content of chlorophyll b was decreased by different doses of herbicide, while the change in carotenoids production was not statistically significant. The use of higher doses of glyphosate (1440 and 2880 g ha
−1) has led to cell destruction and the death of plants.
Therefore, even under controlled conditions, the effect of glyphosate on plants is variable and depends on the dose applied, physiological characteristics of the plants, and environmental conditions [
34].
4. Conclusions
So, is there a possible way to involve the hormesis effect on the soybean with sub-lethal amounts of glyphosate used to control weed species Amaranthus retroflexus L.? According to realized investigations, with an amount of 36 g ha−1 glyphosate, the stimulation in measured parameters in soybean variety Balkan was absent, despite a satisfactory effect on A. retroflexus (76.31%). Plant pigment amounts and shikimate concentration indicate oxidative stress and herbicide phytotoxicity in target crop and weed species. The results of this study showed that sub-lethal amounts of glyphosate during V2 (second trifoliate) growth stage of soybean did not lead to stimulation of plants. Nevertheless, although the hormesis effect was not determined, the amount of 36 g ha−1 glyphosate stoodout, and could be recommended for potentional use withsoybean (Balkan variety). This amount did not stimulate soybean growth but allowed A. retroflexus control. Reduction of fresh mass in the amount of 76.31 was quite sufficient to slow down the growth of weeds. In the applied phenophase of the soybean (variety Balkan), it did not cause phytotoxic changes.
It is necessary to perform additional tests with lower amounts (1.8 and 3.6 g ha−1) of glyphosate on other varieties or at different phenophases of soybean, especially in the field, which would lead to growth stimulation of crop and depressive effects on weed development. The efficacy of these low amounts on A. retroflexus would have beenquestionable and, therefore, werenot the subject of research in this paper.

 ,
, 


