Article

Nitrogen Availability in Biochar-Amended Soils with Excessive Compost Application

Department of Forestry and Natural Resources, National Ilan University, Ilan 26047, Taiwan
*
Author to whom correspondence should be addressed.
Agronomy 2020, 10(3), 444; https://doi.org/10.3390/agronomy10030444
Submission received: 13 February 2020 / Revised: 15 March 2020 / Accepted: 21 March 2020 / Published: 24 March 2020
(This article belongs to the Special Issue Interaction of Biochar on Organic Waste Composting)

Abstract

:
Adding biochar to excessive compost amendments may affect compost mineralization rate and nitrogen (N) availability. The objective of this 371-day incubation study was to evaluate the effects of four proportions of woody biochar (0%, 0.5%, 1.0%, and 2.0%) from lead tree (Leucaena leucocephala (Lam.) de. Wit) biochar produced at 750 °C through dynamic mineral N and N mineralization rates in three rural soils (one Oxisol and two Inceptisols). In each treatment, 5% poultry–livestock manure compost was added to serve as an excessive application. The results indicated that the biochar decreased available total inorganic nitrogen (TIN) (NO3-N+NH4+-N) by on average 6%, 9% and 19% for 0.5%, 1.0% and 2.0% treatments, respectively. The soil type strongly influenced the impact of the biochar addition on the soil nitrogen mineralization potential, especially the soil pH and clay content. This study showed that the co-application of biochar and excessive compost benefited the agricultural soils by improving NO3-N retention in agroecosystems. The application of biochar to these soils to combine it with excessive compost appeared to be an effective method of utilizing these soil amendments, as it diminished the net N mineralization potential and reduced the nitrate loss of the excessive added compost.

Graphical Abstract

1. Introduction

Pyrolysis produces carbon (C)-rich biochar containing macronutrients, whereas composting produces compost that contains organic matter, C, and available macronutrients. Both processes can recycle nutrients from organic waste, residue, and purposefully grown catch crops [1], and are therefore useful tools to sustainably maintain or increase organic soil matter and to preserve and improve soil fertility and crop yield [2]. Soil organic matter (SOM) reduction and nutrient imbalances are major constraints in most tropical agricultural soils [3]. Nitrogen is the most common limiting nutrient in agricultural crop production [4], but is also highly susceptible to loss from the crop root zone. Due to the low N mineralization rate relative to chemical fertilizer [5] and relatively low levels of nutrients (10–20 g N/kg and less than 10 g P/kg) compared to complete fertilizer [6], farmers often apply excess compost to meet the N requirements of the crops and ensure adequate crop yield. Thereby, degrading soil and water quality and inhibiting crop growth [6] because excess N and P was lost from the soil and into the environment [7]. Improving soil fertility and productivity while simultaneously reducing negative environmental consequences is one of the greatest challenges in the management of the agricultural and horticultural production systems [8]. Identifying innovative ways to recycle macronutrients within agricultural systems while minimizing environmental impacts is of great importance in regard to achieving “circular economy” principles, i.e., “closing the loop”, by returning organic residue/waste to agricultural soils [9].
Although many studies report positive effects of a biochar–compost mix on soil properties and plant growth [1,2,10,11,12], biochar co-application with excessive compost has not been extensively studied, despite excessive compost already being commonly applied to agricultural soils where biochar application is also of interest. Thus, identification of the effects of biochar and excessive compost soil co-applications is important. Many studies [13,14,15] indicated that mixing biochar with manure at appropriate rates in land applications could potentially benefit manure-utilizing producers who also observe an increasing soil NO3-N pollution; co-application may lead to more efficient N fertilizer use. The accumulation of inorganic N in incubated, coarse-textured soils declined significantly as the biochar rate increased (0, 5, and 25 t/ha) in all three N treatments, namely, organic N applied as 500 kg/ha of wheat straw and pig manure compost, inorganic N applied as 100 kg/ha of NH4NO3, and the control (p < 0.001) [8]. When applied with manure (42 Mg/ha stockpiled dairy manure), the biochar (22.4 Mg/ha oak and hickory hardwood sawdust using fast pyrolysis at 500 °C) negatively influenced the seasonal mean and cumulative total net N mineralization in irrigated calcareous soil, however, this effect was less apparent during individual measurement periods [16]. When biochar was added to manured soil, rather than reduce the manure response, the biochar maximized net N mineralization and minimized the NH4/NO3 concentration ratio of the soil. The results of a 12-month incubation study [17] indicated that a 10% biochar application rate co-applied with a 2% manure application rate likely allowed for some net mineralization and nitrification of manure N, but limited excessive soil NO3-N accumulation in comparison to the 0%, 1%, and 2% biochar treatments. Throughout the incubation period, the co-application of the biochar (2% and 5% of pine chip-biochar produced at 700 °C) and paper mill biosolids (PB) (2.5%) resulted in significant decreases in NH4+-N, NO3-N, the net mineralized N concentration, and the applied N mineralization rate of the soil in comparison with soil to which only PB was applied [18].
The notable soil erosion, nutrient leaching, and rapid decomposition of soil organic matter are common in Taiwanese rural soils because of the area’s high precipitation and warm temperature, which are the two major setbacks to Taiwan’s agricultural soils. Farmers in Taiwan are recommended to add at least 5% compost /ha/year to maintain appropriate soil organic carbon (SOC) content (4–6%); taking economic viability into consideration, manure compost doses in Taiwan are recommended to be between 1% and 2% [19]. However, some farmers apply more than 2%, even up to 5%, in intensive cultivation periods for short-term leafy crops to add more N. The 5% addition rate involves the addition of 90 tons/ha compost to the soil, as well as a large amount of 1800 kg N/ha and 900 kg P/ha. In a previous study, measurements regarding carbon dynamics and fertility in biochar-amended soils with excessive compost application were conducted [19]. Based on this, we suggested that the addition of 0.5% woody biochar to rural Taiwanese soils was reasonable and appropriate to retain more plant nutrients and increase carbon sequestration. However, reducing inorganic N (NO3 and NH4+) loss from agricultural soils and to improve compost utilization efficiency for sustainable crop production are important in excessive compost applicated soils in Taiwan, for preventing environmental impacts, such as eutrophication (N and P) and acidification (N). There is a need to determine whether biochar’s addition to excessive compost-amended soils could impact the dynamics of soil N and reduce nitrate loss. The aim of our research was to evaluate the effects of the co-application of biochar and excessive compost on soil N dynamics. Our hypotheses were that co-applied biochar would modify the impact of excessive compost on soil NH4+-N and NO3N, and that the influence of biochar co-application would depend on biochar rate and incubation time. From our results, farmers could gradually reduce the addition of compost over the next few years by adding biochar to reduce inorganic N loss, as well as maintaining appropriate SOC (4%–6%) in Taiwan.

2. Materials and Methods

2.1. Soils, Biochar, and Compost

The characterizations of the three studied soils (15 cm depth), biochar, and poultry–livestock manure compost were analyzed and described in previous studies (Table 1). Briefly, three studied rural soils were collected in spring 2011 from the upper layers (0–15 cm) of three fields in Taiwan, including Pingchen (Pc) soil (slightly acidic Oxisols (SAO)), Erhlin (Eh) soil (mildly alkaline Inceptisols (MAI)), and Annei (An) soil (slightly acidic Inceptisols (SAI)). The term “slightly acidic” indicates the soil pH ranging from 6.1 to 6.5, and “mildly alkaline” indicates the soil pH ranging from 7.4 to 7.8. Biochar produced from the stems and branches of the lead tree (Leucaena leucocephala (Lam.) de. Wit) in an earth kiln was constructed by the Forest Utilization Division, Taiwan Forestry Research Institute, Taipei, Taiwan. The charring for earth kilns typically requires several days and reaches temperatures up to 500–700 °C. The highest temperature in the kiln at the end of carbonization was above 750 °C. The biochars were homogenized and ground into a mesh of < 2 mm for analysis. The poultry–livestock manure compost used in this study is the commercial products (organic fertilizer) certified by the government and often used by farmers. The main raw materials (> 50%) of the studied compost were poultry manure (mostly chicken) and livestock manure (mostly swine), and the minor raw material was mushroom waste, which was completely decomposed after a composting period of 6 months. The dry matter content was higher than 65%, according to regulations.

2.2. Incubation Experiment

To investigate the effect of biochar on the N mineralization of excessive compost application to soils, 5% commercially available poultry-livestock manure compost was added as a soil fertilizer, twice the recommended amount of organic fertilizer in Taiwan. It should be noted that this is a highly unlikely scenario, given the economic unviability of 5% compost for most farmers.
In this study, the effects of four proportions (0%, 0.5%, 1.0%, and 2.0% w/w) of biochar co-applied with compost (5.0% w/w) on SAO, MAI, and SAI soils were investigated over 371 days of incubation, consistent with the study of C dynamic [19] but shorter incubation days. A laboratory incubation experiment was conducted with a total of four treatments for each studied soil, namely, biochar-unamended soil + 5% compost, soil + 5% compost + 0.5% biochar, soil + 5% compost + 1.0% biochar, and soil + 5% compost + 2.0% biochar. In total, twelve treatments were conducted in this study. Soil was removed from the top 15 cm of the three studied soils. For each treatment, biochar and compost were thoroughly mixed with the soils with a stirring rod for at least 30 min. After mixing, a 25 g soil mixture was placed in plastic containers, each with a volume of 30 mL. The experiment had a completely randomized block design with 12 treatments, and each treatment had 110 replicates for destructive sampling during the incubation. According to the annual mean air temperature in Taiwan (1981–2010), on average 23 °C and ranging from 19 to 25 °C, and in consideration of the optimizing reaction kinetics for N and facilitating the experimental processes, the containers were sealed and incubated at 25 °C for 371 days, consistent with the previous study [19,20,21]. The soil moisture contents were adjusted to 60% of field capacity before the start of the incubation, and were maintained throughout the experiment using repeated weighing. The moisture was adjusted twice a week by weighing the jars and adding deionized water as necessary. The soil samples were destructively sampled from five replicate jars for each treatments, a series of 60 jars (three soils × four amendments × five repetitions) was taken, at 1, 3, 7, 14, 21, 28, 35, 42, 49, 56, 63, 77, 91, 105, 119, 133, 161, 189, 217, 245, 308, and 371 day for analysis of NO3-N and NH4+-N. The inorganic N (NO3-N and NH4+-N) was determined by extracting 5 g (dry weight equivalent) of soil with 25 mL of 2 M KCl [22]. The NO3-N and NH4+-N in the KCl soil extracts were determined colorimetrically using an automated flow injection analysis with O·I·Analytical Aurora Model 1030W (O.I. Corporation/Xylem, Inc., College Station, Texas, USA). Nitrate is determined by reduction to nitrite (NO2-N) via a cadmium reactor, diazotized with sulfanilamide and is coupled to N-(1-Napthyl)-ethylenediamine dihydrochloride to form an azochromophore (red-purple in color) measured spectrophotometrically at 540 nm. Ammonium reacts with alkaline phenol and hypochlorite to form indophenol blue in an amount proportional to the ammonia concentration. The blue color is intensified with sodium nitroferricyanide, and the absorbance is measured at 640 nm. The total inorganic nitrogen (TIN) was calculated as the sum of extractable NO3-N and NH4+-N. Nitrogen, nitrification, and TIN release rate were calculated at each sampling date by taking the concentrations of NH4+-N, NO3-N, and TIN and dividing by the sampling date (1,3,7, etc.). The percentages of NO3N and NH4+-N that decreased or increased due to the addition of the biochar were calculated using Equation (1) [23]
X (%) = [(Cn − C0)/C0] × 100
where X denotes the changes in the percentages of NO3-N and NH4+-N, C0 is the concentration in the control (mg/kg), and Cn is the concentration in the biochar-amended treatments (mg/kg).

2.3. Statistical Analysis

Statistical analyses (calculation of means and standard deviations, differences in means) were performed using Statistical Analysis System (SAS) 9.4 (SAS Institute Inc., SAS Campus Drive, Cary, NC, USA). The concentrations of inorganic N and available nutrients were averaged for each incubation time interval. A repeated measure multivariate analysis of variance (MANOVA) was used to test the changes in inorganic N concentrations according to the different biochar addition rates, soils, and incubation times. The addition rates and soils were the between-subject factors, and the incubation time was the within-subject factor. The repeated measure MANOVA was carried out using the general linear model (GLM) procedure. The results were analyzed by analysis of variance (one-way ANOVA) to test the effects of each treatment. The statistical significance was determined using least significant difference (LSD) tests based on a t-test at a probability level of 0.05. The values presented in the graphs and the text are the means ± 1 standard deviation (SD).

3. Results and Discussion

3.1. Available NH4+-N in the Soils
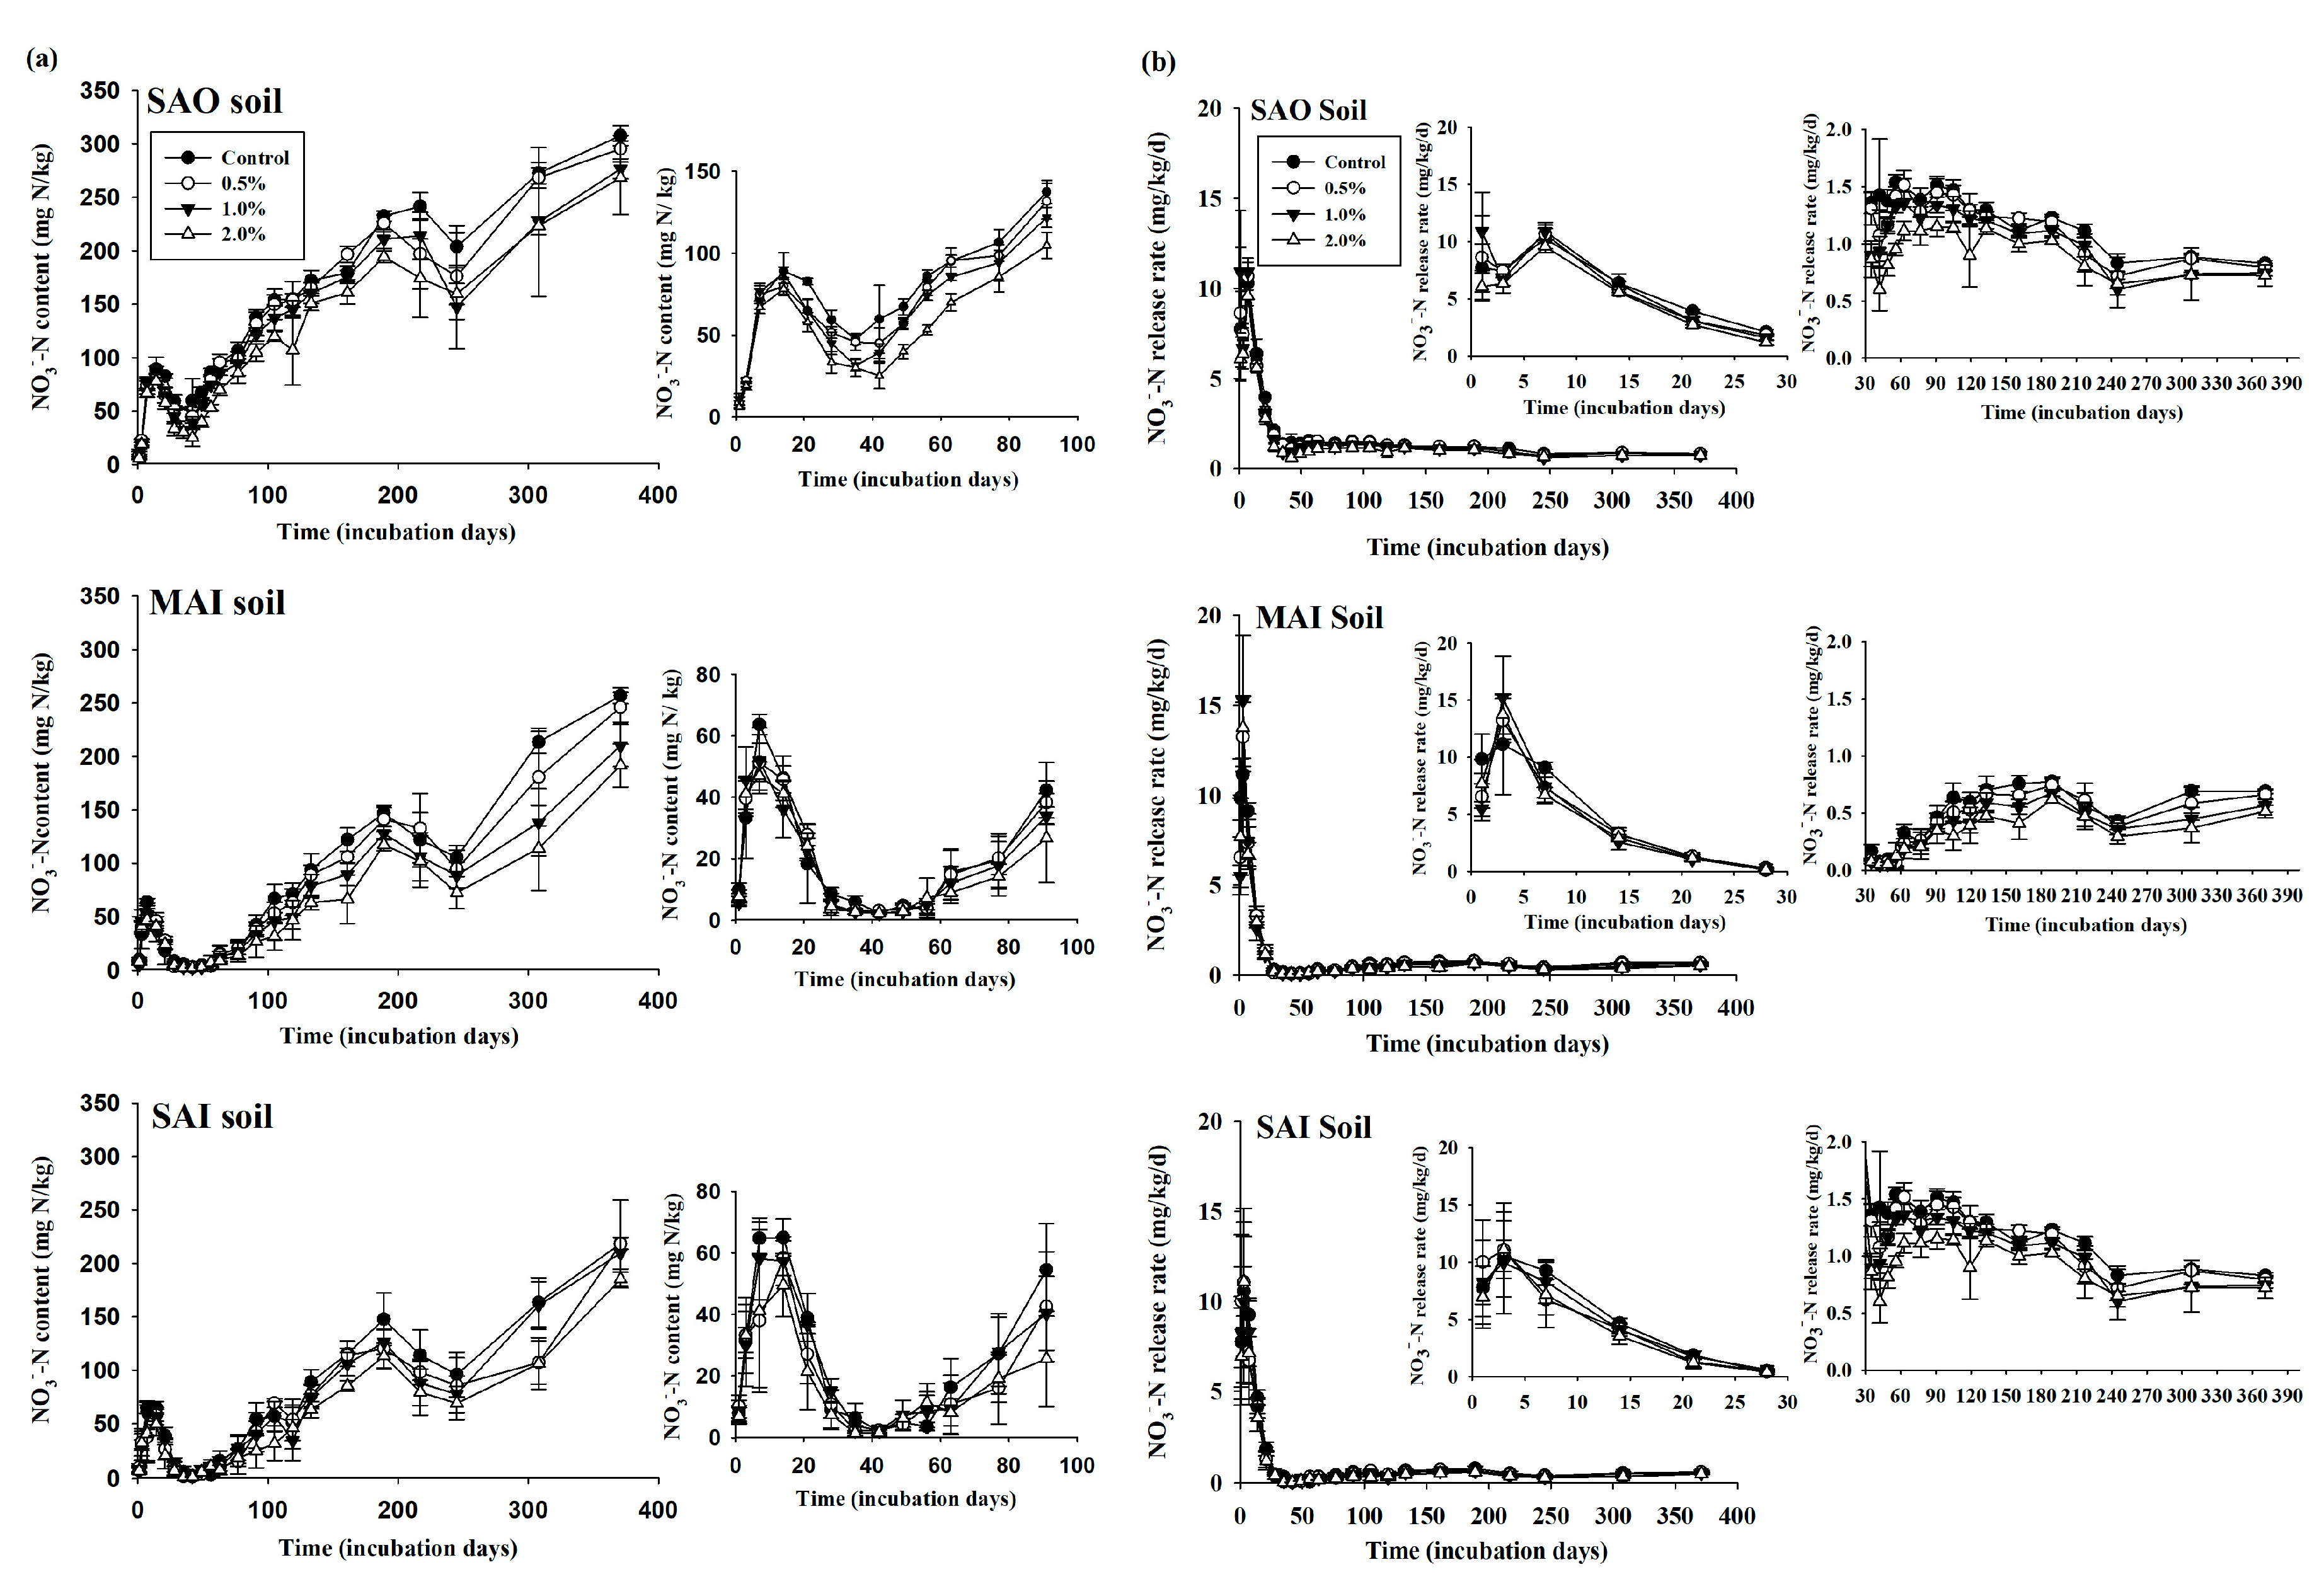
When more compost was added, the biochar treatments resulted in a significant rate and soil × rate interaction for the NO3-N and the TIN concentrations in the soil (Table 2). The biochar treatments resulted in significant time, time × soil, time × rate, and time × soil × rate interactions for the NO3-N, NH4+-N, and TIN concentrations in the soil. This significant influence explained the variable levels of these parameters during incubation. The initial soil concentrations of NH4+-N in the biochar-amended soils were higher than the NO3-N concentrations for all three types of soil (Figure 1, Figure 2). Over the course of the incubation (Figure 1a, Table 3), the NH4+-N concentrations increased and peaked at Day 3 (70–80 mg/kg in the SAO soil) and Day 1 (18–25 mg/kg in the MAI soil and 21–28 mg/kg in the SAI soil), indicating a small initial pulse of mineralized N, followed by a decline for the rest of the incubation period. The final NH4+-N concentrations were about 5–8 mg/kg in the SAO and SAI soils and 2–3 mg/kg in the MAI soil. The NH4+-N release rate was highest at Day 1, ranging from 28 to 34 mg/kg/d in the SAO soil, from 18 to 25 mg/kg/d in the MAI soil, and from 21 to 28 mg/kg/d in the SAI soil (Figure 1b). The NH4+-N release rate sharply declined and diminished to less than 0.1 mg/kg/d after Day 42 (about 6 weeks), indicating little or no new NH4+-N release from the biochar–compost mixed soils. Furthermore, the mean values of the NH4+-N soil concentrations over the 371 days of incubation were in order of SAO soil > SAI soil > MAI soil, and there was no significant difference observed between the 12 treatments due to the highly variability in the ammonium content during the incubation period (Figure 3a). The mean NH4+-N content values in the SAO soil decreased with increasing biochar addition, with similar effects observed after any biochar addition as when 0.5%–2.0% biochar was added to the MAI and SAI soils.
The initial soil concentrations of NH4+-N in the three biochar-amended soils were higher than the NO3-N concentrations (Figure 1a, Figure 2a). Dou et al. [24] proposed that the predominance of NH4+-N during the early stage of incubation was due to the inhibition of the nitrification process during that stage. In our study, the persistence of a high NH4+-N concentration in the SAO soil until Day 7 seemed to be the cause of the slow increase in NO3-N in this soil, although this was only observed between Day 1 and Day 3 for the MAI and SAI soils. A study by Manirakiza et al. [18] using a co-application of biochar and paper mill biosolids found consistently high NH4+-N concentrations in the Kamouraska clay soil until Day 28, probably due to the low aeration conditions in the Kamouraska clay soil (41% clay). The clay content (59%) of the SAO soil was higher than the Kamouraska clay soil (Table 1), indicating that the low aeration conditions also occurred in the SAO soil. The less persistence of this result observed in this study could be attributed to the large compost addition (5%) in comparison with Manirakiza et al. [18], who used 2.5% paper mill biosolids. In addition, when a 5% compost rate was applied, the NO3-N increased throughout all of biochar rates at 1–2 weeks and after 5–6 weeks, likely because of the available NO3-N release from the compost at 1–2 weeks and the mineralization and nitrification of the compost after 5–6 weeks. Previous studies regarding soil carbon dynamics [19,21] indicated that the C half-lives of SAO, MAI, and SAI soils, which were calculated based on a single first-order equation, were 42–44 days (–6 weeks), 54~60 days (–8 weeks), and 55–58 days (–8 weeks), respectively. Within the first year following the co-application of biochar and manure at 22.4 and 42 Mg/ha, respectively, to the same soil in a field study, Lentz and Ippolito [25] noted a decrease in NO3-N in this soil, followed by a slight increase in NO3-N, which was likely due to mineralization.
In our study, the biochar increased the content of the soil ammonium by 200% on average and declined by up to 6% (Figure 4a); in most cases the effect was insignificant and inconsistent in terms of time and rate of biochar application (Table 3), rendering it difficult to summarize the effects of biochar on the ammonium in the investigated soils. On the first day of incubation, significant declines in the ammonium contents of the SAO and MAI soils were noted for the 1.0% and 2.0% BC additions, which had considerably high contents of NH4+-N (≥25 mg/kg) in comparison to the SAI soil. At the end of the incubation period, this effect was mostly nullified because the content of ammonium in the control treatment decreased to the same level as that observed when the biochar was added (<8 mg/kg in the SAO and SAI soils and <3 mg/kg in the MAI soil). The rationale generally given for the adsorption of NH4+-N onto the biochar and the observed reductions in the NH4+-N leaching is due to the cation exchange capacity (CEC) of the biochar [26]. Gai et al. [27] indicated that biochar with a CEC of 19.0–68.6 cmol/kg acquired a higher ammonium adsorption capacity than biochar with a CEC of 0.3–8.5 cmol/kg. The results of the soil incubation experiment in a coastal wetland soil indicated that the NH4+-N content in 1% and 3% biochar treatments showed a downward trend throughout the incubation; the NH4+-N content was very low (0.02–4.58 mg/kg) during the whole incubation period and close to zero (0.43–1.52 mg/kg) throughout all of the treatments at the end of incubation, and no effect (p < 0.05) was observed on NH4+-N content throughout the incubation [28]. Four proportions of wood chip-based biochar (0.5%, 2%, 4%, and 8%) were added to ten different soils, with the results of the pot incubation experiment [23] indicating that the biochar increased the content of the soil ammonium by up to 184% and decreased it by up to 79%; however, in most cases the effect was insignificant and inconsistent in terms of the time and the rate of the biochar application. The authors also indicated that a significant decline in the content of the ammonium of the four soils was noted during the first week of incubation, showing that all samples had considerably high contents of NH4+-N (≥15 mg/kg) in comparison to the other soils. At the 12th week of incubation, this effect was nullified as the content of ammonium in the control treatment decreased to the same level as the biochar addition. All the other soils presented insignificant changes, possibly due to their low NH4+-N concentrations (≤6 mg/kg). This agrees with the findings of Hailegnaw et al. [23] and Jones et al. [29], who reported insignificant effects during biochar applications of 8% and 50 t/ha, respectively.
The high production temperature of biochar may have resulted in the low CEC of the biochar [23,27], which could be attributed to low polarity (low Oxygen/Carbon or O/C ratio) and the conversion of acidic functional groups on the biochar surface to neutral or basic-fused aromatic groups after losing their oxygen-containing functional groups. The CEC of biochar in this study was very low (5.2 cmol (+)/kg/soil) (Table 1), in association with a lower O:C molar ratio and fewer acidic functional groups [21]. The smallest decrease in inorganic N of the soils was observed in the woody biochar, which had a lower CEC value, less acidic functional groups, and lower labile C compounds than crop-derived and herbaceous biochar, thereby leading to lower N immobilization and N chemisorption [30]. The adsorption effects observed with the high-temperature biochar (700 °C) could be one of the reasons for the decline in the soil nitrate content. Several studies reported the adsorption of nitrate using a high-temperature biochar [8,15,23,31,32]. For a biochar to have any NO3 adsorption potential, the pyrolysis process must occur at a temperature of at least 600 °C [26]. In the biochar-amended composted manure, the mixed woody waste biochar produced at 600–700 °C was the only component that caused the capture of the nitrate and enabled its slow release [33].

3.2. Available NO3-N in the Soils

The NO3-N concentration increased throughout the course of the incubation and peaked on Day 14 in the SAO soil and on Day 7 in the MAI and SAI soils (Figure 2a, Table 4), indicating a small initial pulse of nitrification, followed by a sharp decline until Day 35 (30–48 mg kg−1 in the SAO soil) and Day 42 (2–3 mg kg−1 in the MAI soil and 1.5–2.2 mg kg−1 in the SAI soil). Sharp increases in the NO3-N concentrations were observed from Day 35 in the SAO soil and Day 42 in the MAI and SAI soils. The NH4+-N concentrations in the three soils diminished to very low levels by the end of the incubation and corresponded to increased NO3-N in the soils. The NO3-N release rate was highest on Day 7 in the SAO soil, ranging from 9.59 to 10.3 mg/kg/d and on Day 3 in the MAI and SAI soils, ranging from 11.1 to 15.2 mg/kg/d and 9.95 to 11.1 mg/kg/d, respectively (Figure 2b). The NO3-N release rate sharply declined, diminishing to less than 2 and 1 mg/kg/d for the SAO soil and MAI and SAI soils, respectively, after Day 28 (about four weeks). These results indicated that little nitrification occurred after four weeks in the biochar–compost mixed soils. The mean values of the NO3-N soil concentrations during 371 days of incubation were generally in the order of SAO soil > MAI soil > SAI soil (Figure 3b). The SAO soil showed a significantly higher mean nitrate content value than the MAI and SAI soils, but an insignificant difference between MAI and SAI soil. The nitrate content showed an obvious decrease when the biochar was added, increasing in all three soils. In addition, because the nitrate content was much higher than the ammonium content, the TIN (nitrate + ammonium) content was mostly attributed to the nitrate content. The soil TIN content showed similar changes regarding the nitrate contents (Table 3 and Table 5).
The soil NO3-N concentrations were significantly lower in the 2% biochar application compared to the other proportions (Figure 2a, Table 4) at most of the sampling times, which was likely due to microbial immobilization and a lower net mineralization:nitrification ratio [17]. During the incubation period, we presented the percentage of NO3-N change following biochar addition in three soils relative to NO3-N content of the control, as seen in Table 3. The negative effect of the biochar was prominent in almost all the investigated soils during the incubation period, with the rate of decline increasing as the rate of the biochar application increased from 0.5% to 2% (Figure 4b). The addition of the 0.5% biochar resulted in a decline in NO3-N, of 12% on average, in the SAI soil relative to the control. However, this decline was significant only during some of the incubation times (Table 4). The addition of 1.0% biochar induced a significant decline, of 17% on average, in the MAI soil relative to the control. The 2.0% biochar addition induced a significant decline in all the soils throughout the incubation period, with an average significant effect of 27% in the MAI and SAI soils. The study results of Dempster et al. [8] also indicated that the net nitrification rates decreased significantly when the added biochar increased (p < 0.001). The addition of biochar alone significantly (p < 0.05) reduced the NO3-N content after 25 days of incubation, but the addition rate had no significant effect on the NO3-N content [28]. The results of the pot incubation experiment [23] indicated that the additions of 0.5%, 2%, 4%, and 8% wood-chip-based biochar resulted in nitrate declining by up to 35%, 70%, 76%, and 81%, respectively, relative to the control. The study results of Yao et al. [32] identified a 34% reduction in nitrate leaching following the addition of biochar produced from pepperwood at 600 °C. Similarly, in N-rich soil, 2% and 4% of apple branch biochar reduced soil nitrate contents [34]. The decline of NO3-N in this study was lower because of the large amount of compost (5%) mixed into the study soils. Our results were consistent with those of Ippolito et al. [17], who observed a decrease in NO3-N soil content with the co-application of hardwood biochar (500 °C) and manure (2.0%) at a 10% biochar rate, suggesting that manure could mask the effects of 1% and 2% biochar on decreased NO3-N soil content by supplying sufficient inorganic N. Manirakiza et al. [18] co-applied biochar and paper mill biosolids and showed the same findings. Furthermore, the amounts of NO3-N adsorbed by biochar depended on the NO3-N soil concentration [28], but the effects of biochar on the soil adsorption capacity decreased over time after the biochar application [35]. Thus, the impact of the co-application of biochar and compost on N dynamics depended also on the incubation time in the three soils (Table 2), as suggested by Manirakiza et al. [18].

4. Conclusions

Our study showed that excessive compost-amended soils co-applied with woody biochar decreased the net mineralized N concentration. The co-application of excessive compost with the woody biochar drastically reduced the level of mineral N availability and led to the sequestration of released N. The mean values of the NH4+-N and NO3-N soil concentrations over the 371 days of incubation were in the order of SAO soil > SAI soil > MAI soil, and SAO soil > MAI soil > SAI soil, respectively. The mean NH4+-N content values in the SAO soil decreased with increasing biochar addition, with similar effects observed after any biochar addition, as when 0.5%–2.0% biochar was added to the MAI and SAI soils. The SAO soil showed a significantly higher mean nitrate content value than the MAI and SAI soils, but an insignificant difference between MAI and SAI soils. The nitrate content showed an obvious decrease when the biochar was added, increasing in all three soils. In addition, because the nitrate content was much higher than the ammonium content, the TIN (nitrate + ammonium) content was mostly attributed to the nitrate content. The soil TIN content showed similar changes regarding the nitrate contents. Previous research suggested that a biochar rate of 0.5% in rural Taiwanese soils was reasonable and appropriate to maintain high organic matter levels and carbon sequestration. However, when 0.5%, 1.0%, or 2.0% biochar was applied with 5% compost in the current study, the biochar decreased N availability by 5–8, 6–17 and 17–29 mg/kg, respectively. The average percentage over 22 times monitoring of mean relative value, expressed as the difference biochar amended treatments and un-amended control treatments, also indicated that the biochar decreased available TIN by 5%–7%, 1%–13% and 16%–24%, respectively. This finding may benefit producers, leading to more efficient compost N use. This method could serve as a slow N-release system with the possibility of enhancing the efficiency of excessive compost N use by reducing soil NO3-N erosion and loss risks, and could therefore be interesting for agricultural soil amendments. In addition, the soil type played an important role in the current study, in particular the pH and clay content of the soil.

Author Contributions

Conceptualization, C.-C.T.; methodology, C.-C.T.; validation, C.-C.T., formal analysis, Y.-F.C.; investigation, C.-C.T. and Y.-F.C.; data curation, C.-C.T. and Y.-F.C.; writing—original draft preparation, C.-C.T.; writing—review and editing, C.-C.T.; supervision, C.-C.T.; funding acquisition, C.-C.T. All authors have read and agreed to the published version of the manuscript.

Funding

This research received no external funding.

Acknowledgments

The authors thank the National Science Council of the Republic of China for financially supporting this research under Contract No. NSC-100-2313-B-197-001. Special thanks to G. S. Hwang, Forest Utilization Division, Taiwan Forestry Research Institute for supplying the biochars.

Conflicts of Interest

The authors declare no conflict of interest.

References

  1. Oldfield, T.L.; Sikirica, N.; Mondini, C.; López, G.; Kuikman, P.J.; Holden, N.M. Biochar, compost and biochar- compost blend as options to recover nutrients and sequester carbon. J. Environ. Manag. 2018, 218, 465–476. [Google Scholar] [CrossRef]
  2. Trupiano, D.; Cocozza, C.; Baronti, S.; Ame ndola, C.; Vaccari, F.P.; Lustrato, G.; Di Lonardo, S.; Fantasma, F.; Togne tti, R.; Scippa, G.S. The effects of biochar and its combination with compost on lettuce (Lactuca sativa L.) growth, soil properties, and soil microbial activity and abundance. Int. J. Agron. 2017, 2017, 3158207. [Google Scholar] [CrossRef] [Green Version]
  3. Lal, R. Sequestering carbon and increasing productivity by conservation agriculture. J. Soil Water Conserv. 2015, 70, 55A–62A. [Google Scholar] [CrossRef] [Green Version]
  4. Zebarth, B.J.; Drury, C.F.; Tremblay, N.; Cambouris, A.N. Opportunities for improved fertilizer nitrogen management in production of arable crops in eastern Canada: A review. Can. J. Soil Sci. 2009, 89, 113–132. [Google Scholar] [CrossRef]
  5. Yun, S.I.; Ro, H.M.; Choi, W.J.; Chang, S.X. Interactive effects of N fertilizer source and timing of fertilization leave specific N isotope signatures in Chinese cabbage and soil. Soil Biol. Biochem. 2006, 38, 1682–1689. [Google Scholar] [CrossRef]
  6. Yun, S.I.; Ro, H.M. Natural 15N abundance of plant and soil inorganic-N as evidence for over-fertilization with compost. Soil Biol. Biochem. 2009, 41, 1541–1547. [Google Scholar] [CrossRef]
  7. Lee, J.S.; Chang, K.W.; Cho, S.H.; Oh, J.G. Effect of compost application on radish quality and changes of soil physico-chemical properties in organic farming. Korean J. Soil. Sci. Fert. 1996, 29, 145–149. [Google Scholar]
  8. Dempster, D.N.; Gleeson, D.B.; Solaiman, Z.M.; Jones, D.L.; Murphy, D.V. Decreased soil microbial biomass and nitrogen mineralisation with Eucalyptus biochar addition to a coarse textured soil. Plant Soil 2012, 354, 311–324. [Google Scholar] [CrossRef]
  9. Mirabella, N.; Castellani, V.; Sala, S. Current options for the valorization of food manufacturing waste: A review. J. Clean. Prod. 2014, 65, 28–41. [Google Scholar] [CrossRef] [Green Version]
  10. Liu, J.; Schulz, H.; Brandl, S.; Miehtke, H.; Huwe, B.; Glaser, B. Short-term effect of biochar and compost on soil fertility and water status of a Dystric Cambisol in NE Germany under field conditions. J. Plant Nutr. Soil Sci. 2012, 175, 698–707. [Google Scholar] [CrossRef]
  11. Agegnehu, G.; Bird, M.; Nelson, P.; Bass, A. The ameliorating effects of biochar and compost on soil quality and plant growth on a Ferralsol. Soil Res. 2015, 53, 1–12. [Google Scholar] [CrossRef]
  12. Agegnehu, G.; Srivastava, A.K.; Bird, M.I. The role of biochar and biochar-compost in improving soil quality and crop performance: A review. Appl. Soil Ecol. 2017, 119, 156–170. [Google Scholar] [CrossRef]
  13. Chan, K.Y.; Van Zwieten, L.; Meszaros, I.; Downie, A.; Joseph, S. Agronomic values of greenwaste biochar as a soil amendment. Aust. J. Soil Res. 2007, 45, 629–634. [Google Scholar] [CrossRef]
  14. Kammann, C.I.; Linsel, S.; Gobling, J.W.; Koyro, H. Influence of biochar on drought tolerance of Chenopodium quinoa Willd and on soil-plant relations. Plant Soil 2011, 345, 195–210. [Google Scholar] [CrossRef]
  15. Kameyama, K.; Miyamoto, T.; Shiono, T.; Shinogi, Y. Influence of sugarcane bagasse-derived biochar application on nitrate leaching in calcaric dark red soil. J. Environ. Qual. 2012, 41, 1131–1137. [Google Scholar] [CrossRef]
  16. Lentz, R.D.; Ippolito, J.A.; Spokas, K.A. Biochar and manure effects on net nitrogen mineralization and greenhouse gas emissions from calcareous soil under corn. Soil Sci. Am. J. 2014, 78, 1641–1655. [Google Scholar] [CrossRef]
  17. Ippolito, J.A.; Stromberger, M.E.; Lentz, R.D.; Dungan, R.S. Hardwood biochar and manure co-application to a calcareous soil. Chemosphere 2016, 142, 84–91. [Google Scholar] [CrossRef]
  18. Manirakiza, E.; Ziadi, N.; St.Luce, M.; Hamel, C.; Antoun, H.; Karama, A. Nitrogen mineralization and microbial biomass carbon and nitrogen in response to co-application of biochar and paper mill biosolids. Appl. Soil Ecol. 2019, 142, 90–98. [Google Scholar] [CrossRef]
  19. Tsai, C.C.; Chang, Y.F. Carbon dynamics and fertility in biochar-amended soils with excessive compost application. Agronomy 2019, 9, 511. [Google Scholar] [CrossRef] [Green Version]
  20. Tsai, C.C.; Chang, Y.F.; Hwang, G.S.; Hseu, Z.Y. Impact of wood biochar addition on nutrient leaching and fertility in a rural Ultisols of Taiwan. Taiwan. J. Agric. Chem. Food Sci. 2013, 51, 80–93. [Google Scholar]
  21. Tsai, C.C.; Chang, Y.F. Viability of biochar on reducing C mineralization and improving nutrients status in a compost-treated Oxisols. Taiwan. J. Agric. Chem. Food Sci. 2016, 54, 74–89. [Google Scholar]
  22. Mulvaney, R.L. Nitrogen-inorganic forms. In Methods of Soil Analysis, Part 3 Chemical Method, 5.3, 1st ed.; Book Series No.5; Sparks, D.L., Page, A.L., Helmke, P.A., Loeppert, R.H., Soltanpour, P.N., Tabatabai, M.A., Johnston, C.T., Sumner, M.E., Eds.; Soil Science Society of America: Madison, WI, USA, 1996; pp. 1123–1185. [Google Scholar]
  23. Hailegnaw, N.S.; Mercl, F.; Pračke, K.; Száková, J.; Tlustoš, P. High temperature-produced biochar can be efficient in nitrate loss prevention and carbon sequestration. Geoderma 2019, 338, 48–55. [Google Scholar] [CrossRef]
  24. Dou, Z.X.; Toth, J.D.; Jabro, J.D.; Fox, R.H.; Fritton, D.D. Soil nitrogen mineralization during laboratory incubation: Dynamics and model fitting. Soil Biol. Biochem. 1996, 28, 625–632. [Google Scholar] [CrossRef]
  25. Lentz, R.D.; Ippolito, J.A. Biochar and manure affects calcareous soil and corn silage nutrient concentrations and uptake. J. Environ. Qual. 2012, 41, 1033–1043. [Google Scholar] [CrossRef]
  26. Clough, T.J.; Condron, L.M.; Kammann, C.; Müller, C. A review of biochar and soil nitrogen dynamics. Agronom 2013, 3, 275–293. [Google Scholar] [CrossRef] [Green Version]
  27. Gai, X.; Wang, H.; Liu, J.; Zhai, L.; Liu, S.; Ren, T.; Liu, H. Effects of feedstock and pyrolysis temperature on biochar adsorption of ammonium and nitrate. PLoS ONE 2014, 9, e113888. [Google Scholar] [CrossRef] [Green Version]
  28. Luo, X.X.; Chen, L.; Zheng, H.; Chang, J.J.; Wang, H.F.; Wang, Z.Y.; Xing, B.S. Biochar addition reduced net N mineralization of a coastal wetland soil in the Yellow River Delta, China. Geoderma 2016, 282, 120–128. [Google Scholar] [CrossRef] [Green Version]
  29. Jones, D.L.; Rousk, J.; Edwards-Jones, G.; Deluca, T.H.; Murphy, D.V. Biochar-mediated changes in soil quality and plant growth in a three year field trial. Soil Biol. Biochem. 2012, 45, 113–124. [Google Scholar] [CrossRef]
  30. Nguyen, T.T.N.; Xu, C.-Y.; Tahmasbian, I.; Che, R.; Xu, Z.; Zhou, X.; Wallace, H.M.; Bai, S.H. Effects of biochar on soil available inorganic nitrogen: A review and meta-analysis. Geoderma 2017, 288, 79–96. [Google Scholar] [CrossRef] [Green Version]
  31. Kameyama, K.; Miyamoto, T.; Iwata, Y.; Shiono, T. Influences of feedstock and pyrolysis temperature on the nitrate adsorption of biochar. Soil Sci. Plant Nutr. 2016, 62, 180–184. [Google Scholar] [CrossRef]
  32. Yao, Y.; Gao, B.; Zhang, M.; Inyang, M.; Zimmerman, A.R. Effect of biochar amendment on sorption and leaching of nitrate, ammonium, and phosphate in a sandy soil. Chemosphere 2012, 89, 1467–1471. [Google Scholar] [CrossRef] [PubMed]
  33. Hagemann, N.; Kammann, C.I.; Schmidt, H.-P.; Kappler, A.; Behrens, S. Nitrate capture and slow release in biochar amended compost and soil. PLoS ONE 2017, 12, e0171214. [Google Scholar] [CrossRef] [PubMed]
  34. Li, S.L.; Liang, C.T.; Shangguan, Z.P. Effects of apple branch biochar on soil C mineralization and nutrient cycling under two levels of N. Sci. Total Environ. 2017, 607, 109–119. [Google Scholar] [CrossRef] [PubMed]
  35. Šimanský, V.; Horák, J.; Igaz, D.; Balashov, E.; Jonczak, J. Biochar and biochar with N fertilizer as a potential tool for improving soil sorption of nutrients. J. Soils Sedi. 2018, 18, 1432–1440. [Google Scholar] [CrossRef]
Figure 1. Effects of biochar additions on (a) NH4+-N content and (b) NH4+-N release rate. For each incubation time, release rate was calculated as the amount of release divided by the incubation time. The data are mean value (n = 5), and vertical bars represent standard deviations (SDs) of the means.
Agronomy 10 00444 g001
Figure 2. Effects of biochar additions on (a) NO3-N content and (b) NO3-N release rate. For each incubation time, release rate was calculated as the amount of release divided by the incubation time. The data are mean value (n = 5), and vertical bars represent standard deviations (SDs) of the means.
Agronomy 10 00444 g002
Figure 3. Mean values (mg/kg) of (a) NH4+-N, (b) NO3-N, and (c) total inorganic N (TIN) in three studied soils during a 371-day incubation. The different lowercase letters indicate the significantly difference at p < 0.05 between treatments. The data are mean value (n = 110), and vertical bars represent standard deviations (SDs) of the means).
Agronomy 10 00444 g003
Figure 4. Average percentage (%) (22 times) of mean relative value of (a) NH4+-N, (b) NO3-N, and (c) total inorganic N (TIN) in three studied soils during a 371-day incubation. Percentage expressed as the difference between biochar amended treatments and un-amended control treatment. The data are mean value, and vertical bars represent standard deviations (SDs) of the means.
Agronomy 10 00444 g004
Table 1. Characteristics of biochar, compost, and three studied soils.
BiocharCompostPc SoilEh SoilAn Soil
(SAO)(MAI)(SAI)
pH9.918.416.1/5.037.5/7.236.5/6.23
EC (dS/m)0.771/1.3623.7910.452.210.81
Sand (%)----112433
Silt (%)----303633
Clay (%)----593934
Soil Texture----ClayClay loamClay loam
Total C (%)81.123.32.031.11 (0.81)40.94
Total N (g/kg)8.3622.62.712.321.58
Total P (g/kg)0.5510.21.160.980.77
Ex. K (cmol(+)/kg soil)1.91--0.320.290.21
Ex. Na (cmol(+)/kg soil)1.26--0.310.260.37
Ex. Ca (cmol(+)/kg soil)3.62--4.852.942.24
Ex. Mg (cmol(+)/kg soil)0.40--0.640.800.36
CEC (cmol(+)/kg soil)5.20--8.5811.514.2
BS6 (%)138--713722
M37-P (mg/kg)96.6687416323694.0
M3-K (mg/kg)616891168.410894.1
M3-Ca (g/kg)4.0914.52.038.222.99
M3-Mg (mg/kg)2783972143344401
M3-Fe (mg/kg)65.53965245891199
M3-Mn (mg/kg)20.918829.0213185
M3-Cu (mg/kg)0.026.229.779.953.17
M3-Pb (mg/kg)ND51.2310.811.71.54
M3-Zn (mg/kg)0.3562.420.47.985.28
1 The pH and electrical conductivity (EC) of biochar and compost were measured using 1:5 solid: solution ratio after shaking for 30 min in deionized water; 2 Biochar EC was measured after shaking biochar-water mixtures (1:5 solid: solution ratio) for 24 h; 3 Soil pH was determined in soil-to-deionized water ratio of 1:1 (g/mL) and in soil-to-1N KCl ratio of 1:1 (g/mL); 4 carbonate content; 5 ND = not detected; 6 BS = base saturation; 7 M3 = Mehlich 3 extractable. Data from Tsai and Chang [19].
Table 2. Significance (P value) of repeated-measures MANOVA results on soil nitrate (NO3-N), ammonium (NH4+-N), and total inorganic N (NH4+-N+ NO3-N) (TIN) in different soil series (Soil) and biochar application rates (Rate) in this study. The asterisks (*) indicate the significant difference at p < 0.0001.
Source of Variationdf1NH4+-NNO3-NTIN
Between subject effect
Soil2***
Rate30.17**
Soil×Rate60.29**
Within subject effect
Time21***
Time×Soil42***
Time×Rate63***
Time×Soil×Rate126***
1: df = degree of freedom.
Table 3. Soil NH4+-N levels (mg/kg) in three studied soils during a 371-day incubation1.
Treats1d3d7d14d21d28d35d42d49d56d63d
SAO-034.3a177.6a33.3a6.78ab5.78a0.94ab3.28bcd4.32bc3.40ab6.20a5.20ab
SAO-0.533.7a75.9a31.0a6.08abcd6.12a1.68ab4.52b2.84cd3.00abc5.00ab3.80bcd
SAO-130.1b68.9b30.6a7.28a5.26ab0.34b2.46bcd2.76cd4.20a5.00ab4.60abc
SAO-228.2bc71.0b29.1a6.18abc3.84c1.60ab4.18b2.22d4.40a4.00bcd2.60de
MAI-025.0cde0.10f0.00b3.82ef6.14a1.96ab3.72bc4.28bc0.00e0.60f4.00bcd
MAI-0.522.6def0.06f0.00b4.41cdef4.38bc0.16b1.10d6.08a0.00e1.76ef3.91bcd
MAI-119.6fg0.94f0.16b4.30def3.82c0.16b0.94d5.46ab0.00e3.40bcde5.80a
MAI-218.9g1.44f1.12b6.82ab3.26c0.08b0.96d3.26cd0.80de4.40abc4.00bcd
SAI-021.9efg21.3cd4.26b4.38cdef1.06d3.60a4.42b0.00e2.00bcd2.20def3.00cde
SAI-0.525.4cd17.5e1.64b5.38bcde0.88d1.40ab6.94a0.00e2.20bcd2.80cde3.40cd
SAI-125.7cd21.6c3.70b3.16fg0.16d3.72a3.86bc0.16e1.00de3.00bcde1.60e
SAI-227.5bc17.9de5.14b2.04g0.00d3.54a1.54cd0.00e1.60cde4.40abc2.60de
Treats77d91d105d119d133d161d189d217d245d308d371d
SAO-05.20a2.20cd4.80ab3.20a2.60b2.00bc2.80b4.60a5.40a6.40a5.20b
SAO-0.53.00bcd3.00bc6.00a4.40a2.20b3.40a3.40b4.60a4.20b6.20a7.00ab
SAO-13.60bcd4.40ab4.80ab4.00a3.20b3.40a5.60a3.20ab4.00bc5.60abcd6.40ab
SAO-23.80abc3.00bc5.80a4.00a3.00b2.60ab5.00a3.20ab3.80bc6.40a8.00a
MAI-02.60cd0.80de3.40bc2.60a5.40a1.00cd2.60b3.60ab3.80bc4.60de3.20c
MAI-0.52.13d0.40e3.54bc3.55a5.93a1.01cd3.14b3.72ab3.38bc3.77e3.00c
MAI-13.40bcd1.20de3.60bc4.00a5.20a1.20cd3.60b4.60a3.80bc4.60de2.00c
MAI-23.40bcd0.20e2.80c3.40a5.00a0.40d3.20b3.60ab3.40bc5.80abc2.60c
SAI-03.20bcd3.00bc5.00ab4.00a2.40b2.00bc5.40a2.60b4.00bc6.00ab5.80b
SAI-0.53.00bcd3.20bc2.60c3.60a2.80b2.80ab4.80a2.80b3.60bc4.80cde6.80ab
SAI-13.40bcd5.00a4.80ab4.20a2.40b3.40a4.80a3.60ab3.60bc5.00bcd8.00a
SAI-24.20ab4.00ab2.80c3.80a3.20b2.00bc5.20a3.00b3.00c4.60de5.80b
1. Means (n = 5) in a column by different lowercase letters are significantly difference at p < 0.05. 0 = 0% biochar, 0.5 = 0.5% biochar, 1 = 1% biochar, 2 = 2% biochar.
Table 4. Soil NO3-N levels (mg/kg) in three studied soils during a 371-day incubation1.
Treats1d3d7d14d21d28d35d42d49d56d63d
SAO-07.74abc122.4cd71.9ab89.3a82.8a59.3a47.6a59.8a67.4a86.0a95.2a
SAO-0.58.60abc22.4cd74.8ab79.9ab65.0b51.6b45.8a45.1b57.0b79.4b95.6a
SAO-110.9a20.1d76.5a88.0a64.8b45.0c31.5b39.3b57.2b74.2b85.4b
SAO-26.08bc19.1d67.1abc78.3b57.9b33.4d30.3b25.3c39.8c53.4c70.0c
MAI-09.82ab33.4bc63.8abc46.2e18.3e8.50fg5.84cd2.42d4.80de3.60e15.8d
MAI-0.56.53bc39.7ab51.4cde45.8e27.9de3.40g3.14cd3.06d3.77de3.72e14.8d
MAI-15.48c45.7a52.0cde36.1f23.1e5.10fg2.72cd2.20d2.80e5.40de12.2d
MAI-27.70abc41.3ab47.0de41.2ef24.2e4.50fg2.66cd2.24d2.80e7.00de8.60d
SAI-07.74abc31.6bc64.8abc65.0c38.9c8.92efg6.26c1.90d4.80de3.40e16.0d
SAI-0.510.0ab33.2bc37.9e58.3cd27.0de10.7ef2.08cd2.24d4.00de9.80d10.6d
SAI-18.22abc29.8bcd58.1bcd57.3cd36.7cd15.1e3.76cd2.22d7.40d8.40de9.40d
SAI-26.94bc33.3bc41.1e49.5de21.4e7.30fg1.40d1.56d6.00de11.2d8.00d
Treats77d91d105d119d133d161d189d217d245d308d371d
SAO-0107a138a154a155a172a179b233a242a204a273a308a
SAO-0.598.6ab131ab150ab154a165a197a226ab197bc176ab268a295ab
SAO-194.2bc122b137b145a161ab175b211b214ab147b227b277bc
SAO-285.8c105c120c107b151b161c194c174c160b223b268cd
MAI-019.4de42.0de67.0d71.0c93.8c122d147d122de105c214bc257cd
MAI-0.520.1de38.6def53.4de63.2c88.9cd106e141de133d94.7cd181cd246d
MAI-117.6de34.0ef45.8ef49.4cd78.6d89.4f128ef106def88.6cd138de210ef
MAI-214.2e26.6ef31.6f46.8cd63.2e66.4g117f102def72.6d114e192ef
SAI-027.2de54.6d57.0de51.2cd89.2cd116de148d114def96.0cd163d219e
SAI-0.515.6de42.4de69.2d53.8cd76.6de114de120f98.4def86.0cd107e218e
SAI-127.8d40.4def57.2de35.0d75.2de106e127ef88.2ef77.6cd161d210ef
SAI-219.2de25.4f32.2f46.4cd63.2e85.6f113f79.6f68.8d106e185f
1. Means (n = 5) in a column by different lowercase letters are significantly difference at p < 0.05. 0 = 0% biochar, 0.5 = 0.5% biochar, 1 = 1% biochar, 2 = 2% biochar.
Table 5. Soil inorganic N (NO3-N+ NH4+-N) levels (mg/kg) in three studied soils during a 371-day incubation1.
Treats1d3d7d14d21d28d35d42d49d56d63d
SAO-042.1a1100a105a96.1a88.6a60.3a50.9a64.1a70.6a92.6a100a
SAO-0.542.3a98.3ab106a86.0bc71.1b53.3b50.3a47.9b60.2b84.2b99.4a
SAO-141.0a88.9b107a95.3ab70.0b45.4c34.0b42.1b61.4b79.6b90.2b
SAO-234.3bcd90.1ab96.2a84.5c61.7b35.1d34.5b27.5c44.4c57.6c72.8c
MAI-034.9bc33.5e63.8bc50.1fg24.4ef10.4fg9.58c6.70d4.80def4.40g19.8d
MAI-0.529.1de39.7de51.3cde50.3fg32.2cde3.60g4.18de9.06d3.80ef5.60fg18.8d
MAI-125.0e46.6cd52.1cde40.4g26.9def5.24fg3.68e7.68d3.00f8.40efg17.6d
MAI-226.5e42.7cde48.1de48.0fg27.5def4.58g3.62e5.52d3.40f11.6def12.8d
SAI-029.7cde53.0c69.0b69.4d40.0c12.5ef10.7c1.90d6.80def5.40fg19.4d
SAI-0.535.4b50.7c39.6e63.7e27.9def12.1ef9.02cd2.24d6.40def12.6de14.2d
SAI-134.0bcd51.5c61.8bcd60.6de36.8cd18.8e7.62cde2.40d8.40d11.0defg11.0d
SAI-234.5bcd51.2c46.3de51.5ef21.4f10.8fg2.94e1.56d7.80de15.8d10.6d
Treats77d91d105d119d133d161d189d217d245d308d371d
SAO-0112a140a159a158a175a181b235a246a209a279a329a
SAO-0.5102ab134a156ab158a167ab200a229ab202bc180b275a319ab
SAO-198.0b126a142b149a164ab179b217b217ab151b233b299bc
SAO-289.6b108b126c111b154b163c199c178c163b230b292c
MAI-022.0cd43.0cde70.4d74.2c99.0c123d150d126de110c218bc275cd
MAI-0.522.4cd39.0de56.8de67.2c95.0cd107e145de137d98.4cd184cd264de
MAI-121.2cd35.2de49.4ef53.0cd83.8def90.8f132ef111def92.4cd143de228fgh
MAI-217.4d26.8e34.6f50.2cd68.2g66.8g121f106def75.8d120e210gh
SAI-030.4cd57.8c62.0de55.2cd92.0cde117de153d117def100cd169d240ef
SAI-0.518.8cd45.8cd72.0d57.8cd79.6efg117de125f101def89.8cd112e240ef
SAI-131.4c45.4cd61.8de39.4d77.2fg109de131ef91.4ef81.4cd166d233fg
SAI-223.6cd29.4de35.0f50.2cd66.8g87.6f119f82.8f72.4d111e206h
1. Means (n = 5) in a column by different lowercase letters are significantly difference at p < 0.05. 0 = 0% biochar, 0.5 = 0.5% biochar, 1 = 1% biochar, 2 = 2% biochar.

