Article

Tipburn Incidence and Ca Acquisition and Distribution in Lisianthus (Eustoma grandiflorum (Raf.) Shinn.) Cultivars under Different Ca Concentrations in Nutrient Solution

Center for Environment, Health and Field Sciences, Chiba University, 6−2−1 Kashiwa-no-ha, Kashiwa-City, Chiba 277-0882, Japan
*
Authors to whom correspondence should be addressed.
Agronomy 2020, 10(2), 216; https://doi.org/10.3390/agronomy10020216
Submission received: 8 January 2020 / Revised: 29 January 2020 / Accepted: 30 January 2020 / Published: 3 February 2020
(This article belongs to the Section Horticultural and Floricultural Crops)

Abstract

:
Tipburn (calcium (Ca) deficiency disorder) is a major problem in the production of lisianthus cultivars. However, few studies have investigated the influence of different Ca concentrations in nutrient solution on tipburn incidence and Ca acquisition and distribution. Thus, it remains unclear why some cultivars exhibit tipburn under high Ca concentrations. To address this, we used three lisianthus cultivars ‘Azuma-no-Kaori’ (AK), ‘Celeb Wine’ (CW), and ‘Voyage Yellow’ (VY) and compared tipburn incidence and Ca acquisition and distribution under different Ca concentrations in a nutrient solution (low (40 ppm), moderate (80 ppm), and high (120 ppm) Ca). Tipburn severity and incidence in AK and VY significantly decreased with increasing nutritional Ca concentrations; the Ca concentrations in each organ and Ca acquisition competence (RGRCa) increased at higher nutritional Ca concentrations. In contrast, tipburn incidence in CW was 100% for all treatments. In CW, Ca acquisition competence and Ca concentrations in most organs increased with increasing nutritional Ca concentrations, but the Ca concentrations in the tips of the upper leaves did not differ significantly between treatments. Thus, our results suggest that the cause of tipburn under sufficient Ca conditions is an inability of the plant to distribute Ca to the tips of its upper leaves.

1. Introduction

Lisianthus (Eustoma grandiflorum (Raf.) Shinn.) is a species in the family Gentianaceae that originated in the warm regions of the southern United States and northern Mexico. Its cultivars are mainly supplied in the form of cut flowers. The wholesale value of lisianthus cultivars ranked fifth among cut flowers in Japan in 2017. In addition, most of the lisianthus cultivars produced around the world are bred by Japanese seed companies.
The occurrence of tipburn (calcium (Ca) deficiency disorder) is a major problem for the production of lisianthus cultivars because it causes shipment delay, deterioration in plant quality, and serious economic losses. The cause of tipburn has been widely investigated in commercial crops such as lettuce [1,2,3,4,5], Chinese cabbage [6,7,8,9], strawberries [10,11,12,13], and lilies [14,15,16].
Recent studies on lisianthus cultivars have shown that tipburn is mainly caused by the inability of the plant to translocate adequate amounts of Ca to the tips of the upper leaves, which is associated with an increase in the distribution of Ca in the roots [17,18]. It has been suggested that changes in plant and organ growth rates have little effect on the incidence of tipburn in lisianthus [18]. However, few studies have compared tipburn incidence and Ca acquisition and distribution under different Ca concentrations in nutrient solution for lisianthus cultivars. Thus, it remains unclear why some lisianthus cultivars exhibit tipburn even under conditions of high Ca concentrations.
Acquisition competence of elements (e.g., calcium, carbon, nitrogen) has been quantified by applying growth analysis methods [17,18,19,20,21]. In addition, path analysis has been conducted to quantify the relevance of the relative growth rate (RGR) and its components (e.g., leaf area ratio (LAR), net assimilation rate (NAR), specific leaf area (SLA), and specific nitrogen absorption rate (SAR) in roots) in plant ecology [22,23,24,25]. Under different nutritional Ca concentrations, Ca distribution to the upper leaves seems to be affected by changes in Ca acquisition. However, no studies to date have quantified the roles of Ca acquisition and distribution under different nutritional Ca concentrations. Thus, in this study, we attempted to address this knowledge gap by applying growth and path analyses.
The aims of the present study were to elucidate the influence of different Ca concentrations in nutrient solution on tipburn incidence and Ca acquisition and distribution in three lisianthus cultivars and to discuss the causes of tipburn under high Ca concentrations. In addition, path analysis was conducted to quantify the roles of Ca acquisition and distribution.

2. Materials and Methods

2.1. Plants

The lisianthus cultivars used in this study were ‘Azuma-no-Kaori’ (AK) (Sakata Seed Corporation, Yokohama, Japan), ‘Celeb Wine’ (CW) (Sumika Agrotech Co., Ltd., Osaka City, Japan), and ‘Voyage Yellow’ (VY) (Sakata Seed Corporation), which were selected from a group classified in a previous study [17]. AK has been classified as tipburn–sensitive with high Ca requirements, and CW has been classified as tipburn-sensitive with low ability to acquire Ca and distribute it to the tips of its upper leaves; VY has been classified as tipburn-sensitive with low ability to distribute Ca to the tips of its upper leaves.
Seeds were sown in plug flats (406 cells per tray) filled with seedling propagation medium (Metro Mix 350; Sun Gro Horticulture, Agawam, MA, USA) on 17 March 2018. The seeded trays were maintained in a germination room at 24 °C under a 14 h light/10 h dark photoperiod. After two weeks, the trays were transferred to a controlled environmental system (phytotron), and the plants were grown under the following conditions: 25 °C (light period) and 20 °C (dark period), 60 ± 5% humidity, 400 ppm CO2, 14 h light (225 ± 25 µmol m−2 s−1) and 10 h dark. An irrigation system in the phytotron supplied a nutrient solution by bottom watering for 30 min at once a day. The nutrient solution was made by dissolving nutrient salts in distilled water (KNO3 (Fujifilm Wako Chemicals U.S.A. Corporation, Richmond, VA, USA): 0.202 g/L, Ca(NO3)2•4H2O (Fujifilm Wako Chemicals U.S.A. Corporation): 0.236 g/L, NH4H2PO4 (Fujifilm Wako Chemicals U.S.A. Corporation): 0.038 g/L, MgSO4•7H2O (Fujifilm Wako Chemicals U.S.A. Corporation): 0.123 g/L, Otsuka-house No.5 L (OAT Agrio Co., Ltd., Tokyo, Japan): 0.4 mL/L) and its nutrient concentrations were same as that used in previous studies [17,18,26]. Five weeks after transfer to the phytotron, plugs were transplanted into 0.25 L polyethylene pots filled with Metro Mix 350.

2.2. Experimental Design

Individuals of the three cultivars were assigned randomly to either low (40 ppm Ca), moderate (80 ppm Ca), or high Ca treatments (120 ppm Ca). Plants in the low Ca treatment were supplied with the same nutrient solution as described above. In order to minimize the influence of incremental changes in nutrients other than Ca, CaCl2 (Fujifilm Wako Chemicals U.S.A. Corporation) was added to the nutrient solution in the moderate (added CaCl2: 0.147 g/L) and high Ca treatments (added CaCl2: 0.294 g/L). Although the Cl concentrations in the nutrient solutions for these treatments (moderate: 71 ppm Cl, high: 142 ppm Cl) appear to be high, these values are lower than the reference values for raw water for nutrient solutions in Japan. The supplied nutrient solutions were replaced every two weeks. All plants were maintained in the same phytotron under the environmental conditions described above.
At the start of the experiment, five pots of each cultivar were randomly sampled in triplicate. Plant dry weights and Ca concentrations in all plant organs were measured. No tipburn was observed in any of the cultivars at that stage. Eight weeks later, a total of 15 pots (5 pots × 3 replicates) were sampled from all treatments, and the tipburn severity and incidence and Ca acquisition and distribution were investigated. Harvested plants were washed with distilled water and divided into roots, stems, and leaves to measure Ca concentrations and dry weights. In addition, to evaluate vertical Ca distribution in each cultivar, the 1st (upper), 4th (middle), and 7th (lower) leaves on the main stem (leaf position was counted from the top to the base) were distinguished.

2.3. Tipburn Severity and Incidence

Whole leaves were scored using an arbitrary tipburn severity index with ranking from 0 to 1 (0, asymptomatic; 0.2, deformed leaf margins; 0.5, leaf-tip chlorosis; 1, leaf-tip necrosis) [26]. The severity of tipburn in each plant was defined as
Tipburn severity = ∑ {(severity index × leaf number)/whole leaves number per pot} × 100
The incidence of tipburn (tipburn incidence) was expressed as the percentage of plants in a cultivar exhibiting tipburn symptoms.

2.4. Measurement of Dry Weight and Ca Concentration

Samples of plant organs were dried at 70 °C for 72 h and weighed. To evaluate morphological responses to different Ca concentrations, leaf mass ratio (LMR; leaf mass/whole-plant mass), stem mass ratio (SMR; stem mass/whole-plant mass), and root mass ratio (RMR; root mass/whole-plant mass) were calculated. Ca concentrations were determined using a Z-5300 polarized Zeeman atomic absorption spectrophotometer (Hitachi, Ltd., Tokyo, Japan). To evaluate horizontal Ca distribution for each leaf position, Ca concentrations of the top one-fifth (leaf tip) and the remainder (leaf base) of each leaf (the 1st (upper), 4th (middle), and 7th (lower) leaves) were analyzed separately. To calculate total Ca concentrations, we quantified the whole-plant Ca content by adding the Ca content (Ca concentration × dry weight) of each organ. Total Ca concentrations were calculated by dividing the whole-plant Ca content by the mass of the whole plant. Ca concentrations of whole leaves were similarly determined.

2.5. Ca acquisition Competence

The Ca acquisition competence (RGRCa) for each plant was defined as
RGRCa = (lnWCa2 − lnWCa1)/(T2 − T1)
where WCa1 and WCa2 are the whole-plant Ca content at times T1 and T2, respectively. In addition, the specific Ca absorption rate per unit root mass (SARCa) and the root mass ratio per whole-plant Ca content (RMRCa) were calculated using the following equations [17,18,19,27].
SARCa = (WCa2 − WCa1)/(T2 − T1) × (lnWR2 − lnWR1)/(WR2 − WR1)
RMRCa = (WR2/WCa2 + WR1/WCa1)/2
where WR1 and WR2 are the root dry weights at times T1 and T2, respectively.

2.6. Statistical Analysis

Data were analyzed using SPSS v.22.0 (IBM Corp. Japan, Tokyo, Japan). A one-way ANOVA (analysis of variance) was conducted to assess the effects of the treatments. Differences in mean values were evaluated using Tukey’s b (homoscedasticity assumed) or Dunnet T3 (homoscedasticity not assumed) tests. The mean values are presented. For the path analysis, SPSS Amos 25 (IBM Corp.) was used. Pathway analysis was performed on Ca concentrations in the tips of the upper (1st) and lower (7th) leaves, Ca acquisition competence (RGRCa), and its components (SARCa and RMRCa).

3. Results and Discussion

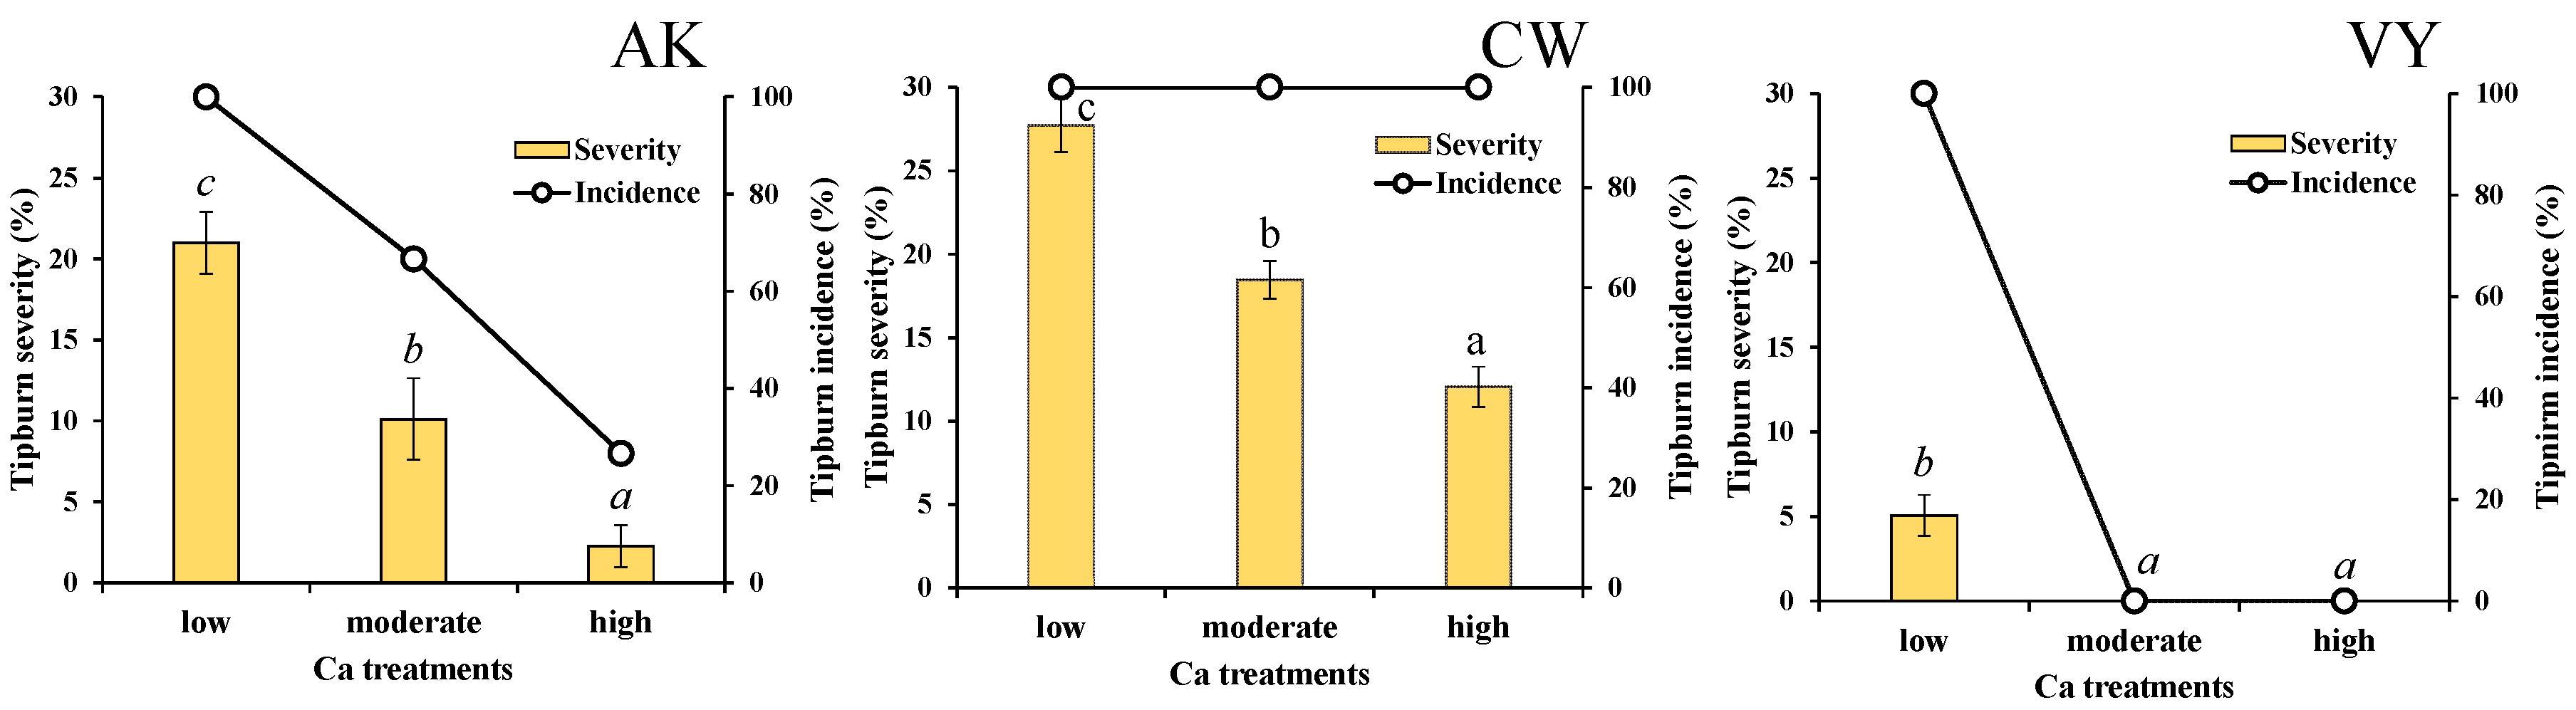
3.1. Tipburn Severity and Incidence

The tipburn severity and incidence for each cultivar and treatment are shown in Figure 1. For AK and VY, tipburn severity and incidence decreased at higher Ca concentrations. In contrast, CW exhibited tipburn in all plants (tipburn incidence = 100%) and tipburn severity was higher than 10% even in the high Ca treatment. These results indicate that Ca application is not an effective approach to eliminate tipburn in some lisianthus cultivars.

3.2. Plant Growth

Every cultivar exhibited the lowest plant dry weight and RMR in the low Ca treatment (Table 1). There were no significant differences in the LMR of any cultivar between treatments. The SMR of each cultivar tended to decrease with increasing nutritional Ca concentration.
The results for dry weight (Table 1) and tipburn severity and incidence (Figure 1) demonstrate that plant growth inhibition by tipburn occurrence was reduced at high Ca concentrations (moderate and high). Increases in RMR under high Ca concentrations can be attributed to increases in plant dry weight and water consumption of the plant. In addition, Ca and Cl excess disorder were not observed in this experiment, indicating that differences in Cl concentrations in the nutrient solution had little effect on plant growth.

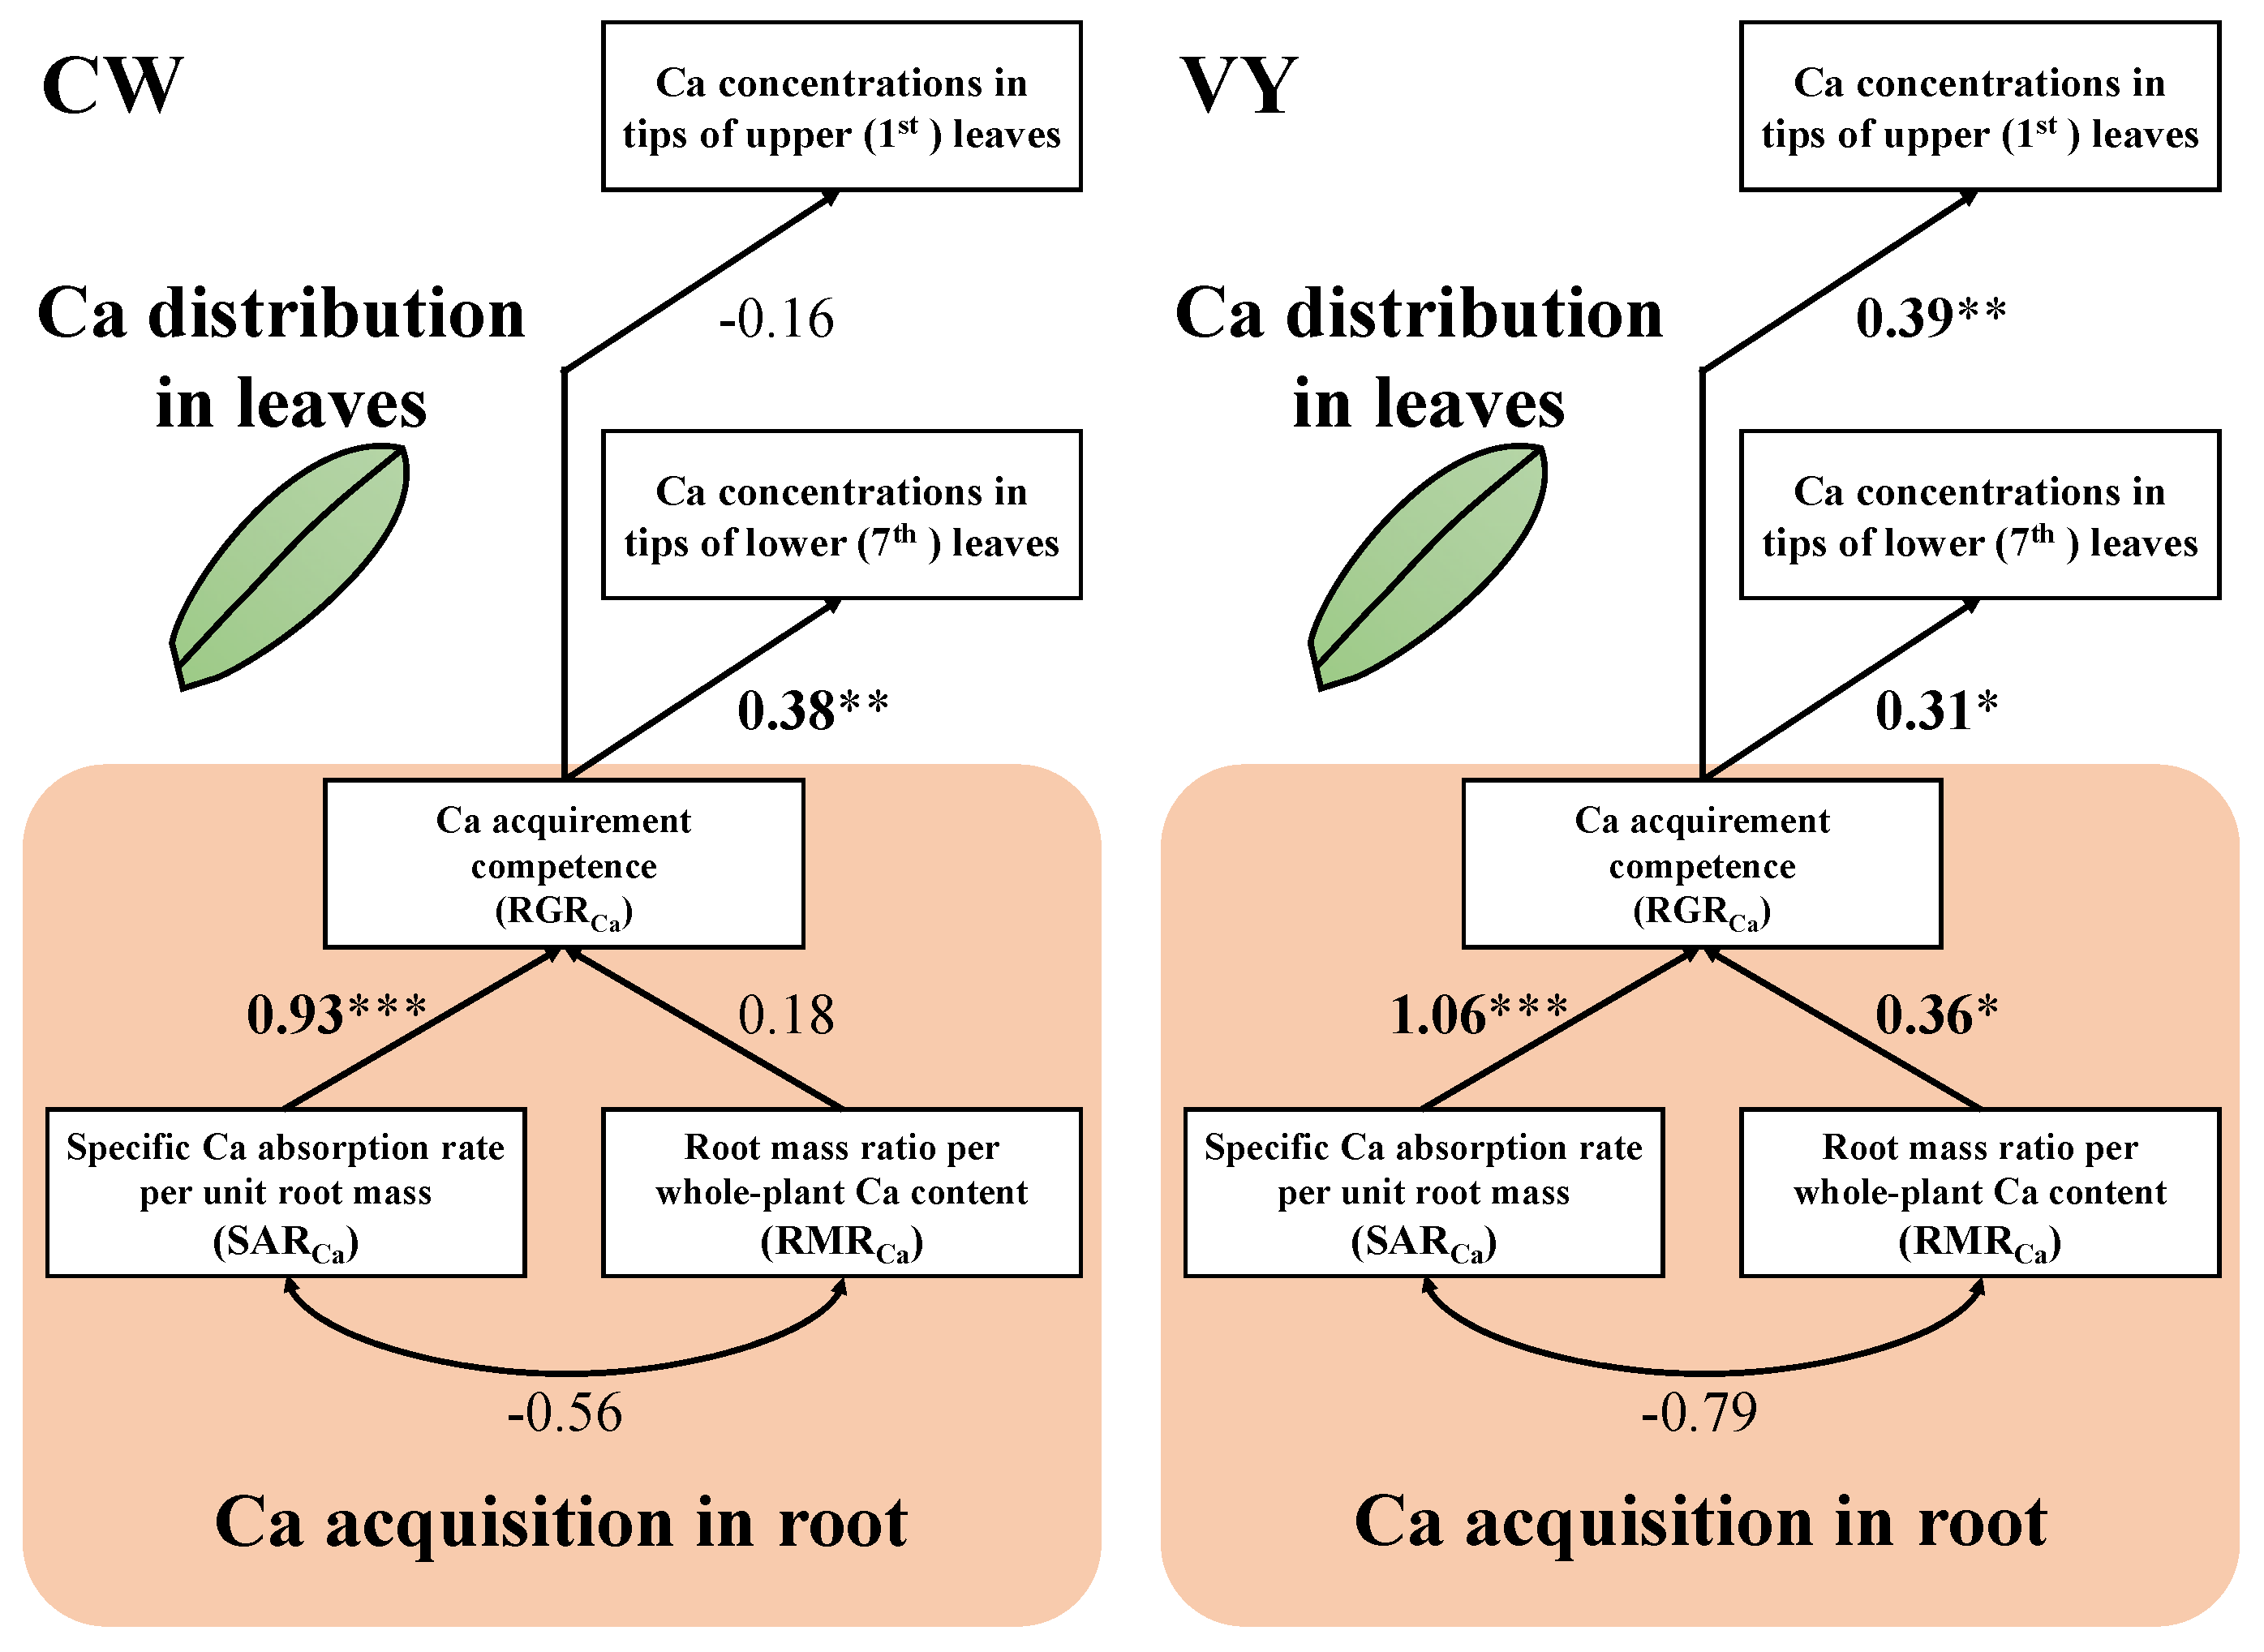
3.3. Ca Acquisition Competence

Total Ca concentration, RGRCa, SARCa, and RMRCa of each cultivar and treatment are shown in Table 2. Total Ca concentrations and RGRCa of each cultivar increased with increasing nutritional Ca concentration and there were significant differences in those values between low and high Ca treatments. The SARCa of each cultivar increased similarly to total Ca concentrations and RGRCa. In contrast, no increases in RMRCa with increasing Ca concentration were observed in any of the cultivars.
Although we hypothesized that Ca acquisition of tipburn-sensitive cultivars would not increase under high Ca concentrations, our results demonstrated that, in fact, Ca acquisition in all of the cultivars increased with increasing nutritional Ca concentration. Thus, the changes in Ca acquisition under different Ca concentrations appeared to have little effect on tipburn incidence for the lisianthus cultivars studied. In addition, Ca acquisition competence was strongly affected by a change in SARCa. This finding suggests that variation in Ca acquisition under different Ca concentrations is mainly a result of physiological responses (SARCa) rather than morphological responses (RMRCa).

3.4. Ca Distribution

3.4.1. Ca Concentrations of Whole Leaves, Stems, and Roots

The Ca concentrations of each organ for the three cultivars are shown in Table 3. Ca concentrations of all the organs in each cultivar showed a tendency to increase with increasing nutritional Ca concentration. These results were consistent with the results for RGRCa and total Ca concentrations.

3.4.2. Ca Concentrations of Upper (1st), Middle (4th), and Lower (7th) Leaves

For AK and VY—which showed lower tipburn incidence and severity with increasing nutritional Ca concentration (Figure 1)—Ca concentrations in the tips and bases of every leaf position increased at higher Ca concentrations (Table 4); similar results were seen in the other organs in AK and VY (Table 2 and Table 3). In contrast, in CW—which had a tipburn incidence of 100% under all treatments (Figure 1)—Ca concentrations in the tips of the upper (1st) and middle (4th) leaves did not differ significantly between treatments, although concentrations in the leaf bases significantly increased with increasing nutritional Ca concentration (Table 4). These results indicate that lisianthus cultivars, which exhibit high tipburn incidence and severity under high nutritional Ca concentrations, have limited ability to distribute adequate Ca to the tips of the upper leaves; this was clearly the cause of tipburn under sufficient Ca concentrations. Lee et al. [28] reported that the expression of genes encoding Ca2+ vacuole transporters in cabbage cultivars is associated with accumulation of Ca2+ in the vacuoles of leaf cells. To elucidate why tipburn-sensitive lisianthus cultivars cannot distribute adequate Ca to the tips of upper leaves, the roles of Ca distribution and gene expression should be investigated in the future. In addition, further researches on the effect of different Ca supply on tipburn incidence in the other cultivars also need.

3.5. Contributions of Ca Acquisition and Ca Distribution under Different Ca Concentrations

Path models for CW and VY were constructed for all treatments (Figure 2) and were not rejected (CW: χ2 = 2.362, p = 0.797; VY: χ2 = 6.329, p = 0.275). These path models provided a good explanation of the contributions of Ca acquisition and distribution for leaf tips (CW: GFI (goodness of fit index) = 0.979, AGFI (adjusted GFI) = 0.937, CFI (comparative fix index) = 1.000, RMSEA (root means square error of approximation) = 0.000; VY: GFI = 0.948, AGFI = 0.843, CFI = 0.986, RMSEA = 0.078). In contrast, the same path model for AK was rejected (χ2 = 29.066, p = 0.000).
Path standardized coefficients for SARCa to RGRCa of each cultivar were significant and higher than those for RMRCa to RGRCa (Figure 2), indicating that Ca acquisition competence was strongly affected by physiological responses (changes in SARCa). For VY, the path standardized coefficient for RGRCa to Ca concentrations in the tips of upper (1st) and lower (7th) leaves were significant and had similar values. In contrast, for CW, the path standardized coefficient for RGRCa to Ca concentrations in the tips of the upper (1st) leaves was not significant and was distinctively lower than that for the lower (7th) leaves. These results demonstrate that tipburn-sensitive lisianthus cultivars have limited ability to distribute adequate Ca to the tips of upper leaves, although Ca acquisition and Ca distribution to other organs increased with increasing nutritional Ca concentration. In this study, we could not construct an effective path model for all the cultivars although many attempts have been conducted. To address this, in the future, quantification of other physiological and morphological traits also needs to be discussed in more detail.

4. Conclusions

This study investigated the influence of Ca concentrations in nutrient solution on tipburn incidence and Ca acquisition and distribution in three lisianthus cultivars. At higher Ca concentrations, AK and VY exhibited significantly higher Ca acquisition competence (RGRCa) and Ca concentrations in all organs, and their tipburn severity and incidence declined. In contrast, CW exhibited 100% tipburn incidence under all treatments (Figure 1) and the Ca concentrations in the tips of the upper (1st) and middle (4th) leaves did not differ significantly between treatments although Ca acquisition competence and Ca concentrations in other organs significantly increased with increasing nutritional Ca concentrations. Thus, the cause of tipburn under sufficient Ca conditions is the inability of the plant to distribute Ca to the tips of upper leaves. In addition, path analysis enabled us to describe the roles of Ca acquisition and Ca distribution for the tips of leaves. Use of this analytical method can contribute to our understanding of the interrelationships between multiple physiological and morphological plant traits.

Author Contributions

All of the authors contributed to the work in the paper. T.K. and H.W. designed the research. T.K. wrote the paper and collected the data. H.W. and M.A. provided advice and suggestions. All authors have read and agreed to the published version of the manuscript.

Funding

This research was funded by JSPS KAKENHI Grant Number JP19K15830.

Conflicts of Interest

The authors declare no conflict of interest.

References

  1. Barta, D.J.; Tibbitts, T.W. Calcium localization in lettuce leaves with and without tipburn: Comparison of controlled-environment and field-grown plants. J. Am. Soc. Hortic. Sci. 1991, 116, 870–875. [Google Scholar] [CrossRef] [PubMed] [Green Version]
  2. Wissemeier, A.H.; Zühlke, G. Relation between climatic variables, growth and the incidence of tipburn in field-grown lettuce as evaluated by simple, partial and multiple regression analysis. Sci. Hortic. 2002, 93, 193–204. [Google Scholar] [CrossRef]
  3. Sago, Y. Effects of light intensity and growth rate on tipburn development and leaf calcium concentration in butterhead lettuce. HortScience 2016, 51, 1087–1091. [Google Scholar] [CrossRef]
  4. Uno, Y.; Okubo, H.; Itoh, H.; Koyama, R. Reduction of leaf lettuce tipburn using an indicator cultivar. Sci. Hortic. 2016, 210, 14–18. [Google Scholar] [CrossRef]
  5. Holmes, S.C.; Wells, D.E.; Pickens, J.M.; Kemble, J.M. Selection of Heat Tolerant Lettuce (Lactuca sativa L.) Cultivars Grown in Deep Water Culture and Their Marketability. Horticulturae 2019, 5, 50. [Google Scholar] [CrossRef] [Green Version]
  6. Kuo, C.G.; Tsay, J.S.; Tsai, C.L.; Chen, R.J. Tipburn of Chinese cabbage in relation to calcium nutrition and distribution. Sci. Hortic. 1981, 14, 131–138. [Google Scholar] [CrossRef]
  7. Aloni, B.; Pashkar, T.; Libel, R. The possible involvement of gibberellins and calcium in tipburn of Chinese cabbage: Study of intact plants and detached leaves. Plant Growth Regul. 1986, 4, 3–11. [Google Scholar] [CrossRef]
  8. Pressman, E.; Shaked, R.; Arcan, L. The effect of flower-inducing factors on leaf tipburn formation in Chinese cabbage. J. Plant Physiol. 1993, 141, 210–214. [Google Scholar] [CrossRef]
  9. Magnusson, M. Mineral fertilizers and green mulch in Chinese cabbage [Brassica pekinensis (Lour.) Rupr.]: Effect on nutrient uptake, yield and internal tipburn. Acta Agric. Scand. Sect. B Plant Soil Sci. 2002, 52, 25–35. [Google Scholar] [CrossRef]
  10. Mason, G.F.; Guttridge, C.G. The influence of relative humidity and nutrition on leaf tipburn of strawberry. Sci. Hortic. 1975, 3, 339–349. [Google Scholar] [CrossRef]
  11. Guttridge, C.G.; Bradfield, E.G.; Holder, R. Dependence of calcium transport into strawberry leaves on positive pressure in the xylem. Ann. Bot. 1981, 48, 473–480. [Google Scholar] [CrossRef]
  12. Bautista, A.S.; López-Galarza, S.; Martínez, A.; Pascual, B.; Maroto, J.V. Influence of cation proportions of the nutrient solution on tipburn incidence in strawberry plants. J. Plant Nutr. 2009, 32, 1527–1539. [Google Scholar] [CrossRef]
  13. Palencia, P.; Martinez, F.; Ribeiro, E.; Pestana, M.; Gama, F.; Saavedra, T.; de Varennes, A.; Correia, P.J. Relationship between tipburn and leaf mineral composition in strawberry. Sci. Hortic. 2010, 126, 242–246. [Google Scholar] [CrossRef]
  14. Chang, Y.C.; Miller, W.B. Growth and calcium partitioning in Lilium ‘Star Gazer’ in relation to leaf calcium deficiency. J. Am. Soc. Hortic. Sci. 2003, 128, 788–796. [Google Scholar] [CrossRef] [Green Version]
  15. Chang, Y.C.; Miller, W.B. The relationship between leaf enclosure, transpiration, and upper leaf necrosis on Lilium ‘Star Gazer’. J. Am. Soc. Hortic. Sci. 2004, 129, 128–133. [Google Scholar] [CrossRef] [Green Version]
  16. Chang, Y.C.; Miller, W.B. The development of upper leaf necrosis in Lilium ‘Star Gazer’. J. Am. Soc. Hortic. Sci. 2005, 130, 759–766. [Google Scholar] [CrossRef]
  17. Kuronuma, T.; Watanabe, Y.; Ando, M.; Watanabe, H. Relevance of tipburn incidence to the competence for Ca acquirement and Ca distributivity in lisianthus [Eustoma grandiflorum (Raf.) Shinn.] cultivars. Sci. Hortic. 2019, 246, 805–811. [Google Scholar] [CrossRef]
  18. Kuronuma, T.; Kinoshita, N.; Ando, M.; Watanabe, H. Difference of Ca distribution before and after the onset of tipburn in lisianthus [Eustoma grandiflorum (Raf.) Shinn.] cultivars. Sci. Hortic. 2020, 261. [Google Scholar] [CrossRef]
  19. Garnier, E. Resource capture, biomass allocation and growth in herbaceous plants. Trends Ecol. Evol. 1991, 6, 126–131. [Google Scholar] [CrossRef]
  20. Kuronuma, T.; Watanabe, H. Physiological and morphological traits and competence for carbon sequestration of several green roof plants under a controlled environmental system. J. Am. Soc. Hortic. Sci. 2016, 141, 583–590. [Google Scholar] [CrossRef] [Green Version]
  21. Kuronuma, T.; Watanabe, H. Relevance of carbon sequestration to the physiological and morphological traits of several green roof plants during the first year after construction. Am. J. Plant Sci. 2016, 8, 14–27. [Google Scholar] [CrossRef] [Green Version]
  22. Poorter, H.; Remkes, C. Leaf area ratio and net assimilation rate of 24 wild species differing in relative growth rate. Oecologia 1990, 83, 553–559. [Google Scholar] [CrossRef] [PubMed]
  23. Osone, Y.; Ishida, A.; Tateno, M. Correlation between relative growth rate and specific leaf area requires associations of specific leaf area with nitrogen absorption rate of roots. New Phytol. 2008, 179, 417–427. [Google Scholar] [CrossRef] [PubMed]
  24. Imada, S.; Yamanaka, N.; Tami, S. Contribution of root growth responses to leaf traits and relative growth rate of Populus alba under different water-table conditions. Trees 2010, 24, 1163–1172. [Google Scholar] [CrossRef]
  25. Oguchi, R.; Ozaki, H.; Hanada, K.; Hikosaka, K. Which plant trait explains the variations in relative growth rate and its response to elevated carbon dioxide concentration among Arabidopsis thaliana ecotypes derived from a variety of habitats? Oecologia 2016, 180, 865–876. [Google Scholar] [CrossRef]
  26. Kuronuma, T.; Watanabe, Y.; Ando, M.; Watanabe, H. Tipburn severity and calcium distribution in lisianthus (Eustoma Grandiflorum (Raf.) Shinn.) cultivars under different relative air humidity conditions. Agronomy 2018, 8, 218. [Google Scholar] [CrossRef] [Green Version]
  27. Hunt, R. Plant Growth Curves: The Functional Approach to Plant Growth Analysis; Edward Arnold Ltd.: London, UK, 1982. [Google Scholar]
  28. Lee, J.; Park, I.; Lee, Z.W.; Kim, S.W.; Baek, N.; Park, H.S.; Park, S.U.; Kwon, S.Y.; Kim, H. Regulation of the major vacuolar Ca2+ transporter genes, by intercellular Ca2+ concentration and abiotic stresses, in tip-burn resistant Brassica oleracea. Mol. Boil. Rep. 2013, 40, 177–188. [Google Scholar] [CrossRef]
Figure 1. Tipburn severity and incidence for three lisianthus cultivars and Ca concentration treatments at the end of the experiment. Mean values (n = 15) are shown, and significant differences among them are indicated by different letters (normal type: Tukey’s b test, p < 0.05; italic type: Dunnet T3, p < 0.05). Cultivars: ‘Azuma-no-Kaori’ (AK), ‘Celeb Wine’ (CW), ‘Voyage Yellow’ (VY).
Agronomy 10 00216 g001
Figure 2. Path model of Ca acquisition competence (RGRCa), specific absorption rate per unit. root mass (SARCa), root mass ratio per whole-plant Ca content (RMRCa), and Ca concentrations in the tips of upper (1st) and lower (7th) leaves under three different Ca treatments for ‘Celeb Wine ‘(CW) and ‘Voyage Yellow’ (VY) lisianthus cultivars. Single-arrow lines represent causal relationships and the numbers above the arrows are the standardized path coefficients. Double-arrow lines represent correlations and the numbers above the arrows are standardized correlation coefficients. The significance levels of the path effects are indicated by * p < 0.05; ** p < 0.01; *** p < 0.001.
Agronomy 10 00216 g002
Table 1. Plant dry weight, leaf mass ratio (LMR), stem mass ratio (SMR), and root mass ratio (RMR) for each cultivar and treatment at the end of the experiment.
CultivarsTreatmentsDry Weight (g)LMR (g/g)SMR (g/g)RMR (g/g)
AKlow3.7a0.56n.s.0.20c0.24a
moderate5.4b0.550.18b0.27ab
high5.0b0.550.15a0.30b
CWlow4.2a0.63n.s.0.18b0.19a
moderate5.2ab0.610.16a0.23ab
high5.9b0.590.16a0.24b
VYlow4.6a0.57n.s.0.14b0.29n.s.
moderate5.5b0.570.11a0.31
high5.4b0.570.12ab0.31
Mean values (n = 15) are shown, and significant differences among them are indicated by different letters (normal type: Tukey’s b test, p < 0.05; italic type: Dunnet T3, p < 0.05). n.s. represent no significant differences among the treatments (ANOVA, p > 0.05). Cultivars: ‘Azuma-no-Kaori’ (AK), ‘Celeb Wine’ (CW), ‘Voyage Yellow’ (VY).
Table 2. Total Ca concentrations, Ca acquisition competence (RGRCa), specific Ca absorption rate per unit root mass (SARCa), and root mass ratio per whole-plant Ca content (RMRCa) for each cultivar and treatment at the end of the experiment.
CultivarsTreatmentsTotal Ca ConcentrationsRGRCaSARCaRMRCa
(mg-Ca/kg-DW)(mg-Ca mg-Ca−1 week−1)(mg-Ca g-DW−1 week−1)(mg-Ca/g-DW)
AKlow2.7a0.59a6.1a0.11n.s.
moderate3.9b0.68b8.8b0.10
high4.4b0.69b9.1b0.10
CWlow2.7a0.60a7.4a0.10b
moderate3.8b0.67b9.7b0.09a
high4.5c’0.71b11.2c0.09a
VYlow2.7a0.66a6.4a0.10b
moderate3.8b0.73b8.7b0.09ab
high4.6c0.75b10.8c0.08a
Mean values (n = 15) are shown, and significant differences among them are indicated by different letters (normal type: Tukey’s b test, p < 0.05; italic type: Dunnet T3, p < 0.05). n.s. represent no significant differences among the treatments (ANOVA, p > 0.05). Cultivars: ‘Azuma-no-Kaori’ (AK), ‘Celeb Wine’ (CW), ‘Voyage Yellow’ (VY).
Table 3. Ca concentrations of whole leaves, upper stems, lower stems, and roots for each cultivar and treatment at the end of the experiment.
CultivarsTreatmentsCa Concentrations (mg-Ca/kg-DW)
Whole LeavesUpper StemsLower StemsRoots
AKlow1.6a0.52a0.60a6.79a
moderate2.0b0.87b0.93b9.44b
high2.2c0.96b1.11b9.81b
CWlow1.6a0.80a0.95a7.69a
moderate2.1b1.58b1.10b9.89b
high2.6c2.24c1.45b11.09c
VYlow1.0a0.75a0.65a7.02a
moderate2.2b1.19b1.00b7.51a
high2.7c1.70c1.13b9.35b
Mean values (n = 15) are shown, and significant differences among them are indicated by different letters (normal type: Tukey’s b test, p < 0.05; italic type: Dunnet T3, p < 0.05). Cultivars: ‘Azuma-no-Kaori’ (AK), ‘Celeb Wine’ (CW), ‘Voyage Yellow’ (VY).
Table 4. Ca concentrations in the tips and bases of upper (1st), middle (4th), and lower (7th) leaves for each cultivar and treatment at the end of the experiment.
CultivarsTreatmentsCa Concentrations (mg-Ca/kg-DW)
Upper (1st) LeavesMiddle (4th) LeavesLower (7th) Leaves
TipsBasesTipsBasesTipsBases
AKlow1.77a1.29a1.33a1.09a1.92a1.08a
moderate2.50b1.73b2.01b1.88b2.28b1.57b
high3.28b1.88b2.39c2.13c2.42b1.74b
CWlow2.15n.s.1.55a1.79n.s.1.77a1.63a1.43a
moderate1.852.31b1.782.68b1.77ab2.01b
high1.853.09c1.863.44c2.12b2.71c
VYlow1.52a1.36a1.75a1.51a1.81a1.37a
moderate3.52b1.90ab2.27b2.23b2.23b2.16b
high3.36b2.72b2.45b2.69c2.06b2.39b
Mean values (n = 15) are shown, and significant differences among them are indicated by different letters (normal type: Tukey’s b test, p < 0.05; italic type: Dunnet T3, p < 0.05). n.s. represent no significant differences among the treatments (ANOVA, p > 0.05). Cultivars: ‘Azuma-no-Kaori’ (AK), ‘Celeb Wine’ (CW), ‘Voyage Yellow’ (VY).

